Structural Gender Imbalances
in Ballet Collaboration Networks
Abstract
Ballet, a mainstream performing art predominantly associated with women, exhibits significant gender imbalances in leading positions. However, the collaboration’s structural composition on gender representation in the field remains unexplored. Our study investigates the gendered labor force composition and collaboration patterns in ballet creations. Our findings reveal gender disparities in ballet creations aligned with gendered collaboration patterns and women occupying more peripheral network positions respect to men. Productivity disparities show women accessing 20-25% of ballet creations compared to men. Mathematically derived perception errors show the underestimation of women artists’ representation within ballet collaboration networks, potentially impacting women’s careers in the field. Our study highlights the structural disadvantages that women face in ballet and emphasizes the need for a more inclusive and equal professional environment to improve the career development of women in the ballet industry. These insights contribute to a broader understanding of structural gender imbalances in artistic domains and can inform cultural organizations about potential affirmative actions towards a better representation of women leaders in ballet.
1 Introduction
One broadly investigated complex socioeconomic problem, is global economic inequality [1, 2, 3]. There is growing evidence that economic inequality affects artists and, more importantly, women artists, to enjoy of economic growth and access to leading positions in their careers [4, 5]. It is therefore becoming increasingly important to understand the social dynamics of gender inequalities in the arts. In specific, ballet is widely recognized and appreciated around the world, and is assumed as a women-dominated profession [6, 7]. However, recent reports show considerable gender imbalances where men specifically dominate leading positions [8].
The lack women’s representation as leaders in ballet has been widely discussed within the dance community, claiming for more equal professional opportunities [9, 10]. For example, data from American dance companies reveals the unequal representation of women (less than 40%) in artistic and executive positions [11], while the overall participation of women in the workforce is about 70% [12]. This difference of women’s representation in leadership roles raises the question of whether or not women face a ‘glass ceiling’ barrier in the ballet industry [13, 14].
In our complex society, individual characteristics —such as race, religion, education, or gender— have meaningful effects in social behaviors that shape structural disparities, which may be a result of homophily, the preference of individuals to connect with similar others [15]. Network research reveals that structural properties influence the access to information [16, 17], creativity [18], productivity [19], and career success [20]. Moreover, homophilic behaviours embedded to an imbalanced social structure can negatively affect the ranking of individuals from minority groups by enhancing segregation effects [21]. In an imbalanced social structure, individuals may inaccurately estimate the frequency of the minority group, resulting in perception errors regarding the representation of attributes in a social network [22, 23]. As a result, the importance of the minority group can be over or underestimated respect of what can be expected from the real representation in the network [24]. Since perception errors could reinforce unequal patterns in social connections, such as collaborations, understanding the role of network structure regarding gender imbalances can give an insight to an intervention of equal opportunities in professional positions.
Despite the collaborative nature of ballet creations, previous reports have primarily focused on quantifying the percentage of women and men artists involved, while the role of collaboration structures in contributing to gender imbalances in ballet remains poorly understood. The existing literature evidences that gendered variations in social network structure contribute to different professional outcomes for men and women [25], highlighting the importance of investigating the gender representation in collaborative structures. Yet, there is a lack of systematic studies exploring the representation of women and the structural properties of ballet’s professional network.
In this work, we investigate the social network structure and collaboration patterns of ballet creations. We hypothesize that, if the network structure is unbalanced by gender, the imbalanced social structure will align with unequal collaborative behaviors and the existence of perception errors, which could explain why females do not undertake or are overlooked from leading positions in this industry. This research relies on the stable collaborative structure of ballet, which has remained largely unchanged since its origins, to conduct a network analysis with scientific validity.
We construct collaboration networks from four renowned ballet companies and analyze their gender composition. The collaboration structures studied here mainly comprise a core structure of ballet creators, such as choreographers, composers, and costumes and light designers. We compare the real-world collaboration structures with randomized network models. We specifically explore the structural gendered differences and the labor force composition in highly central positions. We also measure the formation of perception errors on the women’s group to examine a possible relationship between gendered collaboration networks and perceived working environment.
To the best of our knowledge, our study is the first attempt to understand the structural gender imbalances in major ballet companies. This research will help understand the underlying social mechanisms driving gender inequalities in a highly collaborative performing art. We hope that this work will shed light for more effective interventions to reduce the segregation of women in creative careers.
2 Methods
2.1 Network of ballet creators
We construct the collaboration networks of ballet creators from four major ballet companies —the American Ballet Theatre (ABT) [26], the New York City Ballet (NYCB) [27], the National Ballet of Canada (NBC) [28], and the Royal Ballet of the Royal Opera House (ROH) [29]— based on their worldwide prestige and the availability of their historical repertoire in their website. Company data are collected using a Robotic Process Automation method for web scraping [30]. Our data collection and research methods were approved on January 18th, 2023, by the Institutional Research Ethics Committee of Universidad del Desarrollo, in Chile.
The collected data includes original ballet titles, as stated in each company’s repository, and refers to ballet works with artistic elements that remain constant across time, performances, and productions (e.g. creators, libretto, music, genre). When appropriate, ballet companies list revivals (recreated works), and/or company premieres (productions that were originally debuted at a different ballet company, but that are presented for the first time in the company listing the work).
Collaboration networks are formed from the teams of leading artists working together to create a ballet work. Teams of ballet creators are formed from each record of original ballet titles, which includes the credits of leading artists, such as principal creators (choreographer and composer) and specialized roles (librettist, costumes and lighting designer), and does not include the dancers or any other company members. In a few occasions, companies report the producer, designer (unspecified), and media editor of a ballet work, and other team structures vary in size by adding multiple collaborators for the same role (e.g. two or more composers). It is important to note that ballet is strongly recognized for its stable collaborative structure, comprising a core structure of leading artists, such as choreographer, composer, librettist, and costume and light designer. Hence, in constructing the collaboration network of ballet creators, we consider all listed artists in each ballet title as equal contributors to the ballet creation. Therefore, a ballet collaboration is defined as the creative and collective effort between choreographers, composers, costume designers, lighting designers, and other artists listed by each company, for the creation of a ballet title. For further details, please see Section S1.
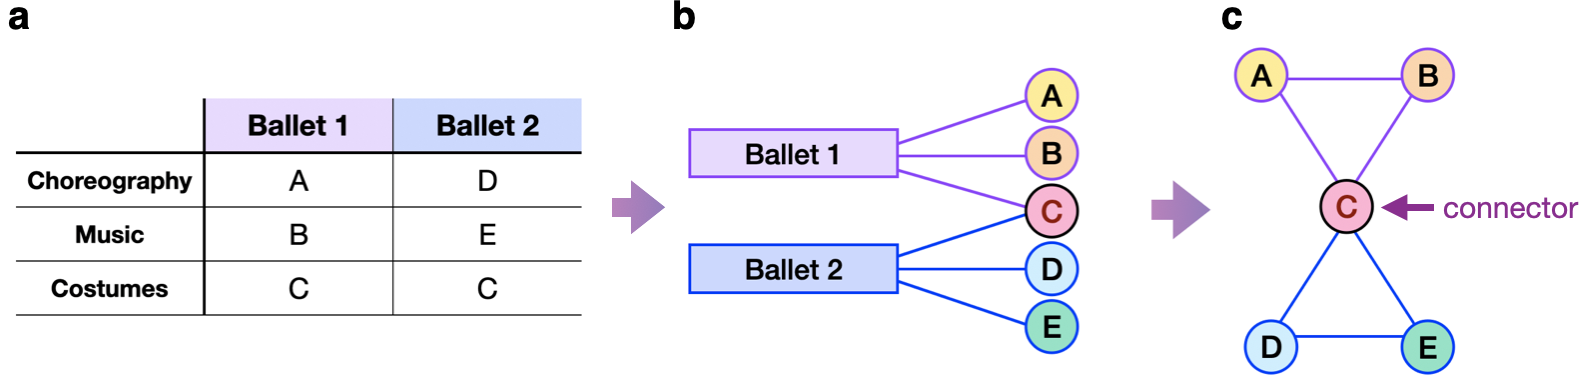
The processing of the data is as follows. In Fig. 1a there is an illustration of the data showing a list of ballet titles (as an example, ‘Ballet 1’ and ‘Ballet 2’) with the names of ballet creators (A, B, C, D, and E), and their roles (e.g. Choreography, Music, and Costumes). Then, all artists who collaborated in a ballet creation together are part of the same team. To construct the collaboration network of each company, we first build a bipartite network between ballet creations and artists, as seen in Fig. 1b, where left nodes represent ballet titles and right nodes display the artists that created a ballet title. Next, artists’ collaborations are projected to an undirected graph, as shown in Fig. 1c, where each node represents one artist, and a link between two artists denotes their collaboration in the same ballet creation. An artist who teams up in more than one ballet creation will connect multiple artists in the same company, becoming a connector in the collaboration network.
The resulting empirical networks include about 300–560 ballet works, with a range of 490–850 artists (nodes) and 1900–3100 collaborations (links). In addition, he time of reported ballet creations ranges from 1930’s to 2020’s, making the networks comparable in terms of size and longevity. Basic network properties —such as size of the giant component, average clustering coefficient [31], average shortest path [32], and small-worldness [33]— can be seen in Table 1.
| ABT | NYCB | NBC | ROH | |
| Time window | 1940-2020 | 1935-2020 | 1951-2019 | 1931-2012 |
| No. of Ballets | 491 | 560 | 349 | 449 |
| Artists (nodes) | 779 | 549 | 579 | 847 |
| Collaborations (links) | 2323 | 2202 | 1913 | 3107 |
| Average degree | 5.9641 | 8.0219 | 6.6079 | 7.3365 |
| Density | 0.0076 | 0.0146 | 0.0114 | 0.0086 |
| Clustering coefficient | 0.7556 | 0.7710 | 0.7776 | 0.8033 |
| Average Path Length | 3.52 | 2.63 | 3.60 | 3.49 |
| Small-worldness, | 97.73 | 67.57 | 75.07 | 102.99 |
| Giant Component | ||||
| Artists (as percentage) | 715 (91.78) | 643 (98.90) | 540 (93.26) | 816 (96.34) |
| Collaborations (as percentage) | 2251 (96.90) | 2195 (99.68) | 1863 (97.38) | 3071 (98.84) |
| Density | 0.0088 | 0.0149 | 0.0128 | 0.0092 |
| Diameter | 8 | 5 | 10 | 8 |
2.1.1 Gender inference
Artists’ names were processed for misspelling, middle names, and initials to distinguish artists’ identity. The names are held constant if reported across multiple companies. Then, we infer artists’ gender by using gender package for R [34, 35]. This package contains names from various countries and periods, and infer names from standardized databases (ssa, ipums, napp, and demo), making it adequate for this study since the collected data contains names of artists with diverse nationalities and were born in the 19th and 20th centuries.
To estimate an artist’s birth year, we assume that each artist was at least 20 years old when they participated in a ballet creation for the first time. Thus we subtract 20 years from the year of the first ballet production of an artist in our data as a proxy of the minimum age for a productive life in ballet. This method considers a range of 10 years ( years from the estimated birth date). Then, the gender package estimates a probability that a person would have certain gender with the name. If the probability is larger than or equal to , the corresponding gender is assigned to each artist. Here, the assigned ‘gender’ is a binary property (Woman, Man) and does not consider other gender assignments. Note that the inferred gender does not refer directly the sex of the artist nor the self-assigned gender chosen by each artist., but is used as estimate of the social construction of gender. The names which were not able to assign gender with this method were manually assigned after a web search of the artist’s identity.
2.2 Network analysis and gendered differences in centrality
We measure four network metrics to understand the importance or centrality of artists in the collaboration networks:
-
1.
Degree centrality is computed following [36] to measure the number of total connections of a node. This metric can capture the individual access to a richer social capital.
-
2.
Harmonic centrality is computed following [37], and is a variant of closeness centrality created to deal with unconnected graphs to measure the distance one node has respect to all other nodes in the network. In other words, harmonic centrality captures the position of nodes to efficiently reach distant parts of the network.
-
3.
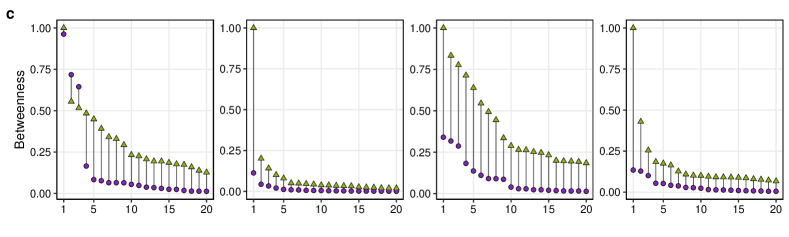
Betweenness centrality is computed considering all pair of nodes as described in [38] to measure the number of shortest paths between two pairs of nodes that pass through a node in a network. This metric captures what nodes are best intermediaries or bridges between different parts of the network.
-
4.
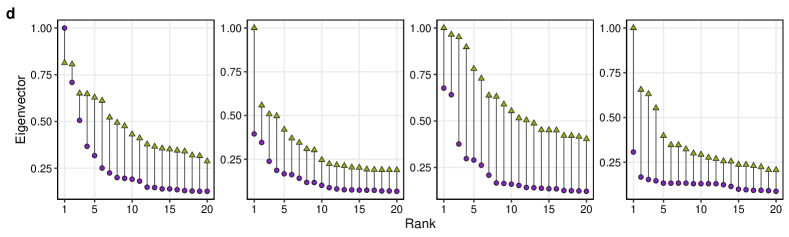
Eigenvector centrality is computed following [39] and measures the importance of a node based on the centrality of its neighboring nodes. This centrality informs about the nodes who are connected to other influential or central nodes, as these can help gain social prestige in the network.
These metrics are informative on the differential ranking of individuals embedded in the network [40]. For example, one artist with high centrality (e.g. degree) should indicate that the artist has multiple connections in the network, then being well positioned to have more access to information, social connections, and professional opportunities. In a global sense, these centrality metrics help identify structural patterns within a network, providing insights into the underlying relationships between individuals that ultimately shape the network.
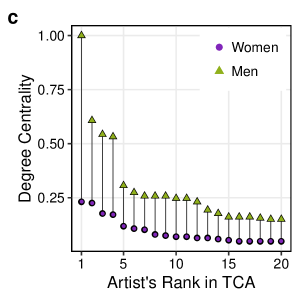
From the centrality metrics, we sort all artists by their centrality in descending order, and selected a group of top 20 artists, referred as Top-Central Artists (TCA) in this study. Let consider the ranking of centralities , where denotes a corresponding centrality value of an artist at a given rank , for , so represents the most central artist having the highest corresponding centrality (e.g. ), and will have the lowest centrality (e.g. ). We select the top 20 as this fraction captures the largest observed variation of centrality values in the empirical networks, and between and within gender groups. Then, by analyzing the TCA, we capture the artists with best connected individuals in the network and the differences in network positions across gender categories.
Next, we implement the TCA ranking to form three independent groups: the first group is for all artists in a company’s collaboration network, labeled as , and the other two groups are for a company’s artists grouped by gender, which results in two separate rankings for and . All centralities are then normalized by the maximum value of the centrality within company group (Network) and by company gender groups (Women, Men), to have a linear scaling of range. In more detail, the uses a dense rank function, which generates rank ties for observations with the same centrality values, so a variation of the total number of artists is possible if there are artists with equal centrality at each rank. For and , the tied centrality is not considered to keep an equivalent number of women and men artists (i.e. 20 artists per group).
Separately, we quantify the women ratio in each , computed as . Here, denotes an index for an artist who is in a corresponding TCA, where represents the total number of artists in a , and when an artist is woman, or for men. Then, provides the fraction of women artists who belong to the group of best connected individuals in the collaboration network of a ballet company. A numerical fraction of women artists at the network level of is assumed as a gender-balanced collaborations, and we call this situation as ‘neutral’ composition.
Further, we measure the difference in centrality between two rank-matched artists from each gender group is measured as . Here, each woman artist from is matched to their corresponding pair from . That is to say, if there is a woman artist ranked in with a centrality value of , she is at the most central position in the women’s group, and it can be written as . The counterpart of man artist, who is ranked as well in will be , if he has a centrality of . Then, . If , it means that a man artist is located on more central position than the woman counterpart.
2.2.1 Null model analysis
We compute two different null models by simulating 100 synthetic networks derived from the representation of each company’s empirical collaboration network. With the help of the null models, we remove the collaborator- or gender-preferences by shuffling collaborations (links) or artists’ attributes (gender) in the collaboration network. The overall purpose of the null models is create a baseline of randomly created networks, which would allow us to determine the absence or existence of randomness in the observed patterns respect to the empirical network.
-
(1)
Edge-shuffled model: In this model, edges are randomly rearranged in the network while preserving artists’ degrees. This means that the total number of collaborations per artists are preserved, as well as the total number of artists (nodes) in the network and artists’ gender. We use the ‘random_reference’ function of NetworkX [41]. From this shuffling, we remove the gendered correlation from empirical collaboration networks. Therefore, the resulting synthetic networks show collaboration structures when there is no gender preference.
-
(2)
Gender-shuffled model: This model shuffles the gender of artists while holding all network properties constant. Here, the empirical network structure is used as a reference, without nodes’ attributes, over which a dictionary containing the gender of all nodes is used to randomly assign artists’ gender, while preserving the real fraction of women and men in the network. In this way, artists’ network position are preserved, but their gender is randomized in each iteration. Therefore, the resultant networks display an artificial collaboration pattern without a correlation between an artist’s gender and position, as well as a gendered collaboration assortativity.
To test a null hypothesis distribution, we compute the Z-score for a distinction between the centrality values from the empirical networks and those from the null models. We denote the observed centrality by rank in the real network as , and that of the null model as . Then, the -score for any TCA group uses the centrality from the empirical network, , and the averaged centrality of 100 null models, , so that . Z-score of in the empirical network is also measured with the values of the synthetic networks as .
2.3 Perception error on women artists
To understand more about the implications of the gendered differences in the collaborative environment, we use a mathematical approach to measure the existence of perception errors based on [24]. Perception errors refer to the inaccuracy in the estimation of the frequency of an attribute —usually of a minority group— in a social network, perceived from the frequency of that attribute within the individual local network [23, 21]. In this research, perception errors are the difference in the perceived fraction of women artists from the local network, respect to the fraction in the entire network. For instance, if in the local network there are mostly women, but in the entire network there are more men, one individual will have a perception error above one that over estimates the size of the women’s group, while the opposite happens for the under-estimation of the women’s group, with a value below 1. Thus when the perception error is equal to 1, that means that the perception of the fraction of women in the network is accurate. The perception error of an individual artist is thus computed as , where denotes the local fraction of women among ’s collaborators, and refers to the real fraction of women in the network, as noted above.
Based on the individual artist’s perception error, we measure an averaged perception error by gender group at a network-level, so , where represents the total number of artists in a ballet company. Consequently, when , it means that the overall perception of women on a company is accurate on average, and when , a gender group underestimates (overestimates) the ratio of women artists on average. In addition, a gendered homophily is measured following the method in [24] to see gendered preferences of the collaboration networks.
3 Results
Based on previous reports on the lack of representation of women in leading positions in ballet [11], we explore the general composition of the collaboration networks of ballet creators and the existence of gendered collaboration patterns in the professional environment. We also look into the composition of the most central network positions and the gender gap between men and women’s centrality in the network; in addition, we measure the existence of perception errors of the women’s artists group within ballet companies. We compare network position and perception errors from the empirical network structures with two null model analyses.
3.1 Team structure and collaboration patterns
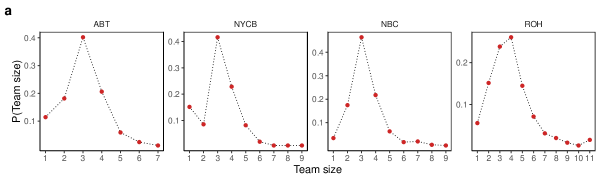
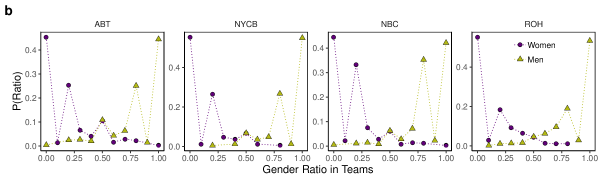
The most common team size for a ballet creation across companies is three to four (20–40%), followed by five members (20%), as shown in Fig. S1a. This evidences that teams of ballet creators are mostly formed by the typical collaborative structure of leading artists. Fig. 2a shows a sample of the representation of women in a ballet company (ROH), shows that there are about 50% of teams having 100% men artists, and less than 10% of teams have gender neutral ratio of 50%. Conversely, the majority of teams are composed with less than 50% of women artists, regardless of their sizes, and teams having 100% women artists is almost zero.
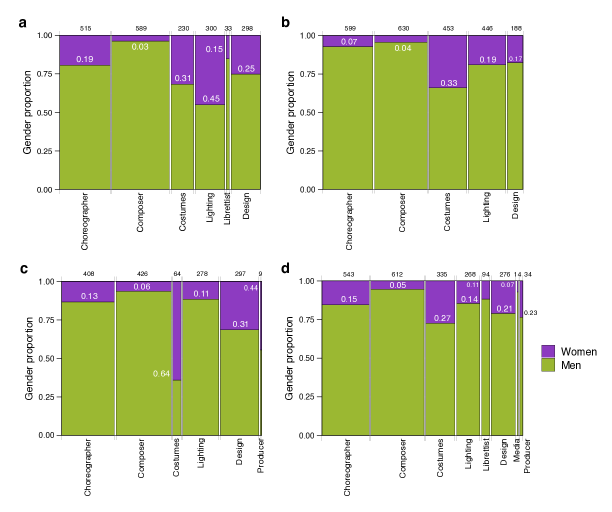
Dance communities have specifically reported an overlooking of women in choreographic leads, and our results suggest that women are less represented than men in general leading roles. Exploring the team composition by artistic role, Fig. S2 shows that the proportion of women is considerably low for Choreographer, Librettist, and Composer. Other positions such as Costumes, Lighting, and Design have a relatively larger participation of women. These results suggest variations between women and men regarding artistic roles are possible. However, because most teams of ballet creators are formed by a core structure of leading artists, here we focus on the structural representation of women at both team and network-levels, rather than an individual-artistic role level.
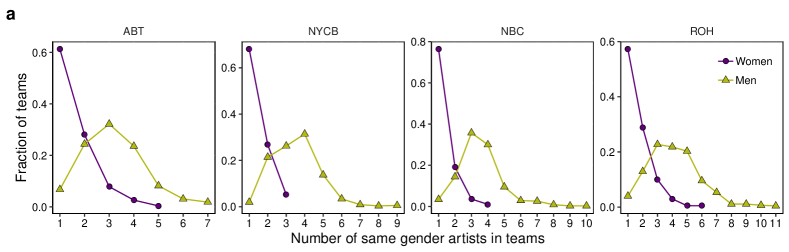
Further, in Fig. 2b we see that when women collaborate in one team, the frequency of working with other women in the same team is actually very low (). These results describe that women artists mostly work in men-dominated environments. In addition, men-alone teams are rather rare (), as they tend to collaborate with at least other three to five men () and participate in considerably larger teams than women (up to 11 men in one team, at ROH).
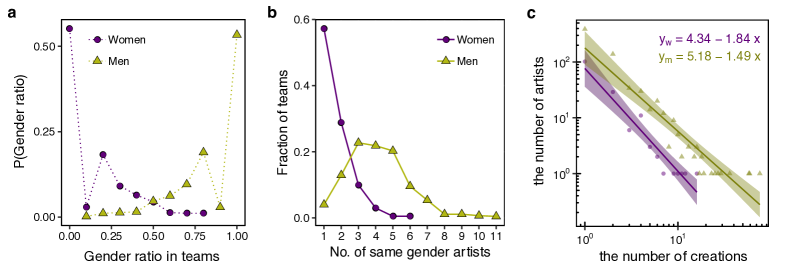
In terms of productivity, women artists are less involved in ballet creations than men artists. One ballet creation refers to the participation of an artist in a team as leading artist for the creation of a ballet work. In NYCB and ROH, the most productive woman participates in about 20-25% of the creations of the most productive man artist collaborated (ROH’s maximum collaborations: Men = 76, Women = 16; NYCB’s maximum collaborations: Men = 211, Women = 54, see Figures 2c, and S3b). For NBC, the highest productivity is a bit similar for both genders. Women artists’ highest productivity is just 86% of the most productive man (NBC’s maximum collaborations: Men=38, Women=33). Only at the ABT, the most productive woman artist exceeded in 20 collaborations to the most productive man artist (ABT’s maximum collaborations: Men=35, Women=55). Despite the exception, most women artists are less productive than their men counterparts, and the global picture for women is to work in men-dominated creative environments. Team structures, and collaboration and productivity patterns, are similar across all companies studied here (for more details and figures by company, see Section S1).
3.2 Centrality differences by gender
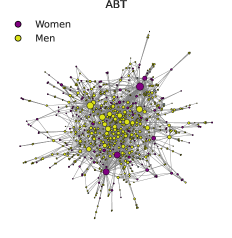
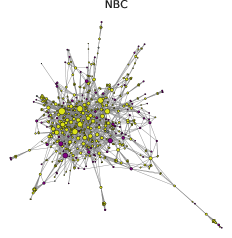
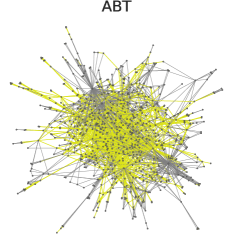
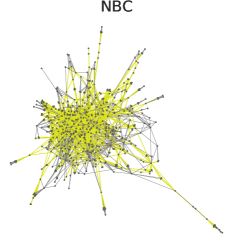
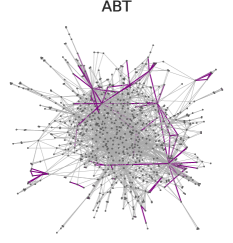
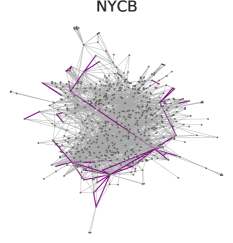
So far, we have observed a less frequent participation of women respect to men in ballet collaborations. These observations raise the question: Does the low participation of women relate to their network position in the company? To answer this question, we explore the distribution of artists’ collaborations in the network. We first compute the fraction of women in the network, , and the proportion of dyadic interactions (see Table 2), showing that most companies only have about of women in leading positions. Figure 3a shows a network sample, where men (in yellow) are not only a majority but also with higher connectivity respect to women (in purple). (See all companies’ collaboration networks in S4). Moreover, the man-man connections are more than 60% across companies (yellow links, Fig. 3b) and mixed connections are about 30% on average. On the other hand, woman-woman connections are less than 5% of the total dyadic interactions (purple links, Fig. 3c). These results inform that, for every 4 men, there is only one woman in the network, a collaborative structure in which men artists are densely co-worked with other artists regardless of gender, locating at the center of the collaboration network, while women artists are sparsely distributed in the periphery of the network.
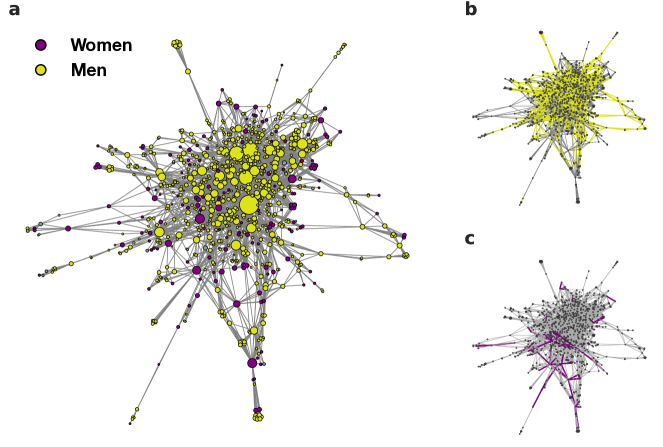
| ABT | NYCB | NBC | ROH | |
| Artists (nodes) | 779 | 549 | 579 | 847 |
| 0.22 | 0.19 | 0.18 | 0.19 | |
| Collaborations (links) | 2589 | 2317 | 1956 | 3385 |
| Woman-woman | 138 (5%) | 64 (3%) | 55 (3%) | 135 (4%) |
| Man-man | 1603 (62%) | 1576 (68%) | 1336 (68%) | 2353 (70%) |
| Mixed | 848 (33%) | 667 (29%) | 656 (29%) | 897 (26%) |
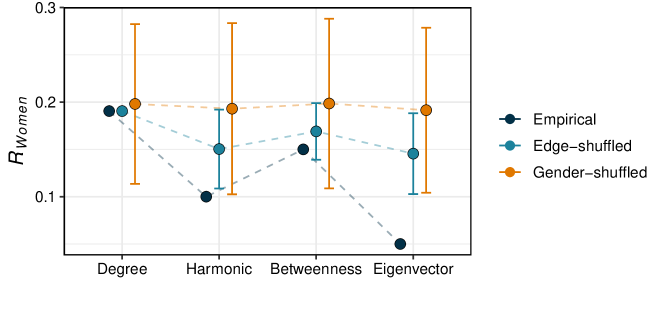
We then evaluate the proportion of women in the group of top-central artists, , by their network centrality rank, , and observe that most companies have a lower representation of women respect to in the empirical network. We observe an overall increase of in the randomized models for all centralities (see all companies in Fig. S5). For example, the Edge-shuffled model improves for harmonic centrality from to , and Gender-shuffled model raises it up to in the sample of the ROH, a fraction that matches the of the total empirical network (Fig. 4). Note that the Edge-shuffled model keeps in TCA regarding degree centrality because the number of collaborations (degree) for an artist and their inferred gender are held constant in this model. These results suggest that the low representation of women artists in ballet creations could be related to gender assortative collaborations, and the current level of women artists’ centrality is not a deterministic outcome of the small fraction of women artists in the company. That is to say, even when the fraction of women remains small in a network, women artists’ representation could be improved if more equal collaborations for women were encouraged.
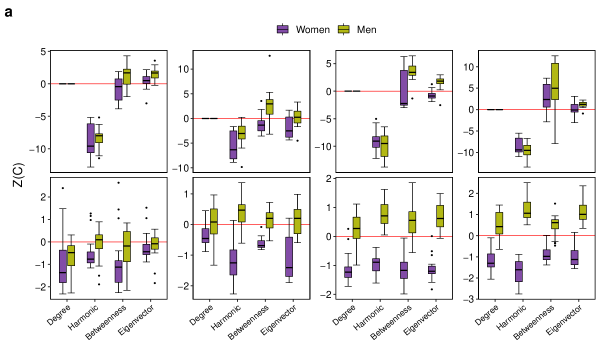
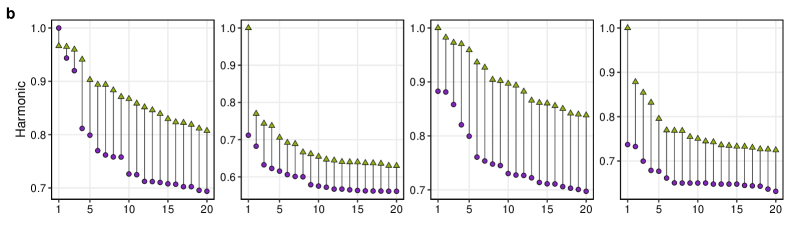
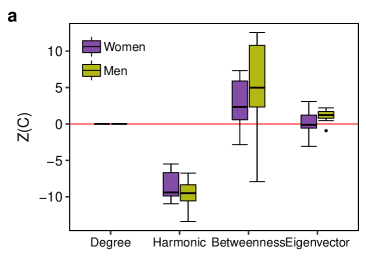
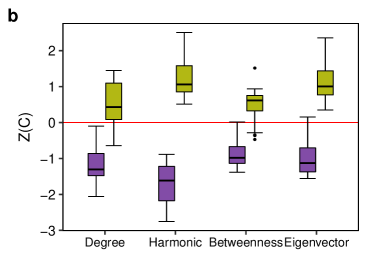
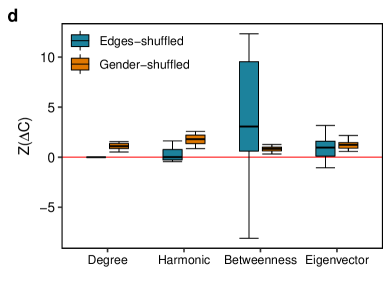
The reveals a general change in artists’ centrality with the null models (see ROH’s sample in Fig. 5, all companies in Fig. S6a). For the Edge-shuffled model, only the harmonic centrality displays a negative Z-score for both women and men (sample in Fig. S6a). Harmonic centrality denotes an extent of an artist’s closeness to other artists on average, so small value represents far distance between artists. The negative -score suggests that the distance among artists in empirical collaboration networks falls apart farther than the expected distance from the null models. In other words, the distribution of TCA in the empirical networks is more central, suggesting that TCA can more efficiently reach other artists in the network respect to the distance observed in the null models. For the Gender-shuffled model, the negative women artists’ -scores indicate that their positional importance can be improved in a synthetic network with collaboration imbalances (sample in Fig. S6b). Altogether, our results suggest that differences in centrality among TCA may not be derived by random factors, but there may be underlying systematic social behaviors limiting women artists’ collaborations and network position, regardless of their small fraction in the network.
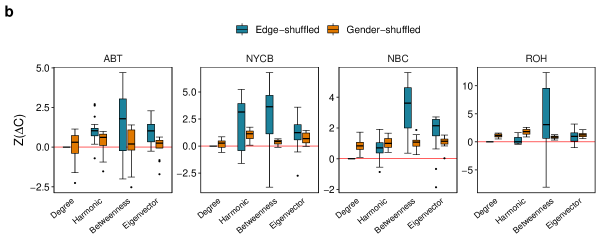
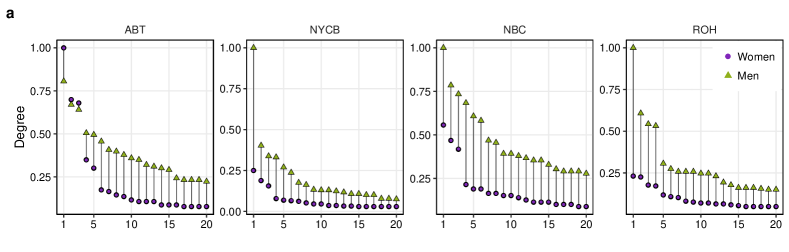
The difference in degree centrality () highlights that a man artist locates at more central position than the same-ranked women artist in her TCA group. Figure 5c shows a sample for degree centrality and reveals that the most central man is considerably more central than the most central woman. This trend of is observed across centralities with slight variations, confirming that men are considerably better positioned respect to women across companies (see gender gap in centrality for all companies in Fig. S7). Interestingly, all empirical -scores for are several standard deviations away compared to the null models (see all companies in Fig. S6b). Figure 5c illustrates the variations by null model, and showcases that a large gender gap is less likely observed when the gender preference (Edge-shuffled) and gendered productivity correlation (Gender-shuffled) are destroyed.
|
|
3.3 Perception error of women artists
Given the observed structural imbalances in the ballet collaboration networks, the low participation of women in professional collaborations could affect the perceived frequency on women artists in the entire network. Perception errors are the distorted frequency estimation of an attribute in a social network by the individual local environment [23, 21]. Here, the perception error is defined as the fraction of the observed frequency of women in an artist’s local collaboration network over the real fraction of women in the global network (see Methods). That is, the perception error denotes a relative difference of women artists in the local collaboration environment of each artist and the actual women artists’ frequency in each ballet company. From the individual-level perception error , a gender group-level error compares the average perception error for women and men. If (), it means a gender group overestimates (underestimates) the global frequency of women artist. When , it denotes an accurate perception on the women frequency (see Methods). We complement perception error with a measure of homophily.
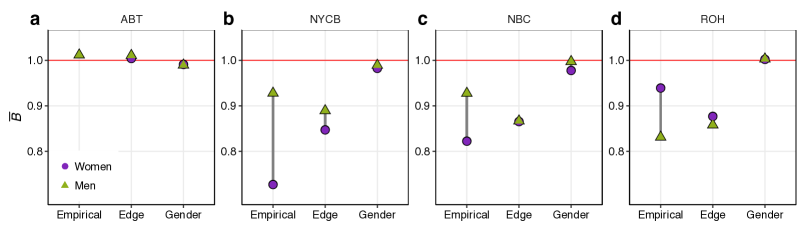
Our results show that the empirical collaboration networks of the ABT, NYCB, NBC, and ROH, the women (men) artists’ homophily is 0.56 (0.53), 0.47 (0.55), 0.45 (0.57), and 0.56 (0.63), respectively (1 is a perfect homophily, and 0 is a perfect heterophily situation). The ABT has relatively gender-mixed environment, resulting in both gender groups having relatively accurate perception on the global fraction of women artists, as shown in Fig. 6a. Conversely, the rest of the companies demonstrate a wide difference in the perception error by gender, shown in Fig. 6b–d. For instance, NYCB’s men group underestimates women artists about 7%, but their women group underestimates themselves about 27%, showing a 20% difference in the perception of women between the two groups. Such difference may be related with men artists’ strong homophily in NYCB collaborations, and women artists’ gender-heterophilic collaborations (woman-man heterophily , and woman-woman homophily ), and indicates a perceived underestimation of women artists by themselves. In ROH, women artists have a more accurate estimation of women artists respect to men artists, which aligns with their collaborative behaviors, where women artists collaborate more with other women artists than other men artists (woman-man heterophily woman-woman homophily ). Yet, the difference in perception still exists since men artists collaborate mostly with men artists (man-man homophily , man-woman heterophily ), and the assortative collaboration widens the difference in perception between gender groups.
Interestingly, the Edge-shuffled model displays a reduction in perception error difference between women and men, even though the reduction is limited. The reduction of the perception error between women and men suggests the existence of gender-preferred collaborations between gender groups. Moreover, the Gender-shuffled model not only sensibly reduces the difference in the average perception error for women and men, but also achieves a nearly accurate perception on the fraction of women artists. This strongly suggests that lowering an extent of imbalanced productivity and gendered preferences altogether boosts the representation of women artists, even considering the small representation of women artists in the company.
4 Discussion
Inequalities have been investigated for different occupations to capture the gender gap in salary and labor force composition [1]. In this context, we find that the representation of women artists in ballet creations is about 18–22%, which is lower than the reported 25% for choreographic leads [11]. These values are far below a gender-neutral ratio (, see Table 2) and are lower for highly central artists (in this study, TCA groups). In general, we find that women artists are underrepresented in the overall collaboration network and all positions as leading artists, not only as choreographers.
In addition to the numerical imbalance, our results suggest that gendered collaboration structures could potentially aggravate gender imbalances in ballet creations. Crucial roles of individual’s social network are associated with the access to information and professional opportunities in creative collaborations [42, 17, 19, 43, 18, 44]. Thus, our results increase the understanding of how gendered collaborations could impact artists’ professional experiences and the social perceptions of women as a minority group. The comparison with null network models gives a hint that the observed gender imbalances in terms of central network positions could be explained by systematic inequalities in collaborative behaviors rather than by random factors.
The social network structures, such as network position and social prestige, play an important role shaping successful careers [45, 46]. Some studies show that men and women utilize different social network structures and behavioral patterns that influence their placement in the job market [25, 47, 48]. Other studies show that the formation of a personal network and social behaviors over time are related to reinforced perception errors [49, 50]. Taken together, these studies suggest the existence of a permanent feedback for the formation of social relationships, social perception errors, and collaboration patterns, which in return, can influence individual career decisions. For women in ballet, a feedback based on a low representation within creative and men-dominated collaborations could negatively impact their decision to undertake a career as ballet creators or engaging in multiple collaborative projects. A future study in this line could provide evidence on why women in ballet experience ‘glass barrier’ in the field, and whether womens’ network position facilitates their career success and impact in the long term.
In addition, the collaboration structure can be crucial for teams [51] and individual performance [52] in terms of creativity and success [18, 53]. A study demonstrates that diversity can improve creative performance [54], and emphasizes the participation of women in collaborative environments because they increase the social sensitivity of the group, making the team collectively more intelligent and proficient [55]. In view of this, new policies for more equal collaborations and a more inclusive environment for women as leading creators should be considered in ballet companies. A more diverse inclusion would boost creative innovation and impact, which ultimately benefits the artistic community in general.
At an individual level, perception errors derived from the network structure in the workplace can affect career decisions. In specific, our results reveal that most companies experience perception errors on the fraction of women artists participating at the company. The constant underrepresentation of women could negavitely impact their visibility as a group, undermining the motivation of women artists to look for better professional opportunities. This interplay among working environment, perceived possibility of career development, and personal decisions could be a pivotal issue to alleviate the low representation of women in ballet and other industries where women are a minority.
Our measure of perception errors is a mathematical approach and can be improved, as there are multiple factors influencing the perception of a local network structure. That is to say, a local network can be described not only by its structure, but also to its embedded social mechanisms, like the strength of relationships formed over time, access to information, formal and informal norms [16, 56, 57], and individual cognitive processes and preferences [58, 59]. In addition, ballet is strongly influenced by biological constraints, such as the physical demands of the art form, including strength, flexibility, and technical requirements. These constraints, combined with the distribution of labor in family responsibilities, may be stronger for women [1] and may contribute to fewer women to overcome social barriers in the workplace and hinder the professional development of women artists in ballet.
Overall, our results help understand another dimension of gender inequalities in the ballet industry. Yet we are aware of the limitations of this work. Our data depends on the archival of the selected ballet companies, which may not be sufficient to generalize the current results to entire ballet industry. Moreover, artists may hold different types and duration of contracts within a company, which can result in variations in observed professional collaborations. To overcome this, more comprehensive digitized data collections would be needed. For instance, with the implementation of computational methods, such as deep learning and network science, it has been possible to objectively measure the impact of individual performance in creative domains [60, 61], and similar methods can open the possibility for future research on the relationship between gender, network centrality, and actual ballet creators’ impact in the field.
In summary, our research highlights the low representation of women as ballet creators and sheds light on their peripheral network position and gendered collaboration preferences within the ballet industry. This investigation can be extended to explore dynamic network factors shaping gender imbalances to propose possible and more adequate interventions for the diversity, equity, and inclusion in cultural organizations. We hope that this work brings awareness on how social phenomena and inequalities in creative domains can be systematically studied with network science and data driven methods.
Data availability
The data used in this study is available under reasonable request.
Abbreviations
ABT, American Ballet Theatre; NBC, National Ballet of Canada; NYCB, New York City Ballet; ROH, Royal Ballet of the Royal Opera House; TCA, Top-Central Artists.
Availability of data and materials
The data analyzed during the current study are available from the corresponding author on reasonable request.
Competing interests
The authors declare that they have no competing interests.
Funding
This work was supported by the National Research Foundation of Korea (NRF) grant funded by the Korea government (MSIT) (No.NRF-2022R1C1C1005856), the National Agency of Investigation and Development, ANID, through the grant FONDECYT No. 11190096, the KENTECH Research Grant(KRG 2021-01-003), and the Pukyong National University Research Fund in 2022(202203530001).
Author’s contributions
All authors contributed to the research design and writing of the paper. YHG contributed with art-specific knowledge, constructed the data and networks, developed and performed the models, analyzed the data, and performed data visualizations; EL was mainly responsible for the measurement of perception errors and homophily; and HK contributed to data construction and network analysis. EL and HK supervised the research. All authors discussed the results and contributed to writing the manuscript. All authors read and approved the final manuscript.
Acknowledgements
YHG acknowledges the Centro de Investigación en Complejidad at Universidad del Desarrollo, Chile, for the financial support to conduct this research.
References
- [1] Gary S Becker “Human capital, effort, and the sexual division of labor” In Journal of labor economics 3.1, Part 2 University of Chicago Press, 1985, pp. S33–S58 URL: https://www.jstor.org/stable/2534997
- [2] Anthony B Atkinson “Inequality: What can be done?” Harvard University Press, 2015
- [3] Thomas Piketty “About capital in the twenty-first century” In American Economic Review 105.5, 2015, pp. 48–53 DOI: 10.4159/9780674982918
- [4] Chad M Topaz et al. “Diversity of artists in major US museums” In PloS one 14.3 Public Library of Science, 2019, pp. e0212852 DOI: 10.1371/journal.pone.0212852
- [5] Danielle J Lindemann, Carly A Rush and Steven J Tepper “An asymmetrical portrait: Exploring gendered income inequality in the arts” In Social Currents 3.4 Sage Publications Sage CA: Los Angeles, CA, 2016, pp. 332–348 DOI: 10.1177/2329496516636399
- [6] Ann Daly “The Balanchine woman: Of hummingbirds and channel swimmers” In The drama review: TDR 31.1 JSTOR, 1987, pp. 8–21 DOI: 10.2307/1145763
- [7] Jennifer Homans “Apollo’s angels: A history of ballet” Random House Publishing Group, 2010
- [8] Lisa DeFrank-Cole and Renee K Nicholson “The slow-changing face of leadership in ballet: an interdisciplinary approach to analysing women’s roles” In Leadership and the Humanities 4.2 Edward Elgar Publishing Ltd, 2016, pp. 73–91 DOI: 10.4337/lath.2016.02.01
- [9] Kim Elsesser “A Gender Gap In Ballet, Seriously?”, 2019 URL: https://www.forbes.com/sites/kimelsesser/2019/09/12/a-gender-gap-in-ballet-seriously/
- [10] Elizabeth Yntema “The ballet world is still male-dominated, research shows”, 2019 URL: https://www.womensmediacenter.com/news-features/the-ballet-world-is-still-male-dominated-research-shows
- [11] “Dance Data Project”, 2015 URL: www.dancedataproject.com
- [12] “United States Census Bureau”, 2021 URL: https://www.census.gov/data.html
- [13] David A Cotter, Joan M Hermsen, Seth Ovadia and Reeve Vanneman “The glass ceiling effect” In Social forces 80.2 Oxford University Press, 2001, pp. 655–681 DOI: 10.1353/sof.2001.0091
- [14] Christine L Williams “The glass escalator: Hidden advantages for men in non traditional occupations” In Social Problems 39, 1992, pp. 253–267 DOI: 10.2307/3096961
- [15] Miller McPherson, Lynn Smith-Lovin and James M Cook “Birds of a feather: Homophily in social networks” In Annual Review of Sociology 27.1 Annual Reviews 4139 El Camino Way, PO Box 10139, Palo Alto, CA 94303-0139, USA, 2001, pp. 415–444 DOI: 10.1146/annurev.soc.27.1.415
- [16] Mark S Granovetter “The strength of weak ties” In American Journal of Sociology 78.6 University of Chicago Press, 1973, pp. 1360–1380 URL: https://www.jstor.org/stable/2776392
- [17] Raj Kumar Pan and Jari Saramäki “The strength of strong ties in scientific collaboration networks” In EPL (Europhysics Letters) 97.1 IOP Publishing, 2012, pp. 18007 DOI: 10.1209/0295-5075/97/18007
- [18] Brian Uzzi and Jarrett Spiro “Collaboration and Creativity: The Small World Problem” In American Journal of Sociology 111.2, 2005, pp. 447–504 DOI: 10.1086/432782
- [19] Alireza Abbasi, Kon Shing Kenneth Chung and Liaquat Hossain “Egocentric analysis of co-authorship network structure, position and performance” In Information Processing & Management 48.4 Elsevier, 2012, pp. 671–679 DOI: 10.1016/j.ipm.2011.09.001
- [20] Sándor Juhász, Gergő Tóth and Balázs Lengyel “Brokering the core and the periphery: Creative success and collaboration networks in the film industry” In PloS one 15.2 Public Library of Science San Francisco, CA USA, 2020, pp. e0229436 DOI: 10.1371/journal.pone.0229436
- [21] Fariba Karimi et al. “Homophily influences ranking of minorities in social networks” In Scientific Reports 8.1 Nature Publishing Group, 2018, pp. 1–12 DOI: 10.1038/s41598-018-29405-7
- [22] Leon Festinger “A theory of social comparison processes” In Human Relations 7.2 Sage Publications Sage CA: Thousand Oaks, CA, 1954, pp. 117–140 DOI: 10.1177/001872675400700202
- [23] Kristina Lerman, Xiaoran Yan and Xin-Zeng Wu “The ‘Majority Illusion’ in Social Networks” In PLoS One 11.2, 2016, pp. e0147617 DOI: 10.1371/journal.pone.0147617
- [24] Eun Lee et al. “Homophily and minority-group size explain perception biases in social networks” In Nature human behaviour 3.10 Nature Publishing Group, 2019, pp. 1078–1087 DOI: 10.1038/s41562-019-0677-4
- [25] Yang Yang, Nitesh V Chawla and Brian Uzzi “A network’s gender composition and communication pattern predict women’s leadership success” In Proceedings of the National Academy of Sciences 116.6 National Acad Sciences, 2019, pp. 2033–2038 DOI: 10.1073/pnas.1721438116
- [26] “American Ballet Theatre, Ballet Archive” URL: https://www.abt.org/explore/learn/repertory-archive/ballets/
- [27] “New York City Ballet, The Repertory” URL: https://www.nycballet.com/discover/ballet-repertory
- [28] “The National Ballet of Canada Archives, Repertoire List” URL: https://national.ballet.ca/Tickets/Archives/Repertoire-List
- [29] “Royal Opera House Collections” URL: http://rohcollections.org.uk
- [30] Wil MP Van der Aalst, Martin Bichler and Armin Heinzl “Robotic Process Automation” Springer, 2018 DOI: 10.1007/s12599-018-0542-4
- [31] Duncan J Watts and Steven H Strogatz “Collective dynamics of ‘small-world’ networks” In nature 393.6684 Nature Publishing Group, 1998, pp. 440–442 DOI: 10.1038/30918
- [32] Fei Chen, Zengqiang Chen, Xiufeng Wang and Zhuzhi Yuan “The average path length of scale free networks” In Communications in Nonlinear Science and numerical simulation 13.7 Elsevier, 2008, pp. 1405–1410 DOI: 10.1016/j.cnsns.2006.12.003
- [33] Mark D Humphries and Kevin Gurney “Network ‘small-world-ness’: a quantitative method for determining canonical network equivalence” In PloS One 3.4 Public Library of Science, 2008, pp. e0002051 DOI: 10.1371/journal.pone.0002051
- [34] Fariba Karimi et al. “Inferring gender from names on the web: A comparative evaluation of gender detection methods” In Proceedings of the 25th International conference companion on World Wide Web, 2016, pp. 53–54 DOI: 10.1145/2872518.2889385
- [35] Cameron Blevins and Lincoln Mullen “Jane, John… Leslie? A Historical Method for Algorithmic Gender Prediction.” R package version 0.6.0 In DHQ: Digital Humanities Quarterly 9.3, 2015 URL: https://github.com/lmullen/gender
- [36] Linton C Freeman “Centrality in Social Networks: I. Conceptual Clarification” In Social Networks 1.3 North-Holland, 1978, pp. 215–239 DOI: 10.1016/0378-8733(78)90021-7
- [37] Paolo Boldi and Sebastiano Vigna “Axioms for centrality” In Internet Mathematics 10.3-4 Taylor & Francis, 2014, pp. 222–262 DOI: 10.1080/15427951.2013.865686
- [38] Linton C Freeman “A set of measures of centrality based on betweenness” In Sociometry JSTOR, 1977, pp. 35–41 DOI: 10.2307/3033543
- [39] Phillip Bonacich “Some unique properties of eigenvector centrality” In Social Networks 29.4 Elsevier, 2007, pp. 555–564 DOI: 10.1016/j.socnet.2007.04.002
- [40] Stanley Wasserman and Katherine Faust “Social network analysis: Methods and applications”, Structural Analysis in the Social Sciences Cambridge University Press, 1994 DOI: 10.1017/CBO9780511815478
- [41] Sergei Maslov and Kim Sneppen “Specificity and stability in topology of protein networks” In Science 296.5569 American Association for the Advancement of Science, 2002, pp. 910–913 DOI: 10.1126/science.1065103
- [42] R Duncan Luce “Connectivity and generalized cliques in sociometric group structure” In Psychometrika 15.2 Springer, 1950, pp. 169–190 DOI: 10.1007/BF02289199
- [43] Mohsen Jamali and Hassan Abolhassani “Different aspects of social network analysis” In 2006 IEEE/WIC/ACM International Conference on Web Intelligence (WI 2006 Main Conference Proceedings)(WI’06), 2006, pp. 66–72 IEEE DOI: 10.1109/WI.2006.61
- [44] Austin J Parish, Kevin W Boyack and John PA Ioannidis “Dynamics of co-authorship and productivity across different fields of scientific research” In PloS One 13.1 Public Library of Science San Francisco, CA USA, 2018, pp. e0189742 DOI: 10.1371/journal.pone.0189742
- [45] Samuel P. Fraiberger et al. “Quantifying reputation and success in art” In Science 362.6416, 2018, pp. 825–829 DOI: 10.1126/science.aau7224
- [46] Milán Janosov, Federico Battiston and Roberta Sinatra “Success and luck in creative careers” In EPJ Data Science 9.1 Springer Berlin Heidelberg, 2020, pp. 9 DOI: 10.1140/epjds/s13688-020-00227-w
- [47] Orsolya Vasarhelyi and Balazs Vedres “Gender Typicality of Behavior Predicts Success on Creative Platforms” In arXiv preprint arXiv:2103.01093, 2021 DOI: 10.48550/arXiv.2103.01093
- [48] Jasmine Tata and Sameer Prasad “Social capital, collaborative exchange and microenterprise performance: The role of gender” In International Journal of Entrepreneurship and Small Business 5.3-4 Inderscience Publishers, 2008, pp. 373–388 DOI: 10.1504/IJESB.2008.01731
- [49] Matthew O Jackson “Networks in the understanding of economic behaviors” In Journal of Economic Perspectives 28.4, 2014, pp. 3–22 DOI: 10.1257/jep.28.4.3
- [50] Güneş Ertan, Michael D Siciliano and Deniz Yenigün “Perception accuracy, biases and path dependency in longitudinal social networks” In PloS One 14.6 Public Library of Science San Francisco, CA USA, 2019, pp. e0218607 DOI: 10.1371/journal.pone.0218607
- [51] S Gayle Baugh and George B Graen “Effects of team gender and racial composition on perceptions of team performance in cross-functional teams” In Group & Organization Management 22.3 Sage Publications Sage CA: Thousand Oaks, CA, 1997, pp. 366–383 DOI: 10.1177/1059601197223004
- [52] Leonard Karakowsky, Kenneth McBey and You-Ta Chuang “Perceptions of team performance: The impact of group composition and task-based cues” In Journal of Managerial Psychology Emerald Group Publishing Limited, 2004 DOI: 10.1108/02683940410543597
- [53] Yang Yang et al. “Gender-diverse teams produce more novel and higher-impact scientific ideas” In Proceedings of the National Academy of Sciences 119.36, 2022, pp. e2200841119 DOI: 10.1073/pnas.2200841119
- [54] Barton H Hamilton, Jack A Nickerson and Hideo Owan “Team incentives and worker heterogeneity: An empirical analysis of the impact of teams on productivity and participation” In Journal of Political Economy 111.3 The University of Chicago Press, 2003, pp. 465–497 URL: https://www.jstor.org/stable/10.1086/374182
- [55] Anita Williams Woolley et al. “Evidence for a collective intelligence factor in the performance of human groups” In Science 330.6004 American Association for the Advancement of Science, 2010, pp. 686–688 DOI: 10.1126/science.1193147
- [56] Mark Granovetter “Economic action and social structure: The problem of embeddedness” In American Journal of Sociology 91.3 University of Chicago Press, 1985, pp. 481–510 URL: https://www.jstor.org/stable/2780199
- [57] James S Coleman “Foundations of Social Theory” Harvard University Press, 1994 DOI: 10.2307/2579680
- [58] Paul F Lazarsfeld and Robert K Merton “Friendship as a social process: A substantive and methodological analysis” In Freedom and Control in Modern Society 18.1 New York, Van Nostrand, 1954, pp. 18–66
- [59] Thorsten Pachur, Ralph Hertwig and Jörg Rieskamp “Intuitive judgments of social statistics: How exhaustive does sampling need to be?” In Journal of Experimental Social Psychology 49.6 Elsevier, 2013, pp. 1059–1077 DOI: 10.1016/j.jesp.2013.07.004
- [60] Lu Liu et al. “Hot streaks in artistic, cultural, and scientific careers” In Nature 559.7714 Nature Publishing Group, 2018, pp. 396–399 DOI: 10.1038/s41586-018-0315-8
- [61] Lu Liu et al. “Understanding the onset of hot streaks across artistic, cultural, and scientific careers” In Nature communications 12.1 Nature Publishing Group, 2021, pp. 1–10 DOI: 10.1038/s41467-021-25477-8
Supplementary Information for
Structural Gender Imbalances
in Ballet Collaboration Networks
Yessica Herrera-Guzmán, Eun Lee, Heetae Kim
*Corresponding Author. Email: hkim@kentech.ac.kr
This file includes:
Supplementary Text
Figures S1 to S7
S1 Ballet collaborations
We define a ballet collaboration as the creative effort between choreographers, composers, costume designers, lighting designers, and other artists listed by each company, for the creation of a ballet work. In practice, other types of ballet collaborations are possible, such as those that put the ballet work on stage and are involved in the development of a production (e.g. production managers, technicians, theatre staff). Also, some ballet creations require the direct collaboration of the choreographers with the ballet dancers. Due to limited access to company data, we only consider the artistic roles as defined in a ballet collaboration.

S2 Centrality differences by gender and null models analyses
-
(a)
Degree distribution.
|
 |
 |
|---|
-
(b)
Network position of man-man collaborations.
 |
 |
 |
-
(c)
Network position of woman-woman collaborations.
 |
 |
 |