Fairness Index Measures to Evaluate Bias in Biometric Recognition
Idiap Research Institute, Switzerland
ketan.kotwal@idiap.ch
&Sébastien Marcel
Idiap Research Institute, Switzerland
University of Lausanne, Switzerland
sebastien.marcel@idiap.ch
Abstract
The demographic disparity of biometric systems has led to serious concerns regarding their societal impact as well as applicability of such systems in private and public domains. A quantitative evaluation of demographic fairness is an important step towards understanding, assessment, and mitigation of demographic bias in biometric applications. While few, existing fairness measures are based on post-decision data (such as verification accuracy) of biometric systems, we discuss how pre-decision data (score distributions) provide useful insights towards demographic fairness. In this paper, we introduce multiple measures, based on the statistical characteristics of score distributions, for the evaluation of demographic fairness of a generic biometric verification system. We also propose different variants for each fairness measure depending on how the contribution from constituent demographic groups needs to be combined towards the final measure. In each case, the behavior of the measure has been illustrated numerically and graphically on synthetic data. The demographic imbalance in benchmarking datasets is often overlooked during fairness assessment. We provide a novel weighing strategy to reduce the effect of such imbalance through a non-linear function of sample sizes of demographic groups. The proposed measures are independent of the biometric modality, and thus, applicable across commonly used biometric modalities (e.g., face, fingerprint, etc.).
Keywords Biometrics Demographic Fairness Fairness Evaluation.
1 Introduction
In recent years, algorithmic bias and fairness have emerged as noteworthy challenges for automated biometric systems [1, 2, 3, 4, 5]. A biometric system or algorithm is considered to be biased if significant differences in its operation can be observed for different demographic groups of individuals [3]. With growing adoption of various biometric applications, the non-equitable performance of such applications across demographic groups has led to several discussions and debates [6, 7, 8]. Several institutions have conducted evaluations (w.r.t demographic bias) of popular biometric applications, such as face recognition, developed by commercial vendors [4, 5, 9, 10]. On academic front as well, the research in understanding, estimating, and mitigating demographic bias is gaining significant traction [1, 3, 11, 12].
As the issue of fairness in biometric systems has received attention lately, very few attempts have been made to define fairness measures for generic and/or specific biometric applications. As per Howard et al. [2], the fairness of biometric system can be measured using two approaches: differential performance and differential outcome. The former approach refers to the difference in the genuine or imposter distributions between specific demographic groups for a given biometric task, whereas the latter deals with differences in classification error rates among demographic groups. The differential performance is, thus, independent of any classification threshold, while the differential outcomes are functions of a chosen threshold that binarizes scores into match or no-match.
A recently proposed fairness measure- Fairness Discrepancy Rate (FDR)- is based on the differential outcome of biometric verification systems [13]. To compute the FDR, authors first assess the maximum discrepancy in the false match rate (FMR) and false non-match rate (FNMR) of different demographic groups for several score thresholds. The fairness of the system is evaluated through a weighted combination of these maximum discrepancies. The FDR has also been adapted to measure the fairness in detection of face morphing attacks in [14]. Gong et al. have considered the area under the ROC (Receiver Operating Characteristic) curve as a proxy to measure demographic differentials [15]. In its special report on demographic effects in face recognition [4], the Face Recognition Vendor Test (FRVT) has employed differential outcome-based strategy where they discuss the impact FMR and FNMR using a global threshold. A demographic-specific score thresholding has been analyzed in [10].
Majority of the existing work in evaluating the fairness or demographic equitability of the biometric system is based on the differential outcome. These measures are easy to calculate, based on well-established error rates, and treat the biometric system as a complete black box. The assessment of demographic fairness of biometric system based on differential performance has received little attention. The use of distributions of genuine and imposter scores of a biometric recognition system towards evaluation of its demographic fairness has several advantages: first, the measures based on differential outcome evaluate fairness of the system entirely from the (number of) samples causing incorrect decisions. While these extremal samples signify the accuracy of the biometric system, we believe that the demographic fairness needs to be evaluated across all samples, irrespective of their recognition outcome. The use of differential performance (score distributions) facilitates consideration of entire sample set towards fairness assessment. Second, the incorrect decisions (characterized by FMR and FNMR) are dependent on a score threshold. This variable is either fixed or computed from probably different set of data. In the former case, one has to evaluate fairness at multiple score thresholds to interpret the equitability of the biometric system. In the latter case, the score threshold is sensitive to, and hence, impacted by the distribution of unseen, disjoint set of data (and underlying demographic) [16]. The measures based on score distributions do not involve such threshold, and thus, can be computed without interference of such external parameters. Third, the score threshold, being external, is often easy to tune as per the need of the application. The fairness measures based on differential performance are agnostic to such tuning, and represent the fairness of underlying core mechanism of the biometric system.
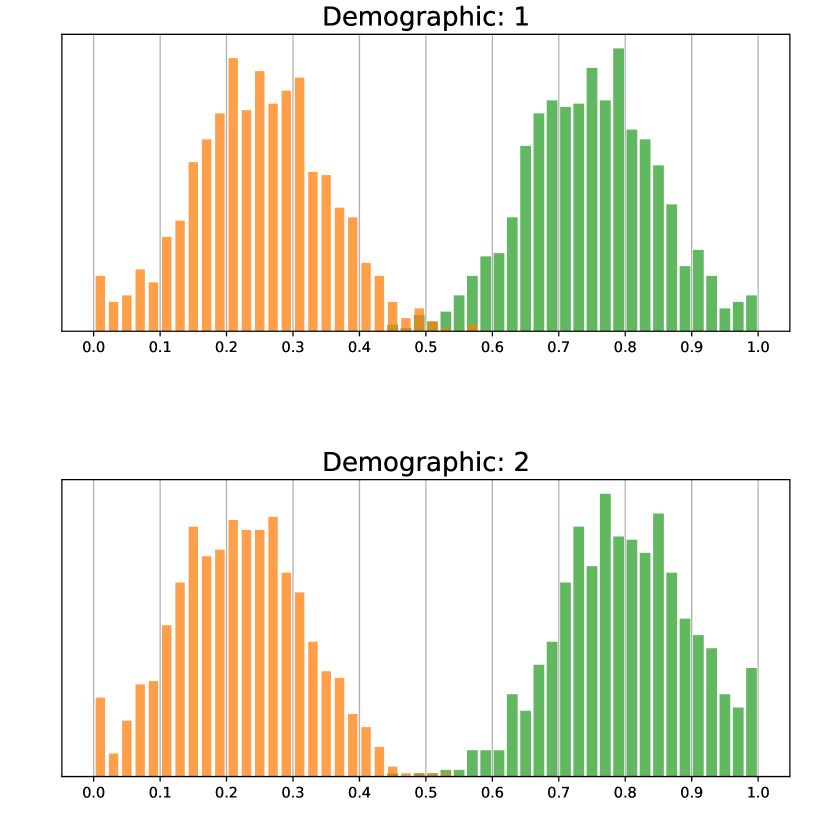
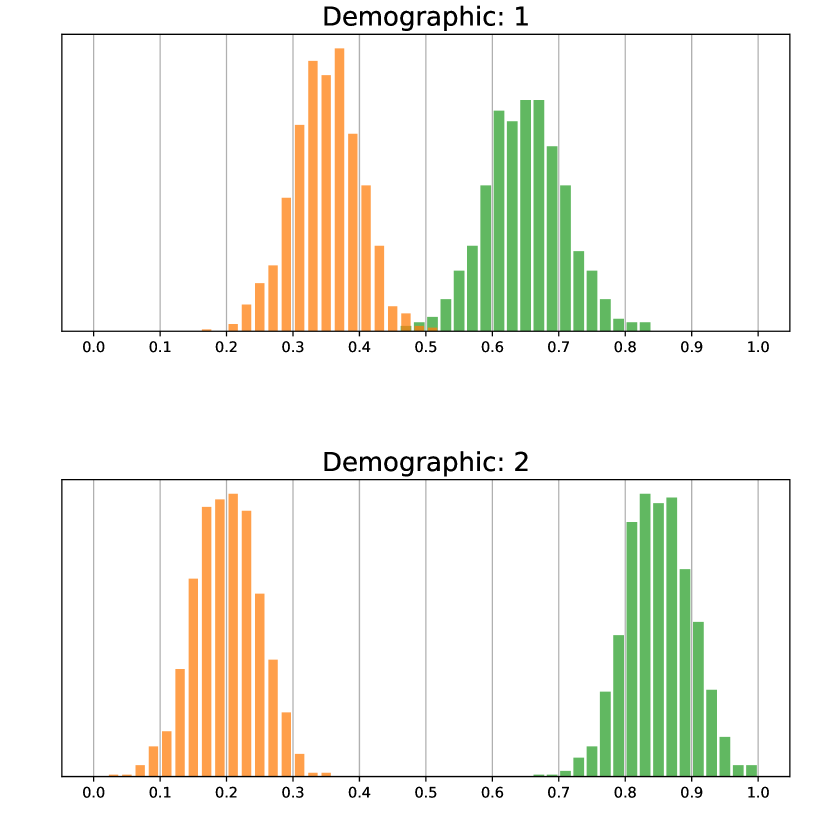
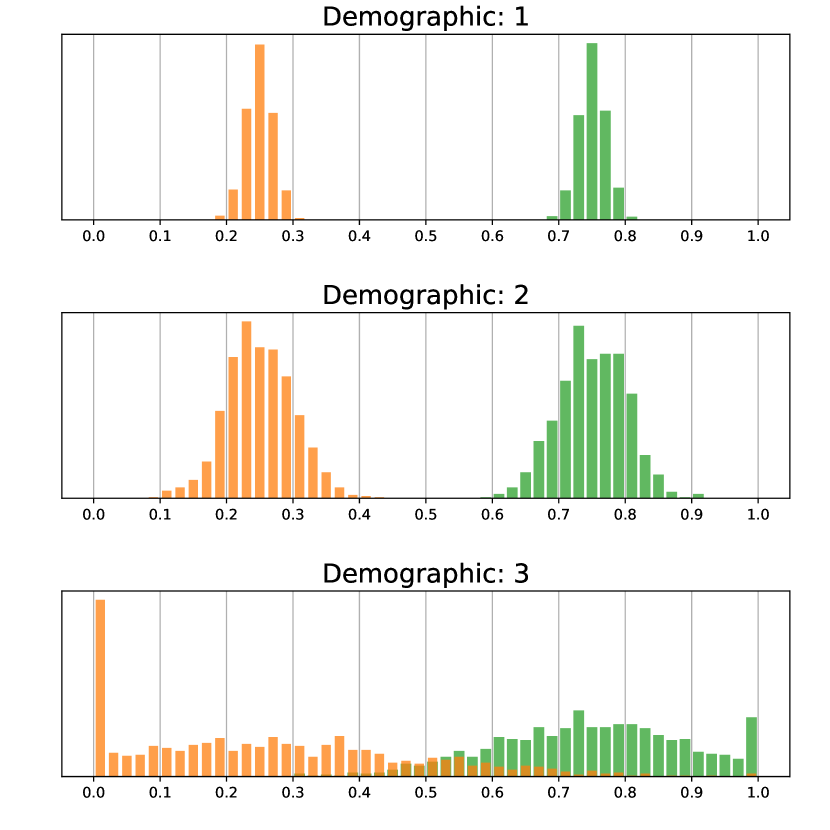
Consider two (canonical) biometric verification systems—whose score distributions are shown in Figs. 1(a)–1(b). For both systems, the classification accuracy (in terms of FMR and FNMR) is nearly the same. However, the first system (Fig. 1(a)) is likely to be fair to both demographic groups (top and bottom row), whereas the other biometric system is likely to be unfair to demographic (top row). We believe that such disparity among demographic groups, beyond the recognition accuracy, needs to be quantified systematically. In this work, we propose three measures based on differential performance for evaluation of demographic fairness of a biometric verification system. The fundamental component of each measure is calculated on distributions of an individual demographic group. Depending on fusion of these components to obtain a final measure, we define three different variants of each measure. We also provide a solution to reduce the effect of demographic imbalance in the test dataset towards fairness evaluation. We explain the behavior of each fairness measure followed by illustration on canonical data (synthetic, yet realistic). Our contributions can be summarized as follows:
-
•
We propose three measures for evaluation of demographic fairness of biometric verification systems.111A Python implementation of each evaluation measure is provided at: https://gitlab.idiap.ch/bob/bob.paper.icpr2022_fairness_index_measures2022. Our measures, being based on scores, consider how well a pair of samples (genuine or imposter) has been matched, rather than just ‘whether it has been matched’.
-
•
We propose a weighted fusion strategy to account for demographic imbalance in the benchmarking datasets. Our weighing strategy attempts to provide higher importance to relatively under-represented demographic groups.
-
•
We propose three different variants for each fairness measure to facilitate assessment of fairness from multiple perspectives.
-
•
Being agnostic to the modality, the proposed measures are applicable across various biometric modalities.
2 Problem Formulation
We begin with general definition of algorithmic fairness in biometrics followed by discussion on how the notion of fairness applies to the problem of biometric verification (BV).
2.1 Fairness in Biometrics
In [17], Mehrabi et al. provide several definitions for algorithmic fairness in machine learning. The definition related to demographic parity (Def. 3, Sec. 4.1), which is more suitable for the present discussion, suggests that the likelihood of the positive outcome should be the same regardless of whether the person is in the protected group. For a biometric system, the term protected group may be used to refer to different demographics present in data. The demographic division could be based on the factors such as gender, race, or ethnicity. While these factors are often regarded as sensitive issues, the authors discuss these attributes of data purely from technical aspect, and provide solutions (i.e. fairness measures) that are generic towards any multi-demographic attribute. In this paper, the term ‘demographic’ refers to subset(s) of data—where the partitioning is possible due to any demographic attribute.
Let be the test dataset, consisting of samples (biometric presentations), used to benchmark the fairness of a given biometric system. We assume that the presentations are correctly acquired, labelled, and processed to obtain feature descriptors. Let the dataset consist of samples from demographic groups, such that . Here, is a finite, but usually small number (For , the dataset represents homogeneity in terms of demographic variation). Additionally, we assume that each sample can be associated with one and only one demographic from . That is, demographic subsets are disjoint. This assumption may not always hold true in some real-world scenarios due to finite number of demographic classes, and (quite often) subjective assignment of these classes to the samples. Notwithstanding with these imperfections, we consider samples in to be disjoint in terms of demographic categorization; and therefore, if a demographic consists of samples (), we have . A biometric system, with predictor function , is considered to be fair, if for every pair of [17, 13]. Thus, parameters of distribution characterizing different demographic groups need to be analyzed for fairness of the system.
2.2 Fairness in Biometric Verification
In this work, we discuss fairness for a BV system which is one of the most important and widely deployed biometric application. The BV system is a 1:1 matching process that compares the features of probe sample with the features of previously enrolled sample of the claimed identity. When both samples belong to the same identity, the match is considered to be genuine and a match between features of two different identities is regarded as imposter. A score threshold (), fixed or computed over different dataset, binarizes the matching scores into decisions (match or no-match). If and represent the feature vectors (generated by the BV system) of enrolled and probe samples, respectively; a matching score is calculated using a score function . Most often, the score function comprises Euclidean or cosine distances followed by suitable modifications to ensure that the matching score is a real-valued scalar in [0, 1] with higher values indicating a better match. For an ideal BV system, for a genuine match, and for an imposter pair.
For a BV system, the algorithmic fairness can be defined as the ability of the BV system to exhibit similar performance– in terms of scores, accuracies, or error rates– to different demographic groups in the test data. However, quantitative measurement of the said term is necessary in order to systematically assess the fairness of BV systems. In our work, the fairness test is performed by obtaining the feature vectors or embeddings for pairs from . The matching scores are obtained for multiple pairs of () samples by computing score function . For a genuine match, the features and refer to the same subject, and hence, both samples essentially belong to the same demographic in . For an imposter match, on the other hand, both identities may or may not belong to the same demographic in . In this work, however, the imposter matches (and thus, corresponding score distributions) are restricted to the pair of samples from different identities, yet belonging to the same demographic. This experimental setup, thus, evaluates or defines the imposter matches in intra-demographic manner. One rationale behind this setup is to analyze the behavior of the BV system, towards each demographic independently. Also, it has been demonstrated that the number of false matches from inter-demographic pairs is much smaller than those from the same demographic [18, 4, 2]. Therefore, for fairness evaluation, we restrict the choice of sample pairs selected within same demographic group.
3 Proposed Fairness Measures
Prior to the introduction of fairness measures, we discuss strategy to reduce the impact of demographic imbalance in test data.
3.1 Fusion for Demographic Imbalance in Test Datasets
The fairness of a BV system refers to its equitability across different demographic groups. The test or benchmarking dataset acts as a proxy to real-world scenario with a fundamental assumption that these data represent a reasonably similar distribution of real-world data w.r.t. multiple attributes. However, studies have noted that many biometric datasets are highly imbalanced in distributions of their demographic attributes [12, 16]. To the best of our knowledge, existing evaluations of fairness do not take into account the fact that, in most cases, the test datasets under-represent some demographic groups. The disparity in sample sizes in the training set is beyond the scope of this work. However, the question: “should the imbalance in sample sizes of different demographic groups be considered during evaluation of fairness?” needs to be addressed. Such a consideration can be helpful while comparing the fairness of a system across datasets (or in dataset-agnostic manner). An intuitive solution would be designing a weighing strategy (weighted-fusion rule) where a weight relative to the cardinality (sample size) of each demographic group can be assigned while computing overall fairness measure. If is the weight assigned to the demographic group , then .
For several use-cases, the fusion weights are monotonically non-decreasing functions of (or directly proportional to) the sample size, i.e., . The normalized weights are related to the probability of a sample drawn from the test dataset belonging to . With this approach, the fairness measure of under-represented demographic groups (where few ’s are significantly smaller than remaining ones) are assigned smaller weights during the fusion (weighted linear combination). The imbalance in demographic data (training or testing) has adverse impact on the fairness of the biometric system [16]. Unfortunately, the aforementioned approach of computing fusion weights suppresses the measures for those demographic groups—for which the BV system is likely to be unfair. Alternatively, the fusion weights could be inversely proportional to (or monotonically non-increasing functions of) the sample size of the demographic (). This weighing approach emphasizes the contributions of under-represented demographic groups. While this approach appears to be reasonable for minor variations in sample sizes, it is not robust for highly unbalanced test datasets. If the proportion of the sample size of any demographic group is tiny , the corresponding measure will be assigned excessively high fusion-weight. With only few test samples, it is indeed difficult to ascertain whether these samples represent true distribution of the underlying demographic group. Therefore, assigning high weights to such groups may not reflect true fairness of the BV system, either. We propose the following mechanism to compute fusion weights, towards obtaining final fairness measure, for demographic groups in .
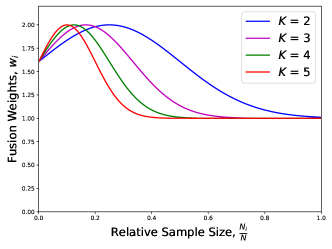
For a test dataset comprising -demographic groups, the ideal data distribution refers to (nearly) equal sample size of each demographic group (i.e., ). A demographic with relatively minor representation than the ideal one should be assigned with higher fusion weights to provide higher attention to its fairness score. However, if the sample size of a particular group is substantially small, the fusion weight should be nominally controlled to avoid a possibility of insufficient samples affecting the fairness score of the BV system. Consequently, we propose a weighing function where the fusion weights are calculated through exponential function of the sample size . The parameters of the exponential are determined from the properties of the test dataset. Equation 1 provides the formula for fusion weights.
| (1) | ||||
| (2) |
where, represents the standard deviation of the weighing function. The numeric constant, set to 1.0, provides numerical stability to the weight calculation, and also limits drastic variations across fusion weights. The unnormalized and normalized fusion weights are represented by and , respectively. Figure (2) shows the unnormalized fusion weights for . It may be observed that fusion weights (i.e. relative importance) are assigned higher values for marginally under-represented demographic groups; however, further reduction in sample size does not encourage similar importance (due to possibly inaccurate representation of underlying demographic data). On the other hand, the over-represented demographic group is assigned relatively lesser importance to avoid its dominance on determining the fairness of the BV system.
3.2 Fairness Measures
A primary component (akin to the building block) of a particular fairness
measure is first calculated separately for each demographic group in
. The fairness measure for overall test dataset is
obtained by combining the corresponding resultants (of primary component) for
each demographic group. In each case, the output of the scoring function is
normalized in the range [0, 1]. The values of fairness measures are dependent
on the chosen score function (i.e., distance function).
1. Separation Fairness Index (SFI):
We define the Separation Fairness Index (SFI) of the biometric verification system as the measure of its equitability towards separation of expected values of genuine and imposter scores across constituent demographic groups.
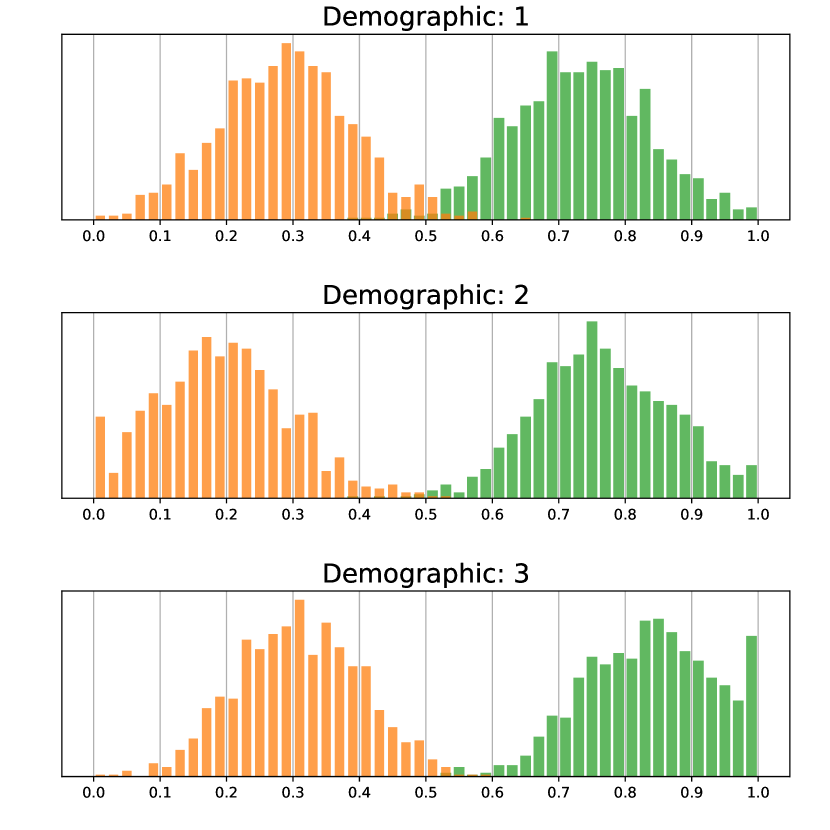
Consider a BV system that generates feature vectors for samples of demographic group . The matching scores for pairs of the feature vectors and are calculated using score function, . Let be the expected value of matching scores obtained for genuine pairs ( and belong to the same subject), and be the expected value of imposter pairs ( and belong to different subjects, but within same demographic). Higher separation between and generally leads to better verification rates. If we denote the separation between two expected values for demographic group as , a fair BV system is expected to exhibit similar values of for each demographic group in . We define the normal (or absolute) variant of SFI as the following.
| (3) |
For a fair BV system, the reaches a value of 1.0 indicating similar (and hence, fair) separation of expected values of genuine and imposter scores across demographic groups. If the BV system exhibits unequal separation of such scores, the FSI value decreases accordingly with the worst-case value being 0. Fig. 3 depicts these scenarios on a canonical (synthetic) data.
Sometimes the performance of overall system is characterized by the worst performing sub-system. Depending on the nature of performance measure, the minimum or maximum fusion rule is applied. Accordingly, we suggest an extremal variant of the FSI measure where maximum value of discrepancy in separation is chosen to represent the fairness of the BV system. The extremal variant of SFI, denoted as is provided by Eq. 4.
| (4) |
where intermittent variables computed as described previously in Eq. 3.2. The normal and extremal variants of SFI do not consider any variations in the sample sizes of demographic groups. We propose a weighted variant of the SFI using the weighing strategy discussed earlier in this section (Eq. 1), and re-using the calculation from Eq. 4 for group-level variables. The resultant fairness measure is given by Eq. 5.
| (5) |
Being a linear combination with normalized weights (), the
overall range and behavior of SFIW is similar to that of normal
variant of SFI, however, it scales the combination based on sample
sizes of demographic groups. Note that a highly accurate BV system may still be
considered less fair, if the separation across groups is not uniform. For the
canonical BV systems, whose score distributions are depicted in
Fig. 3, the FSI values are provided in Table 1.
| Balanced | Imbalanced | |||||
|---|---|---|---|---|---|---|
| Fair | Unfair | Highly Unfair | Fair | Unfair | Highly Unfair | |
| 0.9489 | 0.9064 | 0.6017 | 0.9833 | 0.8424 | 0.5975 | |
| 0.9233 | 0.8596 | 0.4025 | 0.9750 | 0.7636 | 0.3963 | |
| 0.9489 | 0.9064 | 0.6017 | 0.9846 | 0.8292 | 0.6230 | |
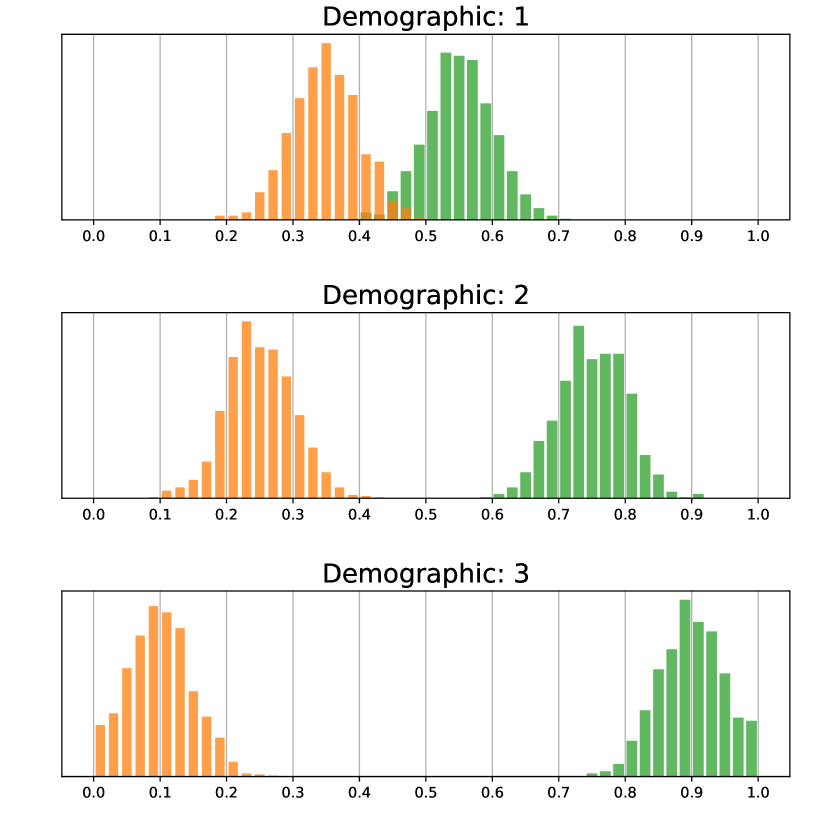
2. Compactness Fairness Index (CFI):
We define the Compactness Fairness Index (CFI) of the biometric verification system as the measure of its equitability towards compactness (or spread) of genuine scores and imposter scores across constituent demographic groups.
For a BV system, let and be the standard deviations of the matching scores obtained for genuine and imposter pairs, respectively. Smaller values of spread (measured in terms of standard deviation here) for both genuine and imposter scores are desirable, though this characteristic alone does not determine accuracy of verification. Consistency of spread of score distributions across demographic groups simplifies several scaling and normalization procedures– even if applied using global statistics of .

If we denote the combined spread of both score distributions for demographic group as , a fair BV system is expected to exhibit similar values of for each demographic group in . We define the normal (or absolute) variant of CFI as the following.
| (6) |
| Balanced | Imbalanced | |||||
|---|---|---|---|---|---|---|
| Fair | Unfair | Highly Unfair | Fair | Unfair | Highly Unfair | |
| 0.9930 | 0.9157 | 0.7921 | 0.9888 | 0.9195 | 0.7901 | |
| 0.9895 | 0.8735 | 0.6882 | 0.9832 | 0.8793 | 0.6851 | |
| 0.9930 | 0.9157 | 0.7921 | 0.9893 | 0.9191 | 0.8052 | |
Similar to SFI, the best possible value for is 1.0—where the combined spread of genuine and imposter score distributions for each demographic group is the same. With disparity in the combined spread of scores across demographics, the value decreases, indicating that for some groups the BV system does not generate enough compact representations in feature space than others. The behavior of CFIN is graphically depicted in Fig. 4. An extremal variant of the CFI measure, as given in Eq. 7, is based on the maximum discrepancy in the spread of scores for a particular demographic group in .
| (7) |
The weighted variant of the CFI weighs the spread variables () depending on the sample size of the demographic group, . The fusion weights are calculated as discussed earlier in Eq. 1. The expression for CFIW is given below in Eq. 8. Table 2 provides the values of all variants of CFI computed on balanced as well as imbalanced canonical datasets.
| (8) |
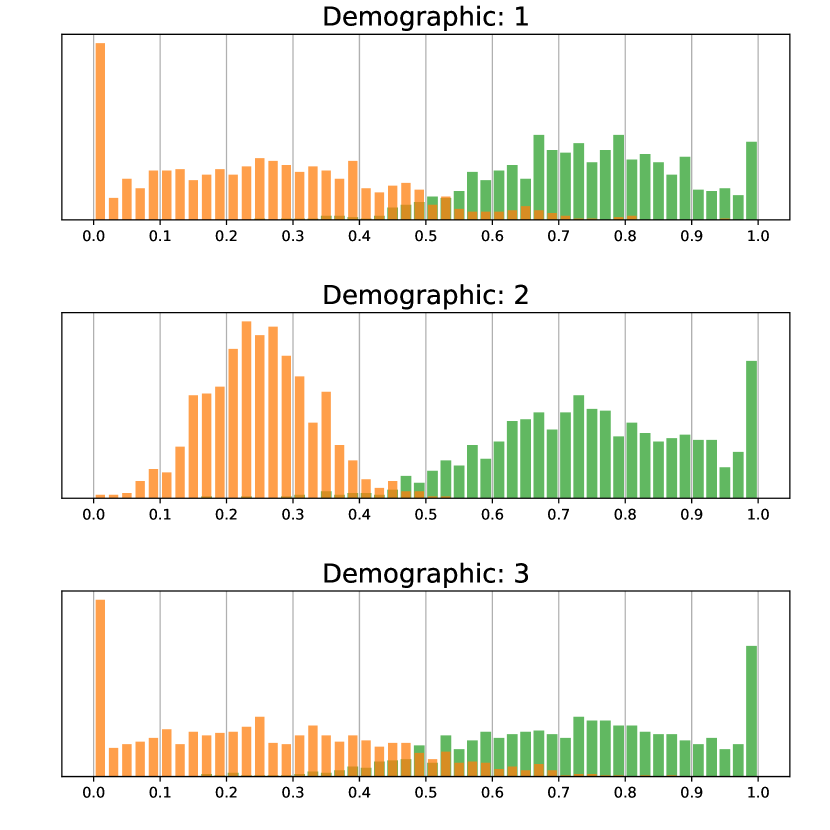
3. Distribution Fairness Index (DFI):
We define the Distribution Fairness Index (DFI) of the biometric verification system as the measure of its equitability towards overall score distributions across constituent demographic groups.

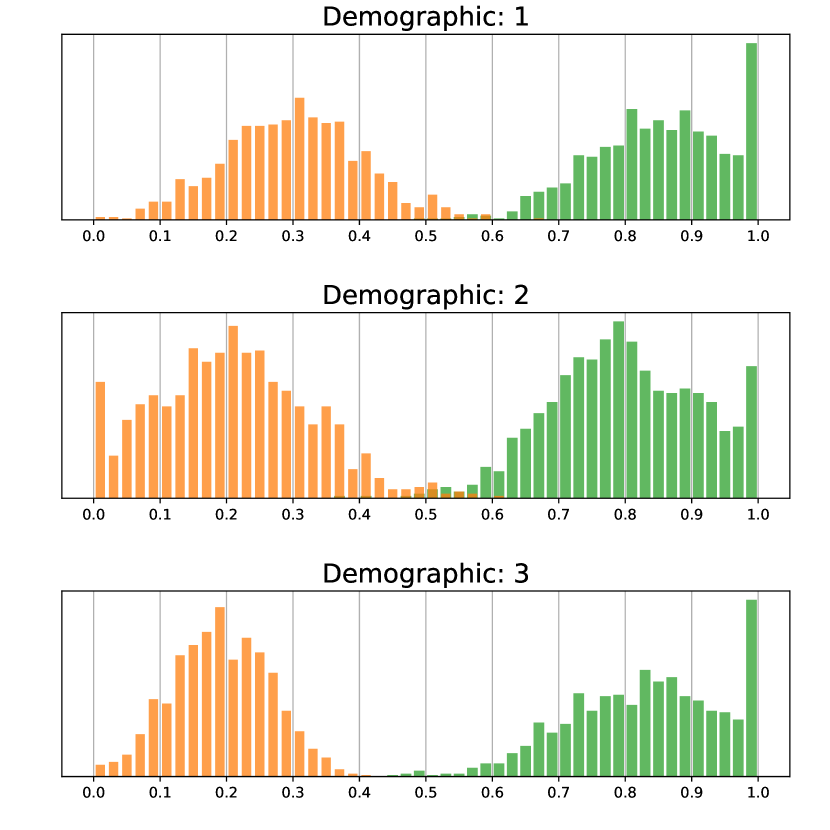

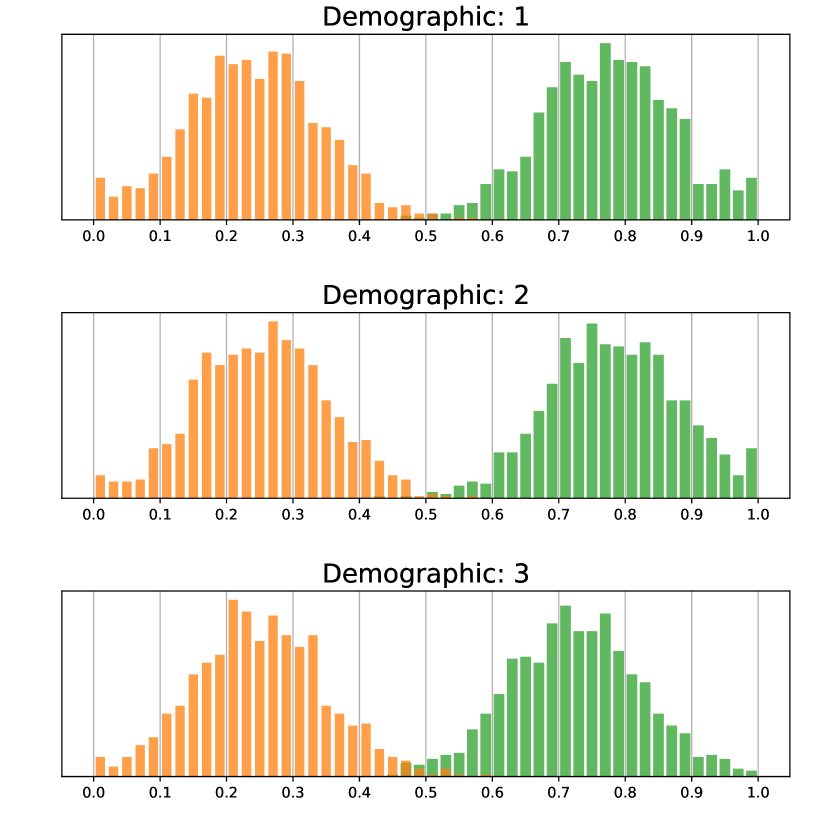
The literature is enriched with the similarity measures between probability distributions. We consider the Jensen-Shannon divergence [19] to quantify the similarity among score distributions of demographic groups. Unlike previous two fairness measures, the DFI does not distinguish between the scores of genuine and imposter pairs for a given demographic group, . This measure, thus, considers the complete data and scores of the demographic group as a whole, and measures how different these distributions are from their mean distribution. Fig. 5 depicts the fair and unfair verification systems from the perspective of DFI measure. The procedure to compute the DFI is provided below.
| (9) |
where is the combined (genuine + imposter) score distribution, normalized to yield a unity sum, of the demographic group . To compute the score histogram we empirically consider 100 bins. The Kullback-Leibler (KL) divergence, , has been computed on distributions and considering 100-binned score histogram as follows:
| (10) |
The normal variant of the DFI measures the summation of average distance between the score distributions of demographic groups. In the best case scenario, where the BV system generates nearly same score distributions (as a whole) for each demographic group, the value of approaches to one. The extremal variant of DFI computed using the demographic group with maximum KL divergence from the average distribution.
| (11) |
For the weighted variant of DFI, we replace the relative weights () from normal variant to the sample size-based weights () as discussed in the previous section. However, we do not modify the computation of average distribution using fusion weights. The formula for DFIW is provided in Eq. 12.
| (12) |
The values of all variants of the DFI, corresponding to the score distributions in Fig. 5, are provided below in Table 3. It also includes the values for demographically imbalanced datasets where only the weighted variant obtains different values than the balanced scenario.
| Balanced | Imbalanced | |||||
|---|---|---|---|---|---|---|
| Fair | Unfair | Highly Unfair | Fair | Unfair | Highly Unfair | |
| 0.9744 | 0.9206 | 0.3367 | 0.9293 | 0.8763 | 0.3364 | |
| 0.9687 | 0.8930 | 0.1295 | 0.8570 | 0.7820 | 0.1198 | |
| 0.9744 | 0.9206 | 0.3367 | 0.9219 | 0.8622 | 0.3052 | |
4 Summary
In this work, we have introduced three measures for evaluation of demographic fairness of a generic biometric verification system. The proposed measures determine the fairness of a verification system, towards demographic groups, based on its equitability w.r.t separation, compactness, and distribution of genuine and imposter scores. In addition to mathematical expressions, we have also provided practical meaning and desired behavior of these fairness measures.
We have discussed three variants of each fairness measure based on how the effect of each demographic group contributes towards the final measure. We have also addressed the concern related to the demographic imbalance in test datasets. We have discussed why a simple linear relationship between fusion weights and sample sizes (of demographic groups) is not effective. Our weighted fusion strategy attempts to balance relative importance of under-represented demographic groups without aggravating their contributions towards the final fairness measure. Such fusion strategies could be useful in comparing the fairness of biometric systems on imbalanced datasets.
Our work seeks at decoupling the notion of fairness of a verification system from its accuracy. Since we employ a differential performance-based approach, our measures are dependent on the chosen score function, but not on any external parameters such as score threshold. The proposed measures are not be considered as alternative to the outcome-based fairness measures, rather both evaluation approaches are complementary towards analysis of the demographic fairness of a biometric verification system.
Acknowledgements
Authors would like to thank the Hasler foundation for their support through the SAFER project.
References
- [1] Y. Sun, M. Zhang, Z. Sun, and T. Tan, “Demographic analysis from biometric data: Achievements, challenges, and new frontiers,” IEEE Transactions on Pattern Analysis and Machine Intelligence, vol. 40, no. 2, pp. 332–351, 2018.
- [2] J. Howard, Y. Sirotin, and A. Vemury, “The effect of broad and specific demographic homogeneity on the imposter distributions and false match rates in face recognition algorithm performance,” in International Conference on Biometrics Theory, Applications and Systems, pp. 1–8, 2019.
- [3] P. Drozdowski, C. Rathgeb, A. Dantcheva, N. Damer, and C. Busch, “Demographic bias in biometrics: A survey on an emerging challenge,” IEEE Transactions on Technology and Society, vol. 1, no. 2, pp. 89–103, 2020.
- [4] P. Grother, M. Ngan, and K. Hanaoka, “Face recognition vendor test part 3: Demographic effects,” Dec 2019.
- [5] I. Raji and J. Buolamwini, “Actionable auditing: Investigating the impact of publicly naming biased performance results of commercial ai products,” in Proceedings of the AAAI/ACM Conference on AI, Ethics, and Society, pp. 429–435, 2019.
- [6] “MIT Technology Review.” https://www.technologyreview.com/2016/07/06/158971/are-face-recognition-systems-accurate-depends-on-your-race. Last accessed: July 10, 2022.
- [7] “Racial discrimination in face recognition technology.” https://sitn.hms.harvard.edu/flash/2020/racial-discrimination-in-face-recognition-technology. Last accessed: July 10, 2022.
- [8] “The Washington Post.” https://www.washingtonpost.com/world/2021/09/15/un-ai-moratorium. Last accessed: July 10, 2022.
- [9] I. Raji et al., “Saving face: Investigating the ethical concerns of facial recognition auditing,” in Proceedings of the AAAI/ACM Conference on AI, Ethics, and Society, pp. 145–151, 2020.
- [10] C. Cook, J. Howard, Y. Sirotin, J. Tipton, and A. Vemury, “Demographic effects in facial recognition and their dependence on image acquisition: An evaluation of eleven commercial systems,” IEEE Transactions on Biometrics, Behavior, and Identity Science, vol. 1, no. 1, pp. 32–41, 2019.
- [11] T. Sixta et al., “Fairface challenge at eccv 2020: Analyzing bias in face recognition,” in European conference on computer vision, pp. 463–481, Springer, 2020.
- [12] R. Garcia, L. Wandzik, L. Grabner, and J. Krueger, “The harms of demographic bias in deep face recognition research,” in International Conference on Biometrics, pp. 1–6, IEEE, 2019.
- [13] T. de Freitas Pereira and S. Marcel, “Fairness in biometrics: a figure of merit to assess biometric verification systems,” IEEE Transactions on Biometrics, Behavior, and Identity Science, vol. 4, no. 1, pp. 19–29, 2021.
- [14] R. Ramachandra, K. Raja, and C. Busch, “Algorithmic fairness in face morphing attack detection,” in Proceedings of the IEEE/CVF Winter Conference on Applications of Computer Vision, pp. 410–418, 2022.
- [15] S. Gong, X. Liu, and A. Jain, “Jointly de-biasing face recognition and demographic attribute estimation,” in Computer Vision – ECCV 2020, (Cham), pp. 330–347, Springer International Publishing, 2020.
- [16] I. Hupont and C. Fernández, “Demogpairs: Quantifying the impact of demographic imbalance in deep face recognition,” in International Conference on Automatic Face and Gesture Recognition, pp. 1–7, 2019.
- [17] N. Mehrabi, F. Morstatter, N. Saxena, K. Lerman, and A. Galstyan, “A survey on bias and fairness in machine learning,” ACM Computing Surveys, vol. 54, no. 6, pp. 1–35, 2021.
- [18] D. Michalski, S.-Y. Yiu, and C. Malec, “The impact of age and threshold variation on facial recognition algorithm performance using images of children,” in International Conference on Biometrics, pp. 217–224, 2018.
- [19] J. Lin, “Divergence measures based on the shannon entropy,” IEEE Transactions on Information Theory, vol. 37, no. 1, pp. 145–151, 1991.