Heat and mass transfer during a sudden loss of vacuum in a liquid helium cooled tube - Part IV: Freeze range
Abstract
In a series of papers (i.e., Part I–III), we presented our systematic study on nitrogen gas propagation in an evacuated copper tube cooled by liquid helium. This research aims to gain insights into the coupled heat and mass transfer processes involved in a catastrophic vacuum loss in superconducting particle accelerator beamline tubes. Our experimental measurements on nitrogen gas propagation in both normal liquid helium (He I) and superfluid helium (He II) cooled tube revealed a nearly exponential deceleration of the gas propagation. A theoretical model that accounts for the gas dynamics, heat transfer, and condensation was also developed, and various key experimental observations were nicely reproduced in our model simulations. A particularly interesting phenomenon uncovered in our study is that the gas propagation appears to nearly stop beyond a certain distance from the location where condensation starts. We refer to this distance as the freeze range. In this paper, we present our detailed analysis of the freeze range at various inlet mass fluxes and tube diameters. We show that the results can be well described by a simple correlation. The physical mechanism underlying this useful correlation is explained. Knowing the freeze range may allow accelerator engineers to develop protocols for controlling frost-layer contamination in the beamline tubes, which should be of practical importance.
keywords:
Particle accelerator , Beamline tube , Liquid helium , Loss of vacuum , Condensation , Frost contamination , Cryogenics-0.1
1 Introduction
Many modern particle accelerators utilize superconducting radio-frequency (SRF) cavities cooled by liquid helium (LHe) to accelerate particles [1]. These SRF cavities are housed inside interconnected cryomodules and form a long LHe-cooled vacuum tube, i.e., the beamline tube [2]. A vacuum failure in the beamline tube can be catastrophic because the air leaking into the beamline tube can propagate down the tube and condense on the tube inner surface, causing violent boiling of the LHe and dangerous pressure build-up in the cryomodule [3, 4, 5, 6, 7]. Understanding how fast the condensing gas propagates and the associated heat deposition is of great practical importance for the design of beamline safety components.
This motivation has triggered some focused research over the past decade [8]. For instance, early studies at accelerator labs showed that the propagation speed of the condensing gas was significantly lower than that in a room-temperature vacuum tube [6, 10]. Later studies by Dhuley and Van Sciver revealed a nearly exponential deceleration of the gas-front propagation in LHe-cooled tubes [11, 12]. They attributed this strong deceleration to the condensation of the gas on the tube inner surface, but a quantitative explanation was lacking. In a series of recent papers [13, 14, 15, 16], we reported our more systematic studies on nitrogen gas propagation in an evacuated copper tube immersed in both normal liquid helium (He I) and superfluid helium (He II). Besides measuring the gas-front propagation velocity in a setup under well controlled conditions [13], we also developed a theoretical model that accounts for the gas dynamics, condensation, and heat transfer. Various key observations in both the He I runs and the He II runs were nicely reproduced in our model simulations [15, 16], which greatly improved our understanding of the complex coupled heat and mass transfer processes involved in loss of vacuum events.
A particularly interesting phenomenon observed in our past studies is that at a given inlet mass flow rate, the gas propagation appears to nearly stop beyond a certain distance from the location where the condensation starts. We denote this distance as the freeze range. Knowing the freeze range may allow accelerator engineers to develop protocols for better controlling frost-layer contamination in the beamline tube. This paper presents our systematic numerical study of this freeze range. In Sec. 2, we briefly outline our theoretical model and its validation against our experimental observations. In Sec. 3, we present the calculated freeze range under various inlet mass flux and tube diameters. We show that the results can be well described by an simple correlation. In Sec. 4, we discuss the physical mechanism underlying the simple correlation. A brief summary is included in Sec. 5.
2 Theoretical model
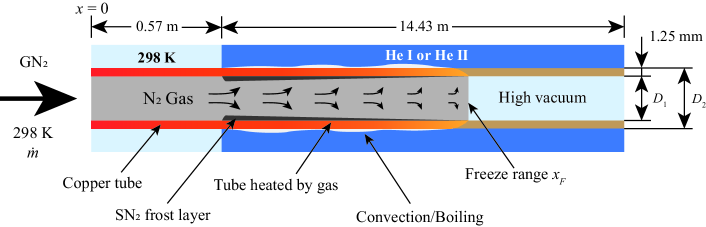
We consider nitrogen gas (GN2) propagation in an evacuated copper tube cooled by LHe as shown schematically in Fig. 1. At the inlet, the gas is supplied at a constant mass flow rate with a fixed temperature K. The tube-wall thickness is set to 1.25 mm, matching that in our experiments. As detailed in our previous work [15, 16], we adopt a 1D model to describe the gas dynamics and condensation in the cold section of the tube (i.e., m). This model is based on the conservation equations of the GN2’s mass, momentum, and energy, as listed below:
| (1) |
| (2) |
| (3) | |||
The definitions of the parameters included in the above equations are listed in the Nomenclature table. The Nusselt number for the convective heat transfer between the GN2 and the tube wall is calculated using the Sieder-Tate correlation [17]. The parameter denotes the nitrogen mass deposition rate per unit wall inner surface area, which is evaluated using the Hertz-Knudsen relation [18]:
| (4) |
where is the saturated vapor pressure at the surface temperature of the nitrogen frost layer on the tube inner surface. The empirical condensation coefficient and the evaporation coefficient are set to be 0.95 in our simulations, since their values are typically about the same and close to unity for a very cold surface [19]. The Schrage parameter is evaluated based on the GN2 temperature and the mass deposition rate as detailed in Ref. [16]. The frost-layer surface temperature , which is required in the above equations, can be determined by evaluating the heat transfer through the frost layer [15, 16]:
| (5) |
where denotes the frost layer center temperature, and is the heat flux conducted through the frost layer thickness , whose change rate is given by [20, 21]. The SN2 properties are taken from Refs. [22, 21]. The variation of the copper tube wall temperature is described by:
| (6) |
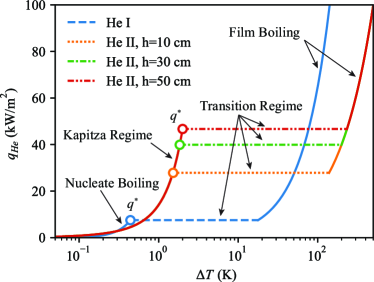
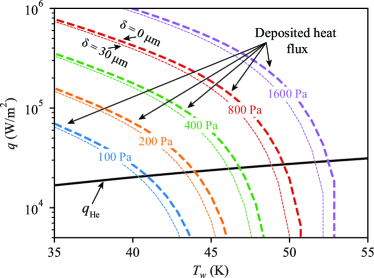
The parameter in Eq. 6 represents the instantaneous heat flux from the outer surface of the tube to the LHe (He I or He II) bath. Since the temperature relaxation in LHe towards a steady state occurs much faster compared to the slow gas propagation [23, 24, 25], it is feasible to adopt the correlations developed for steady-state heat transfer between solid surfaces and LHe to model for simplicity [26]. The physical properties of GN2, copper, and stainless steel used in our simulations are extracted from existing literature [20, 27, 28, 29]. Fig. 2 shows some representative correlation curves for . Depending on the temperature difference between the tube wall and the LHe bath, there are three regimes of . In the case of He I, a nucleate boiling regime exists for small . When reaches a peak heat flux value , a transition regime emerges, where increases rapidly towards the final film boiling regime. We adopt the Breen-Westwater correlation to evaluate [16, 30]. For He II, instead of nucleate boiling, a Kapitza heat transfer regime exists below the peak heat flux , whose value can be calculated using an integral correlation that involves both the He II bath temperature and the hydrostatic head pressure (hence the immersion depth ) [23]. We adopt a two-step first order Godunov-type finite-difference scheme [31, 32] to solve the above equations. More detailed information on the assumptions and justifications underlying our 1D theoretical models can be found in our earlier papers [15, 16].
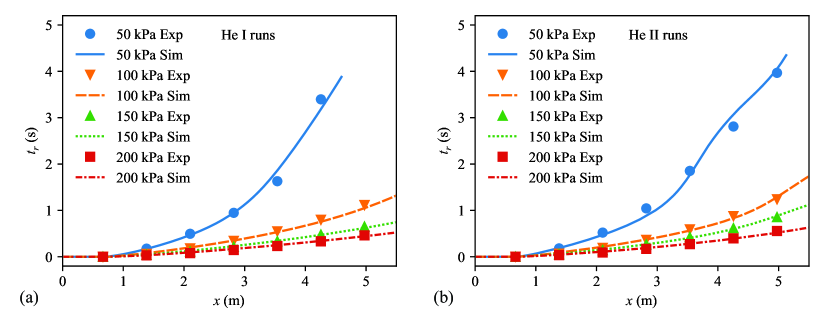
In order to achieve the best agreement between the simulated and observed gas dynamics, we treated the coefficient in the Breen-Westwater correlation [30] of for He I and the parameter in the integral correlation of for He II as tuning parameters [15, 16]. We found that observations in the He I experiments at various inlet mass flow rates can be nicely reproduced with the optimal W/(cm K5/4). For the He II experiments, due to the complication that the immersion depth changes along the experimental tube, the optimal value appears to depend on the inlet mass flow rate and varies in the range of 0.4 to 2 [16]. To show the effectiveness of these fine-tuned models, we present in Fig. 3 the simulated GN2 arrival time under different inlet gas pressures in both He I and He II cooled tube together with relevant experimental data. This arrival time is defined as the time moment when the wall temperature rises sharply from the bath temperature (i.e., 4.2 K for He I and 1.9 K for He II) to above a threshold temperature of 4.7 K [16]. The tube inner diameter in these simulations is set to one inch to match the experimental setup. The comparison clearly demonstrates that our model simulations effectively reproduce the gas propagation inside the tube for both the He I runs and the He II runs.
3 Freeze-range calculation
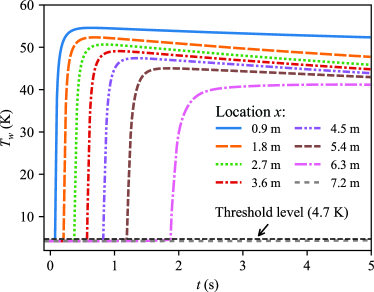
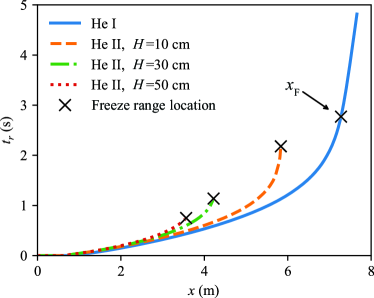
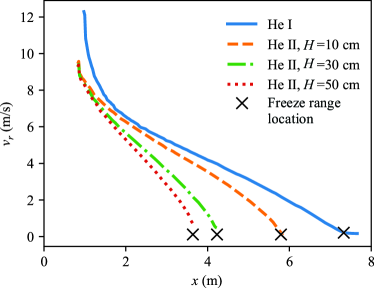
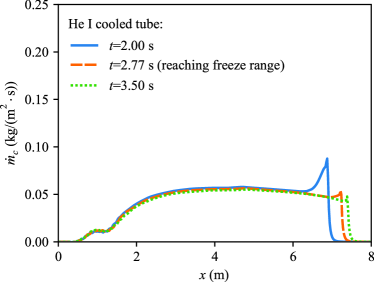
In our numerical studies, we have observed an intriguing phenomenon: the propagation of the GN2 appears to nearly stop beyond a certain distance from the entrance of the tube. To illustrate this phenomenon, we show in Fig. 4 the simulated wall temperature curves at various locations along a He I cooled tube. These locations are equally spaced by 0.9 m. In this simulation, the tube has an inner diameter of cm with a wall thickness of 1.25 mm, and the mass flux of GN2 at the entrance is set to 60 kg/(ms). As the GN2 front reaches each probed location, there is a sudden rise in the tube wall temperature. To quantify the gas propagation, we extract the arrival time from these wall temperature curves and plot it in Fig. 5. It is evident that as we move further along the tube (increasing ), the arrival time of the gas front increases rapidly. This indicates a deceleration in the gas propagation. Remarkably, as shown in Fig. 4, the wall temperature at m hardly shows any significant increase despite the continuous supply of GN2 at the entrance. This observation strongly suggests that the propagation of GN2 must come to a halt before reaching m. To determine the exact location at which the propagation speed diminishes, we calculate the gas-front propagation velocity and presented it as a function of in Fig. 6. Our analysis reveals a dramatic drop in from over 12 m/s to approximately 7 m/s within a distance of about 1 m from the condensation position (i.e., m). Subsequently, continues to decrease roughly linearly with increasing until it eventually settles at a small value of about 0.18 m/s. We define the distance between the condensation location to the start of this settled regime as the freeze range . In the specific case considered here, we find m, which is depicted in both Fig. 5 and Fig. 6.
| Parameter | Optimal value for He I | Optimal value for He II (H=50 cm) | Unit |
|---|---|---|---|
| 0.074 | 0.018 | m2c-b+1kg-csc | |
| 0.915 | 1.023 | 1 | |
| 1.084 | 1.395 | 1 |
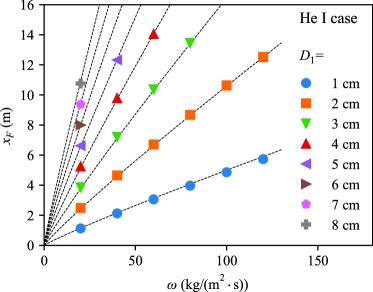
For the He I cooled tube with a fixed wall thickness, the freeze range should depend primarily on the tube inner diameter and the GN2 mass flux at the tube entrance. To explore the dependance of on and , we have conducted additional model simulations, varying the values of and within the ranges of 1 cm cm and 20 kg/(ms) kg/(ms), respectively. The values obtained from these simulations are presented in Fig. 7. It is evident that as either or increases, the freeze range also increases. To quantify this relationship, we propose the following simple correlation:
| (7) |
where , , and are adjustable parameters. By tuning these parameters, we can effectively reproduce the simulated values of for all combinations of and , as illustrated in Fig. 7. The optimal values of , , and corresponding to the best fit to the He I data are provided in Table 1. Notably, both and are close to one, suggesting an approximate linear dependance of on and .
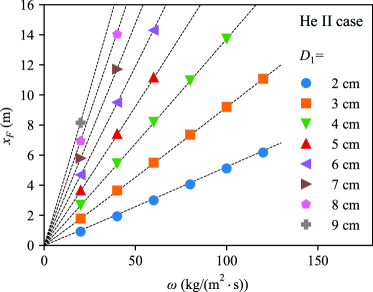
We have also conducted a detailed analysis of the freeze range for the He II-cooled tube, which presents a more intricate situation. In the case of He II, the heat transfer from the outer surface of the tube to the He II bath is influenced by both the bath temperature and the immersion depth . Consequently, the freeze range is expected to depend not only on the parameters and but also on and . To illustrate this point, we have performed simulations to examine the arrival time and the front propagation velocity of GN2 for a copper tube cooled by He II at various immersion depths , assuming K. The results are depicted in Fig. 5 and Fig. 6. The tube’s geometry and the mass flux remain unchanged from the He I-cooled tube case. These figures clearly demonstrate that as the immersion depth increases, the propagation of the GN2 front slows down at a faster rate. At the freeze range , denoted by the crosses in the figures, the front propagation velocity drops down to nearly zero. The value of decreases as increases, which is primarily caused by the enhanced He II peak heat flux , as shown in Fig. 2. Considering the typical operating conditions of SRF cavities, we assume a simplified scenario with fixed cm and K, and conduct additional simulations to explore the dependence of on and . The results of these simulations are presented in Fig. 8. Once again, we observe that the freeze range increases when either or increases. Interestingly, the correlation expressed by Eq. 7 can still provide a fairly good agreement with the simulation data, when the correlation parameters are tuned to the optimal values as listed in Table 1. These optimal correlation parameters suggest that the freeze range still exhibits a linear dependence on , although the dependence on is a bit stronger than a simple linear fashion.
4 Discussion
The approximate linear dependence of on and , particularly in the case of a He I-cooled tube, suggests that the nitrogen mass deposition rate per unit area on the tube inner surface should remain relatively constant regardless of the location traversed by the GN2 front. This constancy arises from the fact that once the GN2 front reaches the freeze range, the mass conservation law dictates that the rate at which nitrogen mass is supplied at the tube entrance, i.e., , must be balanced by the total rate of nitrogen mass deposited on the inner surface of the tube, approximated as . This balance yields the relationship . Consequently, when remains relatively constant, can exhibit a linear dependence on both and . To visualize this behavior, Fig. 9 displays the calculated for the He I-cooled tube case as presented in Fig. 4. Notably, in regions not too close to the condensation location, remains relatively flat, particularly after the GN2 front reaches the freeze range.
However, the constancy of independent of position , , and may seem counterintuitive, given that according to Eq. 4, depends on the GN2 pressure , temperature , and the surface temperature of the frost layer . These parameters exhibit significant variations within the freeze range and are also influenced by the mass flux at the entrance. To shed light on the underlying physical mechanism, we examine heat transfer in the radial direction through the wall into the LHe bath. Upon the arrival of the GN2 front, the temperature of the wall at each location increases to approximately 40 K to 55 K and changes slowly over time, as shown in Fig. 4. Due to the thinness of the frost layer, remains close to at all times [15]. Consequently, we can disregard the time derivative terms in Eq. (5) and Eq. (6) and derive:
| (8) |
The last term on the right-hand side of Eq. (6), which represents heat conduction along the tube, is negligible compared to other terms and is therefore omitted in the derivation of the above equation. Essentially, Eq. (8) describes a local balance between the heat flux deposited on the tube wall and the heat flux into the LHe bath.
When the bath temperature remains constant, the heat flux into the bath depends solely on the tube wall temperature (refer to Fig. 2), which increases with increasing as illustrated in Fig. 10. On the other hand, as (and thus ) rises, the mass deposition rate decreases, resulting in a reduced rate of heat deposition on the tube wall. For given GN2 state parameters and , Eq. (8) can be balanced at a specific . In Fig. 10, we present curves showing the variation of the deposited heat flux (i.e., the left-hand side of Eq. (8)) as a function of at different . In these calculations, we set K and assume . Evidently, the equilibrium increases with higher , consistent with the trend observed in Fig. 4, where a higher is observed closer to the tube entrance where is larger. Remarkably, when increases from 100 Pa to 1600 Pa, only rises by about 10 K, resulting in less than a 25% increase in . Similar results are obtained at other values, and the effect due to the difference between and caused by a finite frost layer on the tube inner surface is also insignificant (see Fig. 10). The insensitivity of to the state parameters of the GN2 implies that it should remain roughly constant independent of and . In the region near the condensation location (i.e., 0.57 m m), the convective heat transfer term on the left-hand side of Eq. (8) is significant. Consequently, the value of in this region is relatively low, as evident in Fig. 9. However, as we move away from this region, Eq. (8) can be simplified to . As a result, the stability of the heat flux leads to a relatively stable value for , which in turn leads to the approximate linear dependance of on and .
5 Conclusion
We have conducted a comprehensive numerical investigation into the freeze range phenomenon that occurs during the propagation of GN2 in a copper tube cooled by LHe. Our study reveals that the freeze range , within which the nitrogen condensation occurs primarily, exhibits an increase with both the tube diameter and the mass flux at the tube entrance. Through a careful analysis of values obtained for various tube diameters and mass fluxes at the entrance, we have developed a simple correlation that demonstrates good agreement with our numerical simulation results. This correlation suggests that the rate of nitrogen condensation on the inner surface of the tube remains relatively constant and is not significantly affected by changes in tube diameter, positions along the tube, or the mass flux at the entrance. Further analysis has uncovered a local balance between the heat flux deposited on the tube wall and the heat flux transferred into the LHe bath after the GN2 front reaches the freeze range. Notably, the heat flux into the LHe bath exhibits high insensitivity to variations in GN2 state parameters, resulting in the nearly constant condensation rate. Our findings, particularly the establishment of the simple correlation, hold practical value for accelerator engineers who are involved in the development of protocols for managing frost-layer contamination in accelerator beamline tubes. These insights can assist in formulating effective strategies to control and mitigate the impact of frost-layer formation in such systems.
Acknowledgments
This work is supported by U.S. Department of Energy under Grant No. DE-SC0020113. The experiment was conducted at the National High Magnetic Field Laboratory, which is supported by National Science Foundation Cooperative Agreement No. DMR-2128556 and the State of Florida.
References
- Padamsee [2009] H. Padamsee, RF Superconductivity: Science, Technology, and Applications, John Wiley & Sons, 2009.
- Pagani et al. [2005] C. Pagani, P. Pierini, et al., Cryomodule design, assembly and alignment, SRF05, Ithaca NY, USA (2005).
- Wiseman et al. [1994] M. Wiseman, K. Crawford, M. Drury, K. Jordan, J. Preble, Q. Saulter, W. Schneider, Loss of cavity vacuum experiment at CEBAF, Advances in cryogenic engineering (1994) 997–1003. doi:10.1007/978-1-4615-2522-6\_121.
- Seidel et al. [2002] M. Seidel, D. Trines, K. Zapfe, Failure Analysis of the Beam Vacuum in the Superconducting Cavities of the TESLA Main Linear Accelerator, TESLA-Report 2002-06, Deutsches Elektronen Synchrotron DESY, Hamburg, Germany, 2002.
- Ady [2014] M. Ady, Measurement Campaign of 21-25 July 2014 for Evaluation of the HIE-ISOLDE Inrush Protection System, CERN Technical Note TE-VSC-1414574, Technology Department, CERN, Switzerland, 2014.
- Boeckmann et al. [2008] T. Boeckmann, D. Hoppe, K. Jensch, R. Lange, W. Maschmann, B. Petersen, T. Schnautz, Experimental tests of fault conditions during the cryogenic operation of a XFEL prototype cryomodule, in: Proceedings of International Cryogenic Engineering Conference, volume 22, Seoul, Korea, 2008, pp. 723–728.
- Dalesandro et al. [2012] A. A. Dalesandro, J. Theilacker, S. W. Van Sciver, Experiment for transient effects of sudden catastrophic loss of vacuum on a scaled superconducting radio frequency cryomodule, in: AIP Conference Proceedings, volume 1434, American Institute of Physics, 2012, pp. 1567–1574. doi:10.1063/1.4707087.
- Dalesandro [2023] A. A. Dalesandro, Internal review on the state of loss of vacuum research on helium cryogenic systems, 2023. doi:10.48550/arXiv.2303.15309. arXiv:2303.15309.
- Boeckmann et al. [2008] T. Boeckmann, D. Hoppe, K. Jensch, R. Lange, W. Maschmann, B. Petersen, T. Schnautz, Experimental tests of fault conditions during the cryogenic operation of a XFEL prototype cryomodule., in: International Cryogenic Engineering Conference, volume 22, Seoul, Korea, 2008, pp. 723–728.
- Ady et al. [2014] M. Ady, M. Hermann, R. Kersevan, G. Vandoni, D. Ziemianski, Leak propagation dynamics for the HIE-ISOLDE superconducting linac, in: P.-J.-G. Christine (Ed.), A. Gianluigi (Ed.), M. Peter (Ed.), R. S. Volker(Ed.) (Eds.), Proceedings of the 5th Int. Particle Accelerator Conf., Dresden, Germany, 2014, pp. 2351–2353. doi:10.18429/JACoW-IPAC2014-WEPME039.
- Dhuley and Van Sciver [2016a] R. C. Dhuley, S. W. Van Sciver, Propagation of nitrogen gas in a liquid helium cooled vacuum tube following sudden vacuum loss – Part I: Experimental investigations and analytical modeling, International Journal of Heat and Mass Transfer 96 (2016a) 573–581. doi:10.1016/j.ijheatmasstransfer.2016.01.077.
- Dhuley and Van Sciver [2016b] R. C. Dhuley, S. W. Van Sciver, Propagation of nitrogen gas in a liquid helium cooled vacuum tube following sudden vacuum loss – Part II: Analysis of the propagation speed, International Journal of Heat and Mass Transfer 98 (2016b) 728–737. doi:10.1016/j.ijheatmasstransfer.2016.03.077.
- Garceau et al. [2019a] N. Garceau, S. R. Bao, W. Guo, S. W. Van Sciver, The design and testing of a liquid helium cooled tube system for simulating sudden vacuum loss in particle accelerators, Cryogenics 100 (2019a) 92–96. doi:10.1016/j.cryogenics.2019.04.012.
- Garceau et al. [2019b] N. Garceau, S. R. Bao, W. Guo, Heat and mass transfer during a sudden loss of vacuum in a liquid helium cooled tube – Part I: Interpretation of experimental observations, International Journal of Heat and Mass Transfer 129 (2019b) 1144–1150. doi:10.1016/j%****␣Freeze-range.tex␣Line␣475␣****.ijheatmasstransfer.2018.10.053.
- Bao et al. [2020] S. R. Bao, N. Garceau, W. Guo, Heat and mass transfer during a sudden loss of vacuum in a liquid helium cooled tube – Part II: Theoretical modeling, International Journal of Heat and Mass Transfer 146 (2020) 118883. doi:10.1016/j.ijheatmasstransfer.2019.118883.
- Garceau et al. [2021] N. Garceau, S. R. Bao, W. Guo, Heat and mass transfer during a sudden loss of vacuum in a liquid helium cooled tube - Part III: Heat deposition in He II, International Journal of Heat and Mass Transfer 181 (2021) 121885. doi:10.1016/j.ijheatmasstransfer.2021.121885.
- Incropera et al. [2007] F. P. Incropera, D. P. DeWitt, T. L. Bergman, A. S. Lavine, et al., Fundamentals of Heat and Mass Transfer, volume 6, 6 ed., John Wiley & Sons, Hoboken, NJ, 2007.
- Collier and Thome [1994] J. G. Collier, J. R. Thome, Convective boiling and condensation, Clarendon Press, 1994.
- Persad and Ward [2016] A. H. Persad, C. A. Ward, Expressions for the evaporation and condensation coefficients in the Hertz-Knudsen relation, Chemical reviews 116 (2016) 7727–7767. doi:10.1021/acs.chemrev.5b00511.
- Stephan et al. [1987] K. Stephan, R. Krauss, A. Laesecke, Viscosity and thermal conductivity of nitrogen for a wide range of fluid states, Journal of physical and chemical reference data 16 (1987) 993–1023. doi:10.1063/1.555798.
- Scott [1976] T. A. Scott, Solid and liquid nitrogen, Physics Reports 27 (1976) 89–157.
- Cook and Davey [1976] T. Cook, G. Davey, The density and thermal conductivity of solid nitrogen and carbon dioxide, Cryogenics 16 (1976) 363–369. doi:10.1016/0011-2275(76)90217-4.
- Van Sciver [2012] S. W. Van Sciver, Helium Cryogenics, International cryogenics monograph series, 2 ed., Springer, New York, USA, 2012.
- Bao and Guo [2021] S. R. Bao, W. Guo, Transient heat transfer of superfluid in nonhomogeneous geometries: Second sound, rarefaction, and thermal layer, Phys. Rev. B 103 (2021) 134510. doi:10.1103/PhysRevB.103.134510.
- Sanavandi et al. [2022] H. Sanavandi, M. Hulse, S. R. Bao, Y. Tang, W. Guo, Boiling and cavitation caused by transient heat transfer in superfluid helium-4, Phys. Rev. B 106 (2022) 054501. doi:10.1103/PhysRevB.106.054501.
- Smith [1969] R. Smith, Review of heat transfer to helium I, Cryogenics 9 (1969) 11–19. doi:10.1016/0011-2275(69)90251-3.
- Flynn [2004] T. Flynn, Cryogenic engineering, CRC Press, 2004.
- Lemmon et al. [2007] E. Lemmon, M. L. Huber, M. O. McLinden, NIST standard reference database 23: reference fluid thermodynamic and transport properties-REFPROP, version 8.0, 2007.
- Arp et al. [2005] V. Arp, R. McCarty, F. Jeffrey, HEPAK, 2005.
- Breen et al. [1962] B. Breen, J. Westwater, et al., Effect of diameter of horizontal tubes on film boiling heat transfer, Chemical Engineering Progress 58 (1962) 67–72.
- Danaila et al. [2007] I. Danaila, P. Joly, S. M. Kaber, M. Postel, An introduction to scientific computing: Twelve computational projects solved with MATLAB, Springer, 2007. doi:10.1007/978-0-387-49159-2.
- Sod [1978] G. A. Sod, A survey of several finite difference methods for systems of nonlinear hyperbolic conservation laws, Journal of computational physics 27 (1978) 1–31. doi:10.1016/0021-9991(78)90023-2.
Nomenclature
| Variable | Description | Units |
|---|---|---|
| Coefficient in the film boiling correlation of He I | W/(cm K5/4) | |
| Specific heat | J/(kgK) | |
| Inner diameter of the tube | m | |
| Outer diameter of the tube | m | |
| Specific enthalpy | J/kg | |
| Immersion depth | m | |
| Thermal conductivity | W/(mK) | |
| Mass deposition rate | kg/(ms) | |
| Mass flow rate | kg/s | |
| Gas molar mass | kg/mol | |
| Nusselt number | ||
| Nitrogen gas pressure | Pa | |
| Heat flux | W/m2 | |
| Peak heat flux | W/m2 | |
| Conductive heat flux along the wall | W/m2 | |
| Heat flux to the liquid helium bath | W/m2 | |
| Ideal gas constant | J/(molK) | |
| Time | s | |
| Arrival time of gas front | s | |
| Temperature | K | |
| Helium bath temperature | K | |
| Center temperature of the SN2 layer | K | |
| Gas velocity | m/s | |
| Front propagation velocity | m/s | |
| Axial coordinate | m | |
| Freeze range | m | |
| Schrage parameter | ||
| Thickness of the SN2 layer | m | |
| Change rate of | m/s | |
| Temperature difference | K | |
| Specific internal energy | J/kg | |
| Density | kg/m3 | |
| Condensation coefficient | ||
| Evaporation coefficient | ||
| Parameter in the integral correlation of for He II | kg/(ms) | |
| Inlet mass flux | kg/(ms) | |
| Bulk gas condition | ||
| Surface of SN2 layer | ||
| Copper tube wall | ||
| Solid nitrogen |