Collective States in Molecular Monolayers on 2D Materials
Abstract
Collective excited states form in organic two-dimensional layers through the Coulomb coupling of the molecular transition dipole moments. They manifest as characteristic strong and narrow peaks in the excitation and emission spectra that are shifted to lower energies compared to the monomer transition. We study experimentally and theoretically how robust the collective states are against homogeneous and inhomogeneous broadening as well as spatial disorder that occur in real molecular monolayers. Using a microscopic model for a two-dimensional dipole lattice in real space we calculate the properties of collective states and their extinction spectra. We find that the collective states persist even for 1-10% random variation in the molecular position and in the transition frequency, with similar peak position and integrated intensity as for the perfectly ordered system. We measure the optical response of a monolayer of the perylene-derivative MePTCDI on two-dimensional materials. On the wide band-gap insulator hexagonal boron nitride it shows strong emission from the collective state with a line width that is dominated by the inhomogeneous broadening of the molecular state. When using the semimetal graphene as a substrate, however, the luminescence is completely quenched. By combining optical absorption, luminescence, and multi-wavelength Raman scattering we verify that the MePTCDI molecules form very similar collective monolayer states on hexagonal boron nitride and graphene substrates, but on graphene the line width is dominated by non-radiative excitation transfer from the molecules to the substrate. Our study highlights the transition from the localized molecular state of the monomer to a delocalized collective state in the two-dimensional molecular lattice that is entirely based on Coulomb coupling between optically active excitations of the electrons or molecular vibrations. The outstanding properties of organic monolayers make them promising candidates for components of soft-matter optoelectronic devices.
keywords:
American Chemical Society, LaTeXIR,NMR,UV
Highly ordered lattices of perylene derivatives or other flattened organic molecules on surfaces are intriguing systems to study molecular interactions, the interaction between molecules and substrates, light-matter coupling, and the emergence of collective molecular states.1, 2, 3, 4, 5 The coupling between the transition dipoles of many non-covalently bound molecules leads to collective states with short life times, high emission rates, and narrow line widths.6, 3, 7 Of particular interest are the optically active excitonic transitions in such two-dimensional (2D) molecular lattices that occur in the visible and near ultra-violet energy range. Their collective excitation is typically red-shifted compared to the monomer transition with a vanishing Stokes shift between the excitation and emission energy.8, 3, 6 The bright light emission may be exploited in optoelectronic devices that will be tunable by molecular synthesis as well as by changes in the monolayer environment.3, 8
The Coulomb coupling of molecular transition dipoles is an interesting model to study the transition from localized molecular excitations to collective 2D states that are delocalized in space or the emergence of 2D Frenkel excitons, that were introduced in the framework of organic crystals.9, 10, 11, 12, 3 Collective molecular excitations, however, also resemble the formation of collective plasmons in monolayers of metal nanoparticles and 2D arrays of atoms in optical lattices.13, 14, 15, 16, 17 Molecular monolayers occupy a unique parameter space for such artificial 2D systems: The lattice constants of molecular monolayers are on the order of 1 nm, which is much smaller than for plasmonic (10 nm) and optical lattices (100-1000 nm) allowing a translational periodicity that is two orders of magnitude smaller than the wavelength of light. The effects of energetic disorder and of the lattice environment are typically neglected in plasmonic and atomic 2D lattices, because the structures are either very precisely controlled and isolated or are large enough to be less sensitive to imperfections.18, 19 This situation is very different for molecular lattices. Molecular transitions show strong inhomogeneous broadening in ambient environments ( 10% of their transition frequency) resulting in lattices that are composed of different transition dipoles. Molecular self organization during growth is mainly driven by weak intermolecular forces and by the interaction with the substrate making molecular 2D lattices potentially more prone to disorder than plasmonic structures and optical lattices.20, 21 The presence of the substrate screens dipole coupling and may quench excited molecular states providing a strong non-radiative decay channel.22, 23 The question arises how robust collective states are against spatial and energetic disorder and how quenching affects its formation, energetic position, and line width.
Here, we study collective molecular states in organic 2D lattices of perylene-derivatives on different 2D materials. Using a microscopic theory of collective dipoles, we explain our experimental observations and examine the dependence of the collective state on homogeneous and inhomogeneous broadening. Experimentally we realize 2D molecular lattices by growing N,N’-Dimethyl-3,4,9,10-Perylentetracarboxylicdiimide (MePTCDI) on multi-layer hexagonal boron nitride (hBN) and few-layer graphene, where it forms a 2D square lattice. On hBN, the collective MePTCDI state shows a red shift of 60 meV and 60% reduction in the full width at half maximum (FWHM) compared to the monomer transitions, which agrees with the microscopic description. We show that the collective state is also present on graphene as a conductive material although light emission is quenched by five orders of magnitude, but it manifests in optical absorption and as a resonance in the Raman response. Using a microscopic model of collective dipoles we show how the energetic position of the collective eigenstate depends on the number of interacting molecules, their properties, and packing density. The state is robust against molecular quenching and variations in position and transition frequencies. These factors lead to a broadening of the collective state but little or no shift in its peak position.
1 Results and Discussion
1.1 Theory of Collective Molecular Excitations
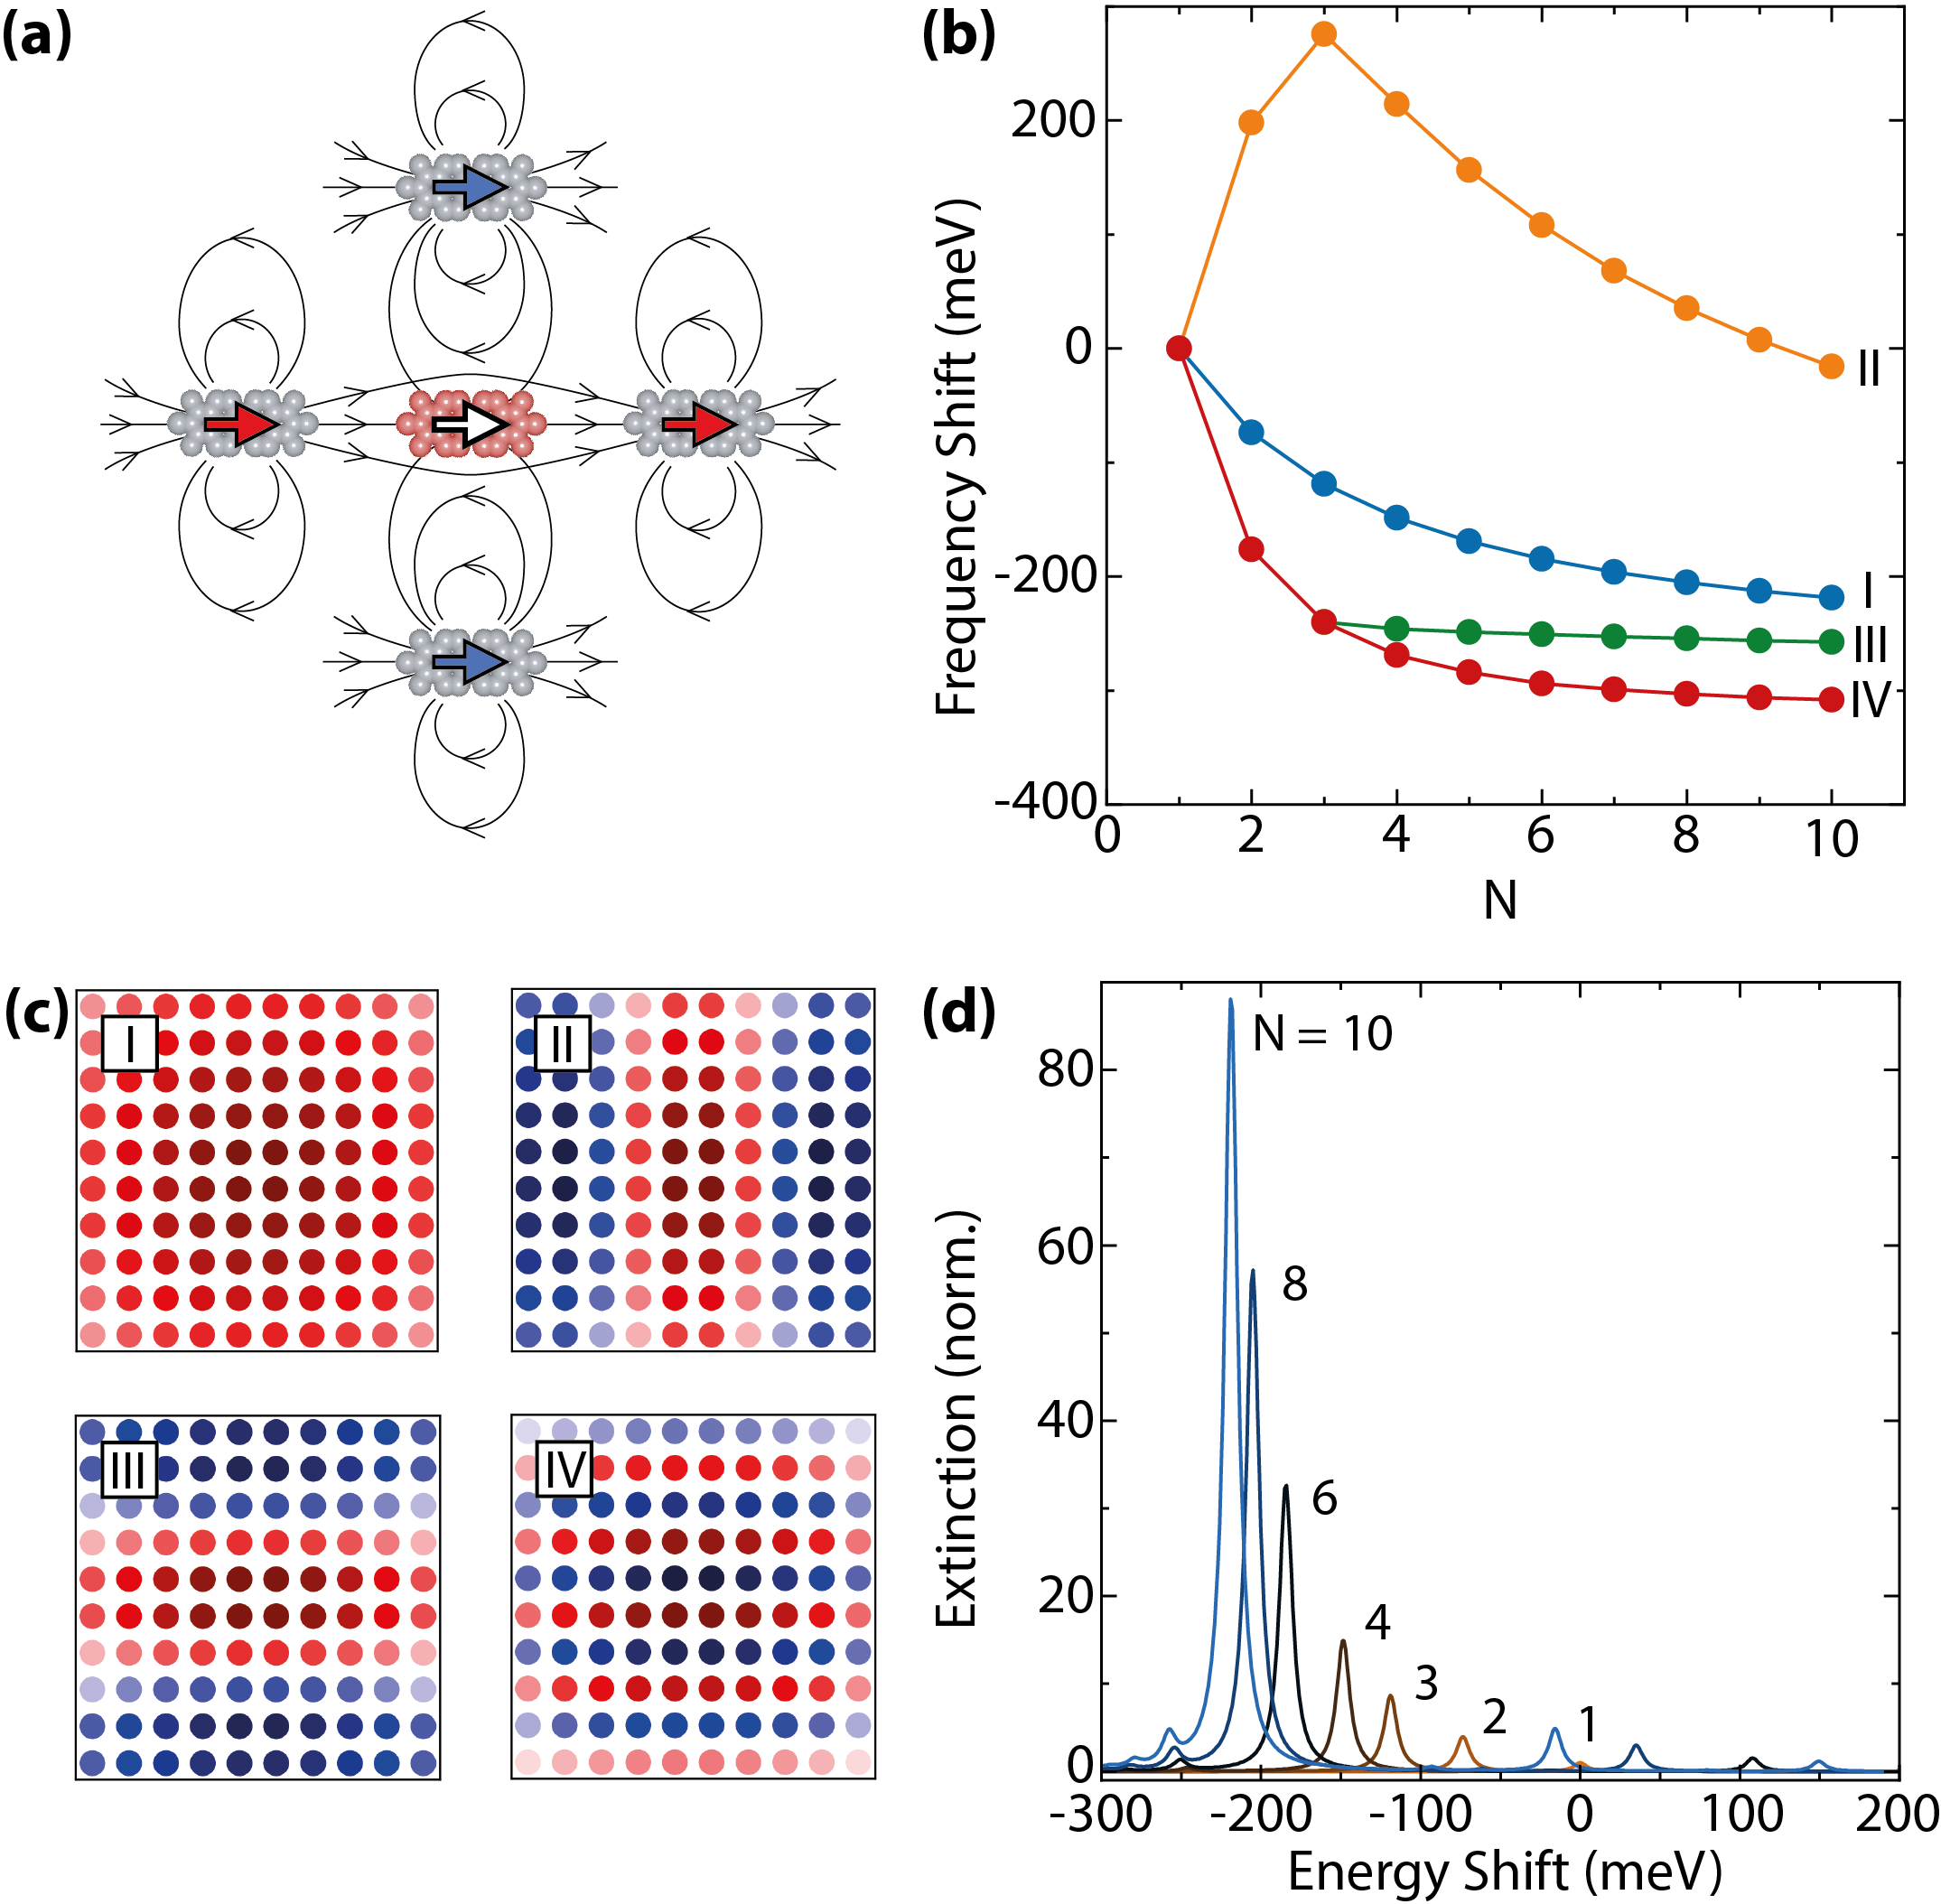
Collective states in molecular dimers and small aggregates are a well-known phenomenon for molecules in solution, where they arise from stacking and alignment of molecular transition dipoles.24, 11, 6, 25 A molecular dimer with a head-to-tail configuration of its transition moments has a red-shifted transition energy (-aggregate) and shows the characteristic optical properties of a superradiant state that has a larger transition moment than the monomer.3, 26 The side-by-side configuration, in contrast, results in a blue-shift of the optically active state (-aggregates), and increases the difference between absorption and emission spectra (Stokes shift).27 The concept of pure and configuration is easily extended from a dimer to one-dimensional molecular chains, but not to 2D lattices that necessarily combine head-to-tail and side-by-side arrangements, see Fig. 1a for a sketch considering the nearest neighbors of a molecule. Sometimes the 2D configuration is called an -aggregate or is extended to the intermediate -aggregate that includes other types of interactions in addition to dipole-dipole coupling.12, 25, 26, 28, 29
To model collective molecular states in 2D systems we consider a finite 2D arrangement of molecules that interact through their transition dipole moments.30, 31, 32 We use a real space model for its ability to describe any arrangement of dipoles in space without imposing, e.g., translational symmetry. Each molecular transition is represented by a point dipole induced by the field with the polarizability
| (1) |
where is the driving frequency, the molecular transition frequency, its spectral broadening, and the transition dipole moment. Each individual dipole interacts via its electric field with all other transition dipoles. The interaction changes the dipole moment at each lattice site and gives rise to collective dipolar eigenmodes with polarizability , see Methods for details. The individual polarizability is replaced by the collective lattice polarizability 32
| (2) |
The collective transitions are shifted in frequency by compared to , where is the complex eigenvalue of the Green’s tensor describing the near- and far-field dipole-dipole coupling, see Methods. In addition, the decay constant is increased by , which is the characteristic increase in the emission rate, observed in molecular aggregates. The collective response of the molecular lattice can be measured experimentally by the extinction and compared to a calculated extinction coefficient that depends on the sum over , see Methods for details. Supplementary Figure 1 shows dipole chains (1D) of increasing length as calculated with the microscopic dipole model reproducing the well-known frequency shifts of pure - and -aggregates.
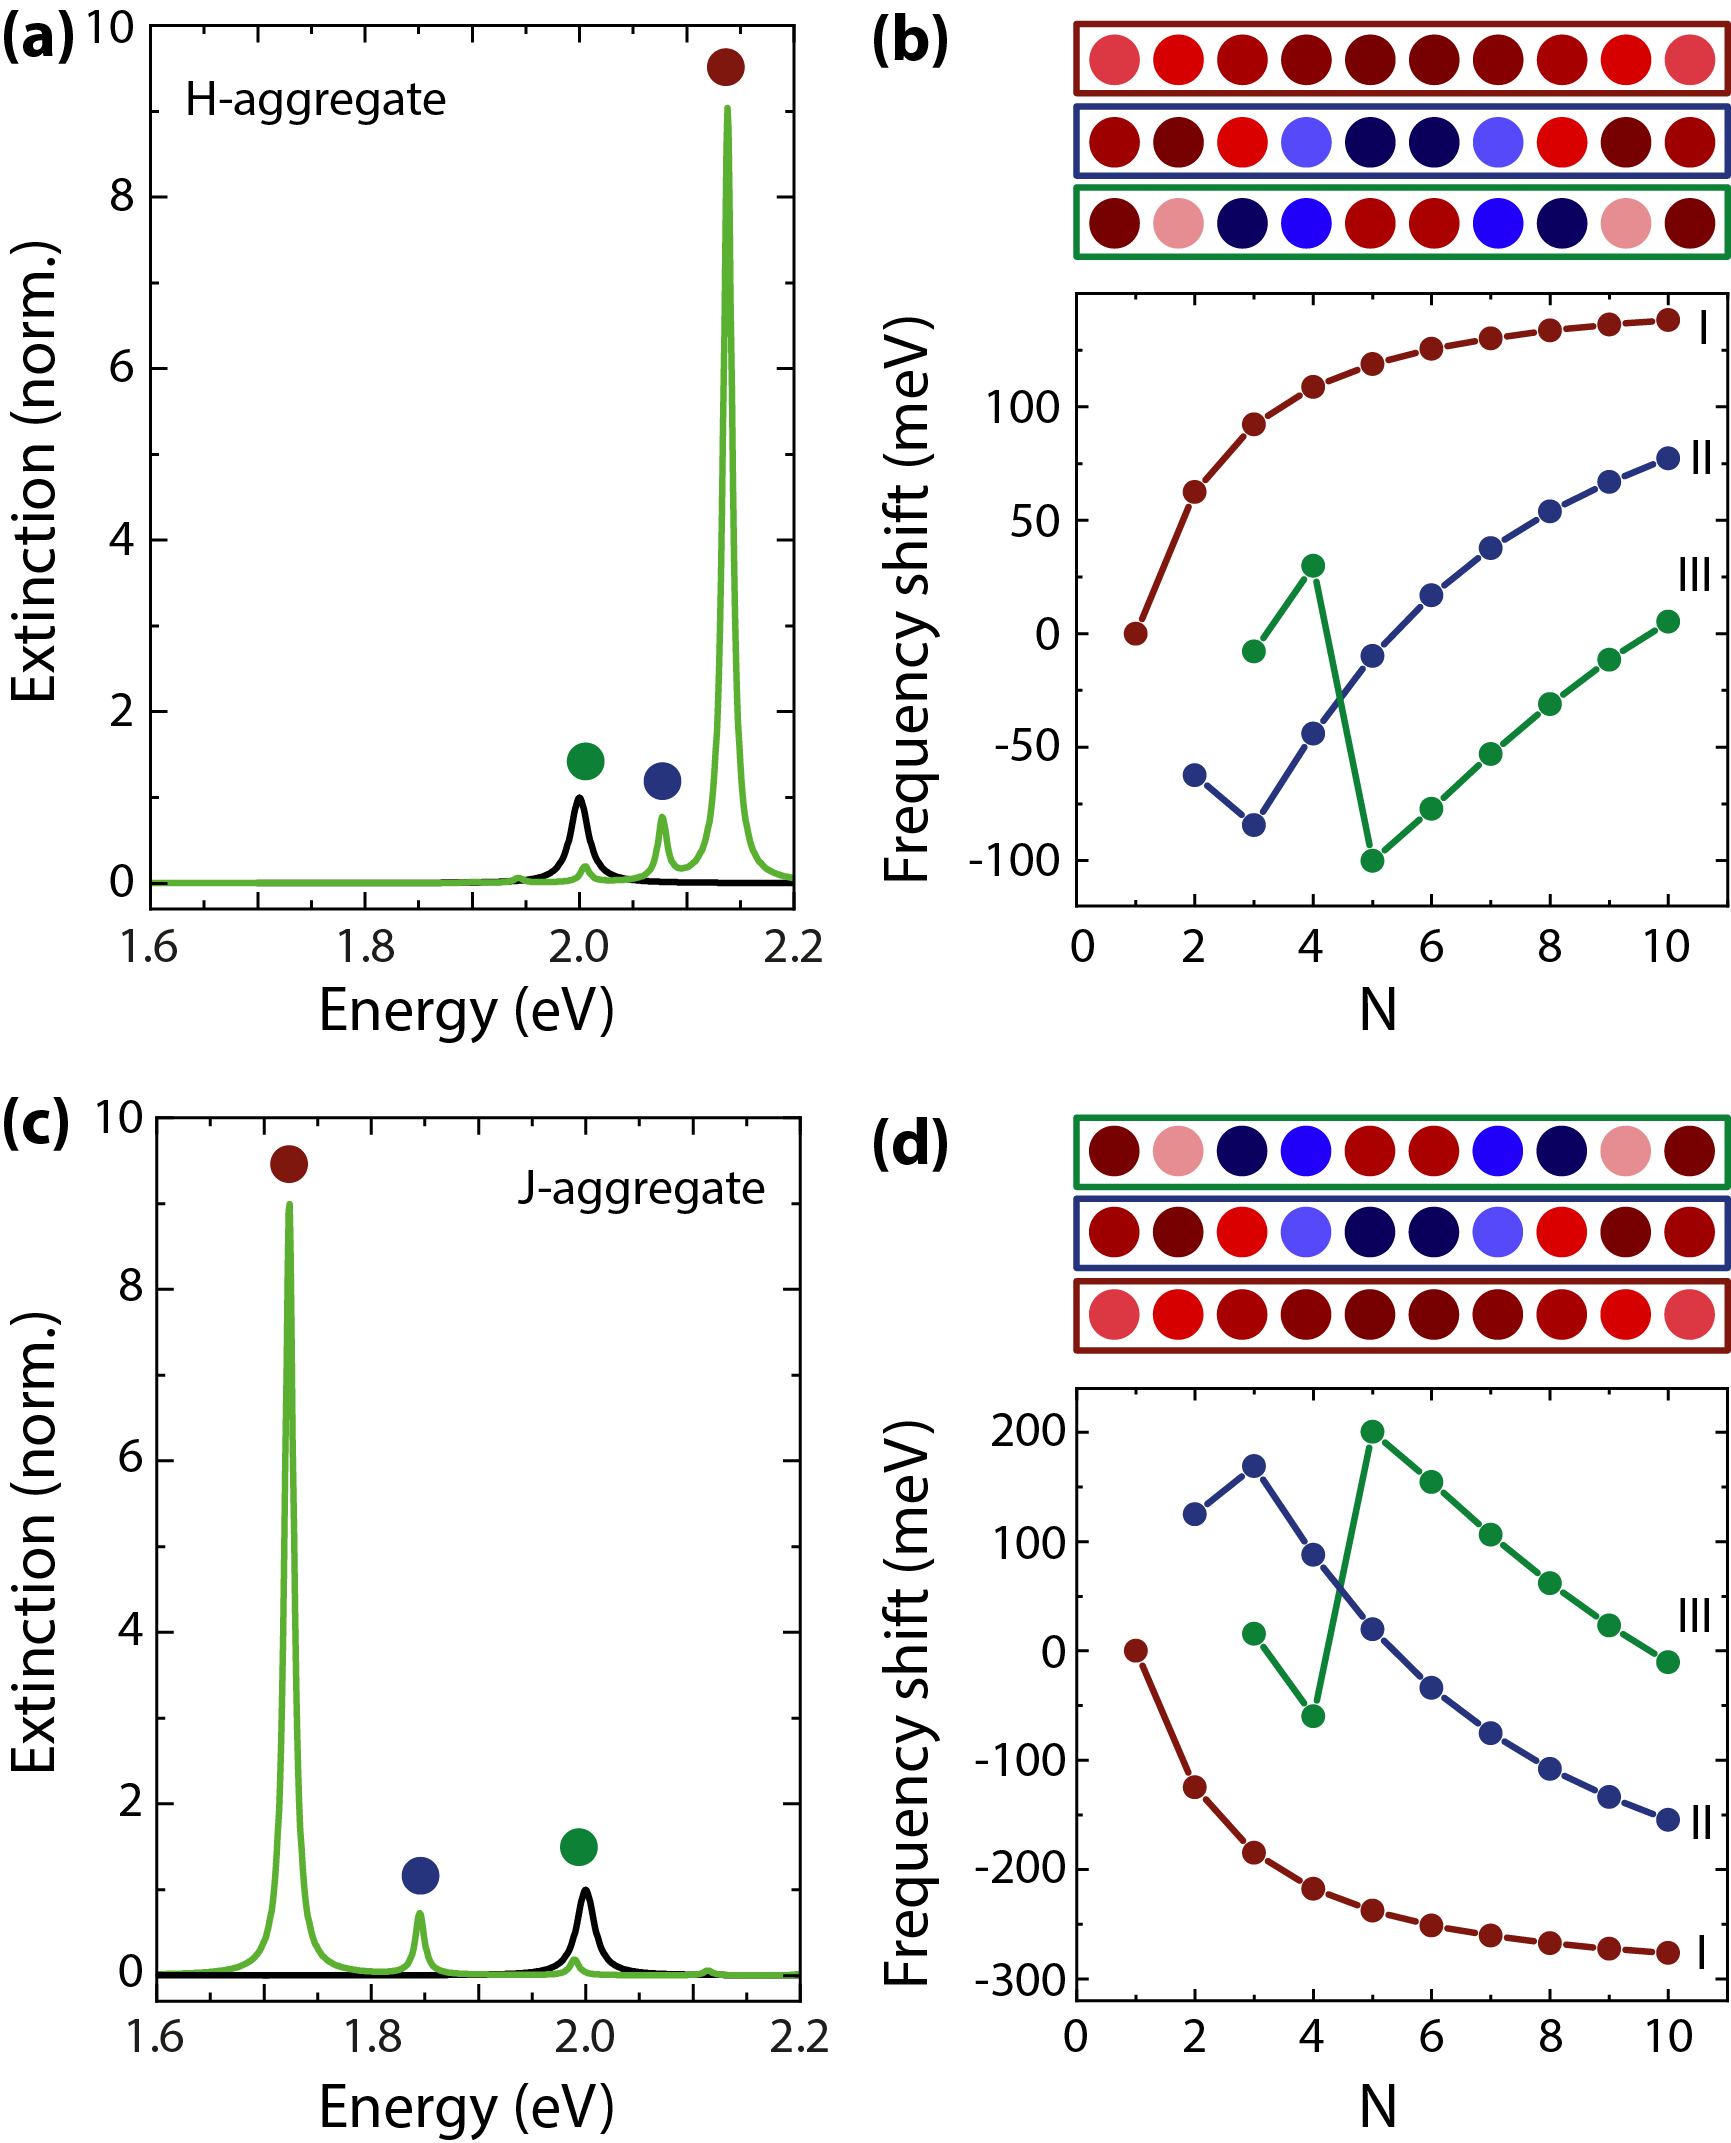
In Fig. 1b we show the shift in the energy of selected collective states in an square lattice. The absolute magnitude of the shift depends on the collective eigenvector, the individual transition dipoles, the packing density, lattice size and type, and dielectric screening. The eigenenergies shift with but for most modes saturate for 100 dipoles in the finite lattice (), Fig. 1b. The eigenmode with the strongest dipole moment, eigenvector I in Fig. 1c, has all dipoles oriented parallel resulting in a maximum shift of 200 meV or 10% of the transition frequency. The mode with the second strongest dipole moment corresponds to an anti-bonding configuration with three stripes of dipoles that are aligned side-by-side (vector II). For very small lattices it results in a strong blue shift of the collective state, because of the purely repulsive nearest-neighbour interactions for and . With increasing lattice size (), the dipole-dipole coupling along the direction becomes partly attractive (parallel dipoles along ) and partly repulsive (antiparallel along and parallel along ). The frequency shift of eigenvector II converges towards zero for larger since all attractive and repulsive contributions cancel approximately. Interestingly, eigenvector III with a corresponding pattern varying along the axis has a red shift of meV, Fig. 1b, i.e., higher than for the perfectly parallel dipoles in eigenvector I. When all dipoles oscillate in-phase along the coupling is attractive for dipoles along the oscillation direction but repulsive perpendicular to it, Fig. 1a. Modes with anti-parallel stripes of dipoles perpendicular to the oscillation direction, therefore, have a stronger binding contribution and a larger frequency shift. The mode with the highest energy shift, eigenvector IV, has single lines with alternating polarization direction resulting in the configuration with the strongest bonding character along the lines and perpendicular to them. This means that for this 2D square lattice the excited state with the lowest energy is dipole forbidden and luminescence needs to be activated thermally.12
Absorption and emission of the perfect 2D dipole lattice is dominated by a few bright modes, while the majority of the eigenvectors are dipole forbidden.4 Eigenvector I has a dipole moment of 94 D, which increases its radiative decay by a factor of 88 compared to the individual dipole (). For mode II and III the increase amounts to a factor of five and two, respectively. The increase in the radiative decay by approximately is known as the Dicke superradiance 33 that arises from the collective emission of many molecules. While the rate of spontaneous emission increases for specific modes in Fig. 1c, the overall integrated intensity remains the same for arrays of coupled and uncoupled dipoles. The absorption or extinction spectrum of the 2D lattice is governed by the total response of all collective eigenstates resulting in a single dominant peak at the energy of the collective mode with the strongest dipole moment, Fig. 1d. The integrated intensity of the extinction peak follows . This means that the extinction spectrum of a 2D lattice is of similar intensity for coupled and uncoupled transition dipoles, because individual dipole intensities have an overall extinction through the sum of all uncoupled contributions. Nevertheless, the peak position is a clear fingerprint for a collective state.
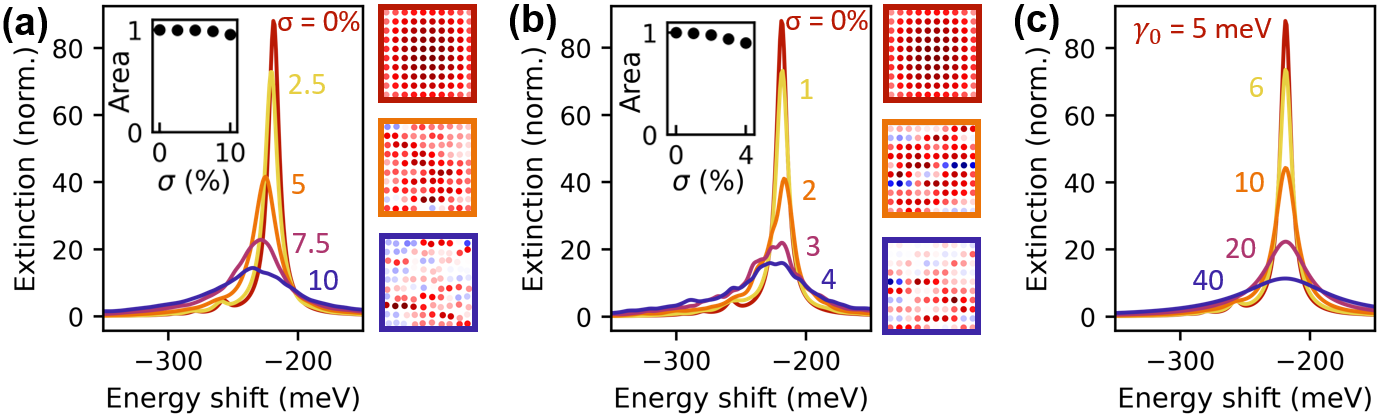
The formation of the collective 2D state, its energetic position, and even the intensity of the extinction spectrum are surprisingly robust against spatial disorder and inhomogeneous broadening of the molecular transition as we show now with our real space simulations, Fig. 2.31 We first consider spatial disorder that may arise from variations of the dipole positions so that the dipole monolayer deviates from the perfect 2D lattice. We model this by varying the dipole positions in the plane around the sites of the perfect lattice, where is obtained through random sampling from a multivariate Gaussian distribution. To account for the large sample area that is typically probed in experiments we averaged the extinction spectrum over several random lattices, Fig. 2a. Disorder increases the width and decreases the maximum intensity of the extinction spectrum, but the peak area remains within 95% of the original intensity for a standard deviation of , inset in Fig. 2a. Collective states continue to form despite the spatial disorder, but the delocalized eigenvectors of the perfect lattice become more localized with disorder, right panels in Fig. 2a. The frequency shift of the collective excitation increases slightly in the disordered lattice, Fig. 2a, because the dipole-dipole interaction scales with .34 A (random) decrease in the dipole distance causes a larger red shift than the blue shift induced by the corresponding increase in dipole distance.
Another source of disorder is inhomogeneous broadening or fluctuations in the transition frequency from one dipole to the next. For most dye molecules the luminescence and absorption linewidths under ambient conditions at room temperature ( meV) are dominated by inhomogeneous broadening compared to the much smaller radiative decay constants ( eV). At first sight, this appears to be a more serious distortion for the formation of a collective state that depends on the Coulomb coupling of transition dipoles (or the absorption and emission of virtual photons). However, the collective state remains present despite random fluctuations in excitation frequencies, see Fig. 2b and Methods for details on the simulations. While the dominant collective mode continues to be delocalized in the lattice, it is formed by a subset of dipoles, right panels in Fig. 2b. As for spatial disorder, inhomogeneous broadening has little effects on the integrated intensity (90% intensity for 4% disorder). Although the width of the collective extinction peak increases with the inhomogeneously broadened dipoles, its line width is smaller than expected from the variations in the individual peak positions, an effect that is known as motional narrowing in molecular aggregates.35 We fit the spectra in Fig. 2b with a single Lorentzian and determined the inhomogeneous contribution to the FWHM. The inhomogeneous contribution in the dipole lattice was only 30% of the inhomogeneous broadening for the individual dipoles, because the collective eigenvectors combine dipoles of similar frequency in the formation of the collective state, see right panels in Fig. 2b.
Finally, we show the effect of an additional non-radiative decay channel or homogeneous broadening by varying in Fig. 2c. This additional contribution affects all individual dipoles in exactly the same way and leads to an incerease in the FWHM of the collective eigenmodes. The cooperative frequency shift , on the other hand, depends only on the transition dipole and the geometry of the lattice via . It is independent of as confirmed by the constant peak position in Fig. 2c.
To summarize, we simulated a molecular monolayer by a square lattice of interacting transition dipoles in real space. The interaction between the molecules leads to collective eigenstates that give rise to a strong red shift of the predicted excitation frequencies. This process is robust against spatial and energetic disorder, because of the strong dipole-dipole coupling in the tightly packed molecular layers. We also find that an increase in non-radiative decay will not affect the collective frequency that for a perfect lattice depends only on the individual transition frequency, the strength of the transition dipole, the 2D lattice type, its lattice constant, and the screening by the environment. We now realize such 2D molecular lattices experimentally to study the collective states by optical spectroscopy.
1.2 Growth and Structure of MePTCDI Monolayers
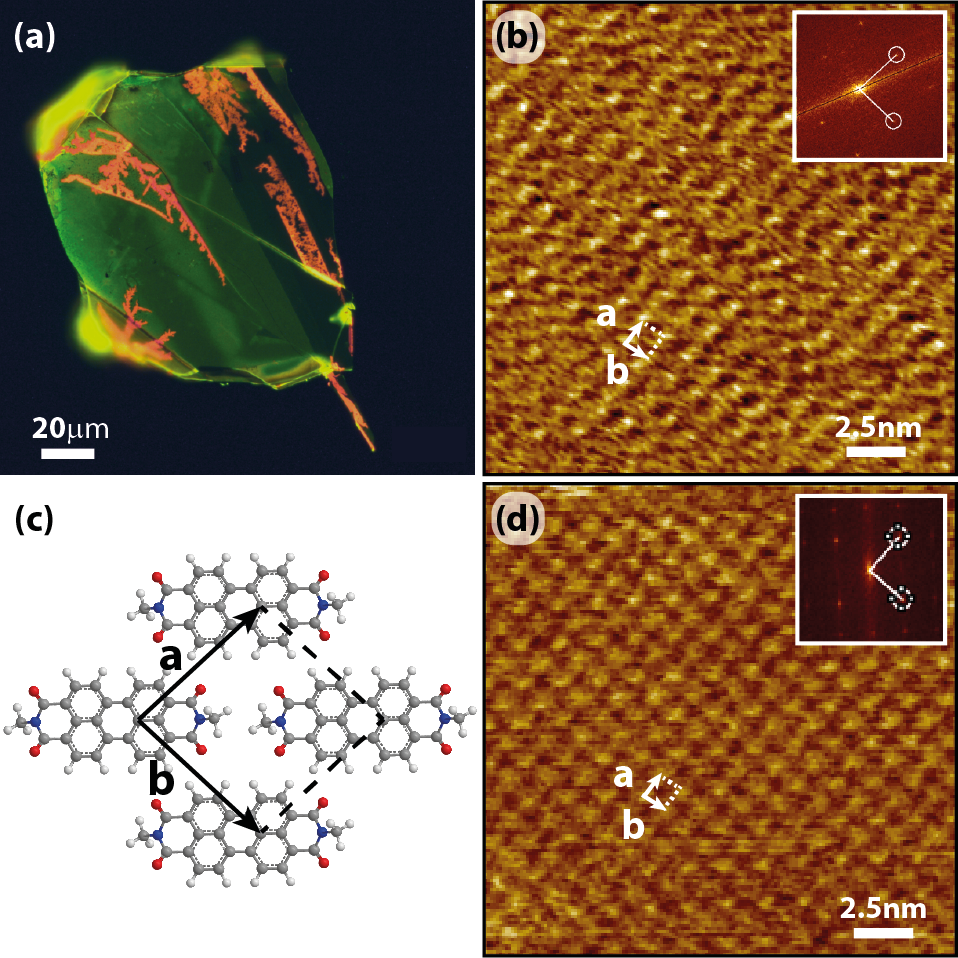
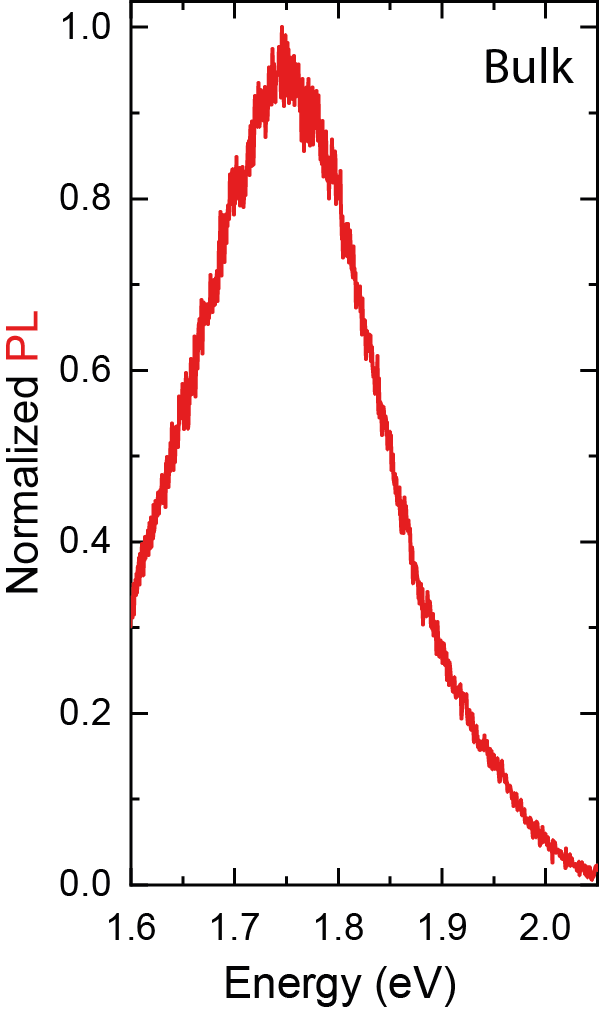
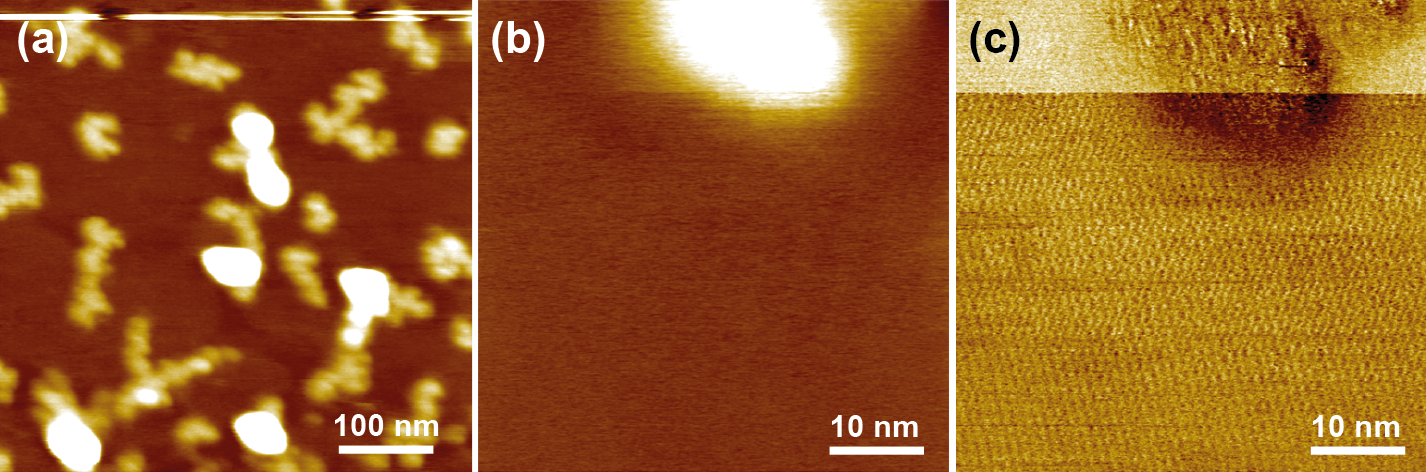
Monolayers of MePTCDI were grown on multi-layers of hBN as an insulating and few-layer graphene as a conductive substrate, see Methods. MePTCDI is a planar dye molecule that belongs to the perylene family with a conjugated -system, see molecular structure in Fig. 3c. It was previously shown to form micron-sized monolayers on atomically flat hBN.3 We initially characterize the MePTCDI structure on hBN with fluorescence microscopy and high-eigenmode tapping mode atomic force microscopy (AFM), see Fig. 3a and Supplementary Fig. 2.36 Figure 3a shows a multi-layer hBN flake with MePTCDI molecules on top that were deposited by physical vapor deposition, see Methods. The green luminescence is emitted from an MePTCDI monolayer that arranged non-covalently on the hBN substrate.3 It has an emission maximum at 2.25 eV (551 nm) as we will discuss in detail in the next Section. The monolayer areas dominate the sample in Fig. 3a and account for 84% of the hBN area. The red areas (16%) are molecular aggregates where the molecules stacked in 3D structures and interact via coupling in addition to the Coulomb interaction.3 The agglomerate fluorescence spectrum peaks at 1.75 eV (709 nm), Supplementary Fig. 3, resulting in the red appearance in the fluorescence microscope image.
We determined the structure of the MePTCDI monolayers using high-resolution AFM, see Fig. 3b and Supplementary Fig. 4 for a large scale image at lower resolution. The image shows an almost square lattice with lattice constants ) Å and an angle as determined from a fast Fourier transform (FFT) of the AFM image, see inset. Figure 3c sketches the obtained monolayer structure that corresponds to the so-called brick stone lattice.37 It results from the orientation of the transient molecular dipole moments plus the repulsion of the positively charged oxygen atoms. Dipole-dipole coupling aligns the molecules in a line along their long axis. The next row of molecules is placed in parallel but shifted for maximum distance between the oxygens on neighboring MePTCDI molecules. Multi-layers of MePTCDI form a herringbone structure,3 but the brick stone lattice in Fig. 3b,c has denser packing and is, therefore, favored in the monolayer. The MePTCDI monolayer structure on multi-layer graphene, Fig. 3d, is identical within the experimental error to the one on hBN, Fig. 3b. The substrate had no direct effect on the in-plane structure of the molecular monolayer, which is reasonable because of the similar interaction and coupling strength of aromatic molecules to graphene and hBN.38 The structure of the MePTCDI monolayer is determined by intermolecular interactions via Coulomb coupling and oxygen repulsion; the two-dimensional crystals only ensure the flat arrangement. Due to their structural similarity, the two MePTCDI monolayers are excellent candidates to study how the interaction with the substrates affects the molecular transitions and the formation of collective states.
1.3 Collective MePTCDI Exciton
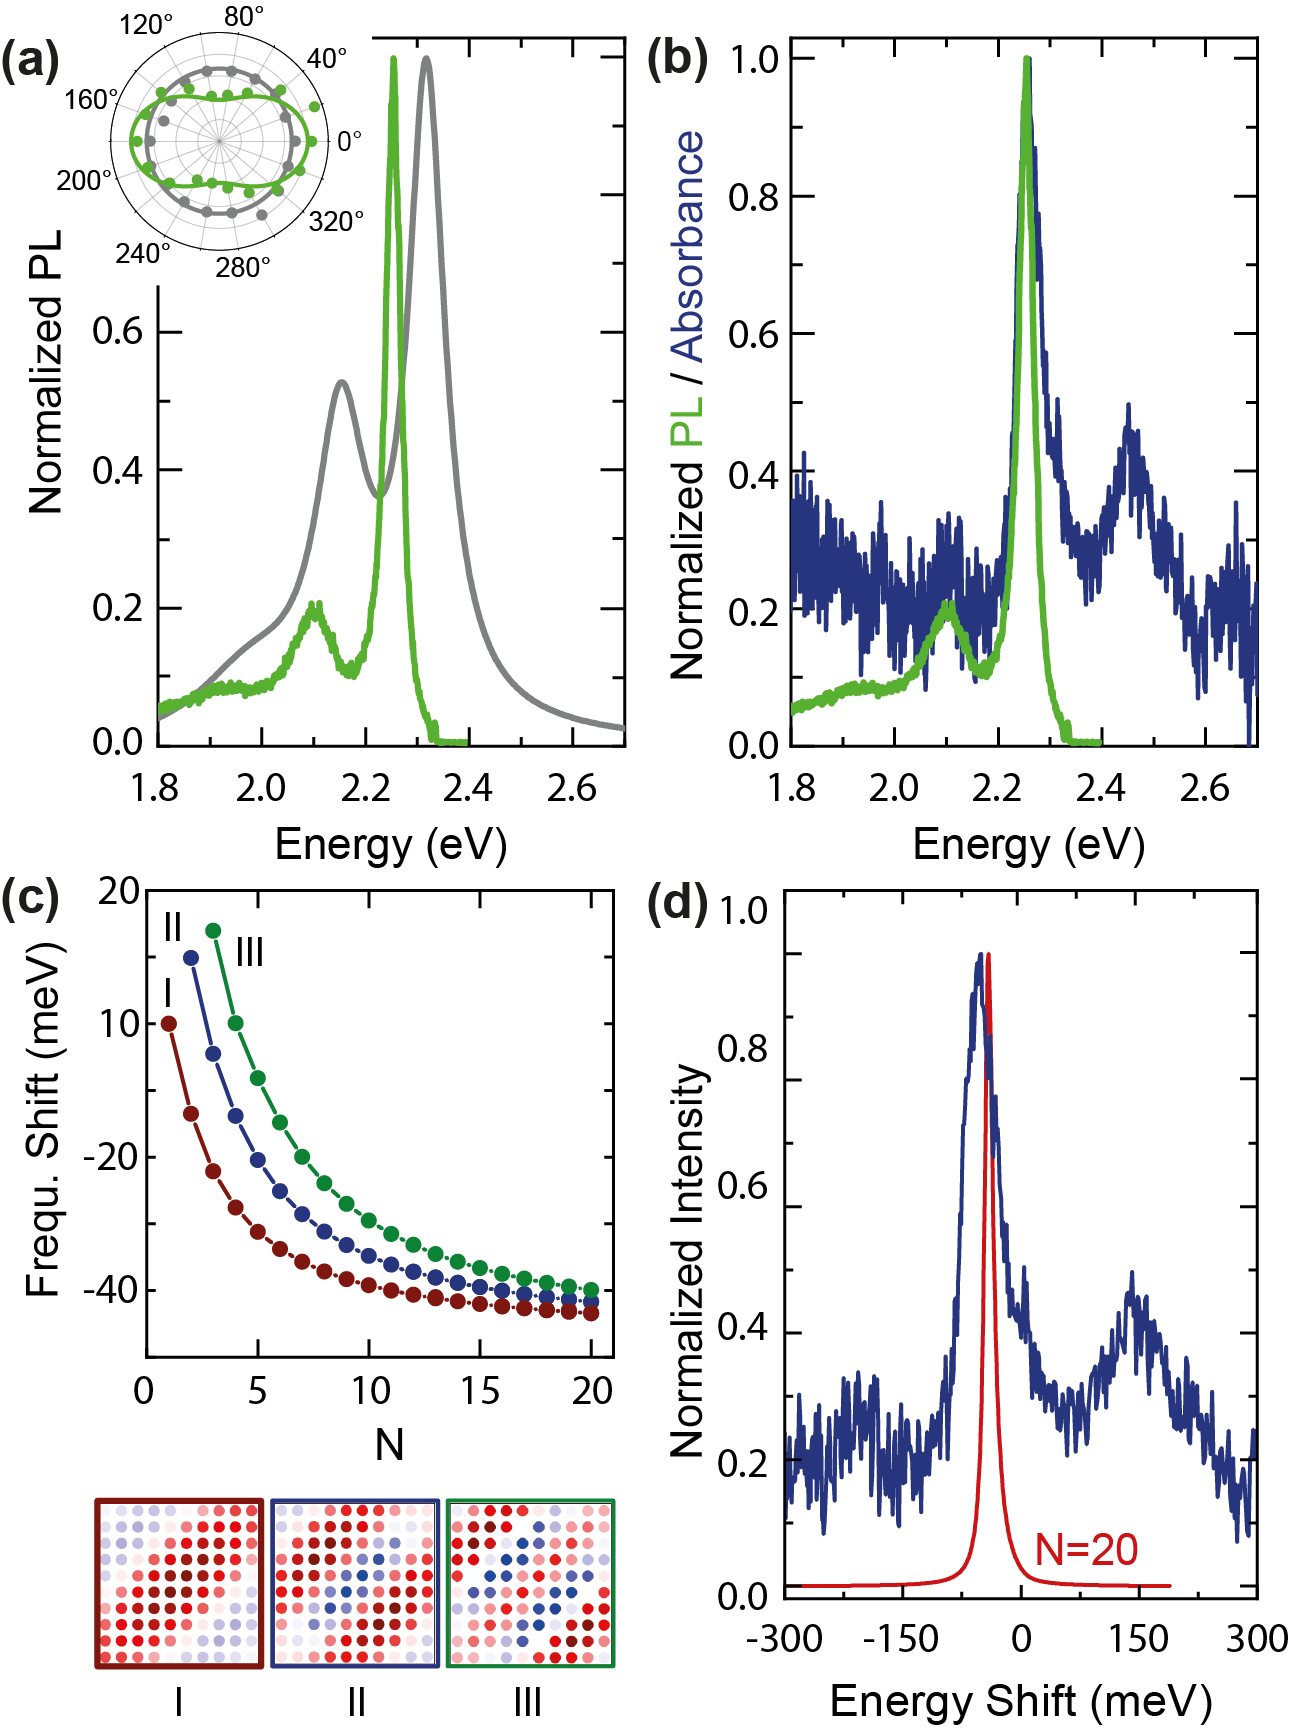
Light absorption and emission from the MePTCDI monolayer at room temperature, Fig. 4, has a strong peak at 2.25 eV, which originates from collective molecular states. It is shifted by 60 meV to smaller energies compared to the monomer (2.31 eV), Fig. 4a. This is in good agreement with Zhao et al..3 The emission is polarized, inset in Fig. 4a, which confirms optically that the molecules form a highly orientated lattice. In addition to the red shift of the emission, we find a vanishing Stokes shift in the monolayer absorption and emission, Fig. 4b. The Stokes shift of MePTCDI is already quite small in solution (60 meV), but the lower flanks of the absorption and emission peak are identical in the monolayer.39 Other signatures of the collective state are the increase in the dominant zero-phonon-line compared to the phonon sideband and the much narrower line width of the monolayer emission compared to the molecules in solution, Table 1.40, 6
We calculated the expected frequency shift for a 2D lattice of MePTCDI monomers with eV, meV, D, and , Fig. 4c,d. The dipoles were oriented at in a square lattice as dictated by the brick stone structure of our experiments, Fig. 3c. In this lattice the eigenmode with the largest frequency shift (eigenvector I) has also the largest dipole moment, Fig. 4c. The luminescence by the MePTCDI lattice is therefore not thermally activated and remains present at low temperature which is in good agreement with prior experiments.3 As the calculated frequency shift we obtain a red shift of 40 meV for the collective MePTCDI state, which is smaller than the experimental shift (60 meV), Fig. 4c,d. However, the simulation has a number of uncertainties: First, the molecules are large compared to their distance, which means that the point dipole approximation is not strictly valid for this configuration. Second, was measured in solution and might actually differ on a solid substrate. Also, we assumed the screening by the hBN substrate to yield an effective background dielectric constant of , which corresponds to half space filling by the substrate and may overestimate the screening within the layer, see Supplementary Information.
The emission spectrum of the MePTCDI monolayer has a narrow line width (FWHM = 36 meV) with a slightly larger width (45 meV) in absorption. The absorption is broader because all states with finite dipole moment contribute to excitation, but light emission occurs predominantly from the lowest-lying optically active states. Despite its narrow appearance, the line width of the collective MePTCDI state remains dominated by inhomogeneous broadening with little contribution from spatial disorder. The FWHM of the monolayer amounts to 40% of the molecular transition in solution, Table 1, in reasonable agreement with the predicted narrowing (30%, Fig. 2b). The dominance of inhomogeneous broadening is also confirmed by time-resolved measurements that reported a lifetime of 30 ps and nearly 100% quantum yield for the monolayer,3 which yields a lifetime limited FWHM eV, i.e., three orders of magnitude below the observed width.
| sample | (eV) | FWHM (meV) |
|---|---|---|
| MePTCDI monomer | 2.31 | 90 |
| MePTCDI/hBN absorption | 2.25 | 45 |
| MePTCDI/hBN emission | 2.25 | 36 |
| MePTCDI/graphene absorption | 2.26 | 96 |
| MePTCDI/graphene Raman res. | 2.26 | 140 |
On graphene the characteristic MePTCDI monolayer emission vanishes. Instead we observe the Raman spectrum of the monolayer, Fig. 5a. The peaks at 1309 cm-1 and 1392 cm-1 correspond to ring stretch modes of the perylene core while the mode at 1588 cm-1 belongs to C=C stretching of the carbon rings.41 We attribute the quenching of the luminescence to a Förster resonant energy transfer that is very efficient, because of the small distance (nm) between a planar dye and graphene, the parallel alignment of the transition dipoles, and the broadband absorption of multi-layer graphene in the visible and near IR. Experimentally, the intensity loss is at least five orders of magnitude or , where is the rate of excitation transfer from the molecule into graphene and the intrinsic molecular decay rate.
To verify that the collective state of MePTCDI exists in the presence of graphene as a strong quenching agent, we measure the excitonic transition by absorption and resonant Raman scattering, Fig. 5b,c. The MePTCDI absorption on graphene has a main peak at essentially the same energy as on hBN but twice its line width, see Table 1 and Fig. 5b. The small shift in the collective frequency between hBN and graphene is explained by the difference in the screening strength. The increase in FWHM implies an additional broadening by a non-radiative channel with meV. Assuming and a lifetime of the MePTCDI transition on the order of 1 ns (Refs. 3, 42) we estimate a relative transfer , which agrees with the intensity loss of the MePTCDI monolayer on graphene.
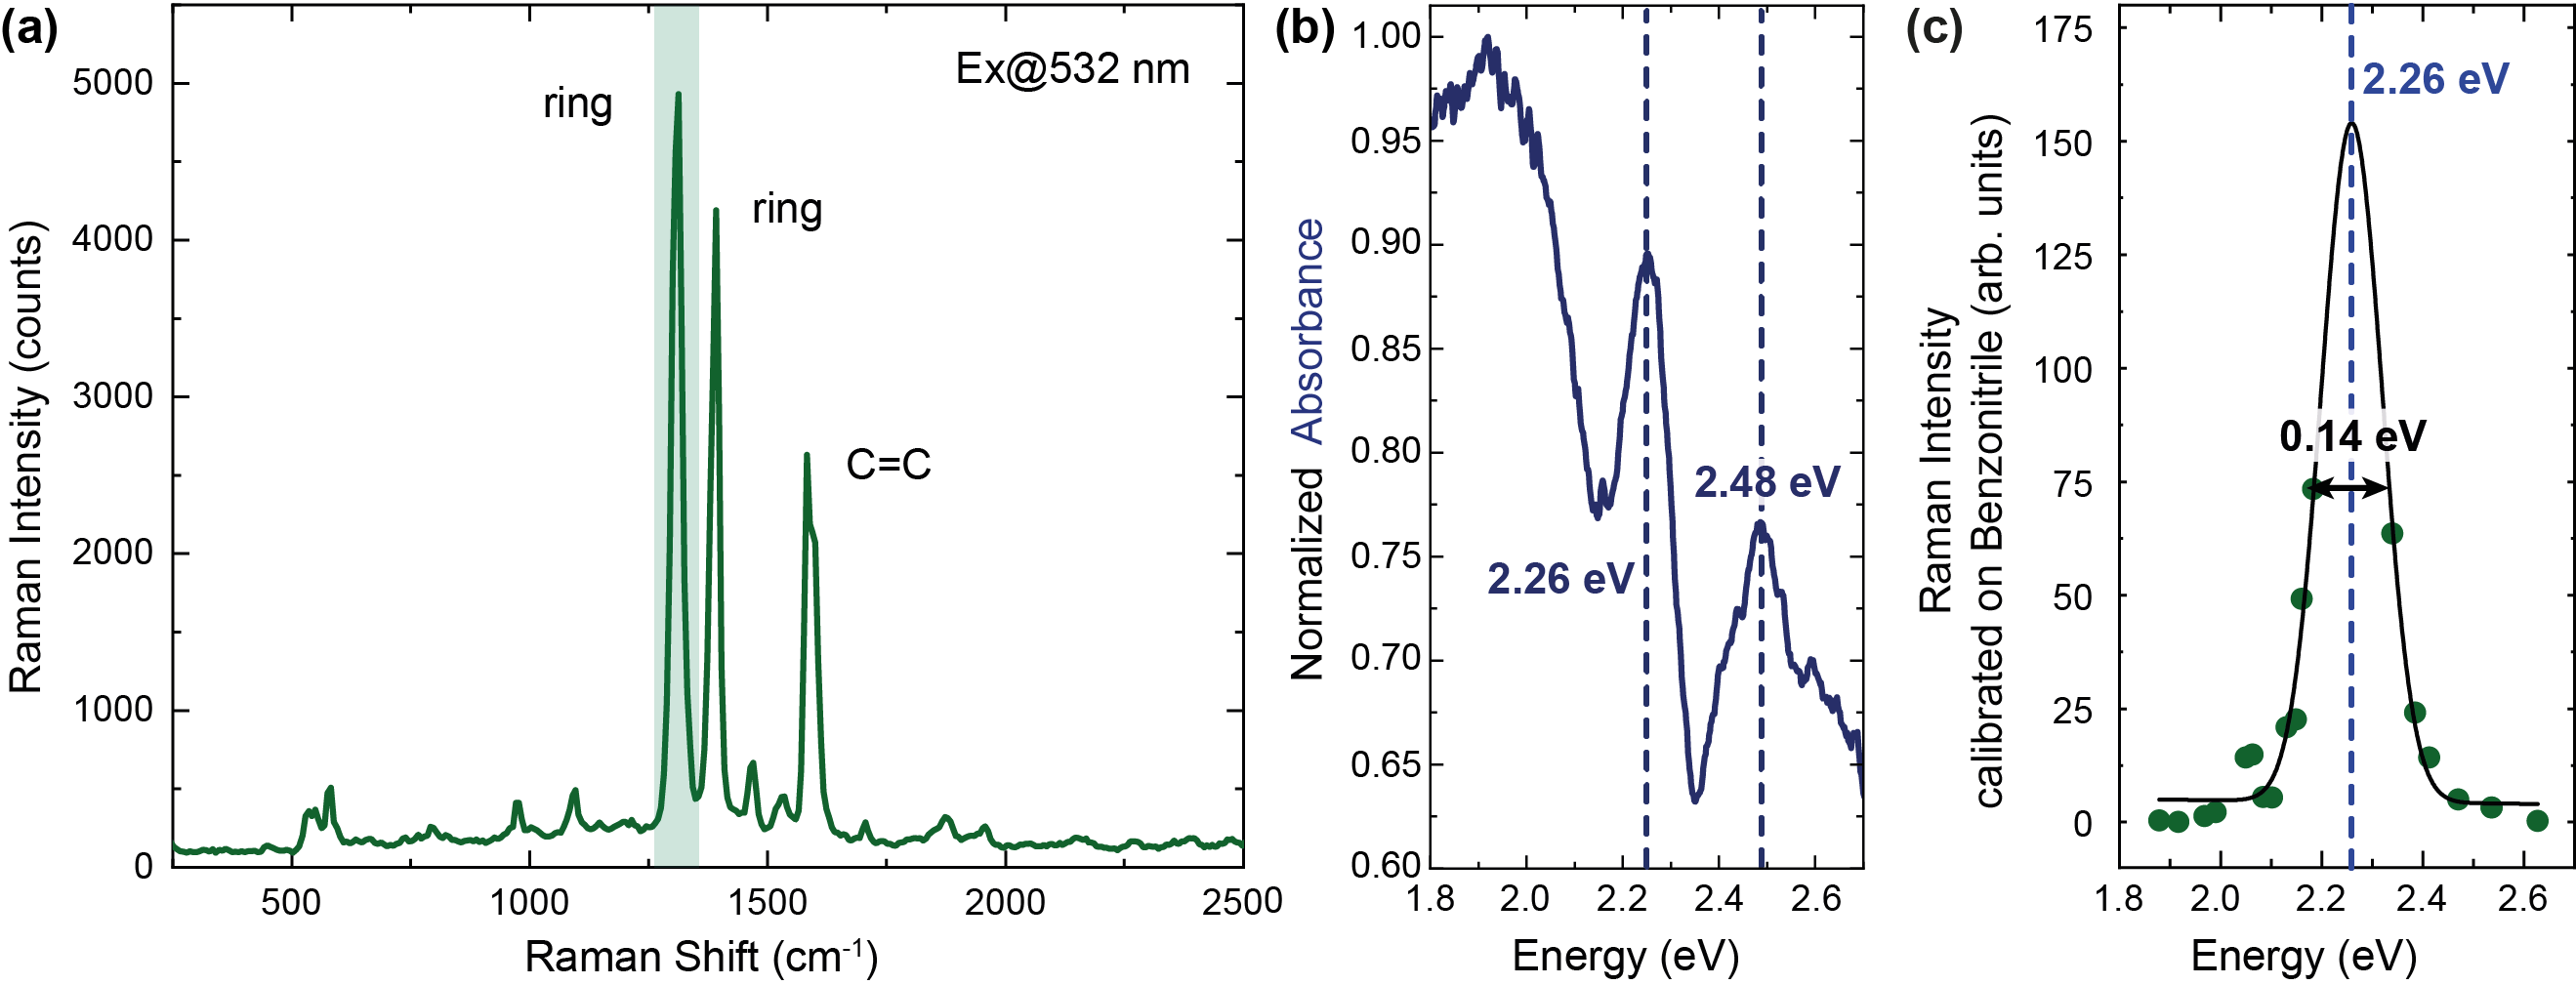
In resonant Raman scattering we determined the integrated intensity of the ring stretch mode at 1309 cm-1 as a function of excitation energy, Fig. 5c. The profile has a maximum at 2.26 eV with a FWHM of 140 meV that corresponds to the incoming resonance with the collective MePTCDI state. We did not observe an outgoing resonance in the profile that is expected at the incoming resonance plus the phonon frequency.43, 44 Nevertheless, the Raman resonance clearly demonstrates that the collective dipole state exists for MePTCDI on graphene, although its emission is suppressed. Independent of the dielectric environment and excitation transfer, the molecular monolayer forms a collective state on flat surfaces. This remains true although in our system the broadening exceeds the coupling-induced red shift of the molecular excitonic transition of the MePTCDI monolayer.
2 Conclusion
In conclusion we studied the transition of a localized excitation in a molecular monomer to a delocalized collective state in a molecular monolayer considering homogeneous and inhomogeneous broadening and spatial disorder. We presented a model based on the point-dipole approximation to calculate the eigenstates of 2D lattices and their extinction spectra. The interaction between the transition dipoles leads to collective states in the lattice and a red-shifted extinction spectrum. The shift depends on the radiative lifetime of the monomer (or the transition dipole) and the packing density of the molecular lattice. We found that spatial and energetic disorder as well as homogenenous non-radiative broadening lead to an increase in the linewidth of the collective state but hardly affect its transition frequency. Due to the strong dipole interaction and the small distance of molecules in a typical 2D lattice, the collective state is very robust. To study the predicted behavior experimentally, we grew monolayers of MePTCDI on multi-layer hBN and few-layer graphene substrates. We observed a brick stone lattice in the monolayer on 2D materials with a single molecule in the 2D unit cell. The collective monolayer state was shifted by 60 meV compared to the monomer transition which occurred on both hBN and graphene. On hBN we observed strong luminescence with characteristic signatures of superradiance like a narrowing of the transition and a vanishing Stokes shift. On graphene, the energy transfer from the MePTCDI molecules to the substrate led to an additional homogeneous broadening of 85 meV, but the collective state remained at the same energy. Our study shows that collective states in 2D molecular lattices are robust against disorder that result in additional homogeneous and inhomogeneous broadening. This paves the way for superradiant devices using soft materials with scalable fabrication techniques and solution-based processing.
3 Methods
Microscopic Model of Collective Dipoles
We describe the excitons of each molecule as point dipoles that are excited by an external electric field .
| (3) |
is the polarizability of each individual dipole, with the driving frequency, the exciton frequency, its spectral broadening, and the transition dipole moment. In a 2D lattice, the individual dipole moments are modified by the coupling to the electric fields of other dipoles (Fig. 1a), which changes the dipole moment at lattice site to
| (4) |
where is a Green function that accounts for near-field and far-field coupling, with
| (5) |
Here , , and is the dielectric screening by the substrate.
We assume that all dipoles oscillate along the same axis and therefore omit vector notation. Following Ref. 32 we write Eq. (4) as , with a coupling matrix that has the general form . The entries of the vectors and stand for each lattice site. To understand the collective behavior, we use an eigenmode expansion
| (6) |
with the complex eigenvectors and eigenvalues of . The collective polarizability
| (7) |
is given by the polarizability of each mode. The dipole-dipole interaction leads to a frequency shift and broadening of each mode, where are the complex eigenvalues of . The response of the dipole lattice to an external electric field is described by the collective dipole moment
| (8) |
with expansion coefficients defined by a vector decomposition of the electric field . The collective response can be measured experimentally by the extinction of the dipole lattice
| (9) |
For the simulations of the perfect lattice we assumed dipoles with eV, meV, and D. The dipole polarization was along the axis (horizontal in the eigenvector plots of Fig. 1). They were placed in an square lattice with a lattice constant nm. We calculated the eigenenergies, extinction spectra, and eigenvectors for . The simulations for the experimental MePTCDI monolayer used eV and D as measured in solution, see Supplementary Information. The broadening parameter was set to meV. We simulated a lattice with nm and the dipoles oriented at 45∘ to the lattice vectors which corresponds to the brick stone lattice. To account for the dielectric screening by the hBN and graphene substrates we averaged the dielectric contribution by vacuum on top () and by a half space filled with the van der Waals material underneath the MePTCDI layer. With a direction-averaged dielectric constant of we obtain a background dielectric constant for hBN and leading to for graphene.45, 46 This approach is an upper bound for the screening by the environment. A smaller screening would increase the predicted frequency shift due to the formation of the collective state.
For the lattices with inhomogeneously broadened dipole response we modeled the eigenstates and the extinction spectra for 2D lattices in which the individual dipole frequencies vary randomly ; is obtained through random sampling from a Gaussian distribution with standard deviation . As for spatial disorder we report an average over many simulation runs. Average spectra are calculated from 5, 10, 15, and 20 random lattices where the frequencies of individual dipoles vary by , , , and with respect to . Spatial disorder was simulated by varying the dipole positions in the plane around the sites of the perfect lattice, where is obtained through random sampling from a multivariate Gaussian distribution and again averaged over several hundred runs. We performed similar simulations for variations in the dipole orientation (data not shown) with very similar results as for spatial disorder.
Exfoliation & Physical Vapor Deposition
As substrates we used the freshly cleaved van der Waals materials hBN and graphite. They were exfoliated by the standard scotch tape approach onto a quartz wafer, resulting in few- and multi-layers with up to a few micrometer thickness. The out-baking process and the monolayer growth were performed in a tube furnace from Heraeus. After baking out the substrate with the 2D material at 400∘ C for an hour to remove dirt and water residues on the substrate surface, the quartz wafer with the van der Waals material was placed at the end of the furnace where the furnace temperature starts to decrease. The N,N’-Dimethyl-3,4,9,10-Perylentetracarboxylicdiimide (MePTCDI) molecules from TCI were placed in an evaporation boat in the middle of the furnace. Argon flow (100 sccm) and vacuum (50 mbar) ensure that the molecules are transported to the growth substrate. The monolayer growth process took 90 min.
Fluorescence & Raman Measurements
The fluorescence microscopy images are recorded with a Nikon Eclipse LV100 microscope. The microscope is equipped with a Nikon DS-Ri2 camera, a Thorlabs bandpass filter (FLH532-4) and a Thorlabs longpass filter (FELH0550) to filter out the desired wavelengths.
For the detection of the fluorescence and Raman spectra an XploRA (Horiba) Raman spectrometer was used. All fluorescence measurements were performed at 532 nm laser excitation with 25 laser power and an integration time of 0.1 s. The resonant Raman profile was recorded by tuning the excitation wavelength in steps of 10 nm. Therefore we used an Ar-Kr ion-laser (Innova - Coherent) and a continuous ring laser from Radiant Dyes that can be operated with different fluorescent dyes (R6G and DCM) as lasing medium. A 100x objective (NA = 0.9) focused the laser beam on the sample. The Raman scattered light was detected in backscattering configuration by a Jobin-Yvon T64000 spectrometer in single mode (direct path) configuration. To detect the Raman scattered light the spectrometer is equipped with an Andor iDus CCD camera. All Raman spectra were fitted by a Lorenzian line shape. The intensity (integrated area under the peak) was plotted as a function of the excitation wavelength. To account for wavelength dependent changes in the sensitivity of the Raman setup the Raman intensity was calibrated on benzonitrile that has a constant Raman cross section.47, 48 All fluorescence and Raman measurements were performed under ambient conditions.
Micro-Absorbance
The absorption spectra are recorded under ambient conditions with a home built micro-absorbance setup 13, 49 that is equipped with a broadband light source (NKT - FIU 15). The light is guided to an inverse microscope from Olympus where the light is focused by an 100x objective (NA = 0.9) onto the sample. The transmitted light (T) is collected by a second 100x objective (NA = 0.8) and afterwards guided through an optical fiber to an Avantes spectrometer. The reflected light (R) goes through a beam splitter, is collected by a collimator lens that couples the light into a fiber that guides the light to the spectrometer. The absorbance (A) is calculated from the reflection and transmission spectra as A = 100 % - R - T.
AFM Measurements
The AFM images were taken with an Cypher ES atomic force microscope from Asylum Research Oxford Instruments Inc. To remove possible organic contaminations of the tip, the AFM cantilevers were cleaned with argon plasma with Zepto instrument (Diener electronics Inc.) at 50% power for one minute. AFM imaging was performed in amplitude modulation, called also tapping mode. The cantilever (qp-fast, 15 N/m, Nanosensors) was excited in resonance with its third eigenmode around 4.5 MHz with an amplitude of less than one nanometer. Further details of atomic resolution with high-eigenmode tapping mode atomic force microscopy are described in Ref. 36. The AFM cell was at room temperature and was continuously purged with dry nitrogen.
We thank S. Kirstein for a critical reading of this manuscript and useful discussion. This work was supported by the European Research Council (ERC) under grant DarkSERS-772 108, the German Science Foundation (DFG) under grant Re2654/13 and Re2644/10, and the SupraFAB Research Center at Freie Universität Berlin. N.S.M. acknowledges support from the German National Academy of Sciences Leopoldina through the Leopoldina Postdoc Scholarship.
4 Supporting Information
4.1 Simulations of Dipole Chains (1D)
4.2 MePTCDI monolayer Height Determination by AFM
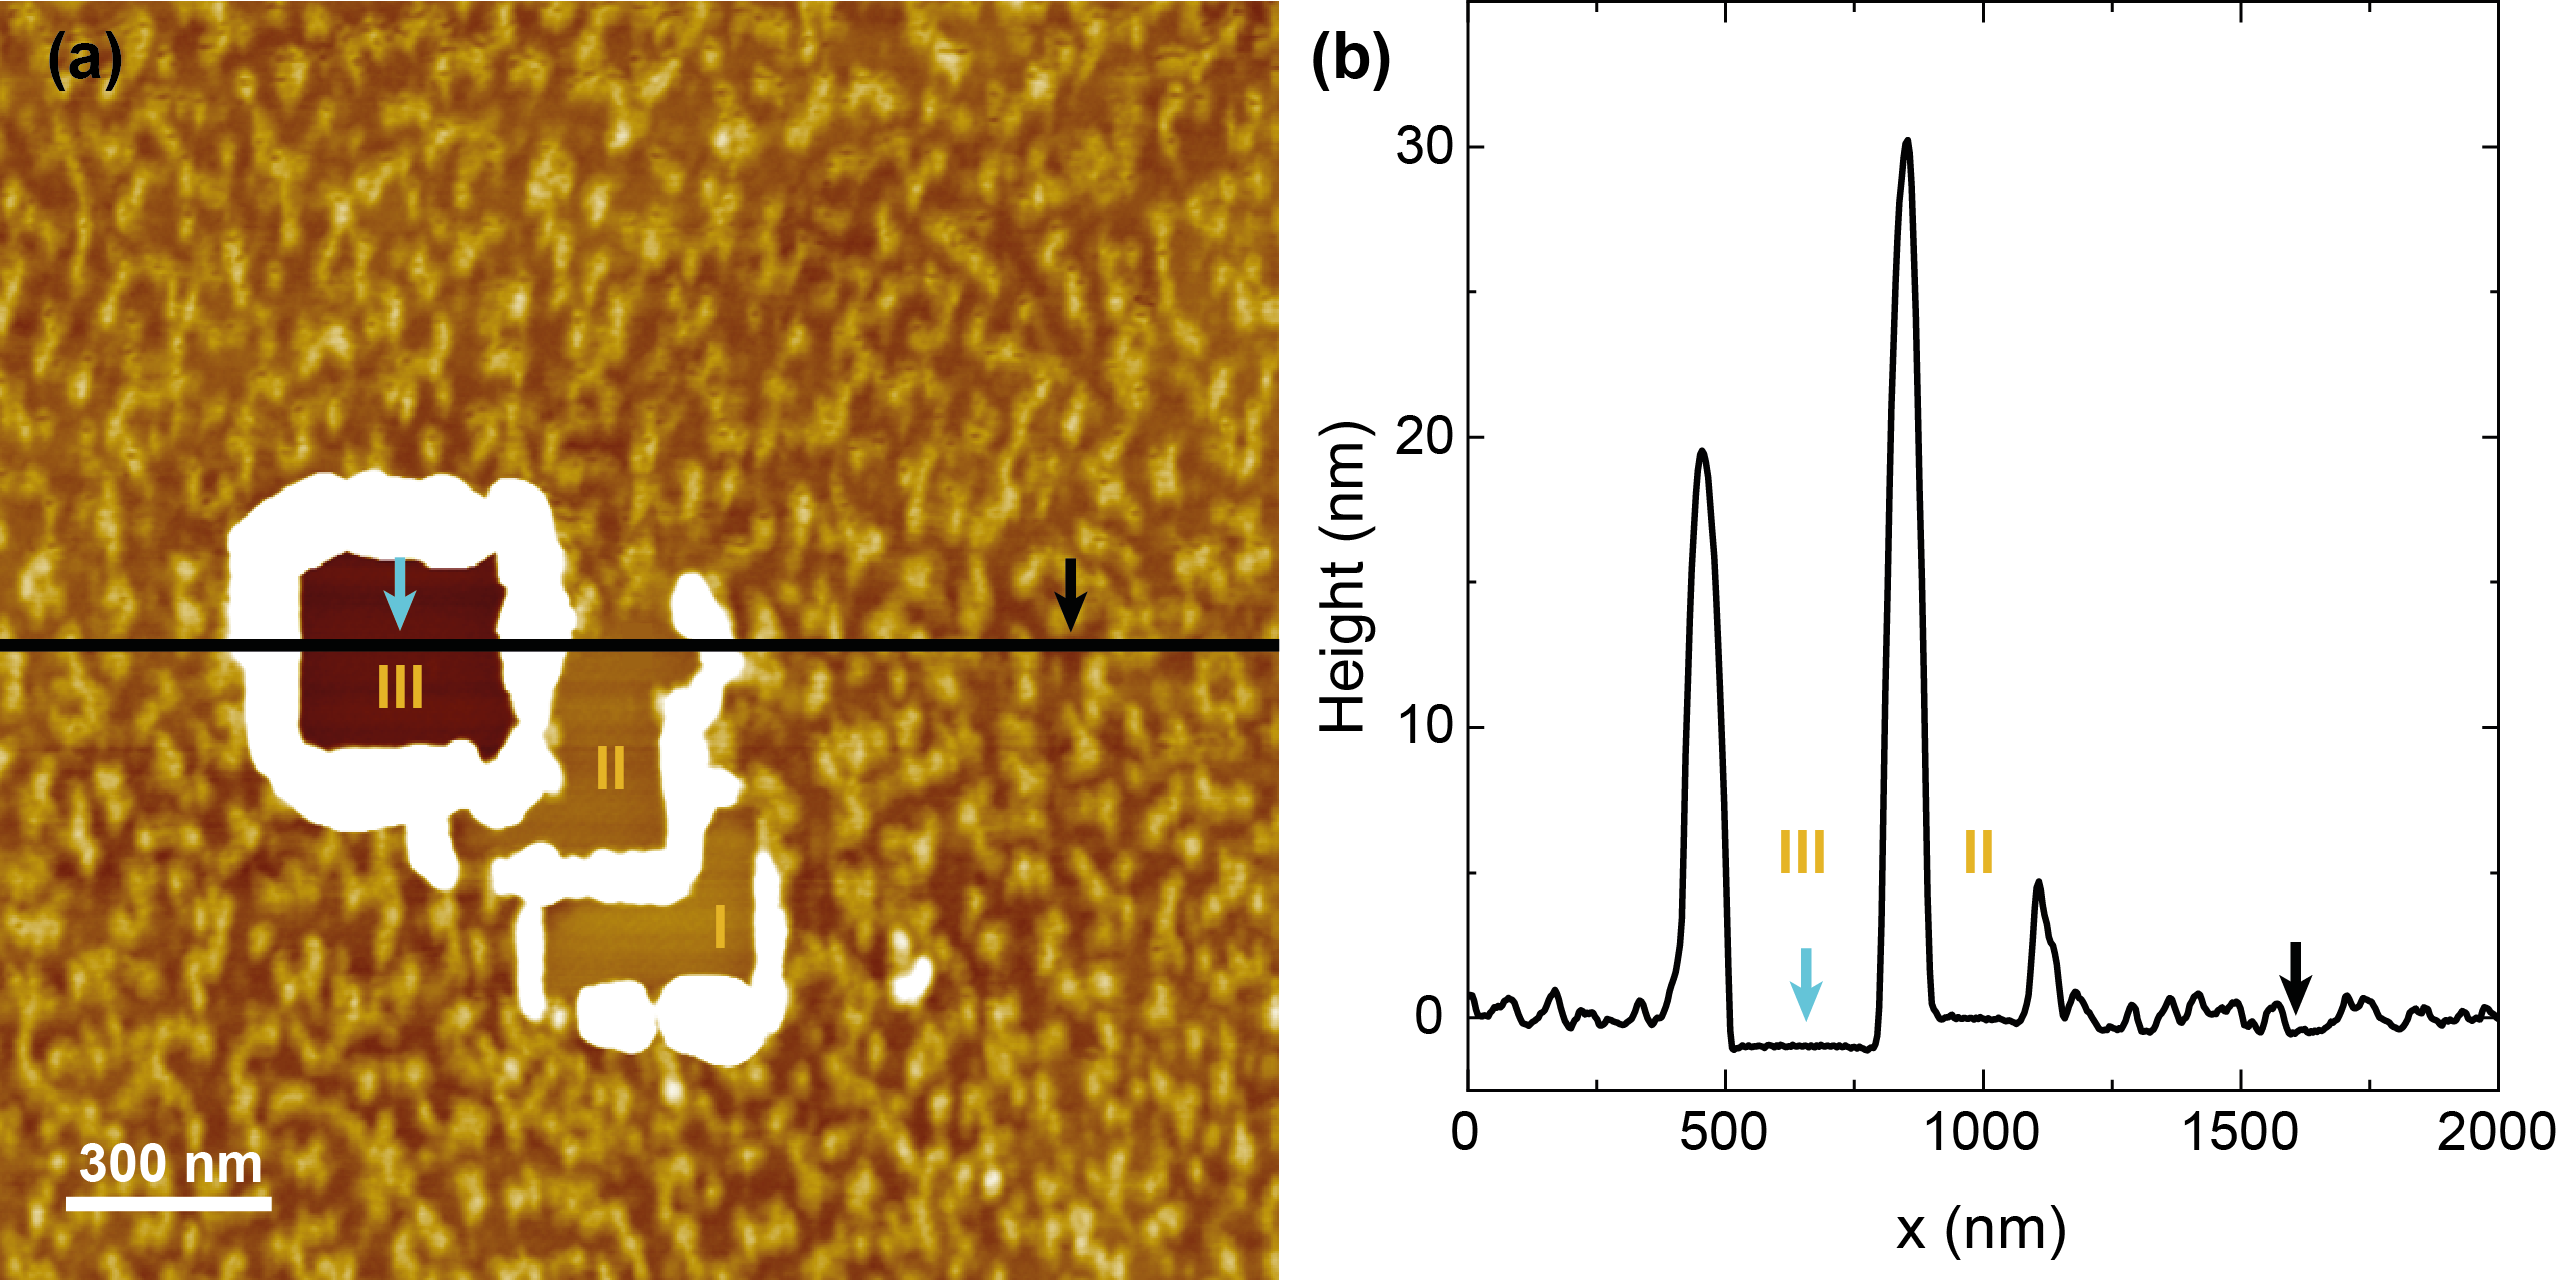
In order to try to assess the thickness of the molecular layer, we attempted to clean a small area with an AFM tip. For this the imaging was switched to contact mode, and a nm2 area was repeatedly imaged. Then the imaging was switched to tapping mode and an large overview image was taken to assess the topography changes produced by the contact mode imaging, Supplementary Fig. 2a. We used 160AC-NG cantilever (Opus by Mikromasch) with spring constant 26 N/m as specified by the manufacturer. While imaging in contact mode with intermediate forces allowed to rub away molecular piles, apparently it did not allow to clean up the molecular layer. Just imaging in contact mode with a rather large force (about 11 N) resulted in reduced height in the imaged area. The height reduction matches roughly the expected height of a molecular monolayer, Supplementary Fig. 2b. The force was calculated assuming the manufacturer specified spring constant, the deflection sensitivity was calculated from a force distance curve acquired on the same sample. Typically forces required to rub away molecular layers are smaller.50 We note that even if the tip removed the top hBN layer, it is not expected that the freshly exposed hBN surface is covered with the molecules. Therefore, the result supports our conclusion on the monolayer thickness of the molecular layer.
4.3 Emission Spectrum of MePTCDI Agglomerates on hBN
4.4 Large Scale AFM Images of MePTCDI on hBN
4.5 Transition Dipole Moment of MePTCDI
To calculate the transition dipole moment ()
| (10) |
the oscillator strength (f) was estimated by
| (11) |
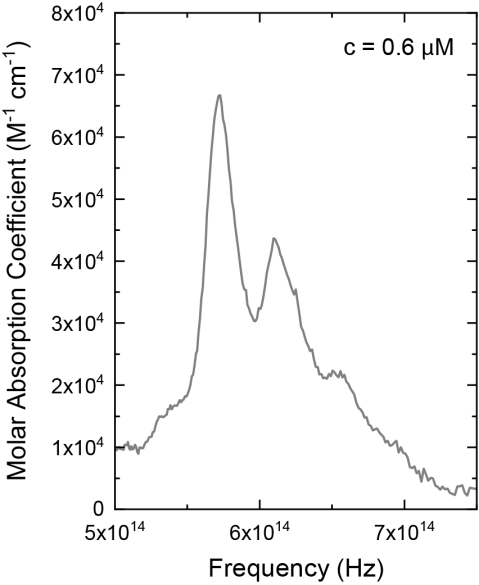
where is the reduced Planck constant, the electric charge, the electron mass, the transition frequency, the speed of light, is the electrostatic constant, the Avogadro constant, and molar absorption coefficient. The in Supplementary Fig. 5 was determined by the absorption of the MePTCDI molecules dissolves in chloroform.
References
- Gómez et al. 1998 Gómez, U.; Port, H.; Wolf, H. Excited-state relaxation of ultrathin MePTCDI films interacting with inorganic substrates. Journal of Luminescence 1998, 76-77, 368–370
- Müller et al. 2011 Müller, M.; Moal, E. L.; Scholz, R.; Sokolowski, M. Exciton and polarization contributions to optical transition energies in an epitaxial organic monolayer on a dielectric substrate. Physical Review B 2011, 83, 241203
- Zhao et al. 2019 Zhao, H. et al. Strong optical response and light emission from a monolayer molecular crystal. Nature Communications 2019, 10
- Würthner et al. 2011 Würthner, F.; Kaiser, T. E.; Saha-Möller, C. R. J-Aggregates: From Serendipitous Discovery to Supramolecular Engineering of Functional Dye Materials. Angewandte Chemie International Edition 2011, 50, 3376–3410
- Alkhamisi et al. 2018 Alkhamisi, M.; Korolkov, V. V.; Nizovtsev, A. S.; Kerfoot, J.; Taniguchi, T.; Watanabe, K.; Besley, N. A.; Besley, E.; Beton, P. H. The growth and fluorescence of phthalocyanine monolayers, thin films and multilayers on hexagonal boron nitride. Chemical Communications 2018, 54, 12021–12024
- Bricks et al. 2017 Bricks, J. L.; Slominskii, Y. L.; Panas, I. D.; Demchenko, A. P. Fluorescent J-aggregates of cyanine dyes: basic research and applications review. Methods and Applications in Fluorescence 2017, 6, 012001
- Mueller et al. 2022 Mueller, N. S.; Arul, R.; Jakob, L. A.; Blunt, M. O.; Földes, T.; Rosta, E.; Baumberg, J. J. Collective Mid-Infrared Vibrations in Surface-Enhanced Raman Scattering. Nano Letters 2022, 22, 7254–7260
- Zhao et al. 2020 Zhao, Y.; Wang, V.; Javey, A. Molecular Materials with Short Radiative Lifetime for High-Speed Light-Emitting Devices. Matter 2020, 3, 1832–1844
- Davydov 1971 Davydov, A. S. Theory of Molecular Excitons; Springer US, 1971
- Kasha 1963 Kasha, M. Energy Transfer Mechanisms and the Molecular Exciton Model for Molecular Aggregates. Radiation Research 1963, 20, 55
- Czikkely et al. 1970 Czikkely, V.; Försterling, H.; Kuhn, H. Light absorption and structure of aggregates of dye molecules. Chemical Physics Letters 1970, 6, 11–14
- Yamagata and Spano 2012 Yamagata, H.; Spano, F. C. Interplay between intrachain and interchain interactions in semiconducting polymer assemblies: The HJ-aggregate model. The Journal of Chemical Physics 2012, 136
- Mueller et al. 2018 Mueller, N. S.; Vieira, B. G. M.; Schulz, F.; Kusch, P.; Oddone, V.; Barros, E. B.; Lange, H.; Reich, S. Dark Interlayer Plasmons in Colloidal Gold Nanoparticle Bi- and Few-Layers. ACS Photonics 2018, 5, 3962–3969
- Vieira et al. 2019 Vieira, B. G. M.; Mueller, N. S.; Barros, E. B.; Reich, S. Plasmonic Properties of Close-Packed Metallic Nanoparticle Mono- and Bilayers. The Journal of Physical Chemistry C 2019, 123, 17951–17960
- Sherson et al. 2010 Sherson, J. F.; Weitenberg, C.; Endres, M.; Cheneau, M.; Bloch, I.; Kuhr, S. Single-atom-resolved fluorescence imaging of an atomic Mott insulator. Nature 2010, 467, 68–72
- Masson and Asenjo-Garcia 2022 Masson, S. J.; Asenjo-Garcia, A. Universality of Dicke superradiance in arrays of quantum emitters. Nature Communications 2022, 13
- Schäfer et al. 2020 Schäfer, F.; Fukuhara, T.; Sugawa, S.; Takasu, Y.; Takahashi, Y. Tools for quantum simulation with ultracold atoms in optical lattices. Nature Reviews Physics 2020, 2, 411–425
- Schulz et al. 2020 Schulz, F.; Pavelka, O.; Lehmkühler, F.; Westermeier, F.; Okamura, Y.; Mueller, N. S.; Reich, S.; Lange, H. Structural order in plasmonic superlattices. Nature Communications 2020, 11
- Barredo et al. 2016 Barredo, D.; de Léséleuc, S.; Lienhard, V.; Lahaye, T.; Browaeys, A. An atom-by-atom assembler of defect-free arbitrary two-dimensional atomic arrays. Science 2016, 354, 1021–1023
- Müller et al. 2013 Müller, M.; Paulheim, A.; Eisfeld, A.; Sokolowski, M. Finite size line broadening and superradiance of optical transitions in two dimensional long-range ordered molecular aggregates. The Journal of Chemical Physics 2013, 139, 044302
- Dienel et al. 2008 Dienel, T.; Loppacher, C.; Mannsfeld, S.; Forker, R.; Fritz, T. Growth-Mode-Induced Narrowing of Optical Spectra of an Organic Adlayer. Advanced Materials 2008, 20, 959–963
- Kim et al. 2009 Kim, J.; Cote, L. J.; Kim, F.; Huang, J. Visualizing Graphene Based Sheets by Fluorescence Quenching Microscopy. Journal of the American Chemical Society 2009, 132, 260–267
- Matte et al. 2011 Matte, H. R.; Subrahmanyam, K.; Rao, K. V.; George, S. J.; Rao, C. Quenching of fluorescence of aromatic molecules by graphene due to electron transfer. Chemical Physics Letters 2011, 506, 260–264
- Kasha et al. 1961 Kasha, M.; El-Bayoumi, M. A.; Rhodes, W. Excited states of nitrogen base pairs and polynucleotides. J. Chem. Phys. 1961, 58
- Hestand and Spano 2018 Hestand, N. J.; Spano, F. C. Expanded Theory of H- and J-Molecular Aggregates: The Effects of Vibronic Coupling and Intermolecular Charge Transfer. Chemical Reviews 2018, 118, 7069–7163
- Deshmukh et al. 2022 Deshmukh, A. P.; Geue, N.; Bradbury, N. C.; Atallah, T. L.; Chuang, C.; Pengshung, M.; Cao, J.; Sletten, E. M.; Neuhauser, D.; Caram, J. R. Bridging the gap between H- and J-aggregates: Classification and supramolecular tunability for excitonic band structures in two-dimensional molecular aggregates. Chemical Physics Reviews 2022, 3, 021401
- Zhou et al. 2018 Zhou, J.; Zhang, W.; Jiang, X.-F.; Wang, C.; Zhou, X.; Xu, B.; Liu, L.; Xie, Z.; Ma, Y. Magic-Angle Stacking and Strong Intermolecular Pi-Pi Interaction in a Perylene Bisimide Crystal: An Approach for Efficient Near-Infrared (NIR) Emission and High Electron Mobility. The Journal of Physical Chemistry Letters 2018, 9, 596–600
- Deshmukh et al. 2019 Deshmukh, A. P.; Koppel, D.; Chuang, C.; Cadena, D. M.; Cao, J.; Caram, J. R. Design Principles for Two-Dimensional Molecular Aggregates Using Kasha’s Model: Tunable Photophysics in Near and Short-Wave Infrared. The Journal of Physical Chemistry C 2019, 123, 18702–18710
- Kirstein and Möhwald 1995 Kirstein, S.; Möhwald, H. Exciton band structures in 2D aggregates of cyanine dyes. Advanced Materials 1995, 7, 460–463
- Orrit et al. 1986 Orrit, M.; Möbius, D.; Lehmann, U.; Meyer, H. Reflection and transmission of light by dye monolayers. The Journal of Chemical Physics 1986, 85, 4966–4979
- Fidder et al. 1991 Fidder, H.; Knoester, J.; Wiersma, D. A. Optical properties of disordered molecular aggregates: A numerical study. The Journal of Chemical Physics 1991, 95, 7880–7890
- Bettles 2017 Bettles, R. Cooperative Interactions in Lattices of Atomic Dipoles; Springer Theses; Springer International Publishing, 2017
- Dicke 1954 Dicke, R. H. Coherence in Spontaneous Radiation Processes. Physical Review 1954, 93, 99–110
- Ravets et al. 2014 Ravets, S.; Labuhn, H.; Barredo, D.; Béguin, L.; Lahaye, T.; Browaeys, A. Coherent dipole–dipole coupling between two single Rydberg atoms at an electrically-tuned Förster resonance. Nature Physics 2014, 10, 914–917
- Knapp 1984 Knapp, E. Lineshapes of molecular aggregates, exchange narrowing and intersite correlation. Chemical Physics 1984, 85, 73–82
- Severin et al. 2022 Severin, N.; Dzhanoev, A. R.; Lin, H.; Rauf, A.; Kirstein, S.; Palma, C.-A.; Sokolov, I. M.; Rabe, J. P. Atomic resolution with high-eigenmode tapping mode atomic force microscopy. Physical Review Research 2022, 4, 023149
- Saikin et al. 2013 Saikin, S. K.; Eisfeld, A.; Valleau, S.; Aspuru-Guzik, A. Photonics meets excitonics: natural and artificial molecular aggregates. Nanophotonics 2013, 2, 21–38
- Berland and Hyldgaard 2013 Berland, K.; Hyldgaard, P. Analysis of van der Waals density functional components: Binding and corrugation of benzene and C60 on boron nitride and graphene. Physical Review B 2013, 87, 205421
- Engel et al. 2006 Engel, E.; Schmidt, K.; Beljonne, D.; Brédas, J.-L.; Assa, J.; Fröb, H.; Leo, K.; Hoffmann, M. Transient absorption spectroscopy and quantum-chemical studies of matrix-isolated perylene derivatives. Phys. Rev. B 2006, 73, 245216
- Spano and Yamagata 2010 Spano, F. C.; Yamagata, H. Vibronic Coupling in J-Aggregates and Beyond: A Direct Means of Determining the Exciton Coherence Length from the Photoluminescence Spectrum. The Journal of Physical Chemistry B 2010, 115, 5133–5143
- Akers et al. 1988 Akers, K.; Aroca, R.; Hort, A.; Loutfy, R. Molecular organization in perylene tetracarboxylic di-imide solid films. Spectrochimica Acta Part A: Molecular Spectroscopy 1988, 44, 1129–1135
- Lunedei 2003 Lunedei, E. Distance dependent excited-state relaxation of MePTCDI on semiconductor substrates in the isolated molecule limit. 2003; \urlhttps://elib.uni-stuttgart.de/handle/11682/4729
- Yu and Cardona 2010 Yu, P. Y.; Cardona, M. Fundamentals of Semiconductors; Springer Berlin Heidelberg, 2010
- Wasserroth et al. 2018 Wasserroth, S.; Bisswanger, T.; Mueller, N. S.; Kusch, P.; Heeg, S.; Clark, N.; Schedin, F.; Gorbachev, R.; Reich, S. Graphene as a local probe to investigate near-field properties of plasmonic nanostructures. Physical Review B 2018, 97, 155417
- Laturia et al. 2018 Laturia, A.; de Put, M. L. V.; Vandenberghe, W. G. Dielectric properties of hexagonal boron nitride and transition metal dichalcogenides: from monolayer to bulk. npj 2D Materials and Applications 2018, 2
- Song et al. 2018 Song, B.; Gu, H.; Zhu, S.; Jiang, H.; Chen, X.; Zhang, C.; Liu, S. Broadband optical properties of graphene and HOPG investigated by spectroscopic Mueller matrix ellipsometry. Applied Surface Science 2018, 439, 1079–1087
- Piao et al. 2016 Piao, Y.; Simpson, J. R.; Streit, J. K.; Ao, G.; Zheng, M.; Fagan, J. A.; Walker, A. R. H. Intensity Ratio of Resonant Raman Modes for (n,m) Enriched Semiconducting Carbon Nanotubes. ACS Nano 2016, 10, 5252–5259
- Duque et al. 2011 Duque, J. G.; Chen, H.; Swan, A. K.; Shreve, A. P.; Kilina, S.; Tretiak, S.; Tu, X.; Zheng, M.; Doorn, S. K. Violation of the Condon Approximation in Semiconducting Carbon Nanotubes. ACS Nano 2011, 5, 5233–5241
- Mueller et al. 2020 Mueller, N. S.; Okamura, Y.; Vieira, B. G. M.; Juergensen, S.; Lange, H.; Barros, E. B.; Schulz, F.; Reich, S. Deep strong light–matter coupling in plasmonic nanoparticle crystals. Nature 2020, 583, 780–784
- Yagodkin et al. 2022 Yagodkin, D.; Greben, K.; Eljarrat, A.; Kovalchuk, S.; Ghorbani-Asl, M.; Jain, M.; Kretschmer, S.; Severin, N.; Rabe, J. P.; Krasheninnikov, A. V.; Koch, C. T.; Bolotin, K. I. Extrinsic Localized Excitons in Patterned 2D Semiconductors. Advanced Functional Materials 2022, 32, 2203060