V445 Puppis – Dustier than a Thousand Novae
Abstract
V445 Puppis, the only known Galactic helium nova, is a unique testbed to verify supernova (SN) theories in the single degenerate channel that involve a white dwarf (WD) accreting matter from a helium-rich donor. An estimate of the mass of the helium shell on the WD is crucial to deciding whether or not it will undergo a SN detonation. In this context, this study estimates the dust and ejecta masses in the 2000 November eruption of V445 Pup. Subsequent to its outburst, the star became cocooned in a dust envelope. An analysis of the spectral energy distribution (SED) of the dust using infrared data shows that V445 Pup produced at least of dust which is unprecedented for a classical or recurrent nova. The SED can be explained by a combination of a cold dust component at K, mass , and a warm dust component at K, mass . For a conservative choice of the gas-to-dust mass ratio in the range 10–100, the mass of the ejecta is 0.01–0.1 . Such a high mass range raises the question: why did V445 Pup not detonate as a Type 1a SN as is predicted in certain double-detonation sub-Chandrasekhar supernovae formalisms? We re-examine the nature of V445 Pup and discuss its role as a potential SN progenitor.
To appear in the ApJL
1 Introduction
V445 Pup erupted in 2000 reaching a peak brightness of 8.46 mag on 2000 Nov 29, and then slowly declined with a days ( being the elapsed time to decline 2 mags from peak brightness). Although the outburst was first reported on 2000 December 30 by Kanatsu (Kato et al., 2000) archival All Sky Automated Survey (ASAS, Pojmanski, 1997) records demonstrated the outburst had begun earlier (Goranskij et al., 2010). V445 Pup appeared to be a slow nova except that the spectra, both in the optical and near-infrared (NIR), recorded in the immediate and post-eruption stages, were unique in not showing the hydrogen lines conventionally seen in a nova outburst. Instead, there were many lines of carbon, helium, and other metals; the C and He lines were specially prominent in the NIR (Iijima & Nakanishi, 2008; Woudt & Steeghs, 2005; Lynch et al., 2004; Ashok & Banerjee, 2003; Lynch et al., 2001; Wagner et al., 2001a, b). Based on its spectrum Ashok & Banerjee (2003) proposed V445 Pup to be a helium nova that had undergone a thermonuclear runaway in helium-rich matter accreted onto a white dwarf’s (WD) surface from a helium-rich donor (e.g., Kato & Hachisu, 2003; Iben & Tutukov, 1994).
On 2001 Jan 2, days after peak brightness, photometry showed that hot dust had begun to form (Ashok & Banerjee, 2003) and 3–14 µm spectroscopy obtained on 2001 Jan 31, confirmed the presence of significant amounts of carbon dust (Lynch et al., 2001). The dust shell rapidly thickened from 2001 June and by 2001 October V445 Pup had faded below mag (Goranskij et al., 2010).
A remarkable hourglass nebula, expanding with time, (detected around the object with adaptive optics band imagery) showed high velocity outflows (Woudt et al., 2009). The knots at the tips of the hourglass had velocities as large as (Woudt et al., 2009). Flaring radio synchrotron radiation was persistently observed from the object from the beginning and up to 7 years after the outburst (Nyamai et al., 2021; Rupen et al., 2001a). It is now clear that this non-thermal synchrotron emission was produced from shocks caused by the interaction of ejected matter (or a wind) from the WD with a pre-existing equatorial density enhancement collimating the ejecta to create the hour glass nebula with its pinched waist (Nyamai et al., 2021).
In this study, we re-analyze the SED of the dust from more recent archival data and conclude that V445 Pup has produced an unprecedented amount of dust for a nova. The implications of the large dust mass on the role of V445 Pup as a SN Type 1a progenitor are discussed.
2 Distance and Reddening
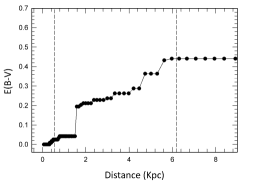
From the observed expansion parallax of the nebula, Woudt et al. (2009) derived a distance of kpc. Iijima & Nakanishi (2008) using the radial velocities of the Na D1, D2 lines from high dispersion spectra, in conjunction with HI 21cm radio data, estimated the reddening and distance to be = 0.51 mag and We point out that the equivalent width of 0.95 Å for the Na DI line in the Iijima & Nakanishi (2008) data, calibrated using the Richmond et al. (1994) relations, yields = 0.45, in reasonable agreement with the above. The = 0.51 derived from the measurements of Iijima & Nakanishi (2008) is consistent with the estimate of Wagner et al. (2001b), mag. However, their distance estimate is based on low spatial resolution extinction maps of Neckel & Klare (1980) whereas better data are now available. We use reddening data from Green et al. (2019) to estimate the distance (Fig. 1). The figure demonstrates, even up to the maximum distance of 6.2 kpc (beyond which the data are stated to be unreliable) the value has still not reached 0.51 (nor has it reached = 0.45 obtained from the Na DI line). This suggests that the distance to V445 Pup is kpc. We adopt values of kpc and = 0.51 (hence using ).
3 Analysis and Results
3.1 V445 Pup Dust mass
The SED of the dust was analyzed adopting the formalism of Sakon et al. (2016). The archival data used for the analysis are presented in Table 1. We assume a pure carbon composition for the dust given that the object showed a rich carbon spectrum in the optical and NIR (Iijima & Nakanishi, 2008). Further the 3–14 µm spectrum obtained and modeled by Lynch et al. (2001) showed a featureless continuum, without any silicate or unidentified infrared features (UIRs, see Evans et al., 2016), and thus strongly favors a carbon composition.
Assuming an optically thin shell of spherical carbon dust grains with a uniform radius , a total mass with an equilibrium temperature , located at a distance from the observer, the observed flux density (W m-2 µm-1) is:
| (1) |
where is the density of amorphous carbon (AC) dust (1.87 g cm-3) and is the absorption efficiency of amorphous carbon of radius (BE sample; Zubko et al., 1996). At IR wavelengths, and so Eqn. (1) becomes independent of the dust grain size (e.g., Kruegel, 2003; Bohren & Huffman, 1983).
The foreground extinction of the emission by silicate grains in the interstellar medium (ISM) is taken into account by multiplying the equation above with the exponential term:
| (2) |
We have normalized with the optical depth at 9.7 µm () determined from (Roche & Aitken, 1984) with .
| Facility | Brightness | Flux | Epoch | |
|---|---|---|---|---|
| (m) | (Jy/mag) | (W m2 m-1) | ||
| WISE | 3.4 | (mag) | 2010 | |
| WISE | 4.6 | (mag) | 2010 | |
| WISE$\dagger$$\dagger$footnotemark: | 12.0 | (mag) | 2010 | |
| WISE$\dagger$$\dagger$footnotemark: | 22.0 | (mag) | 2010 | |
| AKARI-IRC | 18.0 | (Jy) | 2006 | |
| AKARI-FIS2 | 65.0 | (Jy) | 2006 | |
| AKARI-FIS2 | 90.0 | (Jy) | 2006 | |
| AKARI-FIS2 | 140.0 | (Jy) | 2006 | |
| AKARI-FIS2 | 160.0 | 2.710 (Jy) | 2006 | |
| Spitzer-IRAC$\ddagger$$\ddagger$footnotemark: | 3.6 | (Jy) | 2005 | |
| Spitzer-IRAC$\ddagger$$\ddagger$footnotemark: | 4.5 | (Jy) | 2005 | |
| Spitzer-MIPS$\ddagger$$\ddagger$footnotemark: | 70.0 | (Jy) | 2005 | |
| Herschel | 70.0 | (Jy) | 2012 | |
| Herschel | 160.0 | (Jy) | 2012 | |
| SEST | 1200.0 | (Jy) | 2003 |
Note. — ⋆Data retrieved from various mission archives hosted at the NASA/IPAC Infrared Science Archive including Spitzer (doi: 10.26131/IRSA433), WISE (doi: 10.26131/IRSA142), Herschel (doi: 10.26131/IRSA79), and AKARI (doi:10.26131/IRSA180, 10.26131/IRSA181). †The fractional pixel saturation in the 12 and 22 µm fluxes are 0.28 and 0.12 respectively but saturation effects are corrected by using profile fitted magnitudes (https://wise2.ipac.caltech.edu/docs/release/allsky/expsup/sec6_3d.html). ‡ Spitzer data reductions described in Su et al. (2020). The AKARI fluxes are averages over multiple detections made during the mission lifetime between 2006-2007.
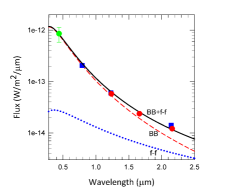
The SED can be understood as a combination of two components of amorphous carbon dust. The first component at K has a mass . The second is a warm component, K, with a mass . The decomposition of the SED is shown in Fig. 2. To cross-check the mass estimates, the of ACAR sample (Zubko et al., 1996) were also used, yielding very similar results as the BE sample. We have not considered the 1.2 mm point in the fits as it is unclear whether the mm continuum flux is due to dust or from free-free emission from ionized gas (as discussed later).
Clearly there is a large mass of cool dust, based largely on the SED modeling of the long wavelength ( µm) photometry. Were the dust shell optically thick (e.g., ) at these wavelengths, rather than optically thin as assumed, then that would require an for extinction comparable to that seen in the most opaque molecular clouds and likely is not reasonable. It is outside the scope of this study to compute the dust mass for more complex geometries (e.g., a bipolar morphology with ad-hoc assumptions on the amount of equatorial material enhancement).
Our SED fits involve modeling of data that is not contemporaneous. However, the main result of the paper - the large dust mass - is largely based on fitting the longer wavelength ( µm) AKARI, Herschel, WISE and Spitzer data taken between 2005-2012. These data are well-fit by our model suggesting that the dust temperature did not change significantly between the different epochs, increasing our confidence that the data at these wavelengths are not significantly variable. There is some variability in the WISE and Spitzer 3.6 µm and 4.5 µm data, but the hotter dust component which is used to fit this data contributes only a small percent of the dust mass. So the total dust mass estimate should be reasonably reliable.
A similar but brief study, estimating the dust mass in V445 Pup was conducted by Shimamoto et al. (2017). However, their modeling was limited to only the AKARI data with no data short-ward of 9 µm to constrain the Wien side of the SED. The source of the 9 µm AKARI flux used by Shimamoto et al. (2017) is also unclear. It is not listed in the master records in the AKARI database111https://darts.isas.jaxa.jp/astro/akari/data/AKARI-IRC_Catalogue_AllSky_PointSource_1.0.html. The mm flux was not discussed and Shimamoto et al. (2017) invoked an unrealistic value of foreground extinction of to fit the SED. The present modeling is hence more comprehensive, improved, and realistic. Shimamoto et al. (2017) do conclude that large dust masses are extant, comprised of a combination of cold amorphous carbon (125 K) with a mass of and warm amorphous carbon (250 K) with a mass of ( .
What becomes evident is that no nova, either recurrent nova (RN) or classical nova (CN), has produced as much dust ( ) as V445 Pup (adopting distances of 3.5 kpc or 8.2 kpc as extrema do not radically change the mass estimate as the dust mass scales as ). The typical mass of the dust produced in a dust producing nova is to (Evans & Gehrz, 2022). If a canonical value of gas-to-dust mass of 100 is assumed, the mass of the ejecta could be as large as 0.1 . This is unprecedented.
If the Swedish-ESO Submillimeter Telescope (SEST, Booth et al., 1989) 1.2 mm data point is included in the dust SED fitting (however, see §3.2), then additional modeling suggests that, apart from the two components used in the present analysis, an additional cooler component at to 50 K and with a mass of is required to fit the composite SED. It thus appears certain that the mass ejected by V445 Pup was very large and that the accreted shell on the WD shell at the time of outburst was massive, at least , for a most conservative choice of 10 for the gas-to-dust mass ratio. V445 Pup could have potentially erupted as a SN 1a, which curiously it did not. However, we first discuss the possible origin of the mm flux.
3.2 Millimeter/sub-mm studies of novae
Millimeter/sub-mm studies of novae appear to be few. The two possible origins for mm continuum fluxes are free-free emission (e.g., V1974 Cygni, Ivison et al., 1992) and/or the Rayleigh-Jeans tail of dust emission (e.g., V4743 Sgr, Schmidtobreick et al., 2005; Nielbock & Schmidtobreick, 2003). Reasonably, the assertion that the detection of 1.2 mm emission from the nebula around V445 Pup is from free-free emission has a basis in two arguments. First, the 1.2 mm detection in V445 Pup was made in 2003 May about d after the outburst, at which stage the ionized nebula around V445 Pup was expected to be in diameter (based on image sizes in Woudt et al., 2009). Second, the optically thin free-free flux (W cm-2 µm-1) at wavelength (µm) from an ionized gas with electron density (cm-3), assumed equal to , the ion density), at temperature and occupying a volume (cm3) is (Banerjee et al., 2001):
| (3) |
where is the Gaunt factor (between 0.3 and 0.5), is the charge (2 for an ionized Helium gas) and (in cm) is the distance.
As an illustrative example, the observed mm flux W cm-2 µm-1 can be reproduced by considering a singly ionized He nebula of 0.6 arcsecond extent at K and kpc, with a cm-3 (since [O iii] 5007Å was seen at around this time, Woudt & Steeghs, 2005). We approximate the density to be less than the critical density of that line which is cm-3. These assumptions are reasonable and serve to show that the mm flux is almost certainly due to free-free emission.
3.3 Pathways for SN 1a explosions and novae
One of the pathways for SN1a explosions, within the single-degenerate channel, is the double-detonation sub-Chandrasekhar mechanism wherein the WD accretes from a helium donor (Maoz et al., 2014). A detonation in the accreted helium shell can cause a secondary detonation of the carbon/oxygen white dwarf (C/O WD) core (Starrfield et al., 2021; Fink et al., 2010; Shen & Bildsten, 2009). This happens at a total mass below the Chandrasekhar limit and depends on two factors – first the formation of a detonation in the helium shell and second whether a successful detonation of the helium shell can detonate the core. V445 Pup, by virtue of having had a shell detonation, is thus the only object which can be used as a testbed for the above theory.
A secondary detonation can be triggered in two different ways: either directly when the helium detonation shock hits the core/shell interface (“edge-lit”), or with some delay, after the shock has converged near the center (Fink et al., 2010). Fink et al. (2010, 2007) examined the delayed mechanism since it could lead to a core detonation even for shocks too weak for the edge-lit case. They find that secondary core detonations are triggered for all their simulated models, ranging in core mass from 0.810 up to 1.385 with corresponding shell masses from 0.126 down to 0.0035 . For convenience, we reproduce from Table 1 of Fink et al. (2010), the core mass of the WD and shell mass in the format (, ) for all their models that undergo double detonation: (0.81, 0.126), (0.92, 0.084), (1.025, 0.055), (1.125, 0.039), (1.28, 0.013), (1.385, ). The end result of their modeling is that as soon as a detonation occurs in a helium shell covering a carbon/oxygen WD a subsequent core detonation is virtually inevitable (Fink et al., 2010).
The WD mass is unknown but we speculate it is low based on the low amplitude outburst, the extremely long time to decline, the formation of dust, the amount of mass ejected, the low excitation spectrum at outburst (Ashok & Banerjee, 2003), and the lack of coronal line emission even 3 yrs after outburst (Lynch et al., 2004). Piersanti et al. (2014) suggest that the initial mass of the WD in V445 Pup could have been close to 0.8 . A low mass could explain why a SN 1a explosion was averted by the double-detonation channel.
The 2000 eruption of V445 Pup was not a SN explosion. With (Goranskij et al., 2010), , in the range 3.5 to 8.2 kpc, the absolute magnitude is in the range to , typical of a slow nova. Thus, its peak brightness falls greatly short of even the weakest SN “impostor” explosions which have to (Kasliwal, 2012; Smith et al., 2009).
3.4 V445 Pup – Its nature and connection with SNe
Useful insight about the system can be obtained from Fig. 3 which presents a plot of the extinction corrected pre-outburst SED of the progenitor from 2MASS (Skrutskie et al., 2006) and DENIS (Epchtein, 1994) magnitudes, both of which were recorded almost simultaneously on 1999 February 02 and 11 respectively (2MASS: = 12.271 0.026, = 11.94 0.024, = 11.52 0.025; DENIS: = 12.85 0.02, = 12.24 0.06, = 11.36 0.09). We also use = 14.3 0.3 from Goranskij et al. (2010). The SED is well fit by a K star, (cf., Goranskij et al., 2010) but with a discernible IR excess. This excess may be explained by free-free emission from ionized circumbinary gas that existed before the eruption (Fig. 3).
Several factors point towards the existence of material around V445 Pup prior to the eruption. First, the radio synchrotron emission requires shocks formed by nova ejecta plowing into pre-existing material. Second, the bipolar morphology of the nebula necessitates an equatorial constriction for shaping (the radio images confirm the constriction; Nyamai et al., 2021). Third, the putative presence of free-free emission demands ionized gas in the vicinity of the central star. Fourth, the presence of a large number of narrow absorption features (e.g., Ba II 493.408 nm, Sc II 552.679 nm and several lines of Ti II, Cr II and Fe II) seen in the rich, high dispersion () spectra (Iijima & Nakanishi, 2008) likely are Transient Heavy Element Absorption (THEA) systems (Williams et al., 2008). The latter authors propose that gas causing the THEA absorption systems in novae must be circumbinary, exists before the outburst, with a likely origin arising from mass ejection from the secondary star.
Hence, preexisting (equatorial) material, if dusty, would contribute to the hotter (less massive) dust component. Our analysis does not rule out this possibility. Colder dust, at the temperature of the cooler component, may also have pre-existed but in quantities below that required to allow a pre-outburst detection by IRAS (Neugebauer et al., 1984) which had an average 10 sensitivity of 0.85 Jy at 60 µm and 3 Jy at 100 µm.
These factors, when viewed collectively, would favor a pre-eruption configuration for V445 Pup that consists of a binary system, with remnants of the common envelope (CE) phase forming a torus in the equatorial plane. Radiation from a hot source, likely the WD or a hot accretion disc (or a combination of both) ionized parts of the CE remnant material leading to the observed free-free emission. The secondary was likely a star with K, that was a periodic variable star with a probable orbital period of d (Goranskij et al., 2010).
These parameters (spectral type, orbital period of secondary, mass of the ejecta) are essential inputs while modeling the thermal response of a degenerate C/O WD accreting helium from a helium-star donor (e.g., Brooks et al., 2016; Piersanti et al., 2014). Both these cited studies show that various outcomes are possible from the accretion process depending on the accretion rate and WD mass, whether there is steady He burning on the surface, mild shell flashes, strong shell flashes, or quiet accumulation of matter up to the final SN 1a explosion when the mass crosses the Chandrashekar limit. If the accretion rate is low () helium flashes result (Brooks et al., 2016; Piersanti et al., 2014) yielding a helium nova (Jacobson-Galán et al., 2019).
Furthermore, helium novae could be related to Type 1ax SNe because the helium emission in some Type 1ax SNe appears to arise from the circumstellar environment rather than from the supernova ejecta itself (Jacobson-Galán et al., 2019). The argument is that the ejecta of a SN 1ax detonation, following an earlier helium nova eruption on the same star, entrains the helium injected by the latter’s eruption into the circumstellar environment. Type 1ax supernovae share similar characteristics as SN 1a but exhibit lower peak luminosities and ejecta velocities. Jacobson-Galán et al. (2019) point out that the helium emission in two SN 1ax, SNe 2004cs and 2007J, is consistent with coming from the ejecta of a relatively recent helium nova, and note in particular, that the velocity of the material in these two SNe is similar to that of the galactic helium nova V445 Pup. Recently, Kool et al. (2023) discuss the strong likelihood of a V445 Pup type object being the progenitor of the first radio-detected Type1a SN 2020eyj which has a helium-rich circumstellar medium. Explaining the radio light curve and the bolometric light-curve tail of SN2020eyj requires a circumstellar medium mass between 0.3–1.0 . A mass of 0.67 , in good agreement with that posited for SN 2020eyj, can be provided by the helium donor in V445 Pup if we adopt a distance of 8.2 kpc (Woudt et al., 2009) instead of 6.2 kpc, a plausible gas-to-mass ratio of 200, in tandem with the cold component mass of that we derive. V445 Pup is thus a unique test platform for testing single-degenerate channel theories that involve a helium-rich donor.
Although the ejected mass in V445 Pup is unusually high for a nova, a helium nova outburst is still the most favorable interpretation for the 2000 eruption. However, V445 Pup also shares certain similarities with CK Vul, the latter proposed to belong to the class of objects known as intermediate-luminosity red transients (ILRTs) or interchangeably Luminous red novae (Banerjee et al., 2020). CK Vul also has a hourglass morphology, a similar dust mass of in the inner nebula, and peak expansion velocities of (Banerjee et al., 2020; Eyres et al., 2018). However, CK Vul was not hydrogen deficient and was much more luminous at the peak of its outburst () compared to V445 Pup ().
4 Summary
In case the bulk of the estimated dust mass surrounding V445 Pup arose from material ejected in the 2000 eruption, then V445 Pup at the time of its outburst had a shell mass as massive as 0.01 or more and thus should have potentially undergone a SN 1a detonation by the double-detonation sub-Chandrasekhar pathway. That it did not suggests that the WD is not massive.
References
- Ashok & Banerjee (2003) Ashok, N. M. & Banerjee, D. P. K. 2003, A&A, 409, 1007. doi:10.1051/0004-6361:20031160
- Astropy Collaboration et al. (2018) Astropy Collaboration, Price-Whelan, A. M., Sipőcz, B. M., et al. 2018, AJ, 156, 123. doi:10.3847/1538-3881/aabc4f
- Banerjee et al. (2001) Banerjee, D. P. K., Janardhan, P., & Ashok, N. M. 2001, A&A, 380, L13. doi:10.1051/0004-6361:20011508
- Banerjee et al. (2020) Banerjee, D. P. K., Geballe, T. R., Evans, A., et al. 2020, ApJ, 904, L23. doi:10.3847/2041-8213/abc885
- Bohren & Huffman (1983) Bohren, C. F. & Huffman, D. R. 1983, Light Scattering of Small Particles, New York: Wiley, 1983
- Booth et al. (1989) Booth, R. S., Delgado, G., Hagstrom, M., et al. 1989, A&A, 216, 315
- Brooks et al. (2016) Brooks, J., Bildsten, L., Schwab, J., et al. 2016, ApJ, 821, 28. doi:10.3847/0004-637X/821/1/28
- Epchtein (1994) Epchtein, N. 1994, Experimental Astronomy, 3, 73. doi:10.1007/BF00430120
- Evans & Gehrz (2022) Evans, A. & Gehrz, R. D. 2022, arXiv:2211.12410. doi:10.48550/arXiv.2211.12410
- Evans et al. (2016) Evans, A., Gehrz, R. D., Woodward, C. E., et al. 2016, MNRAS, 457, 2871. doi:10.1093/mnras/stw352
- Eyres et al. (2018) Eyres, S. P. S., Evans, A., Zijlstra, A., et al. 2018, MNRAS, 481, 4931. doi:10.1093/mnras/sty2554
- Fink et al. (2007) Fink, M., Hillebrandt, W., & Röpke, F. K. 2007, A&A, 476, 1133. doi:10.1051/0004-6361:20078438
- Fink et al. (2010) Fink, M., Röpke, F. K., Hillebrandt, W., et al. 2010, A&A, 514, A53. doi:10.1051/0004-6361/200913892
- Goranskij et al. (2010) Goranskij, V., Shugarov, S., Zharova, A., et al. 2010, Peremennye Zvezdy, 30, 4. doi:10.48550/arXiv.1011.6063
- Green et al. (2019) Green, G. M., Schlafly, E., Zucker, C., et al. 2019, ApJ, 887, 93. doi:10.3847/1538-4357/ab5362
- Iben & Tutukov (1994) Iben, I. & Tutukov, A. V. 1994, ApJ, 431, 264. doi:10.1086/174484
- Iijima & Nakanishi (2008) Iijima, T. & Nakanishi, H. 2008, A&A, 482, 865. doi:10.1051/0004-6361:20077502
- Ivison et al. (1992) Ivison, R. J., Bang, M. K., & Bode, M. F. 1992, IAU Circ., 5516
- Jacobson-Galán et al. (2019) Jacobson-Galán, W. V., Foley, R. J., Schwab, J., et al. 2019, MNRAS, 487, 2538. doi:10.1093/mnras/stz1305
- Kasliwal (2012) Kasliwal, M. M. 2012, PASA, 29, 482. doi:10.1071/AS11061
- Kato & Hachisu (2003) Kato, M. & Hachisu, I. 2003, ApJ, 598, L107. doi:10.1086/380597
- Kato et al. (2000) Kato, T., Kanatsu, K., Takamizawa, K., et al. 2000, IAU Circ., 7552
- Kool et al. (2023) Kool, E. C., Johansson, J., Sollerman, J., et al. 2023, Nature, 617, 477. doi:10.1038/s41586-023-05916-w
- Kruegel (2003) Kruegel, E. 2003, The physics of interstellar dust, by Endrik Kruegel. IoP Series in astronomy and astrophysics, ISBN 0750308613. Bristol, UK: The Institute of Physics, 2003.
- Lynch et al. (2004) Lynch, D. K., Rudy, R. J., Mazuk, S., et al. 2004, AJ, 128, 2962. doi:10.1086/425889
- Lynch et al. (2001) Lynch, D. K., Russell, R. W., & Sitko, M. L. 2001, AJ, 122, 3313. doi:10.1086/324465
- Maoz et al. (2014) Maoz, D., Mannucci, F., & Nelemans, G. 2014, ARA&A, 52, 107. doi:10.1146/annurev-astro-082812-141031
- Neckel & Klare (1980) Neckel, T. & Klare, G. 1980, A&AS, 42, 251
- Neugebauer et al. (1984) Neugebauer, G., Habing, H. J., van Duinen, R., et al. 1984, ApJ, 278, L1. doi:10.1086/184209
- Nielbock & Schmidtobreick (2003) Nielbock, M. & Schmidtobreick, L. 2003, A&A, 400, L5. doi:10.1051/0004-6361:20030107
- Nyamai et al. (2021) Nyamai, M. M., Chomiuk, L., Ribeiro, V. A. R. M., et al. 2021, MNRAS, 501, 1394. doi:10.1093/mnras/staa3712
- Piersanti et al. (2014) Piersanti, L., Tornambé, A., & Yungelson, L. R. 2014, MNRAS, 445, 3239. doi:10.1093/mnras/stu1885
- Pojmanski (1997) Pojmanski, G. 1997, Acta Astron., 47, 467. doi:10.48550/arXiv.astro-ph/9712146
- Richmond et al. (1994) Richmond, M. W., Treffers, R. R., Filippenko, A. V., et al. 1994, AJ, 107, 1022. doi:10.1086/116915
- Roche & Aitken (1984) Roche, P. F. & Aitken, D. K. 1984, MNRAS, 208, 481. doi:10.1093/mnras/208.3.481
- Rupen et al. (2001a) Rupen, M. P., Mioduszewski, A. J., & Dhawan, V. 2001a, IAU Circ., 7728
- Sakon et al. (2016) Sakon, I., Sako, S., Onaka, T., et al. 2016, ApJ, 817, 145. doi:10.3847/0004-637X/817/2/145
- Schmidtobreick et al. (2005) Schmidtobreick, L., Nielbock, M., & Manthey, E. 2005, The Astrophysics of Cataclysmic Variables and Related Objects, 330, 483
- Shen & Bildsten (2009) Shen, K. J. & Bildsten, L. 2009, ApJ, 699, 1365. doi:10.1088/0004-637X/699/2/1365
- Shimamoto et al. (2017) Shimamoto, S., Sakon, I., Onaka, T., et al. 2017, Publication of Korean Astronomical Society, 32, 109. doi:10.5303/PKAS.2017.32.1.109
- Skrutskie et al. (2006) Skrutskie, M. F., Cutri, R. M., Stiening, R., et al. 2006, AJ, 131, 1163. doi:10.1086/498708
- Smith et al. (2009) Smith, N., Ganeshalingam, M., Chornock, R., et al. 2009, ApJ, 697, L49. doi:10.1088/0004-637X/697/1/L49
- Starrfield et al. (2021) Starrfield, S., Bose, M., Iliadis, C., et al. 2021, The Golden Age of Cataclysmic Variables and Related Objects V, 2-7, 30. doi:10.22323/1.368.0030
- Su et al. (2020) Su, K. Y. L., Rieke, G. H., Melis, C., et al. 2020, ApJ, 898, 21. doi:10.3847/1538-4357/ab9c9b
- Wagner et al. (2001a) Wagner, R. M., Schwarz, G., Starrfield, S. G., et al. 2001a, IAU Circ., 7717
- Wagner et al. (2001b) Wagner, R. M., Schwarz, G., & Starrfield, S. G. 2001b, IAU Circ., 7571
- Williams et al. (2008) Williams, R., Mason, E., Della Valle, M., et al. 2008, ApJ, 685, 451. doi:10.1086/590056
- Woudt et al. (2009) Woudt, P. A., Steeghs, D., Karovska, M., et al. 2009, ApJ, 706, 738. doi:10.1088/0004-637X/706/1/738
- Woudt & Steeghs (2005) Woudt, P. A. & Steeghs, D. 2005, Interacting Binaries: Accretion, Evolution, and Outcomes, 797, 647. doi:10.1063/1.2130306
- Zubko et al. (1996) Zubko, V. G., Mennella, V., Colangeli, L., et al. 1996, MNRAS, 282, 1321. doi:10.1093/mnras/282.4.1321