Mid-infrared trace detection
with parts-per-quadrillion quantitation accuracy:
Expanding frontiers of radiocarbon sensing
Abstract
Detection sensitivity is one of the most important attributes to consider during selection of spectroscopic techniques. However, high sensitivity alone is insufficient for spectroscopic measurements in spectrally congested regions. Two-color cavity ringdown spectroscopy (2C-CRDS), based on intra-cavity pump-probe detection, simultaneously achieves high detection sensitivity and selectivity. The technique enables mid-infrared detection of radiocarbon dioxide (14CO2) molecules in room-temperature CO2 samples, with better than 10 parts-per-quadrillion (ppq, 1015) quantitation accuracy (4 ppq on average). These highly-reproducible measurements, which are the most sensitive and quantitatively accurate in the mid-infrared, are accomplished despite the presence of orders-of-magnitude stronger, one-photon signals from other CO2 isotopologues. This is a major achievement in laser spectroscopy. A room-temperature-operated, compact, and low-cost 2C-CRDS sensor for 14CO2 benefits a wide range of scientific fields that utilize 14C for dating and isotope tracing, most notably atmospheric 14CO2 monitoring to track CO2 emissions from fossil fuels. The 2C-CRDS technique significantly enhances the general utility of high-resolution mid-infrared detection for analytical measurements and fundamental chemical dynamics studies.
LLNL-JRNL-850018
Quantifying light absorption is one of the most commonly used strategies to determine the concentration, transition frequencies, and transition cross sections for an analyte of interest. The most sensitive laser absorption techniques invariably utilize an optical cavity [1], which can provide 1 km light-matter interaction pathlengths. However, the increased detection sensitivity of cavity-based techniques applies equally to all resonant transitions of every molecular species inside the interaction volume. The lack of sufficient detection selectivity is problematic in the “molecular-fingerprint” mid-infrared (mid-IR) range. Because of high density of strongly overlapping transitions, spectroscopic detection and assignments of weak mid-IR signals can be prohibitively difficult with conventional cavity-enhanced techniques.
The development of optical detection for the rare radiocarbon dioxide molecule (14CO2), with 1200 parts-per-quadrillion (1015, ppq) 14C/C natural abundance, exemplifies this need for a spectroscopic technique that simultaneously achieves high detection , , and quantitation [2, 3]. Traditionally measured by accelerator mass spectrometry (AMS) [4, 5], the 14C tracer (half-life of 573040 years) [6] has been used in a wide range of applications, such as archaeological dating [7], bio-medicine development [8, 9], earth carbon-cycle studies [10], and monitoring of fossil-fuel-CO2 emission [11, 12, 13]. field measurements of 14C are not possible with AMS, which utilizes a room-size, mega-volt accelerator to filter the interfering molecular isobars of 14C (e.g., 13CH). Even for laboratory measurements, the investment and operational cost of AMS (multiple million dollar in equipment and staff) are too high for many applications.
Mid-IR detection of 14CO2, by measuring its -band ro-vibrational transitions, has been proposed as a cheaper and potentially field-deployable 14C sensing technique [2, 3, 14, 15, 16, 17, 18, 19, 20]. Quantifying fossil-fuel-CO2 emission based on measurements of the total atmospheric CO2 content is subject to the and CO2 emissions from the bio-sphere [12, 13, 11]. Combustion of fossil fuels, which are depleted of 14C, leads to location- and time-dependent decrease in the atmospheric 14CO2:CO2 ratio, with the measured dip typically 100 ppq (i.e., 10 of natural 14CO2 concentration) in a mega-city [12]. This signature dip is an - tracer for fossil-fuel-CO2. Large-scale and year-long measurement campaigns of atmospheric 14CO2 have only been occasionally implemented in a very few locations in the world, because of the high costs of AMS measurements [12, 13]. A compact field-deployable 14CO2 sensor will provide accurate, permanent, and low-latency monitoring of fossil-fuel-CO2 emission, and thereby facilitates evaluating the efficacy of various carbon reduction programs [21].
Optical detection of 14CO2 is challenging at the concentration ( natural abundance) and accuracy level (1-100 ppq 14C/C) required for many of the aforementioned applications. Mid-IR detection of 14CO2 in room-temperature samples with better than 10-ppq sensitivity and accuracy, demonstrated in this work with two-color cavity ringdown spectroscopy (2C-CRDS), pushes the limit of mid-IR laser absorption techniques in , , and . Our current 2C-CRDS setup allows measurements of a minimum absorption coefficient () of cm-1 from 14CO2 in the presence of strong one-color (1C) hot-band absorption signals from other CO2 isotopologues, with the background typically cm-1 (4.55 m, 20 torr, 300 K) [22]. This background/signal ratio (105) is too large for 14CO2 detection by other cavity-enhanced techniques based on single-photon absorption. To mitigate severe spectral overlap, gas-cooling to 170 K has been necessary for previous 10-ppq level measurements of 14CO2, which was achieved by a 1C variant of CRDS, the saturated-absorption cavity ringdown (SCAR) technique [15, 23]. The gas-cooling requirement for SCAR increases instrumental complexity and size, and is not ideal for field-work applications.
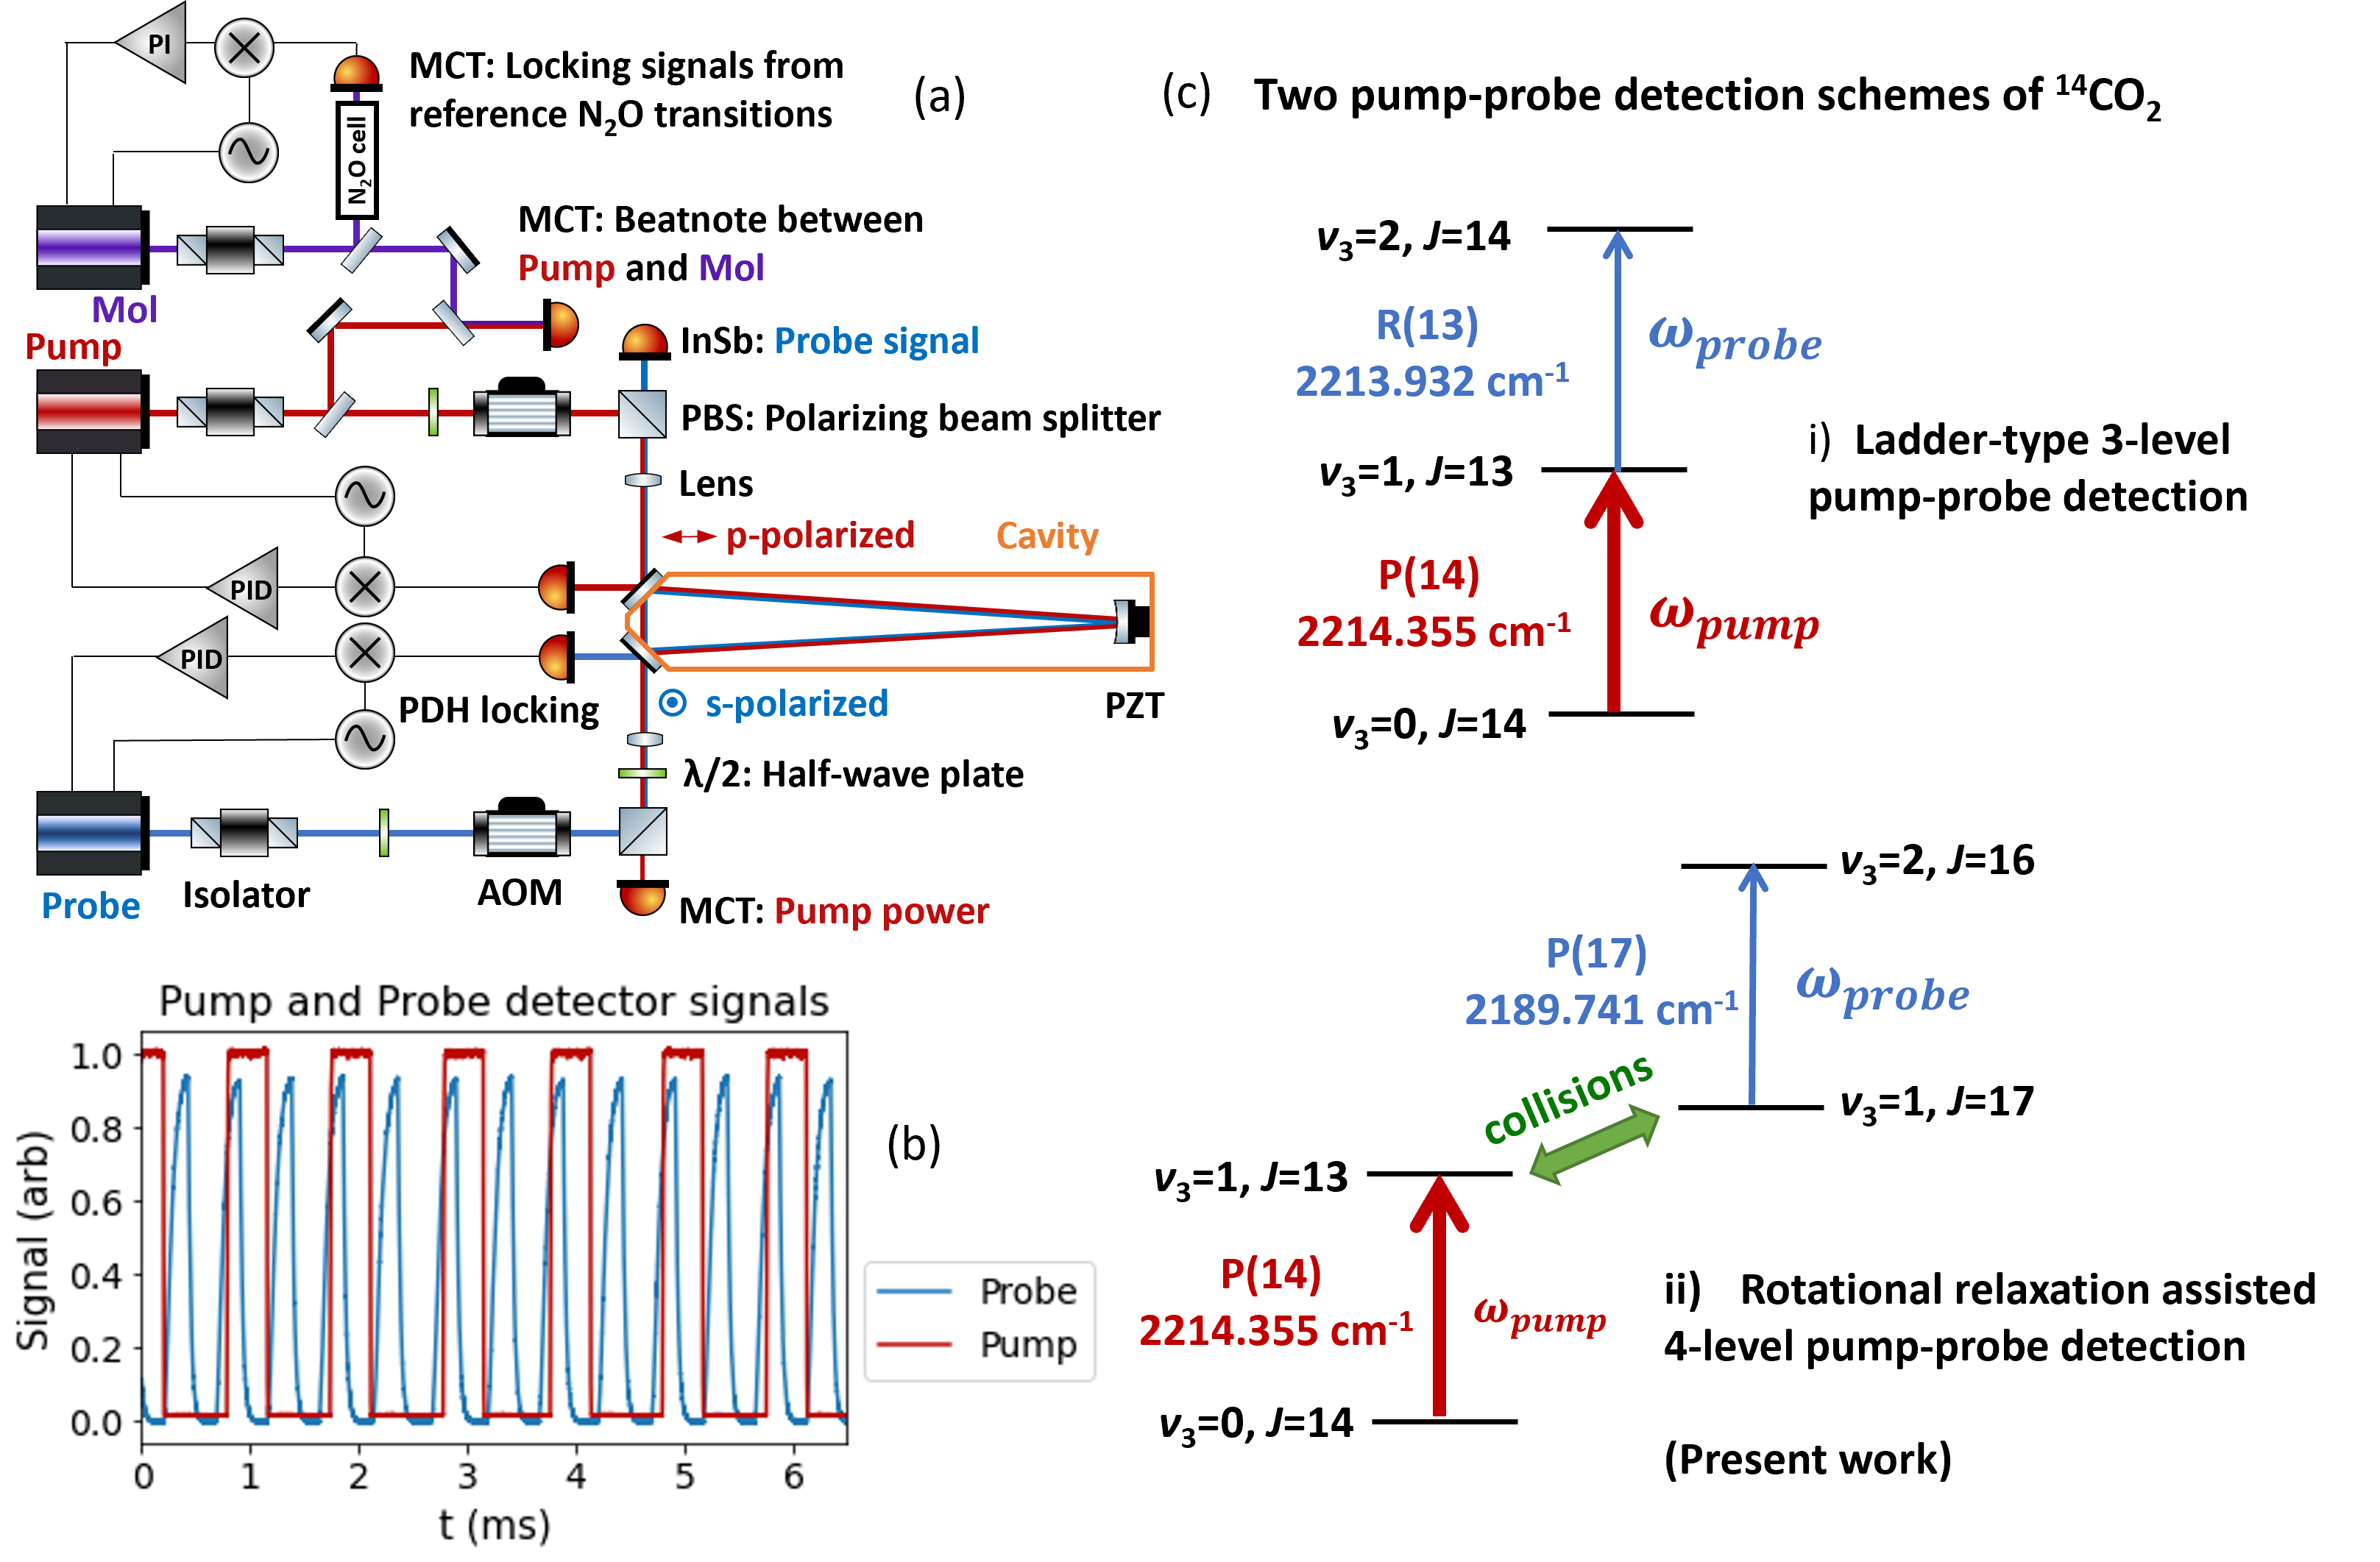
The built-in baseline compensation capability of 2C-CRDS detection leads to its significantly enhanced sensitivity, selectivity, and quantitation accuracy relative to conventional CRDS methods [2, 3]. In our experiment (Fig. 1a), the outputs from two quantum cascade lasers (QCL) excite a pair of (pump) and (probe) ro-vibrational transitions of 14CO2 inside a three-mirror, traveling-wave cavity. With the pump radiation switched off during alternative probe ringdown events (Fig. 1b), the net 2C signals are immune to the drift of the cavity ringdown rates and signals from one-photon molecular transitions.
The 2C-CRDS method has been previously applied by our group to achieve the first-ever room-temperature optical detection of 14CO2 below its natural abundance, with measurement accuracy of 100 ppq (8 natural abundance) [2]. A three-level excitation (scheme i in Fig. 1c) is used to quantify the 14CO2 concentrations of several combusted 14C “standard” samples. The observed 2C-CRDS spectra are free of interference from one-photon hot-band transitions of other CO2 isotopologues that lead to 10000 s-1 ringdown rate loss [2]. However, small background 2C signals (6.5 s-1 ringdown rate loss) are observed near the , R(13) probe transition of 14CO2. Collisional excitation of vibrationally excited levels of other CO2 isotopologues, which are inadvertently populated by the strong intra-cavity pump radiation, are believed to be the cause of this 2C background.
These collision-induced signals are significantly more sensitive to changes in the experimental conditions than the 2C signals from 14CO2 (SI Appendix, Section S3.1). Unlike the pump-power saturated 14CO2 signals, the background signals have a linear dependence on the pump power. In addition, the background signals are sensitive to small fluctuations of the gas temperature (1 signal variation from a 0.1∘C temperature change), because of the involvement of hot-band pump excitation of CO2 levels in the 5000 cm-1 energy region. Thanks to the relatively small magnitude of this background, equivalent to 14CO2 signals at 1.5 natural abundance (1800 ppq), 2C-CRDS detection of 14CO2 was still feasible below its natural abundance in our previous work, given the moderately stable gas temperature (0.1∘C variation) and pump power (5 variation) during the experiments. However, to achieve ppq-level detection accuracy, significant further background reduction is imperative.
After achieving reduction in the background 2C signal (guided by a collision model) and improvement in the detection signal-to-noise ratios, we have accomplished, by 100-s averaging at the maximum of the 14CO2 2C peak, optical detection of - 14CO2 with 7-ppq accuracy. The accuracy further improves to 4 ppq after fitting the 2C-CRDS spectra (20-30 min data acquisition). This record sub-10-ppq measurement performance (the most and in the mid-IR) has been reproducibly demonstrated with several rounds of measurements of combusted 14C standards and low-14C-content bio-fuel samples (10-80 ppq). The high sensitivity, high selectivity, and high accuracy measurement capabilities of the 2C-CRDS technique will have significant impact on analytical trace measurements and fundamental gas-phase chemical physics studies, which are discussed at the end of this paper.
Room-temperature ppq-level measurements of 14CO2
The use of a three-level pump-probe scheme with a common intermediate level, such as our original , P(14) pump and , R(13) probe combination, is not necessary for 14CO2 detection in a static-gas cavity at 20 torr. The vibrational relaxation rate of the state of 14CO2 (30 ms-1torr-1, determined from a pump-probe delay experiment similar to that on N2O) [3] is significantly slower than its rotational relaxation rate (on the order of 0.1 ns-1torr-1) [24]. As a result of facile rotational relaxation and negligible diffusion loss at 20 torr (10 slower than the 14CO2 vibrational relaxation loss), a population distribution that resembles a thermal distribution at 300 K exists among the rotational levels under continuous pump excitation during the “pump on” cycle, even though only one -level in is directly populated by the pump.
A rotational-relaxation-assisted, four-level detection scheme of 14CO2, , P(14) pump [25] and , P(17) probe [26, 27], is used in the measurements presented here (scheme ii in Fig. 1c). The background 2C signal is 10 smaller at the probe resonance frequency for this P(14)-P(17) combination than the original P(14)-R(13) scheme.

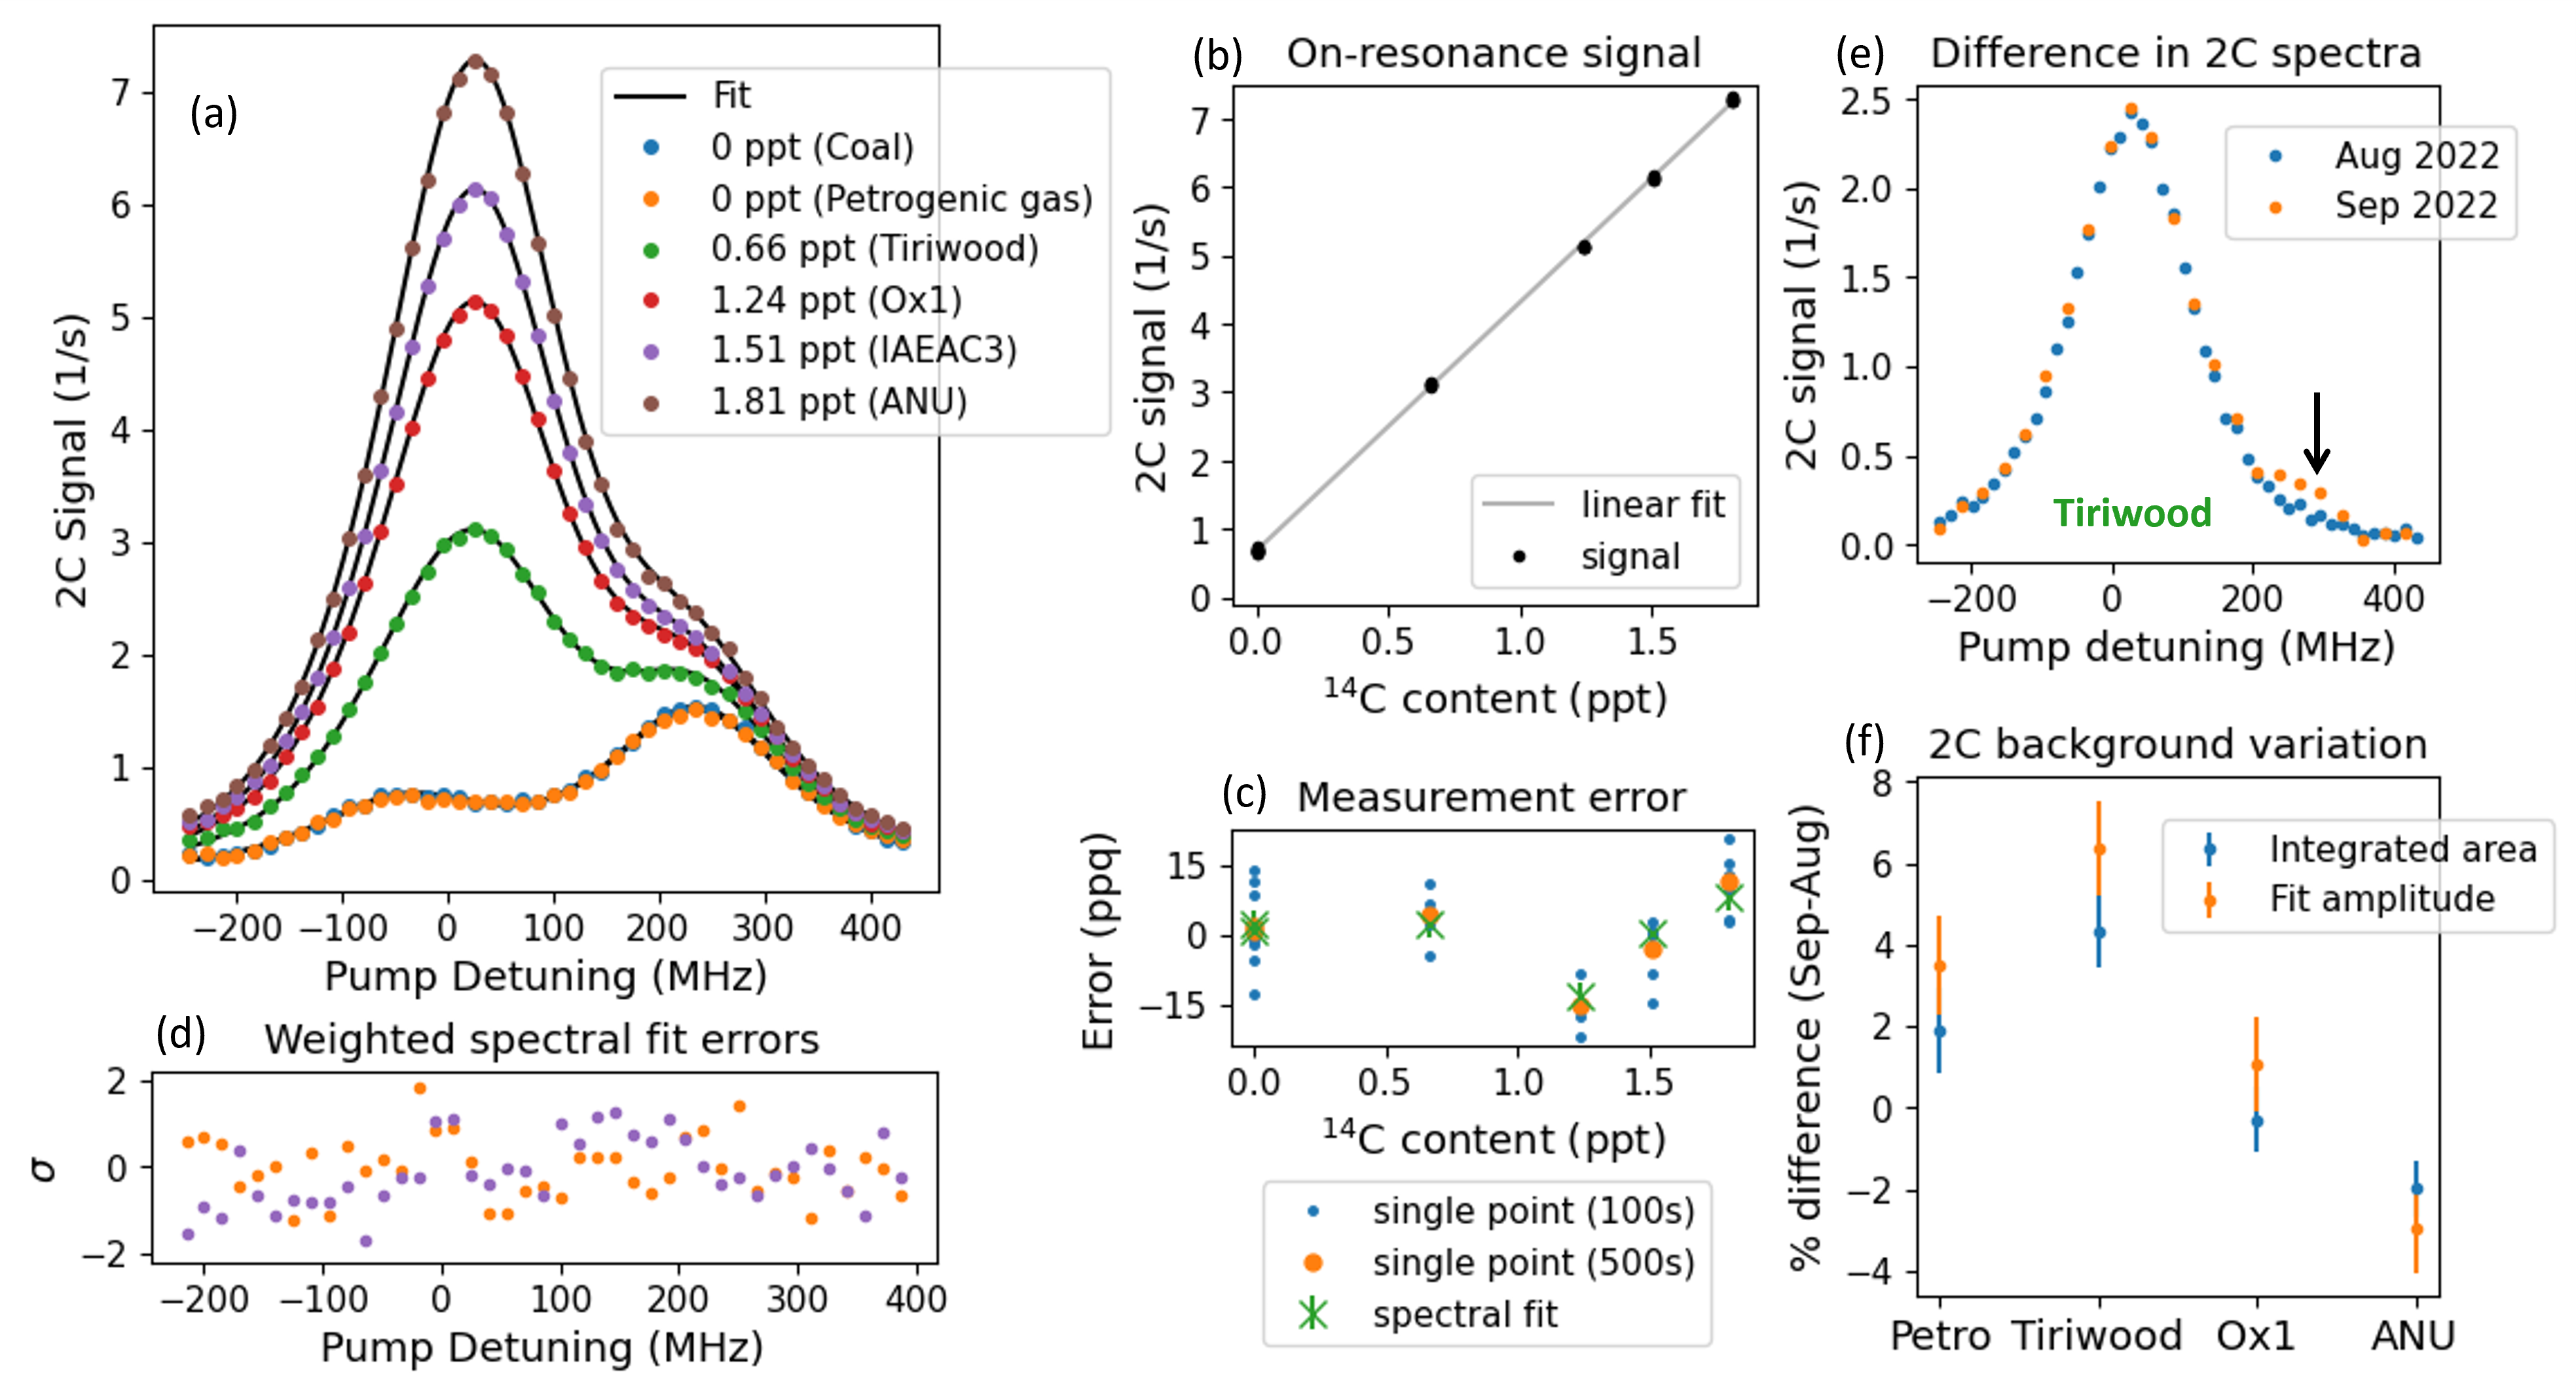
The 2C-CRDS technique allows, with very high signal-to-noise ratios, differentiation of six combusted 14C standard samples, for which the 14C content ranges from 0 to 1.5 natural abundance (Fig. 2a). Similarly, despite the very low 14C content (10-80 ppq), 2C-CRDS measurements of the four bio-fuel samples yield different signal levels at the 14CO2 transition region with only 60-s averaging per data point (Fig. 3a). The magnitude of the collision-induced background at the maximum of the 14CO2 2C peak (determined from the “Coal” and “Petrogenic gas” samples) is equivalent to that from 210 ppq of 14CO2. Considering that the 2C baseline is essentially flat from a 12C-enriched and 14C-depleted CO2 sample, collision-induced 2C transitions of at least one of the six 13C isotopologues of CO2 must be responsible for the observed background signals in Figs. 2a and 3a. This observation agrees with the results of our model for the collision-induced processes relevant to 2C-CRDS detection, which suggests hot-band pump excitation of 13C16O2 as the cause of the remaining background.
For each of the six combusted 14C samples in Fig. 2a, the signal at the maximum of the 14CO2 2C transition is measured five times in 1.5 hours, each for a duration of 100 s. These 2C signals at fixed pump-probe frequencies scale linearly with the 14C content of the corresponding samples (Fig. 2b). Residuals from a linear fit to the 100-s measurements (Fig. 2c) have a mean absolute error equivalent to 0.7 of the 14CO2 natural abundance (8.4 ppq). The measurement accuracy improves to 6.1 ppq after averaging the five 100-s measurements of each sample. Because of effective background compensation, the 2C signals measured with the fixed-frequency approach are highly repeatable, with month-to-month stability for their intensities at the 10-ppq level. However, given that the amount of improvement in the measurement accuracy (8.4 ppq6.1 ppq) is smaller than expected based on the amount of increase in averaging time (100 s500 s), the fixed-frequency measurements must have suffered from small systematic errors. Certain types of errors, such as variability in the sample 13C content (1-2 typical) and variations of the background 2C signal due to changes in the experimental conditions (Figs. 2e and 2f), can be compensated by spectral fitting (SI Appendix, Section S1.1). For all four trial measurements of combusted 14C samples, the spectral fit approach consistently yields improved measurement accuracy (4.0 ppq) compared to the fixed-frequency method (Table 1).
| Samples | Measurement | 14C range | 100 s fixed | 500 s fixed | Spectral fit | ||
|---|---|---|---|---|---|---|---|
| periods | (ppq) | (ppq) | (ppq) | (ppq) | |||
| 6 standards | Aug. 2022 (3 days) | 0-1800 | 8.4 | 6.1 | 4.5 | ||
| 4 standards | Sep. 2022 (1 day) | 0-1800 | 6.6 | 3.5 | 0.9 | ||
| 7 standards | Nov. 2022 (3 days) | 0-1800 | 8.5 | 7.9 | 6.5 | ||
| 4 bio-fuels | Dec. 2022 (4 days) | 10-80 | 6.1 | 6.1 | 4.2 | ||
| 6.9 | 5.1 | 4.0 |
Prior to our current results, the SCAR technique achieved the most sensitive measurements in the mid-IR. By utilizing the high intra-cavity power from a cavity-locked probe, SCAR allows simultaneous measurements of the empty-cavity ringdown rate and the gas-induced absorption. With baseline compensation and 2-hour signal averaging, SCAR achieved 10-ppq measurement of 14CO2 at 170 K [15, 23]. Room-temperature detection of 14CO2 is not possible with SCAR, even above the natural abundance, because of the overwhelmingly large background 1C signals from other CO2 isotopologues.
Current optical detection sensitivity
In our initial 2C-CRDS measurements [2, 3], the beginning of each probe ringdown transient was contaminated by random oscillations with amplitudes much larger than the detector noise [28]. We have shown that the shot-to-shot ringdown rate fluctuations () of our detection system can be reduced by 25, after a small current is applied to the probe laser current driver concurrent with the trigger for the probe AOM. This fast current injection, which is achieved by temporarily setting an incorrect “zero” level for the locking servo of the probe laser, detunes the probe laser frequency from the original cavity resonance. The combination of this laser-frequency-jump and the usual AOM-controlled beam shut-off leads to a “cleaner” initiation of the ringdown events than the use of an AOM alone [29, 30]. The extra noises in the original setup are most likely caused by interference between the ringdown signal and the leaked probe radiation through the AOM due to its finite light extinction ratio [30]. A value of 5 s-1 for the 2C signal with our current detection system (i.e., a shot-to-shot value of cm-1) is only 25 higher than the -shot noise-equivalent signal from 14CO2 at natural abundance. The short-term detection sensitivity reaches cm-1 after 23-minute averaging, based on Allan deviation analysis of 2C-CRDS signals from multiple 14CO2 samples (SI Appendix, Fig. S1). To our knowledge, this “ultimate sensitivity” level, equivalent to 14CO2 signals at 1.4 ppq concentration, is better than any previous optical measurements in the mid-IR.
Collision-induced 2C background
Adoption of the current P(14)-P(17) detection scheme for 14CO2 is guided by the results of a series of pump-probe experiments to study collision-induced background 2C signals from other CO2 isotopologues. In each of those experiments, the pump directly populates a rotational level in one of the following six nearly-degenerate vibrational states of 13CO2 in the 5100-5300 cm-1 energy region: , , , , , and (see Fig. 4 caption for the notation used for vibrational assignments). Probe signals from two 13CO2 transitions, P(5) (2213.90 cm-1) and P(16) (2214.12 cm-1), are observed in all six experiments.
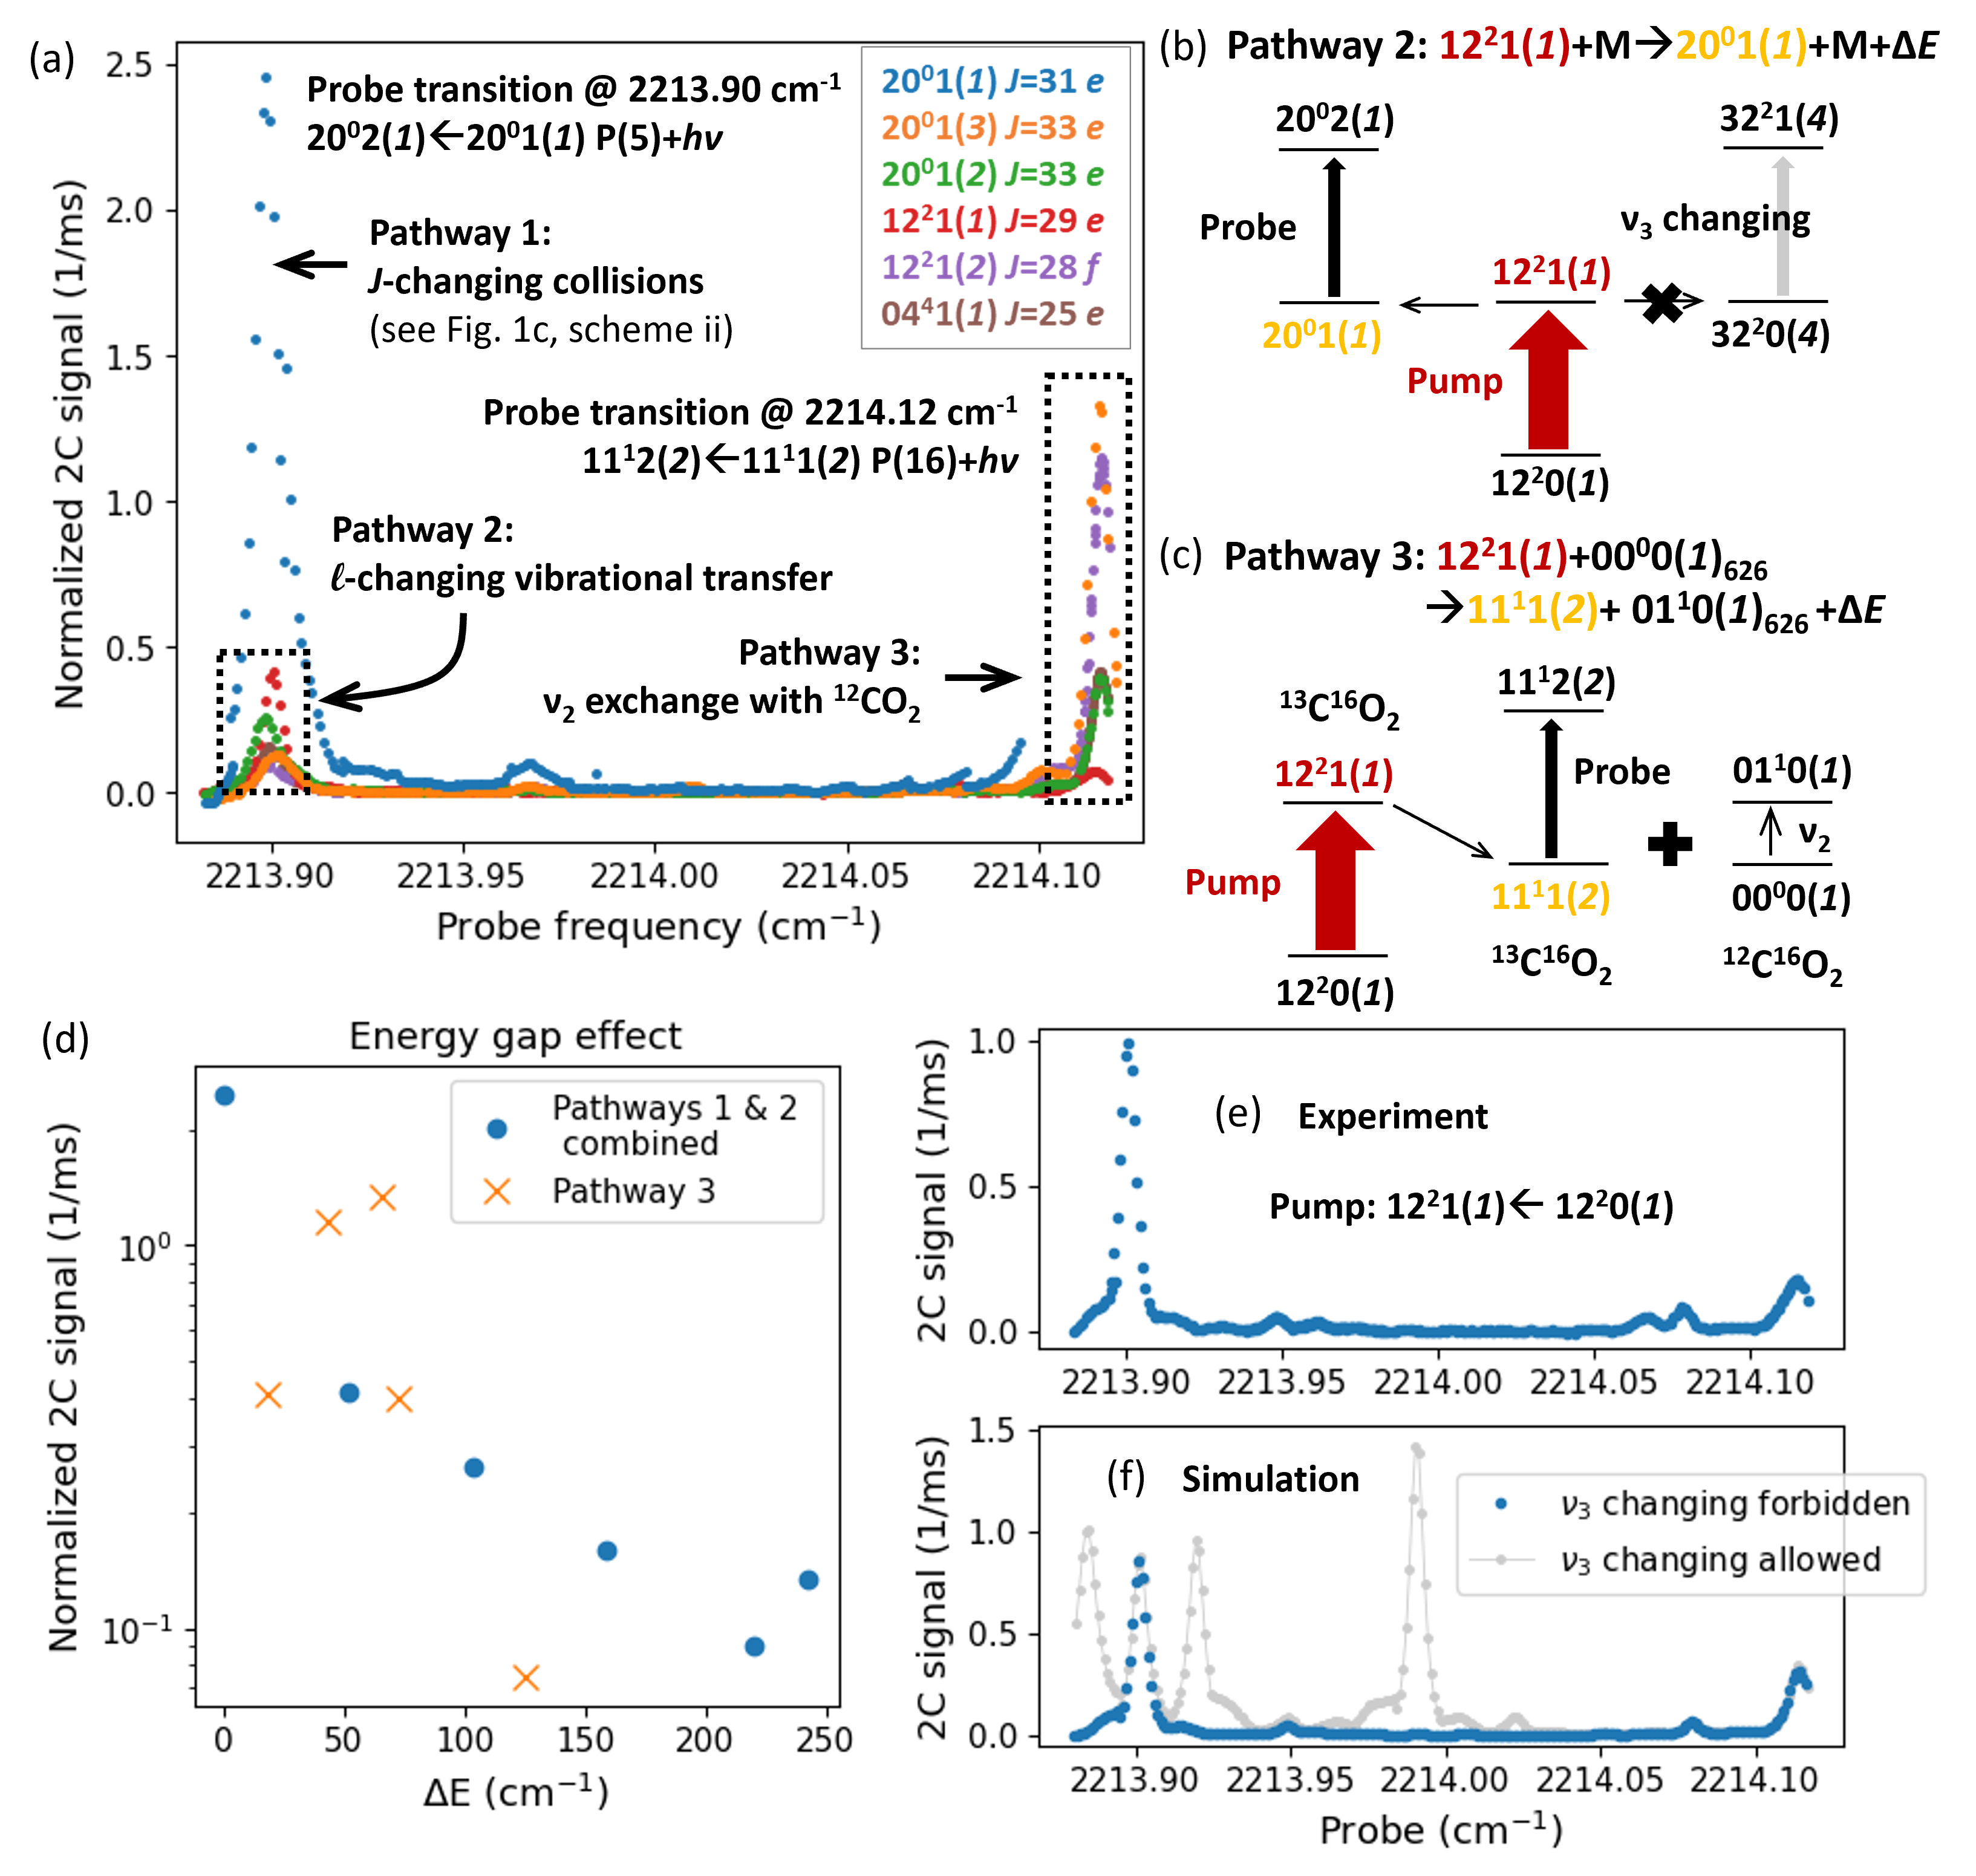
Three dominant collisional relaxation pathways (Fig. 4a) and propensity rules on the and quantum numbers can be identified from these experiments. Efficient -changing collisions (Pathway 1) occur within each vibrational state. -changing population transfer is observed from five of the pump-populated 13CO2 vibrational states into the nearly-degenerate (Pathway 2, see Fig. 4b). The pump-populated level also exchanges quanta of with the background 12CO2 bath (Pathway 3, see Fig. 4c) with a small energy change (). For Pathway 2 and 3, the intensities of the 2C peaks, in general, decrease by for every 100-200 cm-1 increase in (Fig. 4d). Note that the quantum number is in all three observed pathways in Fig. 4a. The - vibrational energy transfer between nearly-degenerate states, e.g., with cm-1 (see Fig. 4b), is significantly less efficient than these three pathways.
The identification of three dominant collisional processes, together with the use of the “energy-gap law” and quantum-number propensity rules [24], allows us to model the collision-induced 2C spectra in Fig. 4a (SI Appendix, Sections S3.2 and S3.3). According to our simulation for pump excitation into , J=29 (Fig. 4f), additional collision-induced 2C peaks would have been observed in the corresponding probe spectrum (Fig. 4e), if the -changing population transfer were allowed. The absence of these additional features strongly supports our proposed propensity rule on the conservation of the quantum number during 2C-CRDS measurements of CO2.
We have simulated the background 2C signals at various pump-probe combinations for 14CO2 detection, based on the fit model derived from Fig. 4 (SI Appendix, Section S3.3). The use of collision-assisted four-level detection significantly improves the likelihood of finding a pump-probe combination with reduced 2C background. With the same , P(14) pump transition as in the original experiment, background signals of 10 s-1 are predicted at the resonance frequencies of every , P-branch transition from P(31) to P(7). We measure the background signals with six of these P-branch probes, P(27) to P(17), that fall within the tuning range of the available QCL in our laboratory. For four of these P-branch transitions, the background signal is considerably smaller than that from the original R(13) probe (6.5 s-1). The current P(17) probe yields the smallest observed background signal. Work is ongoing to investigate other pump-probe combinations for further reduction of background 2C signals.
Implications and outlook
By monitoring the baseline fluctuations and background 1C absorption during alternative probe ringdown events, the 2C-CRDS method significantly enhances laser spectroscopic detection in , , and . In combination with recent advances in laser radiation sources, detectors, and mirror coatings in the mid-IR, the technique will greatly enhance the utility of high-resolution mid-IR detection for analytical and spectroscopic studies.
In addition to atmospheric 14CO2 measurements, mid-IR detection of trace reactive radical molecules in the atmosphere, such as OH, HO2, and NO3, can be achieved with the 2C-CRDS method. Field measurements of atmospheric radicals provide valuable experimental inputs for evaluating different models of oxidation chemistry in the earth’s troposphere [32, 33]. Among these radicals, detection of OH, often referred to as the “detergent of the atmosphere” for removing CH4 and other harmful gases (e.g., CO and volatile organic compounds), is particularly challenging because of its very low steady-state concentration, in the range of 40-400 ppq by volume (ppqv) during daytime. A mid-IR instrument will be lighter, more compact, and cheaper than the existing UV spectrometers for direct OH detection, which is based on either the fluorescence assay by gas expansion (FAGE) technique or multi-pass differential optical absorption spectroscopy (DOAS) to measure the transitions. Large and heavy high-throughput vacuum pumps, necessary for FAGE to avoid detection of the OH artifacts generated by the probe UV pulses [32, 33], would not be needed for mid-IR detection. While OH artifacts do not affect DOAS, which uses a low-intensity probe, the DOAS technique is not compatible with airborne measurements because of its large footprint (1 km total pathlength with 10-40 m mirror separation) [32].
Mid-IR detection of atmospheric OH encounters challenges similar to those for 14CO2. One-photon detection of OH (using , transitions near 3570 cm-1) is not possible because of spectral overlap with the -band transitions of water (3750 cm-1). An intra-cavity pump-probe scheme, e.g., , , P(2.5e/f) and , Q(1.5e/f), would allow accurate 2C-CRDS measurements of atmospheric OH concentrations without significant interference from nearby water transitions. Even though the transition dipole moments for OH ro-vibrational excitation are 10 smaller than those for the -band transitions of CO2 [22], detection sensitivity of 50 ppqv OH could be achieved based on the sensitivity of our current setup. For detection of radical species, background 2C signals from closed-shell molecules (e.g., water and CO2) can be further filtered by taking advantage of the much larger Zeeman effects of radicals. The measurement sensitivity, selectivity, and accuracy of radical species will all be significantly enhanced with the incorporation of AC Zeeman modulation [34, 35, 36] in the 2C-CRDS method.
The 2C-CRDS technique provides a new mid-IR detection scheme for spectroscopic and chemical dynamics studies. The technique will enable probing chemical species at concentrations, internal energies, and conformations that are not easily accessible with other methods. The incorporation of a mid-IR frequency comb [37] as the probe is a particularly attractive direction for the 2C-CRDS technique. With single-frequency pump and broadband probe, the technique will enable high-sensitivity, high-selectivity, and investigation of the molecular level structure in the high internal energy region of the electronic ground state of many molecules. Classic, fundamental problems in chemical physics, such as intramolecular vibrational energy redistribution, isomerization, and bond dissociation will be systemically explored in a highly- and level- manner. In combination with a Chen-type hyperthermal nozzle [38], which produces a vibrationally-hot but rotationally-cold population distribution [39], the 2C-CRDS method and its cavity-enhanced 2C variants complement (and, in certain applications, exceed) the capabilities of the widely-used stimulated emission pumping technique for studying molecular dynamics in the ground electronic state [40, 41], in particular for molecules with only short-lived (1 ns) electronically excited states.
Methods
2C-CRDS detection
With a 67-cm round trip, the free spectral range (FSR) of the three-mirror cavity is 443.3 MHz. The - and -mode cavity resonances are interleaved with a spacing of , because of a net -phase shift between the two polarizations upon reflection inside the three-mirror cavity [42]. Unlike the free-space pump-probe experiments, the pump laser frequency cannot be set at a fixed value in an intra-cavity excitation scheme. A change in the cavity FSR value leads to a shift in both the pump and probe laser frequencies [2, 3]. As a result, in general, the pump (-polarized) and probe (-polarized) frequencies will not be simultaneously on-resonance with their respective target molecular transitions in our 2C-CRDS experiments. For 14CO2 detection reported in this work, the pump radiation is coupled to a cavity -mode resonance that lies closest to the resonance frequency of a target 14CO2 pump transition. Under this experimental scheme, 2C signals from 14CO2 are observed with a maximum absolute pump detuning frequency of (221.65 MHz), regardless of the choice of the pump and probe transitions. Because of the strong cavity-enhanced pump power (20 W) that leads to significant power saturation and broadening (300 MHz at full-width half-maximum) of the pump transition, the observed 2C signals are minimally affected by the absence of double-resonance excitation condition.
The strong and sustained intra-cavity pump power is achieved by stabilizing the pump laser frequency to a cavity resonance with the Pound-Drever-Hall (PDH) method [43]. The output frequency from a third laser (“Mol” in Fig. 1a) is locked to the center of an N2O transition. The beatnote between this third laser and the pump is used to stabilize the cavity length, and to calibrate both the pump and probe laser frequencies. Further details on our 2C-CRDS detection system are provided in SI Appendix, Section S1.2.
The resonance frequencies of the P(14) (pump) and P(17) (probe) transitions of 14CO2 [25, 26, 27] are separated by nearly an exact odd integer multiple of the frequency spacing between neighboring - and -mode cavity resonances of our cavity (i.e., ). As a result, the 14CO2 2C transition from the current P(14)-P(17) pump-probe scheme occurs at the near double-resonance excitation condition, with a frequency detuning of 30 MHz and 0 MHz, respectively, for the pump and probe lasers. In addition, the level is near the maximum of the room-temperature rotational distribution of CO2. The observed 14CO2 signals in our current experiments are thus nearly maximized for intra-cavity pump-probe detection of the molecule.
As in our previous work [2], 2C-CRDS measurements of the CO2 gas samples are all taken at 20.1 torr. At this measurement pressure, the probe transition of 14CO2 is weakly saturated, considering that the magnitude of the 14CO2 2C signals depends on the starting voltage () of the ringdown fit, e.g., a 50 decrease of leads to 30 increase in the 2C signals. Note that, in the strongly-saturated regime, the gas-absorption-induced ringdown rate () approaches zero, while is independent of in the non-saturated limit. The background 2C signals at the 14CO2 pump-probe transition region relevant to this work is significantly less saturated than the 14CO2 probe transition. While the degree of saturation of the 14CO2 probe transition can be reduced at higher gas pressures, collision-induced homogeneous broadening will lead to an increase in the background 2C signal level. We are currently working on optimizing various experimental conditions, such as the gas pressure and selection of pump-probe transitions (for further reduction of the background 2C signal), to improve the sensitivity and accuracy of 2C-CRDS detection of 14CO2.
References
- [1] Daniele Romanini et al. “Introduction to cavity enhanced absorption spectroscopy” In Cavity-enhanced Spectroscopy and Sensing Springer, 2014, pp. 1–51
- [2] A Daniel McCartt and Jun Jiang “Room-temperature optical detection of 14CO2 below the natural abundance with two-color cavity ring-down spectroscopy” In ACS Sensors 7.11 ACS Publications, 2022, pp. 3258–3264
- [3] Jun Jiang and A Daniel McCartt “Two-color, intracavity pump–probe, cavity ringdown spectroscopy” In The Journal of Chemical Physics 155.10 AIP Publishing LLC, 2021, pp. 104201
- [4] Charles L Bennett et al. “Radiocarbon dating using electrostatic accelerators: Negative ions provide the key” In Science 198.4316 American Association for the Advancement of Science, 1977, pp. 508–510
- [5] D Earle Nelson, Ralph G Korteling and William R Stott “Carbon-14: Direct detection at natural concentrations” In Science 198.4316 American Association for the Advancement of Science, 1977, pp. 507–508
- [6] Harry Godwin “Half-life of radiocarbon” In Nature 195 Springer, 1962, pp. 984–984
- [7] Royal Ervin Taylor and Ofer Bar-Yosef “Radiocarbon dating: An archaeological perspective” Routledge, 2016
- [8] Kenneth W Turteltaub and John S Vogel “Bioanalytical applications of accelerator mass spectrometry for pharmaceutical research” In Current Pharmaceutical Design 6.10 Bentham Science Publishers, 2000, pp. 991–1007
- [9] Simon G Wong and Shuguang Ma “Design, conduct, and interpretation of human mass balance studies and strategies for assessing metabolites-in-safety testing (MIST) in drug development” In Overcoming Obstacles in Drug Discovery and Development Elsevier, 2023, pp. 137–174
- [10] Timothy J Heaton et al. “Radiocarbon: A key tracer for studying Earth’s dynamo, climate system, carbon cycle, and Sun” In Science 374.6568 American Association for the Advancement of Science, 2021, pp. eabd7096
- [11] Maryann Sargent et al. “Anthropogenic and biogenic CO2 fluxes in the Boston urban region” In Proceedings of the National Academy of Sciences 115.29 National Acad Sciences, 2018, pp. 7491–7496
- [12] John B Miller et al. “Large and seasonally varying biospheric CO2 fluxes in the Los Angeles megacity revealed by atmospheric radiocarbon” In Proceedings of the National Academy of Sciences 117.43 National Acad Sciences, 2020, pp. 26681–26687
- [13] Sourish Basu et al. “Estimating US fossil fuel CO2 emissions from measurements of 14C in atmospheric CO2” In Proceedings of the National Academy of Sciences 117.24 National Acad Sciences, 2020, pp. 13300–13307
- [14] I Galli et al. “Molecular gas sensing below parts per trillion: Radiocarbon-dioxide optical detection” In Physical Review Letters 107.27 APS, 2011, pp. 270802
- [15] Iacopo Galli et al. “Spectroscopic detection of radiocarbon dioxide at parts-per-quadrillion sensitivity” In Optica 3.4 Optical Society of America, 2016, pp. 385–388
- [16] A Daniel McCartt, Ted J Ognibene, Graham Bench and Kenneth W Turteltaub “Quantifying carbon-14 for biology using cavity ring-down spectroscopy” In Analytical Chemistry 88.17 ACS Publications, 2016, pp. 8714–8719
- [17] Adam J Fleisher et al. “Optical measurement of radiocarbon below unity fraction modern by linear absorption spectroscopy” In The Journal of Physical Chemistry Letters 8.18 ACS Publications, 2017, pp. 4550–4556
- [18] Guillaume Genoud et al. “Radiocarbon dioxide detection based on cavity ring-down spectroscopy and a quantum cascade laser” In Optics Letters 40.7 Optica Publishing Group, 2015, pp. 1342–1345
- [19] Ryohei Terabayashi et al. “Mid-infrared cavity ring-down spectroscopy using DFB quantum cascade laser with optical feedback for radiocarbon detection” In Japanese Journal of Applied Physics 59.9 IOP Publishing, 2020, pp. 092007
- [20] Nicole A Kratochwil et al. “Nanotracing and cavity-ring down spectroscopy: A new ultrasensitive approach in large molecule drug disposition studies” In PloS one 13.10 Public Library of Science San Francisco, CA USA, 2018, pp. e0205435
- [21] Logan E Mitchell et al. “A multi-city urban atmospheric greenhouse gas measurement data synthesis” In Scientific Data 9.1 Nature Publishing Group UK London, 2022, pp. 361
- [22] IE Gordon et al. “The HITRAN2020 molecular spectroscopic database” In Journal of Quantitative Spectroscopy and Radiative Transfer 277 Elsevier, 2022, pp. 107949
- [23] Maria Giulia Delli Santi et al. “Biogenic fraction determination in fuel blends by laser-based 14CO2 detection” In Advanced Photonics Research 2.3 Wiley Online Library, 2021, pp. 2000069
- [24] James Yardley “Introduction to Molecular Energy Transfer” Elsevier, 2012
- [25] Iacopo Galli et al. “The band of 14C16O2 molecule measured by optical-frequency-comb-assisted cavity ring-down spectroscopy” In Molecular Physics 109.17-18 Taylor & Francis, 2011, pp. 2267–2272
- [26] Emil J Zak et al. “Room temperature line lists for CO2 symmetric isotopologues with ab initio computed intensities” In Journal of Quantitative Spectroscopy and Radiative Transfer 189 Elsevier, 2017, pp. 267–280
- [27] Xinchuan Huang, David W Schwenke, Richard S Freedman and Timothy J Lee “Ames-2016 line lists for 13 isotopologues of CO2: Updates, consistency, and remaining issues” In Journal of Quantitative Spectroscopy and Radiative Transfer 203 Elsevier, 2017, pp. 224–241
- [28] Kevin K Lehmann and Haifeng Huang “Optimal signal processing in cavity ring-down spectroscopy” In Frontiers of Molecular Spectroscopy Elsevier, 2009, pp. 623–658
- [29] David M Balslev-Clausen “Application of cavity ring down spectroscopy to isotopic bio- geo-& climate-sciences & the development of a mid-infrared CRDS analyzer for continuous measurements of N2O isotopomers”, 2011
- [30] H Huang and KK Lehmann “Noise caused by a finite extinction ratio of the light modulator in CW cavity ring-down spectroscopy” In Applied Physics B 94 Springer, 2009, pp. 355–366
- [31] Xinchuan Huang, David W Schwenke, Richard S Freedman and Timothy J Lee “Ames-2021 CO2 Dipole Moment Surface and IR Line Lists: Toward 0.1% Uncertainty for CO2 IR Intensities” In The Journal of Physical Chemistry A 126.35 ACS Publications, 2022, pp. 5940–5964
- [32] Dwayne E Heard and Michael J Pilling “Measurement of OH and HO2 in the troposphere” In Chemical Reviews 103.12 ACS Publications, 2003, pp. 5163–5198
- [33] Daniel Stone, Lisa K Whalley and Dwayne E Heard “Tropospheric OH and HO2 radicals: Field measurements and model comparisons” In Chemical Society Reviews 41.19 Royal Society of Chemistry, 2012, pp. 6348–6404
- [34] Weixiong Zhao et al. “Sensitive and selective detection of OH radicals using Faraday rotation spectroscopy at 2.8 m” In Optics Express 19.3 Optica Publishing Group, 2011, pp. 2493–2501
- [35] J Pfeiffer, D Kirsten, P Kalkert and W Urban “Sensitive magnetic rotation spectroscopy of the OH free radical fundamental band with a colour centre laser” In Applied Physics B 26 Springer, 1981, pp. 173–177
- [36] Rafał Lewicki et al. “Ultrasensitive detection of nitric oxide at 5.33 m by using external cavity quantum cascade laser-based Faraday rotation spectroscopy” In Proceedings of the National Academy of Sciences 106.31 National Acad Sciences, 2009, pp. 12587–12592
- [37] Albert Schliesser, Nathalie Picqué and Theodor W Hänsch “Mid-infrared frequency combs” In Nature Photonics 6.7 Nature Publishing Group UK London, 2012, pp. 440–449
- [38] Daniel W Kohn, Horst Clauberg and Peter Chen “Flash pyrolysis nozzle for generation of radicals in a supersonic jet expansion” In Review of Scientific Instruments 63.8 American Institute of Physics, 1992, pp. 4003–4005
- [39] P Bryan Changala, Joshua H Baraban, Anthony J Merer and Robert W Field “Probing - isomerization in the S1 state of C2H2 via H-atom action and hot-band-pumped IR-UV double resonance spectroscopies” In The Journal of Chemical Physics 143.8 AIP Publishing LLC, 2015, pp. 084310
- [40] Charles E Hamilton, James L Kinsey and Robert W Field “Stimulated emission pumping: New methods in spectroscopy and molecular dynamics” In Annual Review of Physical Chemistry 37.1 Annual Reviews 4139 El Camino Way, PO Box 10139, Palo Alto, CA 94303-0139, USA, 1986, pp. 493–524
- [41] Hai-Lung Dai and Robert W Field “Molecular Dynamics and Spectroscopy by Stimulated Emission Pumping” World scientific, 1995
- [42] Shailendhar Saraf, Robert L Byer and Peter J King “High-extinction-ratio resonant cavity polarizer for quantum-optics measurements” In Applied Optics 46.18 Optica Publishing Group, 2007, pp. 3850–3855
- [43] RWP Drever et al. “Laser phase and frequency stabilization using an optical resonator” In Applied Physics B 31.2 Springer, 1983, pp. 97–105
Acknowledgments
We thank Professor Robert W. Field (MIT), Stephan L. Coy (MIT), and Professor Kevin K. Lehmann (UVA) for insightful and encouraging comments on the manuscript, and Bruce Buchholz, Kari Finstad, Esther Ubick, and Ted Ognibene (LLNL) for their assistance with the sample preparations.
Funding: Research reported in this publication was supported by the National Institute Of General Medical Sciences of the National Institutes of Health (Award Number R01GM127573). This work was partially supported by the National Nuclear Security Administration’s Office of Defense Nuclear Nonproliferation Research and Development. Work was performed in part at the National User Resource for Biological Accelerator Mass Spectrometry, which is operated at LLNL under the auspices of the U.S. Department of Energy under contract DE-AC52-07NA27344. The User Resource is supported by the National Institutes of Health, National Institute of General Medical Sciences under grant R24GM137748.
Author contributions: Conceptualization: J.J. and A.D.M.; Experimental design: J.J. and A.D.M.; Data acquisition: J.J. and A.D.M.; Modeling: J.J.; Funding acquisition: A.D.M.; Writing (original draft): J.J.; Writing (revision): J.J. and A.D.M.
Competing interests: J.J. and A.D.M. are employees of Lawrence Livermore National Laboratory, which is managed by Lawrence Livermore National Security (LLNS) LLC. A patent application based on the 2C-CRDS technique, which is applied to the 14CO2 measurements in this study, was filed by LLNS. The patent application was approved by the US Patent Office with Patent number US11585753.
Data and materials availability: The data that support the findings of this study are available from the corresponding authors upon reasonable request.
Supplementary information
Spectral fit
Details of the 2C-CRDS detection system
Sample preparation
Supplementary text
Figs. S1 to S5