\ul
M3PT: A Multi-Modal Model for POI Tagging
Abstract.
POI tagging aims to annotate a point of interest (POI) with some informative tags, which facilitates many services related to POIs, including search, recommendation, and so on. Most of the existing solutions neglect the significance of POI images and seldom fuse the textual and visual features of POIs, resulting in suboptimal tagging performance. In this paper, we propose a novel Multi-Modal Model for POI Tagging, namely M3PT, which achieves enhanced POI tagging through fusing the target POI’s textual and visual features, and the precise matching between the multi-modal representations. Specifically, we first devise a domain-adaptive image encoder (DIE) to obtain the image embeddings aligned to their gold tags’ semantics. Then, in M3PT’s text-image fusion module (TIF), the textual and visual representations are fully fused into the POIs’ content embeddings for the subsequent matching. In addition, we adopt a contrastive learning strategy to further bridge the gap between the representations of different modalities. To evaluate the tagging models’ performance, we have constructed two high-quality POI tagging datasets from the real-world business scenario of Ali Fliggy. Upon the datasets, we conducted the extensive experiments to demonstrate our model’s advantage over the baselines of uni-modality and multi-modality, and verify the effectiveness of important components in M3PT, including DIE, TIF and the contrastive learning strategy.
1. Introduction
A point of interest (POI) is a specific location that someones may feel helpful or interesting, including a park, restaurant, shop, museum, and so on. In the last decades, various services related to POIs have become very popular on Web. POI tagging, i.e., annotating POIs with some informative tags (labels), which not only help users better understand POIs’ characteristics, but also are useful to discover the relatedness or similarities between different POIs. As a result, POI tagging can facilitate many downstream applications, such as POI search (Gao et al., 2022) and recommendation (Kammerer et al., 2009; Yan et al., 2023).
Many previous solutions achieve POI tagging based on textual data but only have limited performance. These solutions generally extract some features from the textual data relevant to a given POI, to infer the probability that each tag can be used to annotate the POI. The textual data mainly includes users’ check-in logs (Krumm and Rouhana, 2013; Krumm et al., 2015), POI taxonomy (Wang et al., 2017) and descriptions (Lagos et al., 2020). However, considering only textual data for POI tagging may suffer from the problems of false positive (FP) and false negative (FN). FP refers to the fact that it might annotate the POI with the tags that are semantically related to the textual data but incorrect in fact. FN refers to the fact that it might overlook the tags that are semantically dissimilar to the textual data but correct in fact.
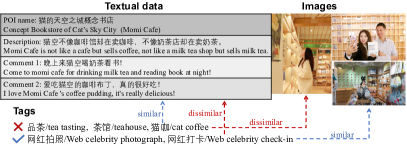
We have found that there is sufficient visual data (such as images) related to POIs on many real-world platforms, which is in fact an essential supplement of the textual data, to solve the aforementioned problems. For example, Fig. 1 displays not only the textual data of a specific POI (Momi Cafe) including its name, description and user comments, but also some images posted in the comments. As shown in the figure, the FP and FN problems are alleviated or solved if the images are considered besides the textual data. Specifically, the POI was wrongly labeled with ‘品茶/tea tasting’ due to the comment ‘晚上来猫空喝奶茶看书! / Come to Momi Xafe for drinking milk tea and reading book at night!’. While the images do not display the scene of tea tasting, hence helping the model correct such FP problem. Besides, the incorrect tag ‘茶馆/teahouse’, and ‘猫咖/cat coffee’ could be filtered out since their semantics are not related to the images. For FN, the correct tag ‘网红拍照/Web celebrity photograph’ and ‘网红打卡/Web celebrity check-in’ would be inferred as they have similar semantics to the images, although they are less semantically similar to the texts. The significance of POI images on discovering correct tags inspires us to leverage the textual and visual data simultaneously to achieve effective POI tagging.
A straightforward approach of leveraging images is to transfer an existing multi-modal model (e.g., CLIP (Radford et al., 2021) and BLIP (Li et al., 2022)). However, this approach’s effect is limited for the following reasons, especially given that the tagging task we focus on in this paper is specific to a real-world tour scenario of Ali Fliggy111It is a famous Chinese tour platform and its URL is https://www.fliggy.com.. 1) There is a gap between the textual and visual representations in general, which would likely lead to the mismatching between the POI and the gold tags. 2) Leveraging the existing image pre-trained models (such as ViT (Dosovitskiy et al., 2021)) might result in unsatisfactory representations of POI images, since our task is a domain-specific tagging task.
To address these problems, in this paper we propose a novel Multi-Modal Model for POI Tagging, namely M3PT, which is built based on a matching framework. Our model achieves enhanced tagging performance through the full fusion of the given POI’s textual and visual features, and the precise matching between the POI’s multi-modal representation and the candidate tag’s representation. Specifically, in M3PT’s feature encoding module, we devise a Domain-adaptive Image Encoder, namely DIE, to obtain the embeddings of POI images aligned to their gold tags’ semantics. Then, we design a Text-Image Fusion module, namely TIF, to fuse the textual and visual features of the POI. In TIF, we construct a clustering layer followed by an attention layer to distill the significant features for generating the POI’s content embedding. Furthermore, we adopt a contrastive learning strategy to refine the embeddings of different modalities, and thus the cross-modality gap is bridged. In addition, the matching-based framework enables our M3PT to conveniently achieve the precise matching for a new tag, which is beyond the premise in traditional multi-label classification, i.e., the classification towards the close set of predefined labels.
Our contributions in this paper are summarized as follows.
1. To the best of our knowledge, this is the first work to exploit a multi-modal model incorporating the textual and visual semantics to achieve the POI tagging on a real-world business platform. To this end, we propose a novel POI tagging model M3PT based on a multi-modal matching framework, to achieve the precise matching between POIs and tags.
2. We specially devise a domain-adaptive image encoder DIE in our model to obtain the optimal embedding for each input image, which is aligned to the semantics of the image’s gold tags. The image embeddings generated by DIE are better adaptive to the requirements of the real-world scenario, resulting in enhanced tagging performance.
3. We have constructed two high-quality POI tagging datasets from the real-world tour scenario of Ali Fliggy, upon which we evaluate the models’s tagging performance. Our extensive experiment results not only demonstrate our M3PT’s advantage over the previous models of uni-modality and multi-modality, but also justify the effectiveness of the important components in M3PT.
2. Related Work
2.1. POI Tagging Model
Existing POI tagging solutions can be divided into three groups. The first group uses users’ check-in data of POIs as inputs, and extracts discriminative features to predict location labels. Krumm et al. (Krumm and Rouhana, 2013; Krumm et al., 2015) presented a set of manually designed features that are extracted from the public place logs and individual visits. Some other methods (Hegde et al., 2013) leverage the features of user check-in activities and other behavior data to train the generative probabilistic models to infer POI tags. The authors in (Ye et al., 2011; Wang et al., 2017; Zhu et al., 2013; Yang et al., 2016) discussed more comprehensive check-in data including POI unique identifiers, user unique identifiers, the number, time and duration of check-ins, the latitude/longitude of user positions, as well as user demographic information. Label annotation for POIs was first studied in (Ye et al., 2011), which introduces a collective classification method for feature extraction.The authors in (Zhu et al., 2013) studied how to select the most relevant features for POI tagging. Yang et al. (Yang et al., 2016) proposed an updatable sketching technique to learn compact sketches from user activity streams and then used a KNN classifier to infer POI tags. Wang et al. (Wang et al., 2017) proposed a graph embedding method to learn POI embeddings from POI temporal bipartite graphs, which are then used by an SVM classifier of POIs labels.
The second group includes the methods proposed in (He et al., 2016a; Lagos et al., 2020; Zhou et al., 2019), which also use more fine-grained information of POIs besides user check-in data. For example, (He et al., 2016a) includes general tags that may be related to categories and other information, e.g., ”godzilla”. (Zhou et al., 2019) is the first to use POI name and address tokens, that are obtained by the pre-training on a domain and language-specific corpus. Lagos et al. (Lagos et al., 2020) found that POIs have several distinctive properties, including notably multiscript names, geospatial identities, and temporally defined context. Thus they proposed an approach to complete POI semantic tags in a crowdsourced database automatically.
Similar to our work, the third group leverages image tagging, of which many solutions use ViT (Dosovitskiy et al., 2021) as the backbone to accomplish multiple image classification. Although many algorithms have been proposed for automatic image annotation (Barnard et al., 2003; Goh et al., 2005; Cheng et al., 2018), image tag refinement is treated as an independent problem, and has become an exciting issue (Lin et al., 2013; Feng et al., 2014; Li et al., 2016; Zhang et al., 2017).
2.2. Vision-language Pre-trained Model
Vision-language pre-training (VLP) aims to improve the performance of downstream vision and language tasks by pre-training models on large-scale image-text pairs. The pre-training tasks of VLP models mainly include image-text contrastive learning and language modeling (LM) based tasks. VirTex (Desai and Johnson, 2020), ICMLM (Sariyildiz et al., 2020), and ConVIRT (Zhang et al., 2020) have demonstrated the potential of Transformer-based LM, masked LM, and contrastive LM on learning image representations from the text. CLIP(Radford et al., 2021), BLIP (Li et al., 2022), FILIP (Yao et al., 2022), ALIGNm (Jia et al., 2021) and UNIMO (Li et al., 2021) mainly make use of cross-modal contrastive learning which aligns the textual and visual information into a unified semantic space. VisualBERT (Li et al., 2019), UNITER (Chen et al., 2020), and M6 (Lin et al., 2021) employ LM-like objectives, including both masked LM (e.g., Masked Language/Region Modeling) and auto-regressive LM (e.g., image captioning, text-grounded image generation). In addition, some methods (such as BriVL (Huo et al., 2021)) rely on a pre-trained object detection model, such as Faster-RCNN (Ren et al., 2015), to extract regional image features offline. It requires extra labeled bounding-box data and makes the approach less scalable. Recent efforts such as SOHO (Huang et al., 2021) and SimVLM (Wang et al., 2022) try to alleviate this burden via visual dictionary or PrefixLM (Raffel et al., 2020).
3. OVERVIEW
3.1. Problem Formalization
Given a POI , the task objective of our model is to filter out some appropriate tags from all candidate tags, to characterize . Expressly, in our scenario of Ali Fliggy, some textual contexts and images related to are also provided to the model to achieve the tagging task better. The textual contexts include the name, category, description, and user comments of . The images include ’s main picture displayed on the platform and the pictures posted in user comments. Formally, we denote all textual contexts of as , and all related images as . The model should compute the following matching score (probability) between and a candidate tag ,
where represents all operations in our model. With and a well-chosen threshold , the model predicts whether should be used to annotate .
3.2. Solution Framework
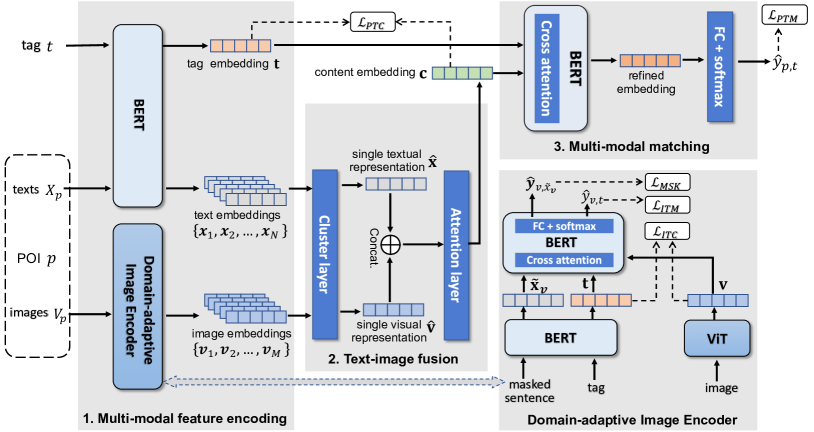
As shown in Fig. 2, our proposed M3PT achieving POI tagging pipeline can be divided into the following three phases.
1. Feature Encoding
The candidate tag , the textual contexts, and images of the given POI are encoded into the feature embeddings in this first phase. The relevant operations are conducted in the feature encoding module of our model, which consists of a text encoder and an image encoder. Specifically, we take BERT (Devlin et al., 2018) as the text encoder to encode into a tag embedding and encode into a set of text feature embeddings of simultaneously. For the image feature encoding of , we adopt a new image encoder DIE, which is specific to our tagging task in Fliggy’s domain, as we mentioned in Section 1. We will introduce the details of the feature encoding module, including DIE, in Section 4.1.
2. Text-image Fusion
The operations in the second phase are conducted in the TIF module of our model. The TIF mainly consists of two layers. The first layer is a clustering layer, through which ’s text embeddings and image embeddings obtained from the first phase are aggregated into a single textual representation and a single visual representation of , respectively. Then, these two representations are concatenated and fed into the attention layer of TIF to generate ’s content embedding for the POI-tag matching in the subsequent phase. As we emphasized in Section 1, the clustering and attention operations in TIF are proposed to distill the significant features to represent ’s content, whose details will be introduced in Section 4.2.
3. Multi-modal Matching
To conduct the operations in the third phase, we build a multi-modal matching module fed with ’s content embedding and ’s tag embedding generated in the previous phases to output the final score . The main body of this module is also a BERT encoder, whose details will be introduced in Section 4.3.
4. METHODOLOGY
4.1. Multi-modal Feature Encoding
In the feature encoding module of our model, the multi-modal features of (including textual and visual features) and ’s textual features are first encoded into embeddings, respectively.
Specifically, ’s textual inputs are fed into a text encoder constructed based on BERTbase to generate a set of ’s text embeddings. The text encoder is initialized with the first 6 layers of BERTbase. Formally, for an input text , we get its feature embedding as
| (1) |
where denotes the encoding operations in the text encoder, and is the embedding’s dimension.
Simultaneously, is also fed into the same text encoder to obtain its tag embedding as
| (2) |
4.1.1. Domain-adaptive Image Encoder
Given that our tagging task is specific to the real-world scenario of Fliggy, we propose a new image encoder DIE to encode the input images of , i.e., , into a set of image feature embeddings, instead of using an existing image pre-trained model (Li et al., 2019; Dosovitskiy et al., 2021). To adapt to the particular goal of our POI tagging task, the embedding of an image in our model should be learned concerning the tags with the same semantics as it, i.e., its gold tags. It indicates that the learned embedding of an image should help the model recognize its gold tags. To this end, unlike the traditional image encoders such as ViT (Dosovitskiy et al., 2021), which only receive images as input, our DIE takes an image and the text having the same semantics to constitute an input sample. Since DIE is also a pre-trained encoder, we propose a pretraining mask task.
Mask Learning
Specifically, given an image , we first compose a sentence to indicate ’s semantics, denoted as , which includes a gold tag of , denoted as . Then, we convert into by replacing one token in with a special token [MASK]. For example, if an image and its annotated tag =‘cup’ are obtained, we have
Accordingly, we take as the input of the mask learning task. As displayed in Fig. 2, and are fed into a ViT encoder and a BERTbase in DIE, to generate ’s embedding and ’s embedding , respectively. Then, based on these two embeddings, DIE computes the following probability distribution indicating which token is on the position of [MASK] as,
| (3) |
where represents all calculations in the prediction layer of DIE. Specifically, is a vector of dimensions and is the size of token vocabulary. Each entry of is the probability that the corresponding token is on the position of [MASK]. To compute this probability distribution more precisely, is first refined in terms of through the cross-attention operations as (Vaswani et al., 2017). Then is computed based on the refined through a fully-connected layer and softmax operation. At last, a token with the largest probability in is predicted as on the position of [MASK].
To pretrain DIE, we formulate the mask learning’s loss as
| (4) |
where is the cross-entropy function and is the training set. is the indicator vector, in which the entries of the real tokens are 0 and the rest entries are 0.
Contrastive Learning
In addition, to better align ’s embedding to its gold tags’ embeddings, we further consider a contrastive learning loss. We first define ’s similarity score to each paired tag as
| (5) |
where is any one tag in ’s paired tag set including its gold tag , and is ’s embedding obtained from the BERTbase encoder. In addition, is the temperature used to maintain the balance between the alignment and consistency of the contrasted samples (Wang and Liu, 2021). To train the model better in contrastive learning, we tend to select the incorrect tags but semantically similar (having close embeddings) to the image as hard negative samples. Accordingly, a small makes the model focus on discriminating the hard negative samples, resulting in better performance.
Similarly, a tag ’s similarity score to each paired image is
| (6) |
where is any one image in ’s paired image set including the gold images with the same semantics as . Then, the contrastive learning loss is
| (7) |
where and are both the real label indicating the matching between and .
Image-tag Matching Learning
Furthermore, to better achieve the matching between images and tags, we append an image-tag matching loss for DIE’s pretraining. We use to denote the matching probability between and . As the operations in Equation 3, is first refined in terms of through cross-attention and then used to compute . Then, the matching loss is
| (8) |
After all, the overall loss of DIE’s pre-training is222The same coefficient for each sub-loss is the best choice based on our tuning studies.
| (9) |
With the pre-trained DIE, the feature embedding of an image is obtained by
| (10) |
where denotes the encoding operations in DIE.
4.2. Text-image Fusion
The operations in this phase are conducted in the TIF module, where the textual and visual embeddings of are fused into a condensed representation, namely content embedding, to achieve the subsequent matching conveniently.
4.2.1. Clustering Layer
The first step in TIF is to aggregate the multiple embeddings from either modality into a single embedding. To this end, we first build a clustering layer in TIF to perform the following operations.
For an image ’s feature embedding obtained by Equation 10, each can be regarded as a frame-level descriptor of . We used a clustering algorithm the same as NeXtVLAD (Lin et al., 2018) to cluster the frame-level descriptors of into groups. Suppose the -th cluster’s centroid is , we refine in terms of as
| (11) |
where is a function measuring ’s proximity to the -th cluster. We adopt a fully-connected layer with softmax activation to obtain as
| (12) |
where and are both trainable parameters. Furthermore, there are groups of in total.
Then, to aggregate the refined frame-level descriptors of all image embeddings, we get the -th aggregated descriptor in terms of the -th cluster through the following sum pooling,
| (13) |
where is the -th refined frame-level descriptor of the -th image embedding obtained by Equation 11. Accordingly, we have aggregated descriptors in total, which are then reduced into a single visual representation of dimensions, denoted as , through a fully-connected layer.
To aggregate the text embeddings generated in the previous phase into a single textual representation, denoted as , we adopt the same operations introduced above for generating the single visual representation.
4.2.2. Attention Layer
Next, we input the concatenation of and into the attention layer in TIF. This layer reassigns the feature weights in the input through the attention and reshape operations and outputs an embedding of dimensions. Thus, the more significant features are highlighted in the output, which is just ’s content embedding, denoted as . Overall, condenses the significant multi-modal features of .
4.3. Mutil-modal Matching
The objective of the multi-model matching module in the third phase is to achieve the precise matching between and , based on ’s content embedding and ’s tag embedding .
In fact, the architecture of this module is similar to the prediction layer in DIE since both of their objectives are to achieve the matching between two objects. Specifically, the candidate tag’s embedding is refined in terms of ’s content embedding through the cross-attention operations and then used to compute through a fully-connected layer and softmax operations. As last, M3PT predicts that is a correct tag of if .
4.4. Model Training
Similar to Equation 8, the main loss of our model training is the following POI-tag matching loss,
| (14) |
where is the training set consisting of POI-tag pairs.
To improve the alignment of ’s content embedding and ’s tag embedding, we also append a contrastive learning loss the same as Equation 57 for our model training, except that is replaced with when computing and . Thus, this contrastive learning loss is
| (15) |
And the overall loss of M3PT’s training is
| (16) |
where is a controlling parameter.
5. Experiments
5.1. Dataset Construction
We have constructed the following two datasets for our evaluation experiments, of which the detailed statistics are listed in Table 1.
| Dataset | POI # | tag # | POI-tag # | tag # | image # | avg. text # |
| name | per POI | per POI | per POI | |||
| MPTD1 | 63,415 | 354 | 197,254 | 3 | 64 | 126 |
| MPTD2 | 6,415 | 286 | 27,486 | 4 | 8 | 16 |
MPTD1: The first dataset, named MPTD1 (Multi-modal POI Tagging Dataset), was constructed directly from the real-world tour scenario of Fliggy, including more than 60,000 POIs, 354 unique tags, and more than 190,000 POI-tag pairs. For each POI in this dataset, its related textual contexts (texts in short) include its full name, introduction, categories, and user comments collected from Fliggy’s website. Each POI’s related images include the main picture shown on the top of its introduction page, as well as the pictures posted in its user comments. We first collected the original tags for each POI in some ways, including basic rules, manual selections, semantic-based algorithms, etc. When sufficient original tags had been collected, the experts verified and refined them based on their actual effects on Fliggy’s tour platform. At last, the reserved tags were identified as the gold (gound-truth) tags for these POIs. All POIs were divided into the training set, validation set, and test set according to 8:1:1. In each set, besides the POIs, their gold tags, texts, and images were also included.
MPTD2: Although the texts and images of each POI in MPTD1 are sufficient, the model training is time-consuming if we feed all of them into the model. In addition, most of them are not semantically related to the POI’s tags. Thus, to compare all models’ capabilities of leveraging a POI’s textual and visual features that are semantically related to its gold tags more efficiently, we further constructed a more concise dataset MPTD2. We randomly selected about one-tenth of the POIs in MPTD1, together with their tags, texts, and images. For each selected POI, we recruited some volunteers to check its texts and images and only retain those with similar semantics to its tags. For example, only the comments that directly mention the tags or are highly semantically related to the tags were retained. Similarly, only the images verified as semantically related to the POI’s tags were retained. As a result, the texts and images retained in MPTD2 can be directly leveraged as pieces of evidence to judge the POI’s matching to its tags. The ratio of the training set, validation set, and test set in MPTD2 is also 8:1:1.
| Notation | Value | Description |
| 0.12 | temperature in | |
| 0.08 | temperature in | |
| 0.5 | threshold of prediction probability | |
| 768 | embedding dimension | |
| 64 | cluster number in TIF | |
| 414 | textual/visual representation dimension in TIF | |
| 0.5 | controlling parameter in loss (Equation 16) |
| Model | MPTD2 | MPTD1 | ||||||||||||
| M-F | M-R | M-F1 | P-e | R-e | F1-e | HLS | M-F | M-R | M-F1 | P-e | R-e | F1-e | HLS | |
| BERT | 74.67 | 26.65 | 39.26 | 75.72 | 29.51 | 42.40 | 0.0835 | 45.25 | 12.18 | 19.46 | 54.33 | 20.34 | 29.59 | 0.1285 |
| ALBERT | 83.31 | 29.53 | 44.16 | 85.14 | 34.26 | 48.85 | 0.0627 | 54.23 | 13.39 | 21.35 | 64.55 | 23.90 | 34.02 | 0.0610 |
| ERNIE | 84.16 | 29.42 | 45.56 | 86.63 | 36.06 | 50.93 | 0.0683 | 54.87 | 13.29 | 21.93 | 65.26 | 23.97 | 35.06 | 0.0857 |
| M3PT(text) | 86.34 | 32.57 | 47.11 | 88.38 | 38.63 | 53.72 | 0.0413 | 56.42 | 15.37 | 23.65 | 67.04 | 25.51 | 36.95 | 0.0512 |
| Improv.% | 2.59 | 10.29 | 3.40 | 2.02 | 7.13 | 5.48 | 34.13 | 2.82 | 14.79 | 7.84 | 2.73 | 6.42 | 5.39 | 16.07 |
| ResNet101 | 14.24 | 9.40 | 11.32 | 18.15 | 10.68 | 13.44 | 0.1141 | 10.21 | 7.87 | 8.81 | 13.60 | 9.48 | 11.17 | 0.1364 |
| ResNet101(ASL) | 14.37 | 9.36 | 11.36 | 18.97 | 10.07 | 13.12 | 0.1163 | 10.04 | 8.07 | 8.94 | 13.51 | 9.22 | 10.96 | 0.1328 |
| TResNet | 14.73 | 8.91 | 11.07 | 17.16 | 10.50 | 13.02 | 0.0915 | 10.80 | 8.19 | 9.31 | 13.60 | 10.13 | 11.61 | 0.1243 |
| ViT | 15.14 | 9.27 | 11.74 | 18.74 | 11.26 | 14.06 | 0.1149 | 10.14 | 8.27 | 9.11 | 13.06 | 9.61 | 11.07 | 0.1470 |
| ViT(Q2L) | 15.26 | 9.39 | 12.06 | 17.63 | 11.89 | 13.69 | 0.0952 | 11.28 | 8.14 | 9.45 | 14.40 | 10.63 | 12.23 | 0.1315 |
| M3PT(image) | 15.85 | 10.95 | 12.93 | 19.34 | 11.47 | 14.21 | 0.0924 | 12.32 | 7.94 | 9.63 | 15.22 | 10.42 | 12.37 | 0.1293 |
| Improv.% | 3.87 | 16.61 | 7.21 | 1.95 | -3.53 | 1.07 | -0.98 | 9.22 | -3.99 | 1.90 | 5.69 | -1.98 | 1.14 | -4.78 |
| M3TR | 86.49 | 31.64 | 46.52 | 88.42 | 39.03 | 54.15 | 0.0620 | 57.41 | 15.34 | 24.29 | 70.92 | 26.57 | 38.65 | 0.0784 |
| TAILOR | 87.72 | 32.16 | 46.83 | 87.34 | 37.80 | 52.76 | 0.0427 | 57.92 | 16.26 | 25.39 | 69.45 | 27.66 | 39.56 | 0.0512 |
| M3PT | 89.72 | 35.41 | 50.45 | 92.45 | 43.25 | 58.93 | 0.0242 | 59.51 | 17.56 | 27.11 | 72.15 | 28.50 | 40.85 | 0.0307 |
| Improv.% | 2.28 | 10.11 | 7.73 | 4.56 | 10.81 | 8.83 | 43.33 | 2.75 | 8.00 | 6.77 | 1.73 | 3.04 | 3.26 | 40.04 |
5.2. Experimental Setup
5.2.1. Baselines
We compared our M3PT with the following models in our experiments, which can be categorized into two groups of uni-modal models and one group of multi-modal models.
The baselines in the first group only leverage the textual features of POIs to achieve POI tagging. In these models, a given POI’s texts are fed into their encoders to generate the textual embedding of the POI, which is used as the POI’s content embedding. This group includes BERT (Devlin et al., 2018), ALBERT (Lan et al., 2019) and ERNIE (Zhang et al., 2019). The first two are both classic pre-trained language models. ERNIE incorporates knowledge maps into the pretraining task to improve its representation capability, which has been successfully employed in the previous multi-label classification task.
The baselines in the second group are also uni-modal models, which only leverage the POIs’ images to achieve POI tagging. Specifically, only the images of a given POI are input into the models to generate the visual feature embedding used as its content embedding. This group includes the ResNet-based models including ResNet-101 (He et al., 2016b), ResNet101(ASL) (Ben-Baruch et al., 2020) and TResNet (Ridnik et al., 2021). All of them have been widely used to encode images in the computer vision (CV) community. In addition, we also considered ViT (Dosovitskiy et al., 2021) and ViT-Q2L (Liu et al., 2021). Inspired by the success of Transformer (Vaswani et al., 2017) in natural language processing (NLP), these two models were built based on the architecture of self-attention and cross-attention, showing their advantages over the image encoders based on convolutional neural networks (CNNs).
As M3PT, the baselines in the third group are both multi-modal models, including M3TR (Zhao et al., 2021) and TAILOR (Zhang et al., 2022). M3TR employs the vision Transformer and builds a cross-modal attention module and a label-guided augmentation module to achieve multi-modal multi-label classification better. TAILOR first encodes the uni-modal features of texts and images and then fuses them into the cross-modal features as the encoder inputs to model the relationship between the modality and each label.
5.2.2. Evaluation Metrics
Our POI tagging task is just a multi-label classification if we regard the set of all tags as the label set of the POI classification. So we used the following metrics to evaluate all compared models’ performance in our experiments. We first considered the label-based classification metric M-P (Macro Precision), M-R (Macro Recall) and M-F1 (Macro F1) (Yang, 1999). When computing their scores, we first took a tag along with all POIs annotated by it as one sample, and reported the average score of all samples. Second, we also considered the object-based classification metrics, including P-e (Precision-exam), R-e (Recall-exam), and F1-e (F1-exam) (Godbole and Sarawagi, 2004). When computing three metrics’ scores, we took a POI along with all of its tags as one sample, and reported the average score of all samples. In addition, we also considered HLS (Hamming Loss) (Godbole and Sarawagi, 2004), which is used to measure the misclassification samples on a single label (tag). Thus, a more miniature HLS score indicates the model’s better performance.
5.2.3. Hyperparameter Settings
We adopted AdamW (Loshchilov and Hutter, 2019) as the optimizer Moreover, we set the initial learning rate to 1e-4 for pre-training. With steps increasing, we decreased the learning rate linearly to 1e-5. The settings of some crucial hyperparameters in our model are shown in Table 2, which were decided based on our parameter tuning studies. Specifically, we will display the results of tuning and afterward.
To reproduce our experiment results conveniently, we have published our model’s source code on https://github.com/DeqingYang/M3PT.
| MPTD2 | ||||||||||||||||
| PTC | TIF | Image | M-P | Drop% | M-R | Drop% | M-F1 | Drop% | P-e | Drop% | R-e | Drop% | F1-e | Drop% | HLS | Drop% |
| ✗ | ✗ | ✗ | 80.71 | 10.04 | 26.03 | 26.49 | 39.36 | 21.98 | 81.1 | 12.28 | 36.06 | 16.62 | 49.92 | 15.29 | 0.0641 | 164.88 |
| ✗ | ✗ | ✓ | 83.28 | 7.18 | 28.39 | 19.82 | 42.43 | 15.90 | 83.05 | 10.17 | 36.9 | 14.68 | 51.19 | 13.13 | 0.0630 | 160.33 |
| ✗ | ✓ | ✓ | 85.91 | 4.25 | 30.9 | 12.74 | 45.45 | 9.91 | 86.55 | 6.38 | 37.04 | 14.36 | 51.87 | 11.98 | 0.0547 | 126.03 |
| ✓ | ✓ | ✗ | 86.34 | 3.77 | 32.57 | 8.02 | 47.11 | 6.62 | 88.38 | 4.40 | 38.63 | 10.68 | 53.72 | 8.84 | 0.0413 | 70.66 |
| ✓ | ✗ | ✓ | 87.81 | 2.13 | 32.36 | 8.61 | 47.25 | 6.34 | 89.16 | 3.56 | 38.05 | 12.02 | 53.37 | 9.43 | 0.0432 | 78.51 |
| ✓ | ✓ | ✓ | 89.72 | - | 35.41 | - | 50.45 | - | 92.45 | - | 43.25 | - | 58.93 | - | 0.0242 | - |
| MPTD1 | ||||||||||||||||
| PTC | TIF | Image | M-P | Drop% | M-R | Drop% | M-F1 | Drop% | P-e | Drop% | R-e | Drop% | F1-e | Drop% | HLS | Drop% |
| ✗ | ✗ | ✗ | 49.67 | 16.54 | 13.81 | 21.36 | 21.61 | 20.29 | 56.13 | 22.20 | 20.7 | 27.37 | 30.07 | 26.39 | 0.0809 | 163.52 |
| ✗ | ✗ | ✓ | 52.42 | 11.91 | 13.37 | 23.86 | 21.93 | 19.11 | 62.15 | 13.86 | 22.91 | 19.61 | 32.2 | 21.18 | 0.0753 | 145.28 |
| ✗ | ✓ | ✓ | 54.62 | 8.22 | 14.41 | 17.94 | 22.8 | 15.90 | 65.26 | 9.55 | 24.05 | 15.61 | 35.67 | 12.68 | 0.0773 | 151.79 |
| ✓ | ✓ | ✗ | 56.42 | 5.19 | 15.37 | 12.47 | 23.65 | 12.76 | 67.04 | 7.08 | 25.51 | 10.49 | 36.95 | 9.55 | 0.0542 | 76.55 |
| ✓ | ✗ | ✓ | 57.79 | 2.89 | 16.34 | 6.95 | 25.58 | 5.64 | 69.55 | 3.60 | 25.9 | 9.12 | 37.02 | 9.38 | 0.0504 | 64.17 |
| ✓ | ✓ | ✓ | 59.51 | - | 17.56 | - | 27.11 | - | 72.15 | - | 28.5 | - | 40.85 | - | 0.0307 | - |
5.3. Main Results
The following performance scores of all compared models are reported as the average results of three runnings to alleviate the bias of single running. Table 3 lists the overall tagging performance of all models on MPTD1 and MPTD2 datasets, where the best and second-best scores in each group are in bold and underlined, respectively. In particular, to verify our M3PT’s capability of leveraging uni-modal features, we further proposed two ablated variants of M3PT. Wherein M3PT(text) only leverages the textual features, i.e., it only inputs the text embeddings into the cluster layer of TIF and directly uses the single textual representation as the POI’s content embedding . Similarly, M3PT(image) only inputs image embeddings into TIF to generate the content embedding. M3PT’s performance improvement ratio relative to the best baseline (underlined) is also listed in each group. The results demonstrate that M3PT performs the best on most metrics. Moreover, we also have the following observations and analyses.
1. Compared with the first group of textual modality and the third group of multi-modality, M3PT is not the best on some metrics. Through the investigation of the two datasets, we found that the images of a POI are semantically related to only about one-fifth of the POI’s tags on average. It implies that M3PT can not exert its advantage sufficiently when only leveraging these images to discover the correct tags.
2. Compared with MPTD1, M3PT’s performance improvement over the baselines on MPTD2 is more apparent. It is because the POIs’ texts and images in MPTD2 are more related to the tags, helping M3PT discover the matching across different modalities. Consequently, our model can achieve more precise POI tagging on MPTD2. It implies that our model is better at exploiting the high-quality dataset.
5.4. Detailed Analysis
5.4.1. Ablation Studies
We have conducted some ablation studies to justify the effects of the essential modules and strategy we designed in M3PT, including incorporating POI images, TIF, and the contrastive learning of POI-tag (PTC). Table 4 lists the results of different ablated variants of M3PT on MPTD2 and MPTD1, respectively, where the variant without image is just M3PT(text) in Table 3. In addition, in the variant without TIF, the single textual representation is just the sum of text embeddings. Similarly, the single visual representation is just the sum of image embeddings. Then, these two representations are concatenated and reshaped into ’s content embedding .
Besides the metric scores, the performance drop ratios of all variants relative to M3PT are also listed in Table 4. The results show that incorporating either one component of PTC, TIF, and image is helpful to M3PT’s performance improvement. Compared with TIF and image, PTC is more helpful for M3PT to achieve precise POI tagging since the performance drop of the variant without PTC is the most obvious.
| Image | MPTD2 | MPTD1 | ||||
| encoder | mAP | M-F1 | F1-e | mAP | M-F1 | F1-e |
| ViT | 81.60 | 47.16 | 56.93 | 66.20 | 26.07 | 35.62 |
| CLIP | 81.36 | 46.93 | 55.40 | 66.94 | 25.70 | 36.15 |
| BLIP | 82.41 | 47.31 | 55.03 | 67.78 | 25.62 | 37.49 |
| DIE | 84.32 | 50.45 | 58.93 | 69.14 | 27.11 | 40.85 |
5.4.2. Impact of Domain-adaptive Image Encoder
As mentioned before, the DIE specially designed in M3PT is an image encoder more adaptive to the requirements of the real-world scenario of Fliggy, resulting in M3PT’s enhanced performance. To verify it, we further propose some variants of M3PT by replacing the DIE with some previous image encoders, including ViT (Dosovitskiy et al., 2021), CLIP (Radford et al., 2021) and BLIP (Li et al., 2022).
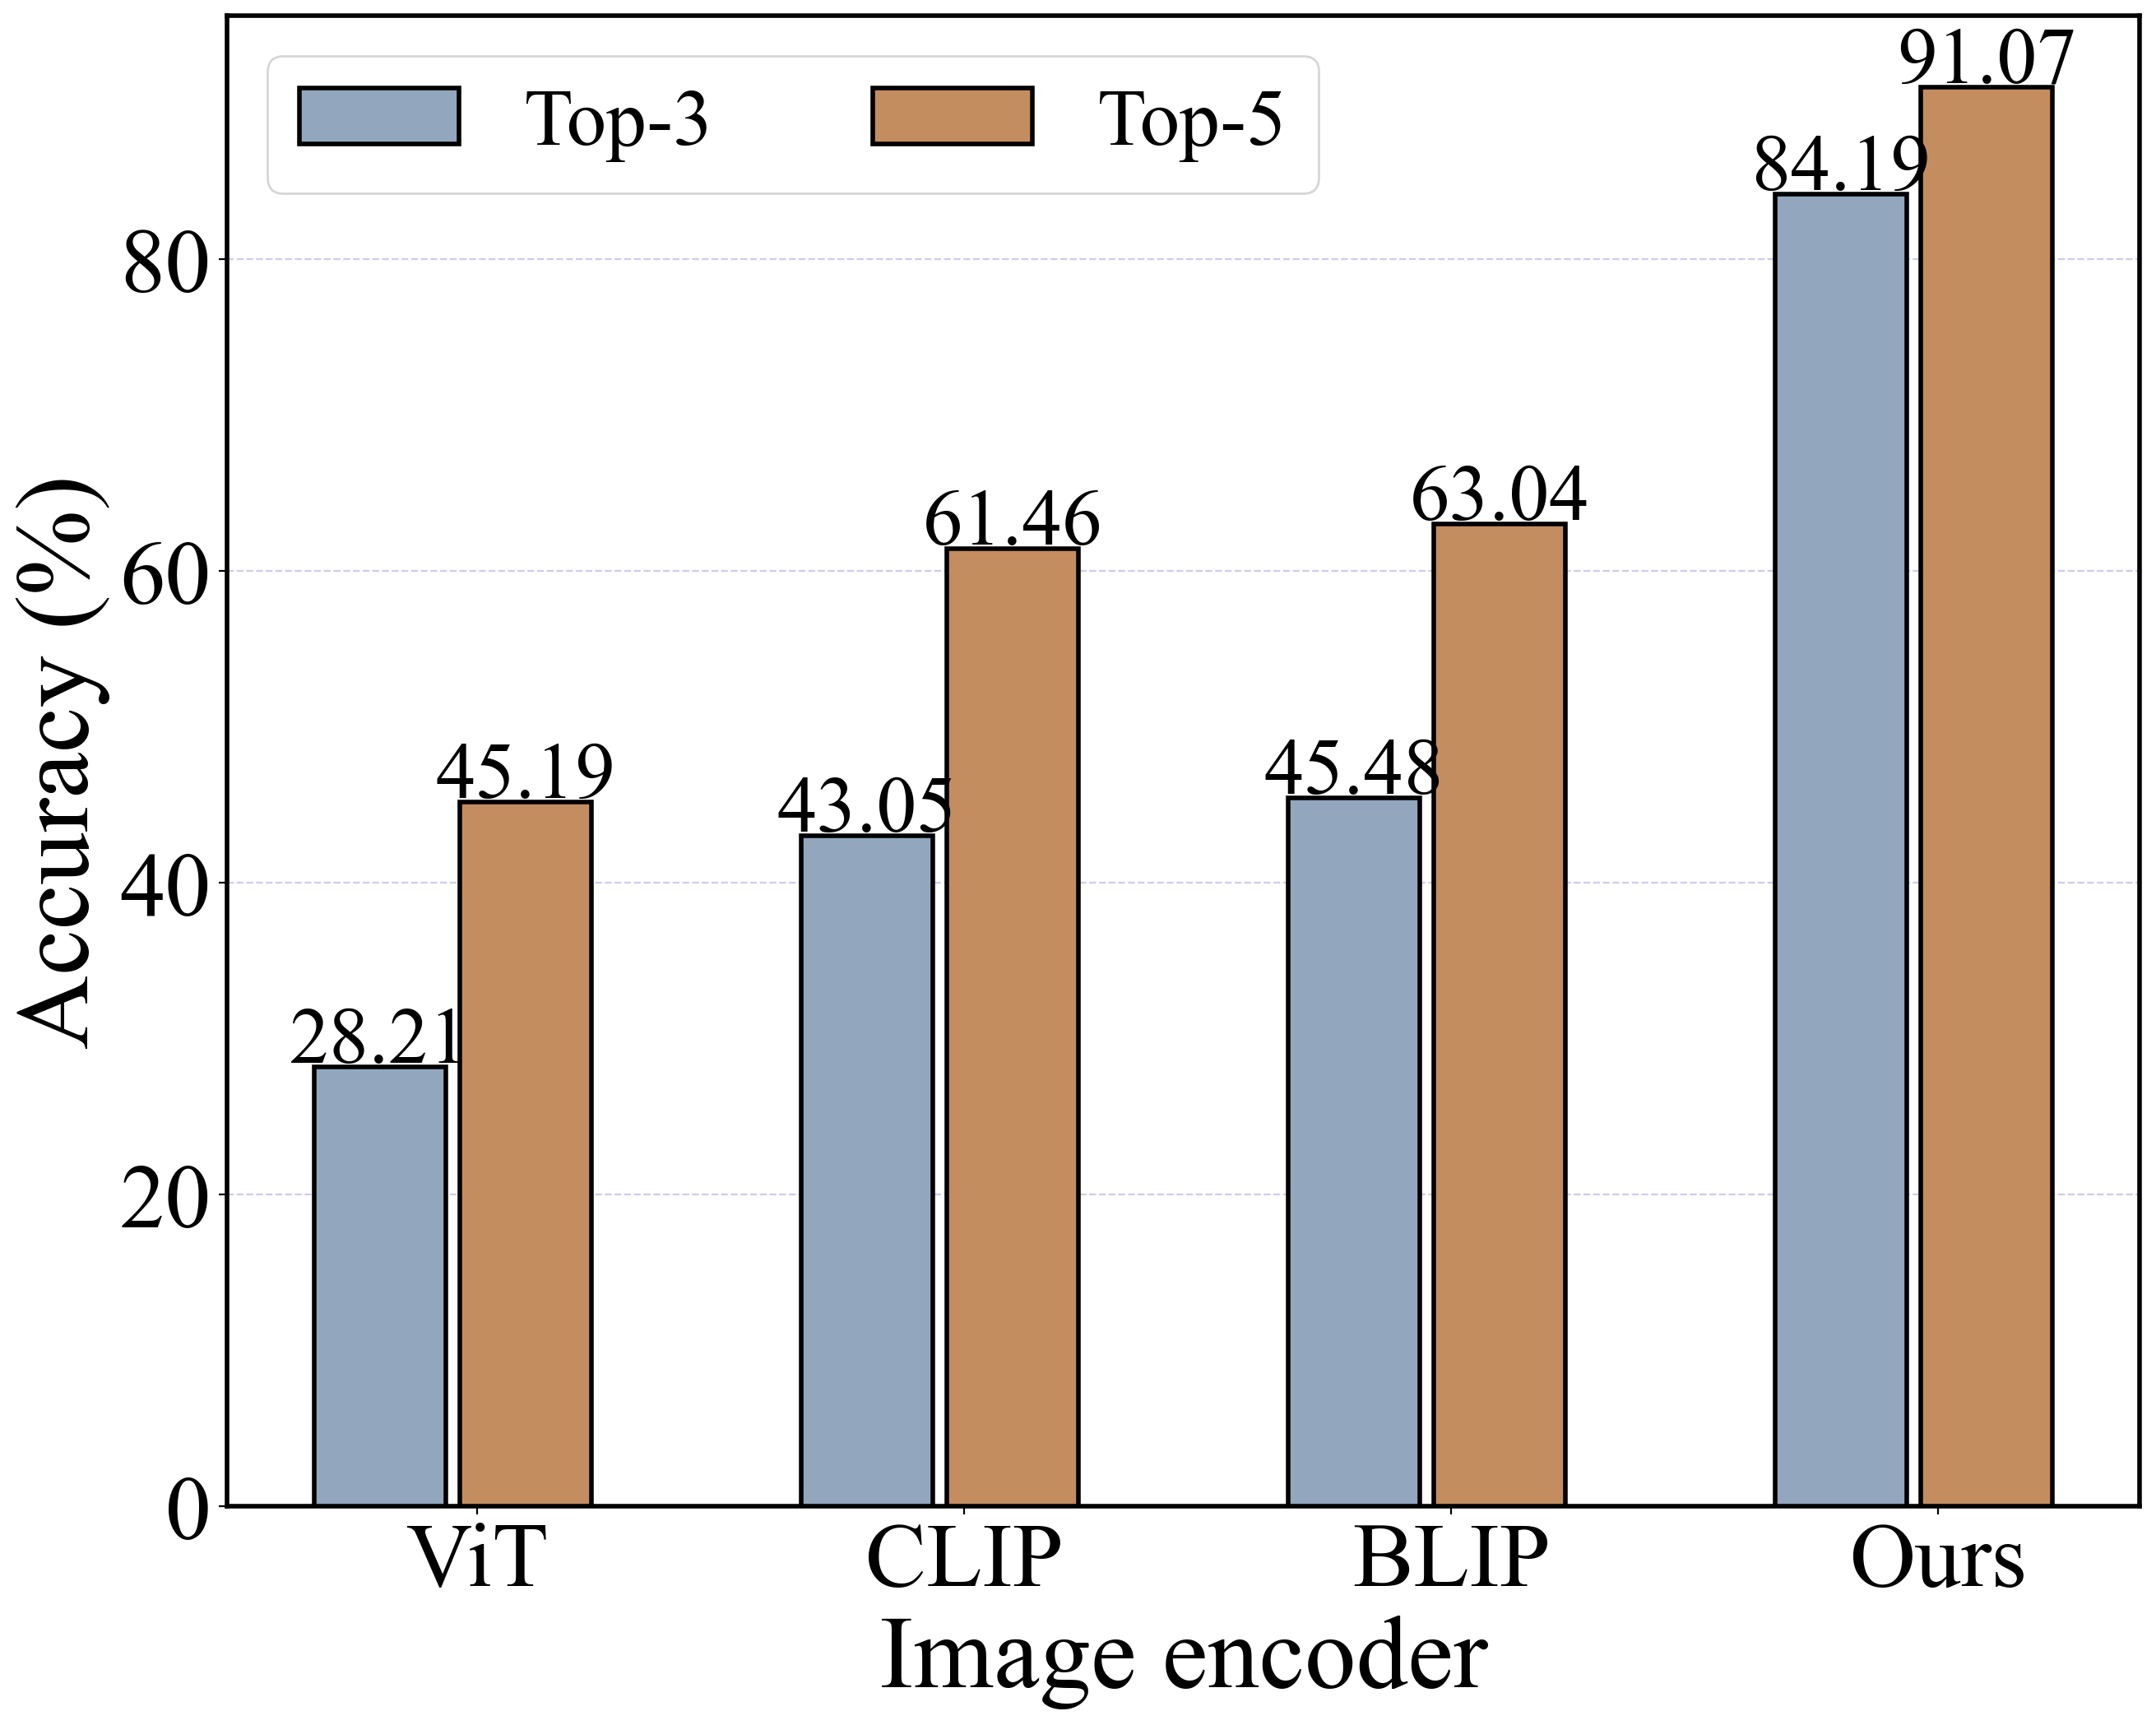
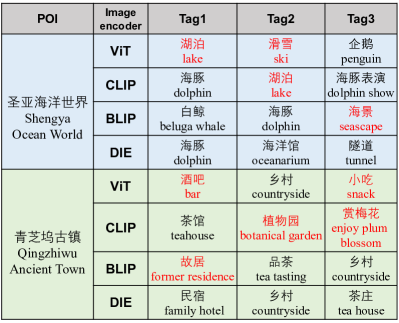
Due to space limitation, we only report the compared models’ scores of mAP, M-F1, and F1-e in Table 5 since they are the most representative metric of the ranking metrics, label-based classification metrics, and object-based classification metrics. The results show that, with DIE, our M3PT performs better on both classification and ranking the correct tags. In addition, to concretely exhibit DIE’s advantage in ranking the gold (correct) tags, in Fig. 3, we display the precision of top-3/5 tags predicted for the POIs on MPTD2. Obviously, all models’ precision of top-5 is higher than that of top-3. Nevertheless, DIE’s precision gap between top-3 and top-5 is much narrower than the other image encoders. Furthermore, in the table of Fig. 4, we list the top-3 tags predicted by the models for two POIs from MPTD2, where the incorrect tags are marked red. It also justifies that the M3PT with DIE can predict a bigger probability for the correct tags than the baselines.
5.4.3. Performance on Ranking Correct Tags
We also evaluated M3PT’s performance on the three ranking metrics. However, due to space limitation, we only compared it with the baseline performing the best in each group according to Table 3. The comparison results are listed in Table 6, showing that our model still has an advantage in ranking the correct tags on higher positions.
| Model | MPTD2 | MPTD1 | ||||
| mAP | 1-Error | RL | mAP | 1-Error | RL | |
| ERNIE | 60.05 | 0.3315 | 0.1620 | 78.21 | 0.2403 | 0.1461 |
| M3PT(text) | 64.15 | 0.2251 | 0.1390 | 80.41 | 0.1528 | 0.1230 |
| ViT(Q2L) | 13.90 | 0.6701 | 0.3902 | 18.90 | 0.2271 | 0.3610 |
| M3PT(image) | 16.73 | 0.6278 | 0.3894 | 20.05 | 0.2315 | 0.3521 |
| TAILOR | 63.28 | 0.3025 | 0.1242 | 81.50 | 0.2362 | 0.0936 |
| M3PT | 69.14 | 0.2143 | 0.0827 | 84.32 | 0.1264 | 0.0541 |
5.4.4. Hyperparameter Tuning
For the important hyperparameters in M3PT, we have studied their impacts on the performance of POI tagging. Due to space limitation, we only display the results of and .
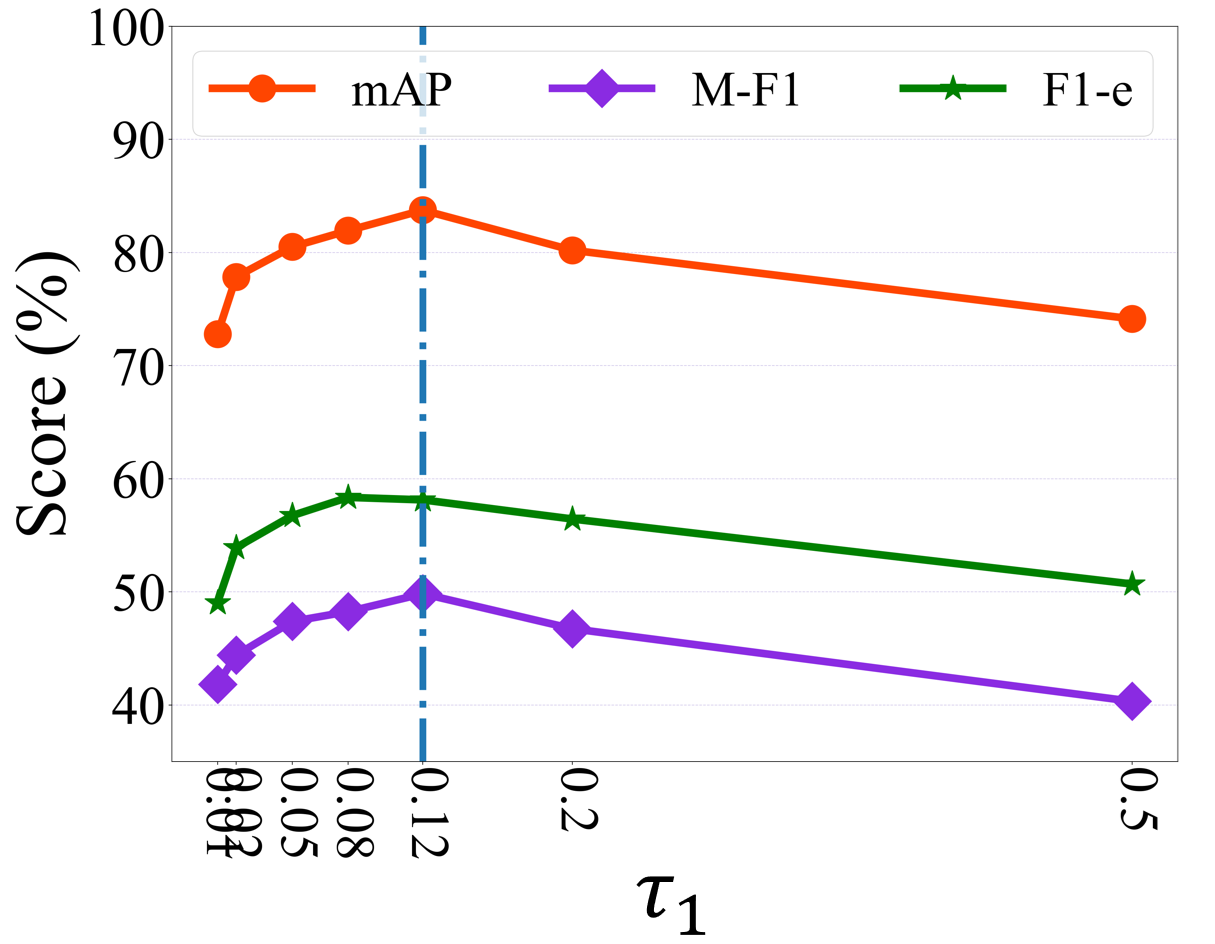
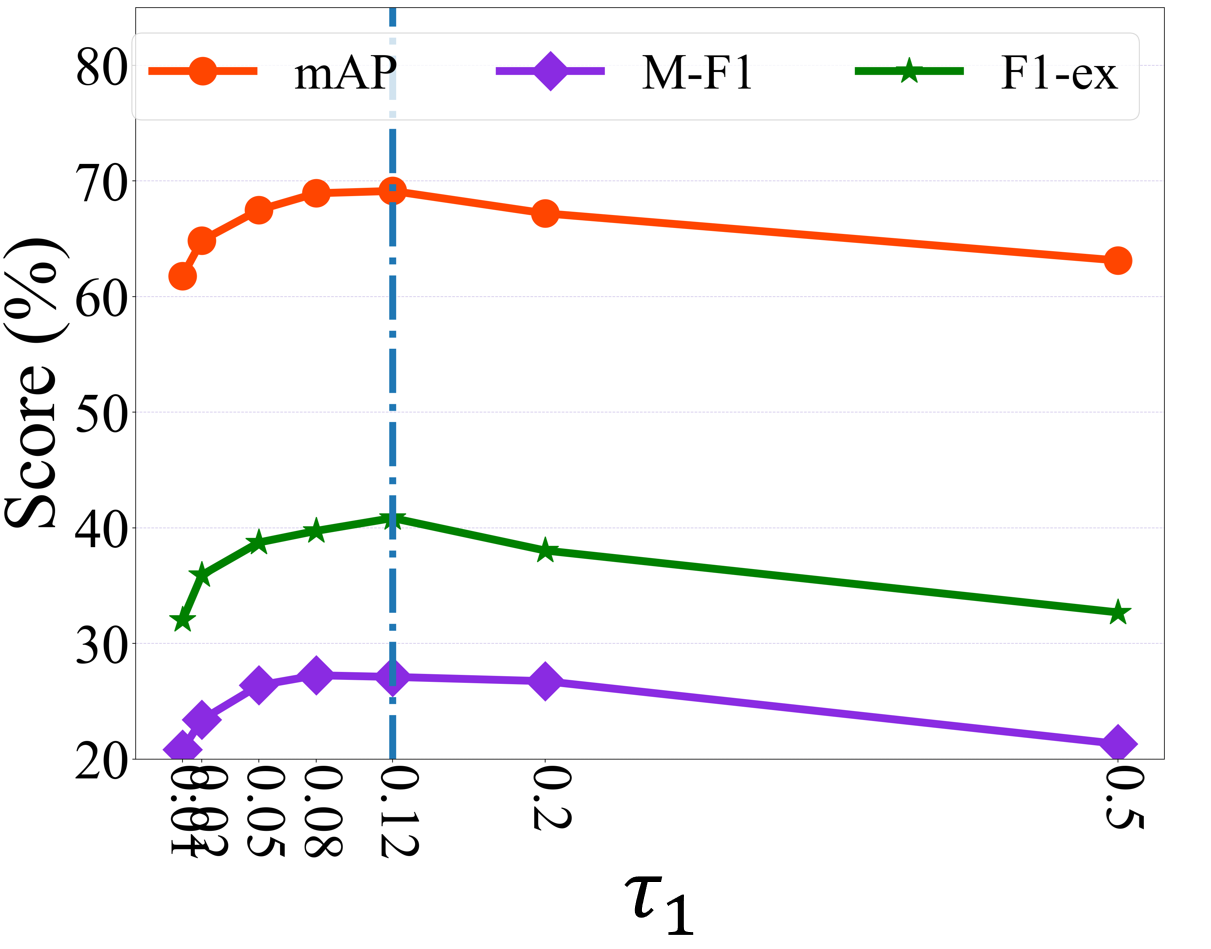
We first focus on the impact of the temperature in in Equation 15, i.e., . As we mentioned before, the temperature in the scoring function of contrastive learning is used to maintain the balance between the alignment and consistency of contrasted samples. The results depicted in Fig. 5 show that M3PT performs better when . It indicates that a suitable temperature should not be too big. Otherwise, it would make the model less focused on discriminating the hard negative samples and thus fail to obtain satisfactory performance.
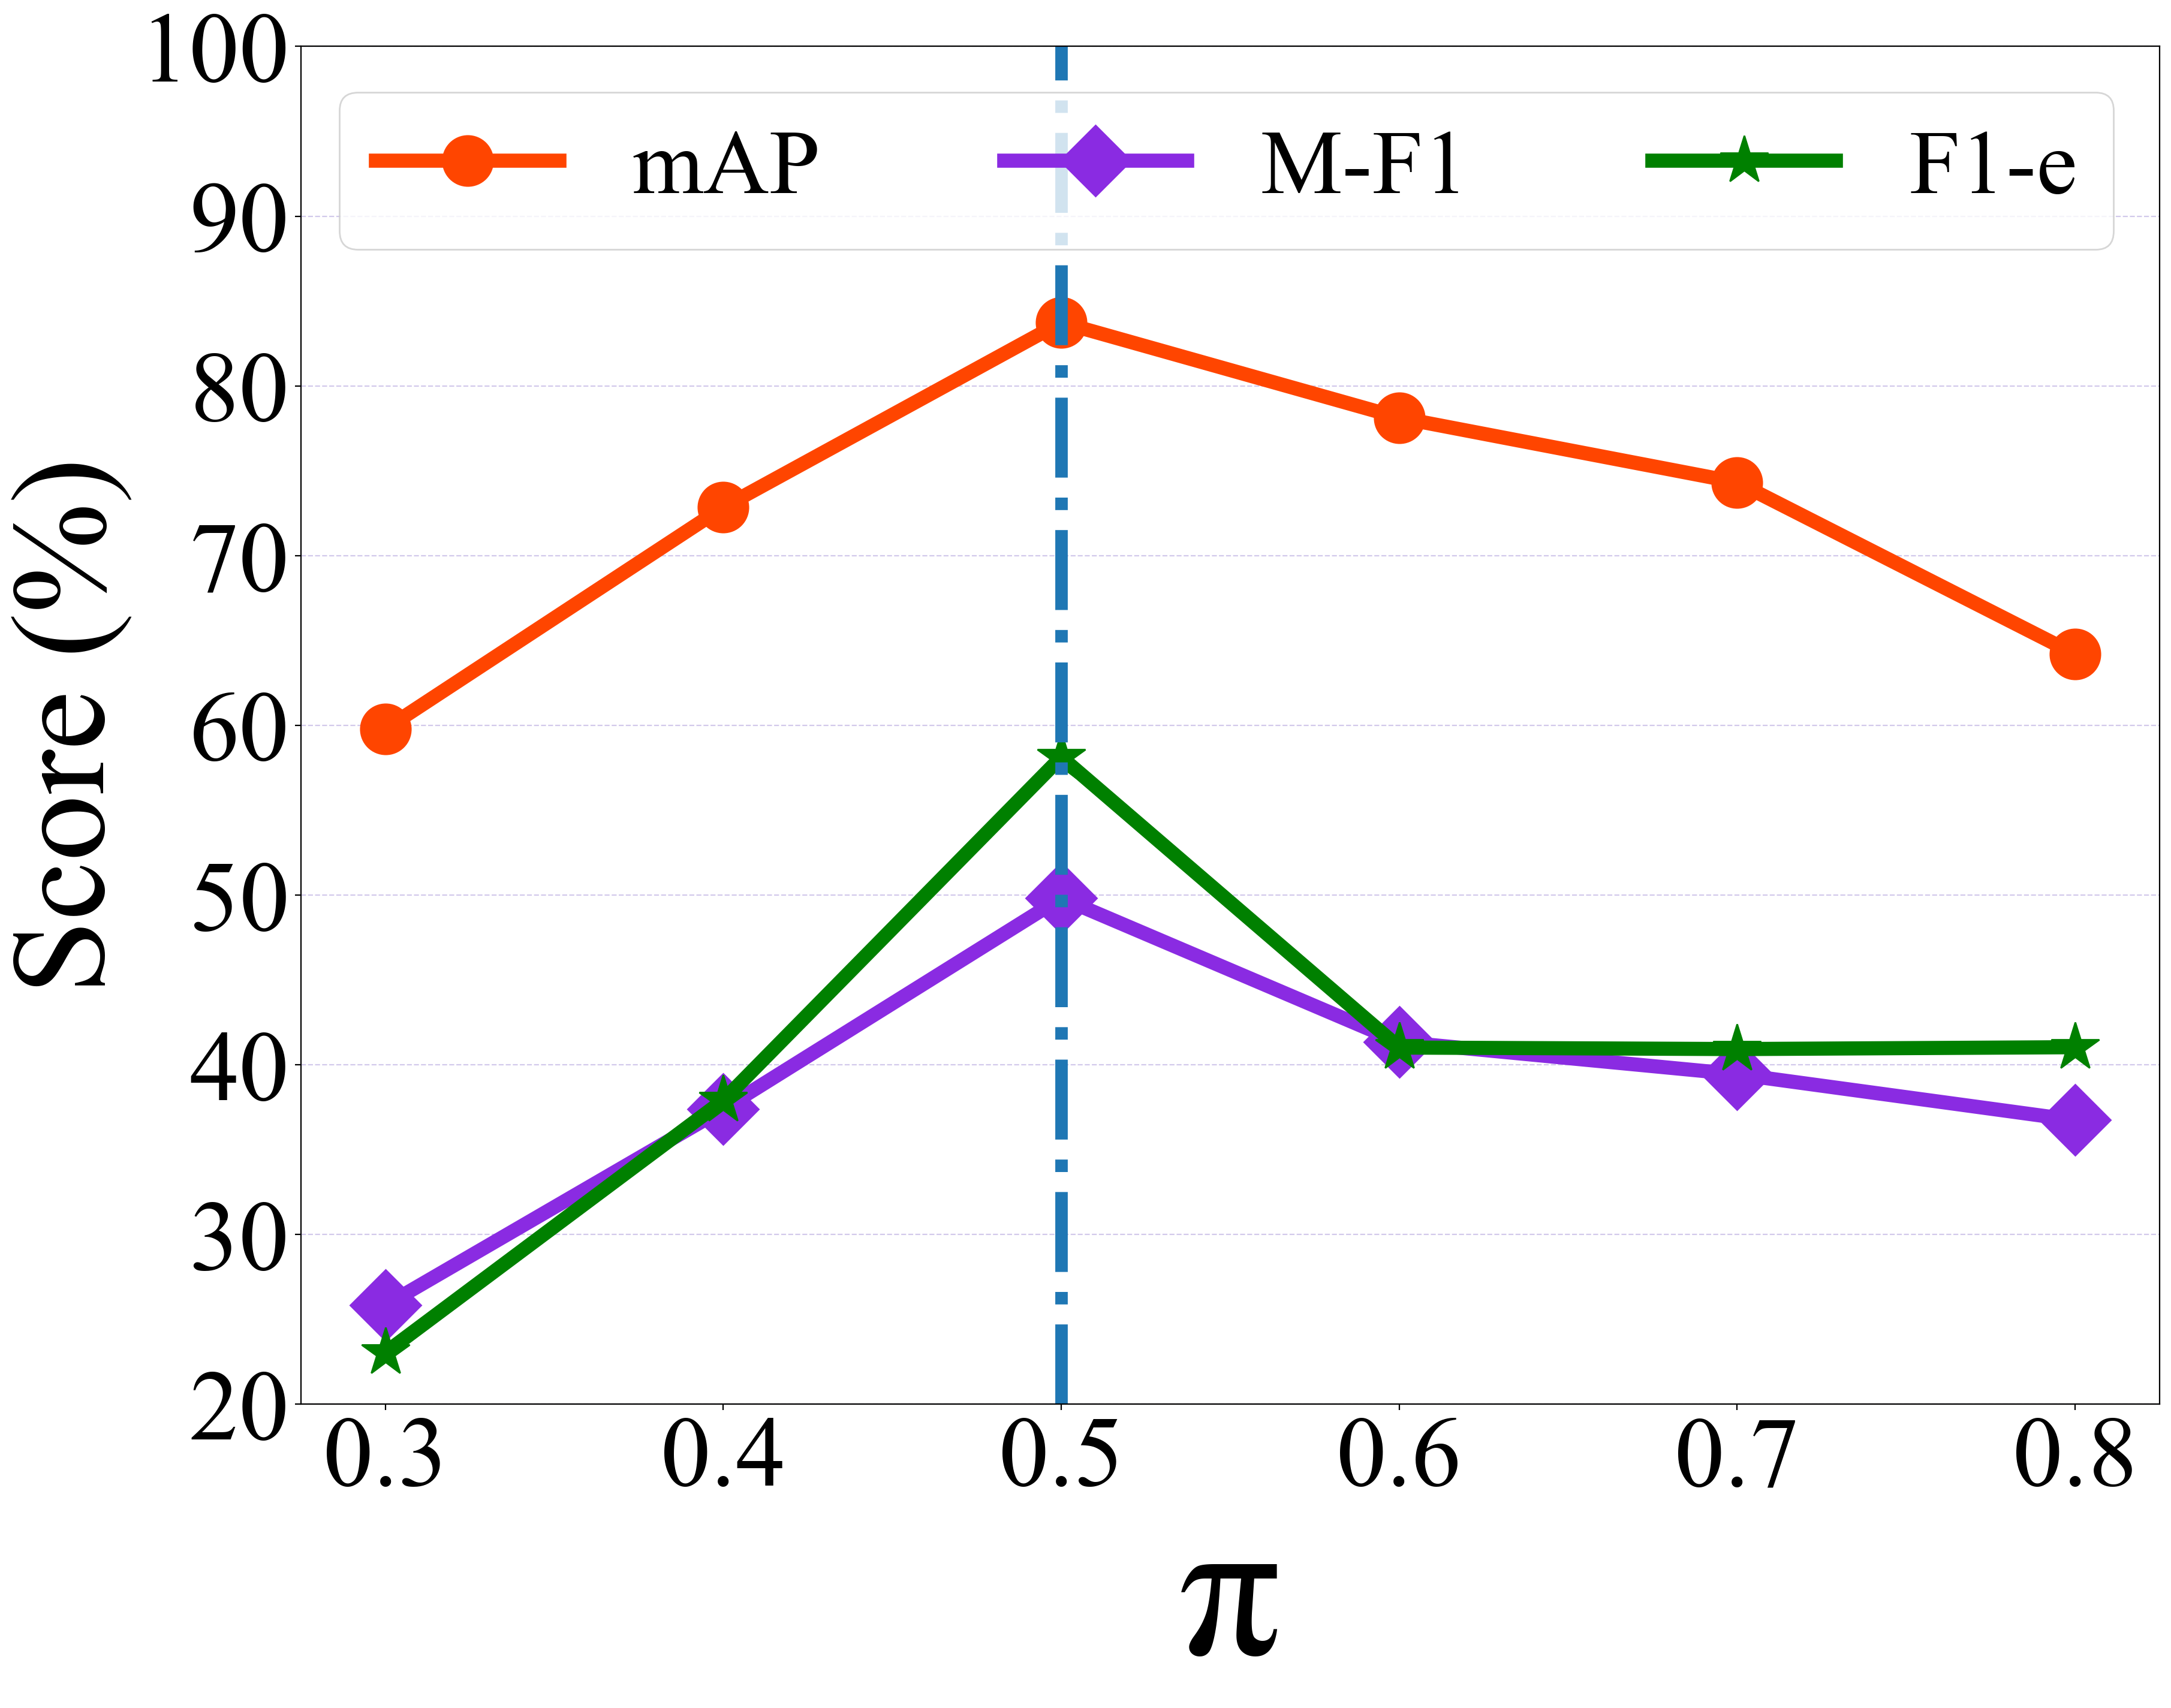
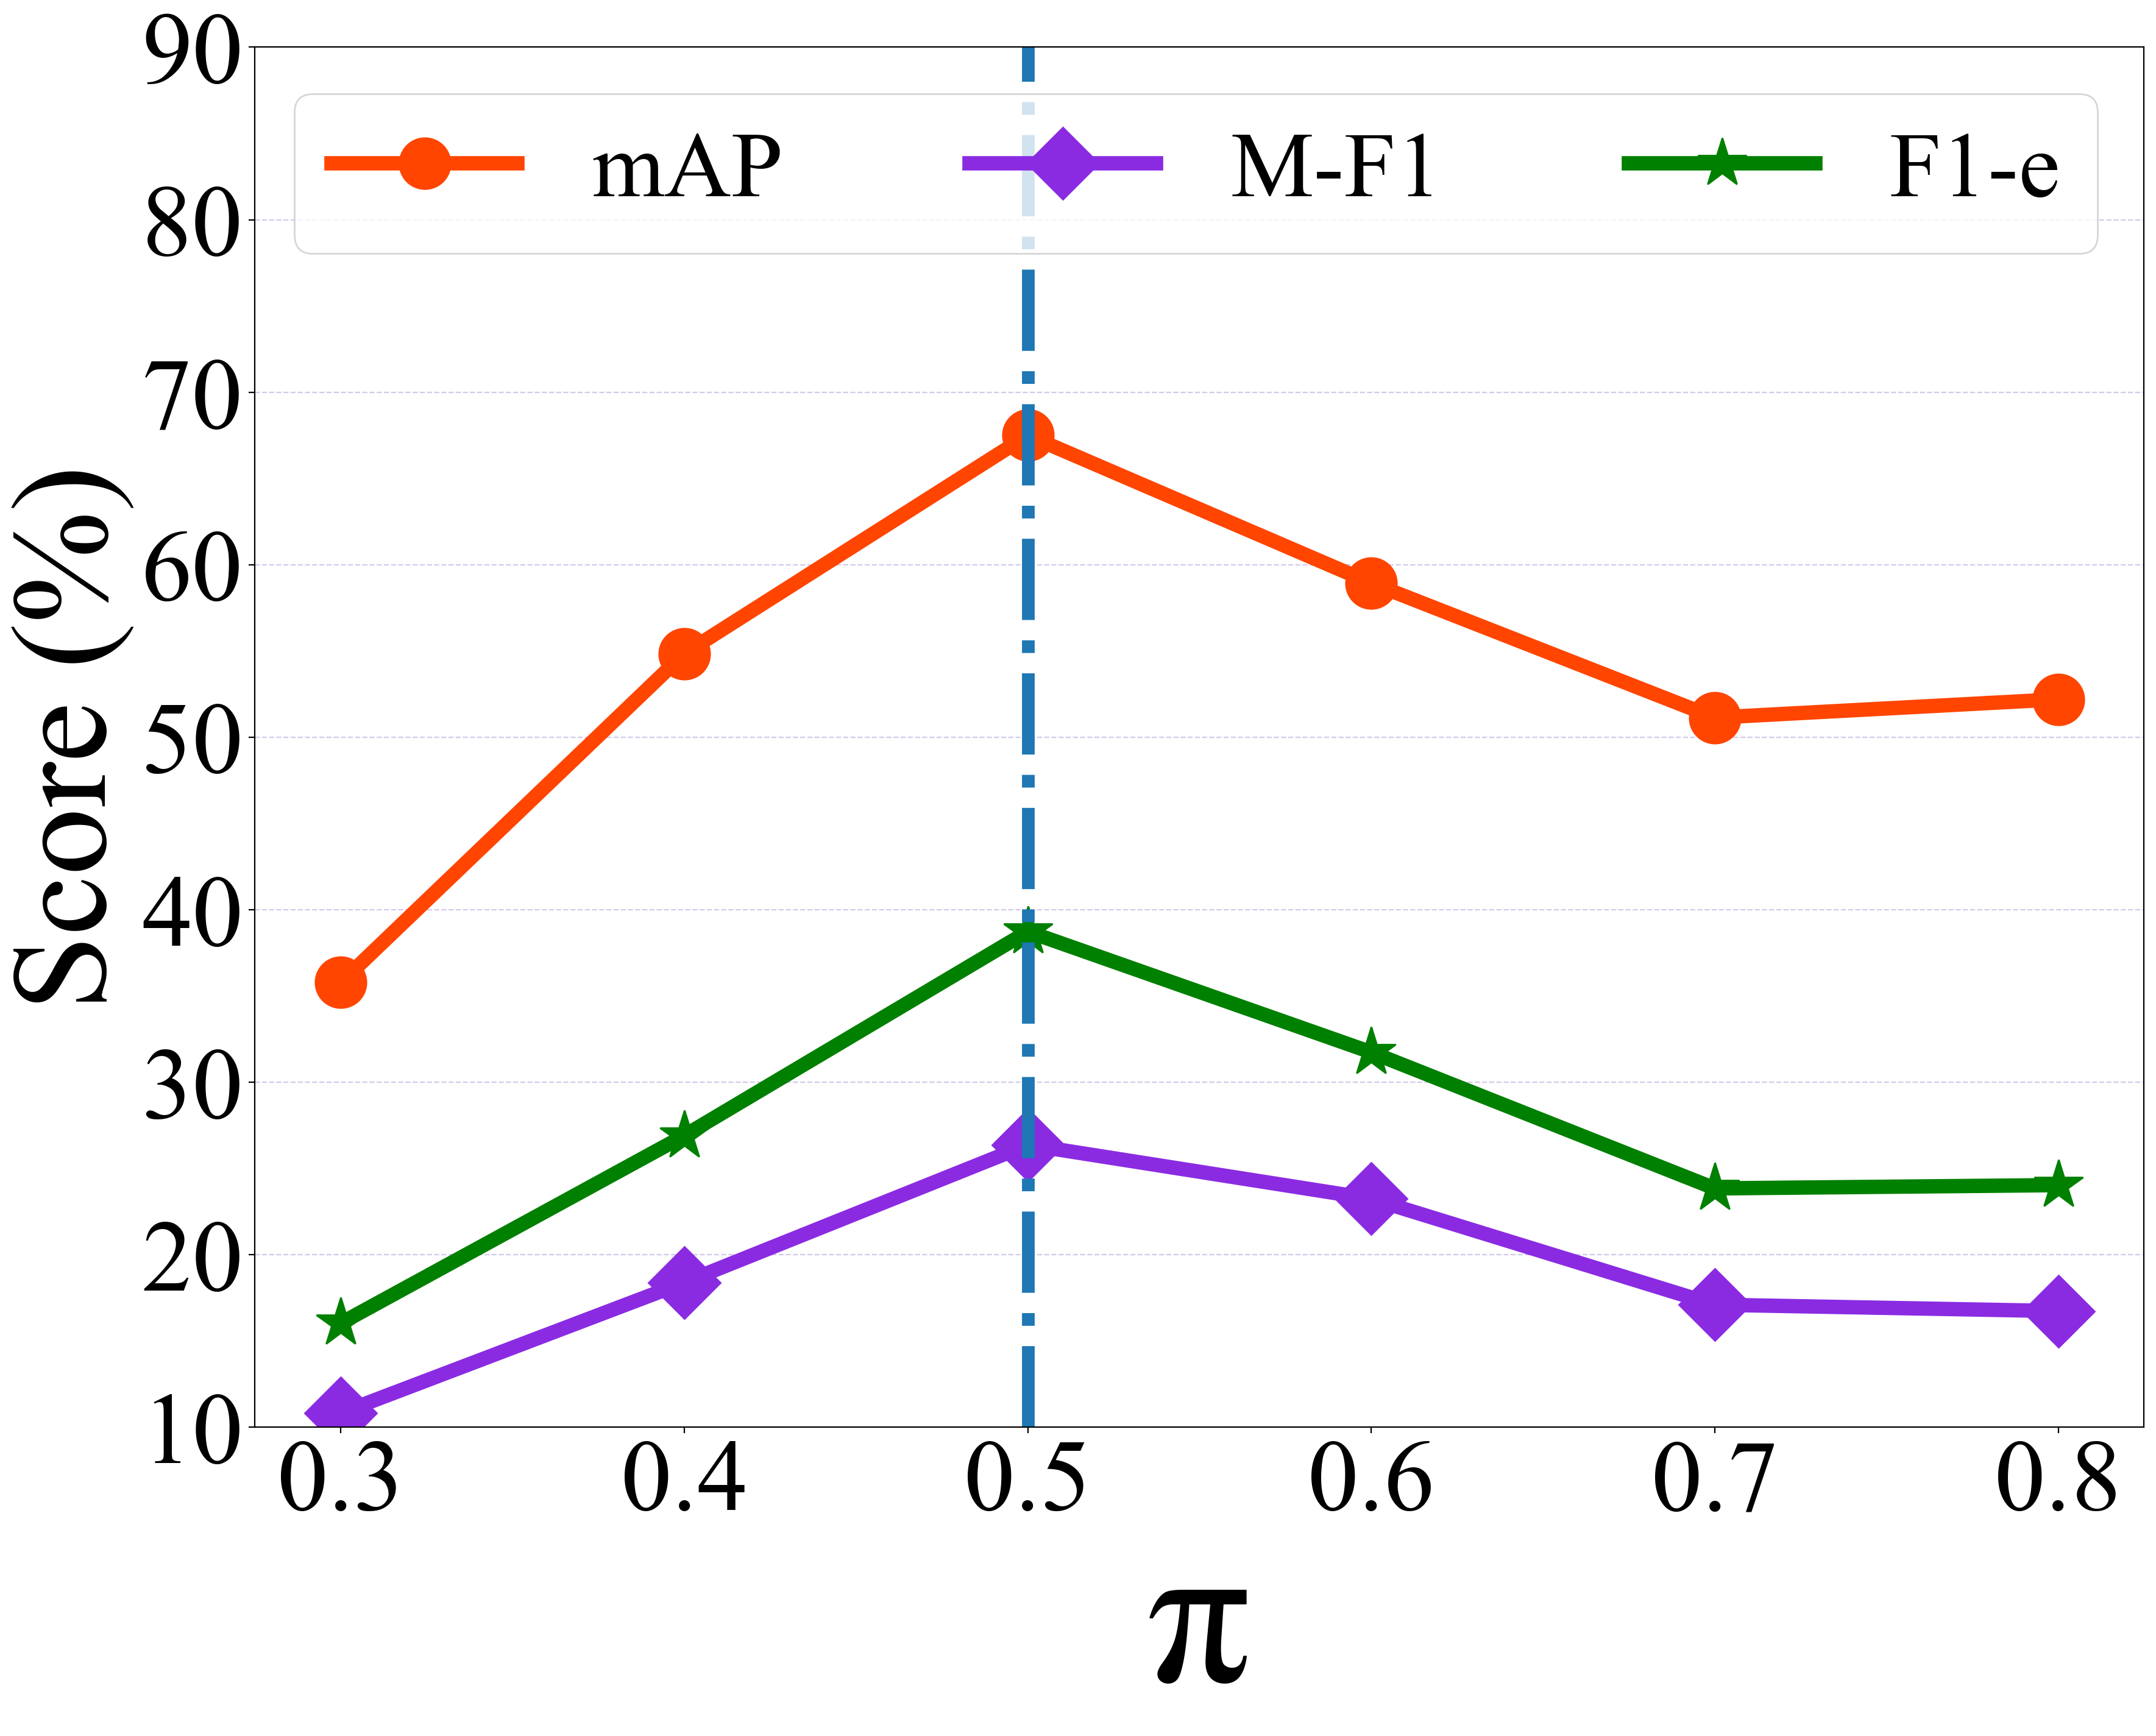
We also display the tuning results of the prediction threshold () in Fig. 6. It shows that is the best setting, which just equals the default threshold in generic binary classifications.
5.5. Case Study
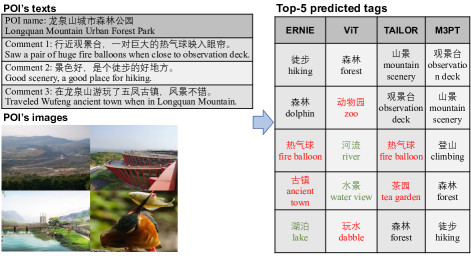
We further display the tagging results of M3PT and the best baseline in each group for a specific POI ‘龙泉山城市森林公园/Longquan Mountain Urban Forest Park’ from MPTD2. The top-5 tags predicted by the compared models are listed in Fig. 7, where the incorrect tags are marked red, and the green tags were assessed as correct but not in this POI’s gold tag set. Moreover, the rest black tags are gold tags. At the same time, we display some texts and images of this POI on the left, which were fed into the models for tag prediction. Obviously, the incorrect tag ‘热气球/fire balloon’ and ‘古镇/ancient town’ were predicted by ERNIR and TAILOR, due to the misleading of Comments 1 and 3. While the incorrect tag ‘玩水/dabble’ and ‘茶园/tea garden’ were predicted by ViT and TAILOR, due to the misleading of some images. In fact, these incorrect tags only have the similar semantics to uni-modal (either textual or visual) data. They can be filtered out through the alignment (matching) of cross-modality. Compared with the baselines, our M3PT achieves the full fusion and precise matching between the textual and visual features, and are less disturbed by the noise of each modal data. Consequently, all of the 5 tags predicted by M3PT are correct.
6. Conclusion
Towards the POI tagging in the real-world tour scenario of Ali Fliggy, in this paper, we propose a novel multi-modal model, namely M3PT, which incorporates the textual and visual features of POIs simultaneously to achieve the tagging task. In M3PT, we specially devise a domain-adaptive image encoder (DIE) to generate the image embeddings to better adapt to the requirements of the real-world scenario. In addition, we build the text-image fusion module (TIF) in our model, to achieve the full fusion and precise matching between textual and visual features. We further adopt a contrastive learning strategy to bridge the gap among the corss-modal representations in the model. Our extensive experiments with two datasets that were constructed from the Fliggy platform, not only demonstrate M3PT’s advantage, but also justify the rationalities and effectiveness of its important components.
Acknowledgements.
This work was supported by Alibaba Group through Alibaba Innovative Research Program, Chinese NSF Major Research Plan (No.92270121), Shanghai Science and Technology Innovation Action Plan (No.21511100401), and Shanghai Sailing Program (No. 23YF1409400).References
- (1)
- Barnard et al. (2003) Kobus Barnard, Pinar Duygulu, David A. Forsyth, Nando de Freitas, David M. Blei, and Michael I. Jordan. 2003. Matching Words and Pictures. J. Mach. Learn. Res. 3 (2003), 1107–1135. http://jmlr.org/papers/v3/barnard03a.html
- Ben-Baruch et al. (2020) Emanuel Ben-Baruch, Tal Ridnik, Nadav Zamir, Asaf Noy, Itamar Friedman, Matan Protter, and Lihi Zelnik-Manor. 2020. Asymmetric loss for multi-label classification. arXiv preprint arXiv:2009.14119 (2020).
- Chen et al. (2020) Yen-Chun Chen, Linjie Li, Licheng Yu, Ahmed El Kholy, Faisal Ahmed, Zhe Gan, Yu Cheng, and Jingjing Liu. 2020. UNITER: UNiversal Image-TExt Representation Learning. In Computer Vision - ECCV 2020 - 16th European Conference, Glasgow, UK, August 23-28, 2020, Proceedings, Part XXX (Lecture Notes in Computer Science, Vol. 12375), Andrea Vedaldi, Horst Bischof, Thomas Brox, and Jan-Michael Frahm (Eds.). Springer, 104–120. https://doi.org/10.1007/978-3-030-58577-8_7
- Cheng et al. (2018) Qimin Cheng, Qian Zhang, Peng Fu, Conghuan Tu, and Sen Li. 2018. A survey and analysis on automatic image annotation. Pattern Recognit. 79 (2018), 242–259. https://doi.org/10.1016/j.patcog.2018.02.017
- Desai and Johnson (2020) Karan Desai and Justin Johnson. 2020. VirTex: Learning Visual Representations from Textual Annotations. CoRR abs/2006.06666 (2020). arXiv:2006.06666 https://arxiv.org/abs/2006.06666
- Devlin et al. (2018) Jacob Devlin, Ming-Wei Chang, Kenton Lee, and Kristina Toutanova. 2018. Bert: Pre-training of deep bidirectional transformers for language understanding. arXiv preprint arXiv:1810.04805 (2018).
- Dosovitskiy et al. (2021) Alexey Dosovitskiy, Lucas Beyer, Alexander Kolesnikov, Dirk Weissenborn, Xiaohua Zhai, Thomas Unterthiner, Mostafa Dehghani, Matthias Minderer, Georg Heigold, Sylvain Gelly, Jakob Uszkoreit, and Neil Houlsby. 2021. An Image is Worth 16x16 Words: Transformers for Image Recognition at Scale. In 9th International Conference on Learning Representations, ICLR 2021, Virtual Event, Austria, May 3-7, 2021. OpenReview.net. https://openreview.net/forum?id=YicbFdNTTy
- Feng et al. (2014) Zheyun Feng, Songhe Feng, Rong Jin, and Anil K. Jain. 2014. Image Tag Completion by Noisy Matrix Recovery. In Computer Vision - ECCV 2014 - 13th European Conference, Zurich, Switzerland, September 6-12, 2014, Proceedings, Part VII (Lecture Notes in Computer Science, Vol. 8695), David J. Fleet, Tomás Pajdla, Bernt Schiele, and Tinne Tuytelaars (Eds.). Springer, 424–438. https://doi.org/10.1007/978-3-319-10584-0_28
- Gao et al. (2022) Liming Gao, Dongliang Liao, Gongfu Li, Jin Xu, and Hankz Hankui Zhuo. 2022. Semantic IR fused Heterogeneous Graph Model in Tag-based Video Search. In Companion of The Web Conference 2022, Virtual Event / Lyon, France, April 25 - 29, 2022, Frédérique Laforest, Raphaël Troncy, Elena Simperl, Deepak Agarwal, Aristides Gionis, Ivan Herman, and Lionel Médini (Eds.). ACM, 94–98. https://doi.org/10.1145/3487553.3524214
- Godbole and Sarawagi (2004) Shantanu Godbole and Sunita Sarawagi. 2004. Discriminative Methods for Multi-labeled Classification. In Advances in Knowledge Discovery and Data Mining, 8th Pacific-Asia Conference, PAKDD 2004, Sydney, Australia, May 26-28, 2004, Proceedings (Lecture Notes in Computer Science, Vol. 3056), Honghua Dai, Ramakrishnan Srikant, and Chengqi Zhang (Eds.). Springer, 22–30. https://doi.org/10.1007/978-3-540-24775-3_5
- Goh et al. (2005) Kingshy Goh, Edward Y. Chang, and Beitao Li. 2005. Using One-Class and Two-Class SVMs for Multiclass Image Annotation. IEEE Trans. Knowl. Data Eng. 17, 10 (2005), 1333–1346. https://doi.org/10.1109/TKDE.2005.170
- He et al. (2016b) Kaiming He, Xiangyu Zhang, Shaoqing Ren, and Jian Sun. 2016b. Deep Residual Learning for Image Recognition. In 2016 IEEE Conference on Computer Vision and Pattern Recognition, CVPR 2016, Las Vegas, NV, USA, June 27-30, 2016. IEEE Computer Society, 770–778. https://doi.org/10.1109/CVPR.2016.90
- He et al. (2016a) Tieke He, Hongzhi Yin, Zhenyu Chen, Xiaofang Zhou, Shazia W. Sadiq, and Bin Luo. 2016a. A Spatial-Temporal Topic Model for the Semantic Annotation of POIs in LBSNs. ACM Trans. Intell. Syst. Technol. 8, 1 (2016), 12:1–12:24. https://doi.org/10.1145/2905373
- Hegde et al. (2013) Vinod Hegde, Josiane Xavier Parreira, and Manfred Hauswirth. 2013. Semantic Tagging of Places Based on User Interest Profiles from Online Social Networks. In Advances in Information Retrieval - 35th European Conference on IR Research, ECIR 2013, Moscow, Russia, March 24-27, 2013. Proceedings (Lecture Notes in Computer Science, Vol. 7814), Pavel Serdyukov, Pavel Braslavski, Sergei O. Kuznetsov, Jaap Kamps, Stefan M. Rüger, Eugene Agichtein, Ilya Segalovich, and Emine Yilmaz (Eds.). Springer, 218–229. https://doi.org/10.1007/978-3-642-36973-5_19
- Huang et al. (2021) Zhicheng Huang, Zhaoyang Zeng, Yupan Huang, Bei Liu, Dongmei Fu, and Jianlong Fu. 2021. Seeing Out of the Box: End-to-End Pre-Training for Vision-Language Representation Learning. In IEEE Conference on Computer Vision and Pattern Recognition, CVPR 2021, virtual, June 19-25, 2021. Computer Vision Foundation / IEEE, 12976–12985. https://doi.org/10.1109/CVPR46437.2021.01278
- Huo et al. (2021) Yuqi Huo, Manli Zhang, Guangzhen Liu, Haoyu Lu, Yizhao Gao, Guoxing Yang, Jingyuan Wen, Heng Zhang, Baogui Xu, Weihao Zheng, Zongzheng Xi, Yueqian Yang, Anwen Hu, Jinming Zhao, Ruichen Li, Yida Zhao, Liang Zhang, Yuqing Song, Xin Hong, Wanqing Cui, Dan Yang Hou, Yingyan Li, Junyi Li, Peiyu Liu, Zheng Gong, Chuhao Jin, Yuchong Sun, Shizhe Chen, Zhiwu Lu, Zhicheng Dou, Qin Jin, Yanyan Lan, Wayne Xin Zhao, Ruihua Song, and Ji-Rong Wen. 2021. WenLan: Bridging Vision and Language by Large-Scale Multi-Modal Pre-Training. CoRR abs/2103.06561 (2021). arXiv:2103.06561 https://arxiv.org/abs/2103.06561
- Jia et al. (2021) Chao Jia, Yinfei Yang, Ye Xia, Yi-Ting Chen, Zarana Parekh, Hieu Pham, Quoc V. Le, Yun-Hsuan Sung, Zhen Li, and Tom Duerig. 2021. Scaling Up Visual and Vision-Language Representation Learning With Noisy Text Supervision. In Proceedings of the 38th International Conference on Machine Learning, ICML 2021, 18-24 July 2021, Virtual Event (Proceedings of Machine Learning Research, Vol. 139), Marina Meila and Tong Zhang (Eds.). PMLR, 4904–4916. http://proceedings.mlr.press/v139/jia21b.html
- Kammerer et al. (2009) Yvonne Kammerer, Rowan Nairn, Peter Pirolli, and Ed Huai-hsin Chi. 2009. Signpost from the masses: learning effects in an exploratory social tag search browser. In Proceedings of the 27th International Conference on Human Factors in Computing Systems, CHI 2009, Boston, MA, USA, April 4-9, 2009, Dan R. Olsen Jr., Richard B. Arthur, Ken Hinckley, Meredith Ringel Morris, Scott E. Hudson, and Saul Greenberg (Eds.). ACM, 625–634. https://doi.org/10.1145/1518701.1518797
- Krumm and Rouhana (2013) John Krumm and Dany Rouhana. 2013. Placer: semantic place labels from diary data. In The 2013 ACM International Joint Conference on Pervasive and Ubiquitous Computing, UbiComp ’13, Zurich, Switzerland, September 8-12, 2013, Friedemann Mattern, Silvia Santini, John F. Canny, Marc Langheinrich, and Jun Rekimoto (Eds.). ACM, 163–172. https://doi.org/10.1145/2493432.2493504
- Krumm et al. (2015) John Krumm, Dany Rouhana, and Ming-Wei Chang. 2015. Placer++: Semantic place labels beyond the visit. In 2015 IEEE International Conference on Pervasive Computing and Communications, PerCom 2015, St. Louis, MO, USA, 23-27 March, 2015. IEEE Computer Society, 11–19. https://doi.org/10.1109/PERCOM.2015.7146504
- Lagos et al. (2020) Nikolaos Lagos, Salah Ait-Mokhtar, and Ioan Calapodescu. 2020. Point-Of-Interest Semantic Tag Completion in a Global Crowdsourced Search-and-Discovery Database. In ECAI 2020 - 24th European Conference on Artificial Intelligence, 29 August-8 September 2020, Santiago de Compostela, Spain, August 29 - September 8, 2020 - Including 10th Conference on Prestigious Applications of Artificial Intelligence (PAIS 2020) (Frontiers in Artificial Intelligence and Applications, Vol. 325), Giuseppe De Giacomo, Alejandro Catalá, Bistra Dilkina, Michela Milano, Senén Barro, Alberto Bugarín, and Jérôme Lang (Eds.). IOS Press, 2993–3000. https://doi.org/10.3233/FAIA200474
- Lan et al. (2019) Zhenzhong Lan, Mingda Chen, Sebastian Goodman, Kevin Gimpel, Piyush Sharma, and Radu Soricut. 2019. Albert: A lite bert for self-supervised learning of language representations. arXiv preprint arXiv:1909.11942 (2019).
- Li et al. (2022) Junnan Li, Dongxu Li, Caiming Xiong, and Steven C. H. Hoi. 2022. BLIP: Bootstrapping Language-Image Pre-training for Unified Vision-Language Understanding and Generation. In International Conference on Machine Learning, ICML 2022, 17-23 July 2022, Baltimore, Maryland, USA (Proceedings of Machine Learning Research, Vol. 162), Kamalika Chaudhuri, Stefanie Jegelka, Le Song, Csaba Szepesvári, Gang Niu, and Sivan Sabato (Eds.). PMLR, 12888–12900. https://proceedings.mlr.press/v162/li22n.html
- Li et al. (2019) Liunian Harold Li, Mark Yatskar, Da Yin, Cho-Jui Hsieh, and Kai-Wei Chang. 2019. VisualBERT: A Simple and Performant Baseline for Vision and Language. CoRR abs/1908.03557 (2019). arXiv:1908.03557 http://arxiv.org/abs/1908.03557
- Li et al. (2021) Wei Li, Can Gao, Guocheng Niu, Xinyan Xiao, Hao Liu, Jiachen Liu, Hua Wu, and Haifeng Wang. 2021. UNIMO: Towards Unified-Modal Understanding and Generation via Cross-Modal Contrastive Learning. In Proceedings of the 59th Annual Meeting of the Association for Computational Linguistics and the 11th International Joint Conference on Natural Language Processing, ACL/IJCNLP 2021, (Volume 1: Long Papers), Virtual Event, August 1-6, 2021, Chengqing Zong, Fei Xia, Wenjie Li, and Roberto Navigli (Eds.). Association for Computational Linguistics, 2592–2607. https://doi.org/10.18653/v1/2021.acl-long.202
- Li et al. (2016) Xue Li, Bin Shen, Bao-Di Liu, and Yu-Jin Zhang. 2016. A Locality Sensitive Low-Rank Model for Image Tag Completion. IEEE Trans. Multim. 18, 3 (2016), 474–483. https://doi.org/10.1109/TMM.2016.2518478
- Lin et al. (2021) Junyang Lin, Rui Men, An Yang, Chang Zhou, Ming Ding, Yichang Zhang, Peng Wang, Ang Wang, Le Jiang, Xianyan Jia, Jie Zhang, Jianwei Zhang, Xu Zou, Zhikang Li, Xiaodong Deng, Jie Liu, Jinbao Xue, Huiling Zhou, Jianxin Ma, Jin Yu, Yong Li, Wei Lin, Jingren Zhou, Jie Tang, and Hongxia Yang. 2021. M6: A Chinese Multimodal Pretrainer. CoRR abs/2103.00823 (2021). arXiv:2103.00823 https://arxiv.org/abs/2103.00823
- Lin et al. (2018) Rongcheng Lin, Jing Xiao, and Jianping Fan. 2018. Nextvlad: An efficient neural network to aggregate frame-level features for large-scale video classification. In Proceedings of the European Conference on Computer Vision (ECCV) Workshops. 0–0.
- Lin et al. (2013) Zijia Lin, Guiguang Ding, Mingqing Hu, Jianmin Wang, and Xiaojun Ye. 2013. Image Tag Completion via Image-Specific and Tag-Specific Linear Sparse Reconstructions. In 2013 IEEE Conference on Computer Vision and Pattern Recognition, Portland, OR, USA, June 23-28, 2013. IEEE Computer Society, 1618–1625. https://doi.org/10.1109/CVPR.2013.212
- Liu et al. (2021) Shilong Liu, Lei Zhang, Xiao Yang, Hang Su, and Jun Zhu. 2021. Query2Label: A Simple Transformer Way to Multi-Label Classification. CoRR abs/2107.10834 (2021). arXiv:2107.10834 https://arxiv.org/abs/2107.10834
- Loshchilov and Hutter (2019) Ilya Loshchilov and Frank Hutter. 2019. Decoupled Weight Decay Regularization. In 7th International Conference on Learning Representations, ICLR 2019, New Orleans, LA, USA, May 6-9, 2019. OpenReview.net. https://openreview.net/forum?id=Bkg6RiCqY7
- Radford et al. (2021) Alec Radford, Jong Wook Kim, Chris Hallacy, Aditya Ramesh, Gabriel Goh, Sandhini Agarwal, Girish Sastry, Amanda Askell, Pamela Mishkin, Jack Clark, Gretchen Krueger, and Ilya Sutskever. 2021. Learning Transferable Visual Models From Natural Language Supervision. In Proceedings of the 38th International Conference on Machine Learning, ICML 2021, 18-24 July 2021, Virtual Event (Proceedings of Machine Learning Research, Vol. 139), Marina Meila and Tong Zhang (Eds.). PMLR, 8748–8763. http://proceedings.mlr.press/v139/radford21a.html
- Raffel et al. (2020) Colin Raffel, Noam Shazeer, Adam Roberts, Katherine Lee, Sharan Narang, Michael Matena, Yanqi Zhou, Wei Li, and Peter J. Liu. 2020. Exploring the Limits of Transfer Learning with a Unified Text-to-Text Transformer. J. Mach. Learn. Res. 21 (2020), 140:1–140:67. http://jmlr.org/papers/v21/20-074.html
- Ren et al. (2015) Shaoqing Ren, Kaiming He, Ross B. Girshick, and Jian Sun. 2015. Faster R-CNN: Towards Real-Time Object Detection with Region Proposal Networks. In Advances in Neural Information Processing Systems 28: Annual Conference on Neural Information Processing Systems 2015, December 7-12, 2015, Montreal, Quebec, Canada, Corinna Cortes, Neil D. Lawrence, Daniel D. Lee, Masashi Sugiyama, and Roman Garnett (Eds.). 91–99. https://proceedings.neurips.cc/paper/2015/hash/14bfa6bb14875e45bba028a21ed38046-Abstract.html
- Ridnik et al. (2021) Tal Ridnik, Hussam Lawen, Asaf Noy, Emanuel Ben Baruch, Gilad Sharir, and Itamar Friedman. 2021. TResNet: High Performance GPU-Dedicated Architecture. In IEEE Winter Conference on Applications of Computer Vision, WACV 2021, Waikoloa, HI, USA, January 3-8, 2021. IEEE, 1399–1408. https://doi.org/10.1109/WACV48630.2021.00144
- Sariyildiz et al. (2020) Mert Bülent Sariyildiz, Julien Perez, and Diane Larlus. 2020. Learning Visual Representations with Caption Annotations. CoRR abs/2008.01392 (2020). arXiv:2008.01392 https://arxiv.org/abs/2008.01392
- Vaswani et al. (2017) Ashish Vaswani, Noam Shazeer, Niki Parmar, Jakob Uszkoreit, Llion Jones, Aidan N Gomez, Łukasz Kaiser, and Illia Polosukhin. 2017. Attention is all you need. Advances in neural information processing systems 30 (2017).
- Wang and Liu (2021) Feng Wang and Huaping Liu. 2021. Understanding the Behaviour of Contrastive Loss. In IEEE Conference on Computer Vision and Pattern Recognition, CVPR 2021, virtual, June 19-25, 2021. Computer Vision Foundation / IEEE, 2495–2504. https://doi.org/10.1109/CVPR46437.2021.00252
- Wang et al. (2017) Yan Wang, Zongxu Qin, Jun Pang, Yang Zhang, and Jin Xin. 2017. Semantic Annotation for Places in LBSN through Graph Embedding. In Proceedings of the 2017 ACM on Conference on Information and Knowledge Management, CIKM 2017, Singapore, November 06 - 10, 2017, Ee-Peng Lim, Marianne Winslett, Mark Sanderson, Ada Wai-Chee Fu, Jimeng Sun, J. Shane Culpepper, Eric Lo, Joyce C. Ho, Debora Donato, Rakesh Agrawal, Yu Zheng, Carlos Castillo, Aixin Sun, Vincent S. Tseng, and Chenliang Li (Eds.). ACM, 2343–2346. https://doi.org/10.1145/3132847.3133075
- Wang et al. (2022) Zirui Wang, Jiahui Yu, Adams Wei Yu, Zihang Dai, Yulia Tsvetkov, and Yuan Cao. 2022. SimVLM: Simple Visual Language Model Pretraining with Weak Supervision. In The Tenth International Conference on Learning Representations, ICLR 2022, Virtual Event, April 25-29, 2022. OpenReview.net. https://openreview.net/forum?id=GUrhfTuf_3
- Yan et al. (2023) Na Yan, Honglong Chen, Kai Lin, Zhichen Ni, Zhe Li, and Huansheng Xue. 2023. BFSearch: Bloom filter based tag searching for large-scale RFID systems. Ad Hoc Networks 139 (2023), 103022. https://doi.org/10.1016/j.adhoc.2022.103022
- Yang et al. (2016) Dingqi Yang, Bin Li, and Philippe Cudré-Mauroux. 2016. POISketch: Semantic Place Labeling over User Activity Streams. In Proceedings of the Twenty-Fifth International Joint Conference on Artificial Intelligence, IJCAI 2016, New York, NY, USA, 9-15 July 2016, Subbarao Kambhampati (Ed.). IJCAI/AAAI Press, 2697–2703. http://www.ijcai.org/Abstract/16/383
- Yang (1999) Yiming Yang. 1999. An Evaluation of Statistical Approaches to Text Categorization. Inf. Retr. 1, 1-2 (1999), 69–90. https://doi.org/10.1023/A:1009982220290
- Yao et al. (2022) Lewei Yao, Runhui Huang, Lu Hou, Guansong Lu, Minzhe Niu, Hang Xu, Xiaodan Liang, Zhenguo Li, Xin Jiang, and Chunjing Xu. 2022. FILIP: Fine-grained Interactive Language-Image Pre-Training. In The Tenth International Conference on Learning Representations, ICLR 2022, Virtual Event, April 25-29, 2022. OpenReview.net. https://openreview.net/forum?id=cpDhcsEDC2
- Ye et al. (2011) Mao Ye, Dong Shou, Wang-Chien Lee, Peifeng Yin, and Krzysztof Janowicz. 2011. On the semantic annotation of places in location-based social networks. In Proceedings of the 17th ACM SIGKDD International Conference on Knowledge Discovery and Data Mining, San Diego, CA, USA, August 21-24, 2011, Chid Apté, Joydeep Ghosh, and Padhraic Smyth (Eds.). ACM, 520–528. https://doi.org/10.1145/2020408.2020491
- Zhang et al. (2017) Jiaming Zhang, Shuhui Wang, and Qingming Huang. 2017. Location-Based Parallel Tag Completion for Geo-Tagged Social Image Retrieval. ACM Trans. Intell. Syst. Technol. 8, 3 (2017), 38:1–38:21. https://doi.org/10.1145/3001593
- Zhang et al. (2022) Yi Zhang, Mingyuan Chen, Jundong Shen, and Chongjun Wang. 2022. Tailor versatile multi-modal learning for multi-label emotion recognition. arXiv preprint arXiv:2201.05834 (2022).
- Zhang et al. (2020) Yuhao Zhang, Hang Jiang, Yasuhide Miura, Christopher D. Manning, and Curtis P. Langlotz. 2020. Contrastive Learning of Medical Visual Representations from Paired Images and Text. CoRR abs/2010.00747 (2020). arXiv:2010.00747 https://arxiv.org/abs/2010.00747
- Zhang et al. (2019) Zhengyan Zhang, Xu Han, Zhiyuan Liu, Xin Jiang, Maosong Sun, and Qun Liu. 2019. ERNIE: Enhanced Language Representation with Informative Entities. In Proceedings of the 57th Conference of the Association for Computational Linguistics, ACL 2019, Florence, Italy, July 28- August 2, 2019, Volume 1: Long Papers, Anna Korhonen, David R. Traum, and Lluís Màrquez (Eds.). Association for Computational Linguistics, 1441–1451. https://doi.org/10.18653/v1/p19-1139
- Zhao et al. (2021) Jiawei Zhao, Yifan Zhao, and Jia Li. 2021. M3tr: Multi-modal multi-label recognition with transformer. In Proceedings of the 29th ACM International Conference on Multimedia. 469–477.
- Zhou et al. (2019) Jingbo Zhou, Shan Gou, Renjun Hu, Dongxiang Zhang, Jin Xu, Airong Jiang, Ying Li, and Hui Xiong. 2019. A Collaborative Learning Framework to Tag Refinement for Points of Interest. In Proceedings of the 25th ACM SIGKDD International Conference on Knowledge Discovery & Data Mining, KDD 2019, Anchorage, AK, USA, August 4-8, 2019, Ankur Teredesai, Vipin Kumar, Ying Li, Rómer Rosales, Evimaria Terzi, and George Karypis (Eds.). ACM, 1752–1761. https://doi.org/10.1145/3292500.3330698
- Zhu et al. (2013) Yin Zhu, Erheng Zhong, Zhongqi Lu, and Qiang Yang. 2013. Feature engineering for semantic place prediction. Pervasive Mob. Comput. 9, 6 (2013), 772–783. https://doi.org/10.1016/j.pmcj.2013.07.004