State-Of-The-Practice in Quality Assurance in Java-Based Open Source Software Development
3.2.6 Mature Projects
4.1.1 Local Builds in Mature Projects
4.2.1 ASATs Usage Among Mature Projects
4.3.3 Prevalence of CI in Mature Projects
4.4.1 Code Review in Mature Projects
4.5.1 Testing in Mature Projects
5.4 Related Work
5.4.1 Quality Assurance Practices in Isolation
5.4.2 Quality Assurance Practices in Conjunction
5.5 Implications and Future Work
Abstract
To ensure the quality of software systems, software engineers can make use of a variety of quality assurance approaches, e.g., software testing, modern code review, automated static analysis, and build automation. Each of these quality assurance practices have been studied in depth in isolation, but there is a clear knowledge gap when it comes to our understanding of how these approaches are being used in conjunction, or not. In our study, we broadly investigate whether and how these quality assurance approaches are being used in conjunction in the development of 1,454 popular open source software projects on GitHub. Our study indicates that typically projects do not follow all quality assurance practices together with high intensity. In fact, we only observe weak correlation among some quality assurance practices. In general, our study provides a deeper understanding of how existing quality assurance approaches are currently being used in open source software development.
keywords:
Software Quality Assurance, Software Testing, Continuous Integration, Code Review, Build Automation, Automated Static Analysisequ[][]
[1]organization=Delft University of Technology, addressline=Van Mourik Broekmanweg 6, city=Delft, postcode=2628XE, country=The Netherlands
1 Introduction
We have grown accustomed to living in a software-filled world: we rely on our smartphone full of apps, or on digitalised services for many of our daily activities [1]. With software pervading modern society and controlling critical aspects from an economic, safety, security and scientific standpoint, the quality and dependability of that software is indispensable [2], because of the potential catastrophic consequences [3]. To ensure the quality of these software systems, software engineers can use a range of quality assurance approaches, e.g., software testing [4, 5], modern code review [6, 5], automated static analysis [7, 8], and build automation [9, 10].
Each of these quality assurance techniques have been studied in isolation in-depth. For example, Beller et al. have analyzed the prevalence of automated static analysis tools in open source software development [7], Rausch et al. performed an empirical analysis of build failures [11], both Beller et al. and Rigby et al. investigated aspects of code reviews in open-source software development [12, 13], and Hilton et al. focused on understanding continuous integration [14]. Other studies have examined the relationship between two quality assurance practices, e.g., Cassee et al. have studied the impact of continuous integration on code review [15], Zhao et al. have looked into the impact of continuous integration on other software development practices [16], Zampetti et al. did a study on the interplay between pull requests and CI [17], Panichella et al. looked into the complementarity of static analysis tools and code reviews [18], and Nery et al. did an empirical study of the relationship between CI and test code evolution [19].
Some of these approaches are to be considered complimentary to each other, e.g., code reviews and software tests find different issues [20]. Precisely because of the complementarity between the approaches, we set out to broadly investigate whether and how software testing, modern code reviews, automated static analysis, and build automation are being used in conjunction in the development of open source software on GitHub. Github is one of the most important development platforms for open source software and has around 28 million users and 79 million repositories [21]. In addition to it being a git-based version control system, GitHub integrates several elements for quality assurance, e.g., pull requests for code review, continuous integration for build automation and test execution, and integrations for automated static analysis and code coverage.
We have performed our investigation into the state-of-the-practice in quality assurance by analysing 1454 GitHub projects. Our investigation is guided by the following research questions:
-
RQ1
What is the current state-of-the-practice in quality assurance in open source software development?
-
RQ1.1
What is the prevalence of quality assurance approaches like software testing, modern code review, automated static analysis, and buildability?
-
RQ1.2
Which quality assurance approaches are being used in conjunction?
- RQ1.3
-
RQ1.1
Getting a broad understanding of how existing quality assurance approaches are being used in open source development is important for software practitioners, software engineering educators, and software engineering researchers. Specifically, this understanding will inform practitioners about the (combinations of) best practices and how they are currently in use. Furthermore, it will apprise educators on what should be taught in software engineering classes, both in terms of the current state-of-practice and how we can improve on the state-of-practice. Finally, it can inspire researchers to improve both quality assurance approaches in isolation, as well as how their combinations can be strengthened.
The structure of the remainder of this paper is as follows. Section 2 presents the related literature. Section 3 details our data collection procedure. Section 4 reports on our results for each of the quality assurance practices in isolation and in conjunction. Section 5 discusses our findings, while Section 6 concludes the paper.
There is also an associated package provided to replicate and reproduce the results of our study [22].
2 Background
We present literature related to each of the practices in our study as the background knowledge in this section.
2.1 –
(CI) Building, Compilability Tufano et al. have examined the compilability of 220,000 snapshots of 100 Apache Software Foundation projects [23]. They found that 30% (median) of those snapshots could not be compiled. Hassan et al. have investigated Java projects on GitHub and report that 101 out of 187 projects could be successfully build using Ant, Maven, or Gradle [25]. Their manual inspection provides indications on the main reasons for build failure: ‘backward-incompatibility of JDK and building tools‘, ‘non-default parameters in build commands‘, and ‘project defects in code / configuration files‘. In another study Hassan et al. have proposed a model to predict CI build results [26]. More specifically, they have built a classifier using the random forest algorithm and applied it to the TravisTorrent dataset [27] of 402 Java projects and 250,000 builds. Jin and Servant have proposed an approached called SmartBuildSkip to reduce CI build cost by predicting successful CI builds and skipping them [28]. They base their approach on two hypotheses: most builds pass, and build failures usually happen consecutively (52% of build failures are consecutive). Lou et al. have studied 1,080 questions on Stack Overflow related to build issues of Maven, Gradle and Ant build systems [29]. They have observed a high diversity in build failure categories, however about 68% of them can be fixed by applying fix patterns in the build script code related to plugins and dependencies (the most frequent ones being (1) correcting the plugin setting, and (2) adding missing dependencies). Rausch et al. have analyzed build failures in CI from 14 open-source Java projects linking commits to their CI builds results [11]. As a result, they found 14 common error categories and reported test failures as the most common one among projects. Zampetti et al. empirically investigated how developers use CI builds outcome during a code review in a PR discussion, analyzing 69 projects using Travis-CI on GitHub [17]. They found that passed builds increase the chances of merging a PR, and if a build fails, process-factors (like the age of PR, changed lines and files, review comments, etc.) have stronger correlation. Interestingly, sometimes a PR is merged despite a failing build status, e.g., due to minor warnings from static analysis tools.
2.2 Code Review
Cassee et al. have explored code reviews of 685 open source projects on GitHub that used Travis-CI as their CI platform [15]. They found that using Continuous Integration (CI) on average saves one review comment per pull request, indicating that adopting continuous integration can save-up valuable time in code review. Similarly, Rahman and Roy have investigated the impact of CI on code reviews to understand the relation between CI builds and the participation or quality of the code reviews [31]. They indicate that succeeding automated builds have a positive effect on code review participation. Using code review comments count as a proxy for code review quality, they came to the conclusion that automated build frequency has a significant positive impact on the code review quality. Rigby et al. have conducted a case study of the Apache Server peer review practices as a popular open source project [13]. They observe the number of reviewers that are involved in each review, the frequency of reviews, the size of the artifacts under review, the time interval of reviews, and how many reviews find defects. Beller et al. have investigated to see what problems are fixed when doing modern code reviews in open source projects [12]. They report that 10 to 35% of review suggestions do not lead to any code changes, and they observe a 3-to-1 ratio in maintainability versus functional code review comments. Bacchelli and Bird coined the term Modern Code Review (MCR) [6] as the lightweight and less formal version of heavyweight formal code inspections [32]. They explored the expectations, outcomes, and challenges of MCR by manually classifying comments, and observing, interviewing, and surveying practitioners. Their study found that the main motivation of code reviews is not to find defects/bugs, but to increase awareness and do knowledge transfer. Kononenko et al. have looked into developers’ perception of code review quality [33]. They found that review quality is primarily associated with thoroughness of the feedback, familiarity with the code, and the quality of the code. Factors such as code quality, presence and quality of tests, and personality of the developer would have impact on the review decision.
2.3 Testing
Hilton et al. have performed a large scale study of test coverage evolution over 7,816 builds of 47 open source projects [35]. To gather coverage data of projects they ran test suits themselves and also used the Coveralls service444https://coveralls.io, last visited May 20th, 2022. for some of them. Their main findings are that patch coverage is not correlated with overall coverage, and that patches might have a significant effect on overall coverage. An observation that was previously also made by Elbaum et al. [36]. Zaidman et al. have observed that testing activities do not always nicely co-evolve with production code engineering activities [37]. Instead, they observe that testing happens in bursts. Importantly, this observation was made before the pull-based development model became popular. Gousios et al. have deeply studied the pull-based development contribution model and found that guidelines for pull request creation include feature isolation, but also conformance to source code quality and test coverage guidelines [38]. Beller et al. have tracked how developers go about the test engineering process in their Integrated Development Environment (IDE) [39]. From the software engineers that they tracked, the found that around 50% of them did not carry out any test-related activities (writing or executing test) in the IDE during a 5-month period.
2.4 Continuous Integration
Vasilescu et al. have investigated the effects of adopting continuous integration on quality of the software and also on the productivity of the development team [42]. They report that using CI leads to more pull requests getting accepted, and that CI improves the productivity of project teams. Vassallo et al. have investigated the concept of Continuous Code Quality (CCQ) that they take from SonarQube [43]. CCQ is the idea that CI stands central in ensure code quality by running automated tests and performing automated code inspections at every build [44]. Their main finding after a large-scale analysis of 119 Java projects is that only 11% of CI builds continuously monitor code quality. Hilton et al. have studied the usage, costs, and benefits of CI in open-source projects [14]. They observe that popular projects are more likely to use CI, projects using CI release more often than the ones not using it, projects use CI because it helps them catch bugs early. Nery et al. have looked into the relationship between continuous integration and test code evolution [19]. They study test coverage and test ratio (the proportion of test code in a project) and report that projects using CI have a rising trend in test ratio compared to projects that do not use CI, and that test coverage of CI-using projects grows more overtime compared to projects not using CI.
2.5 Other Elements of Quality Assurance
Gousios et al. defined pull-based software development model [47]. In their exploratory analysis on Github projects at that time they discovered that pull-based model is not popular. Moreover, they found that most pull requests are small (affected a few dozen lines of code), and only a few (13%) of them are rejected due to technical reasons. Furthermore, they reported that providing guidelines for pull request processing, and having a high coverage test suite will attract external contributors and speed up merging of contributions. Gousios et al.’s study [47] resulted in creation of a dataset of 900 projects and 350,000 pull requests called pullreqs [48]. This dataset was initially created by Gousios and Zaidman, then updated by Zhang et al. [49] by adding more projects, pull requests, and data features. In both studies there are similar data features that overlap with features collected in our study, using similar heuristics. Besides, heuristics used in Zhang et al. work for collecting CI usage, and CI build data are similar to our data collection methodology. Kinsman et al. have examined how software developers use GitHub Actions [50]. GitHub Actions is a GitHub feature to automate tasks based on events like commits, PRs, issues, etc. In their dataset only 0.7% of projects adopted GitHub Action spread across 20 categories (CI, CD, utilities, etc.).
3 Study Setup
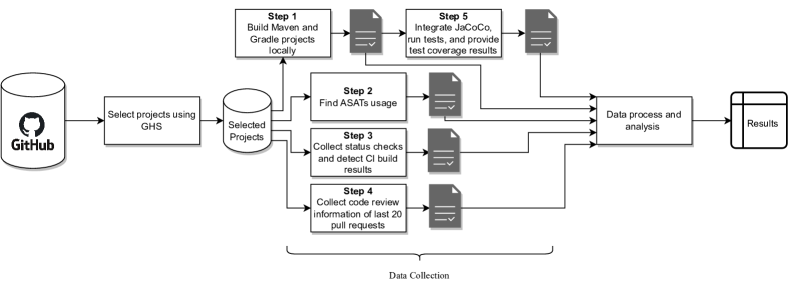
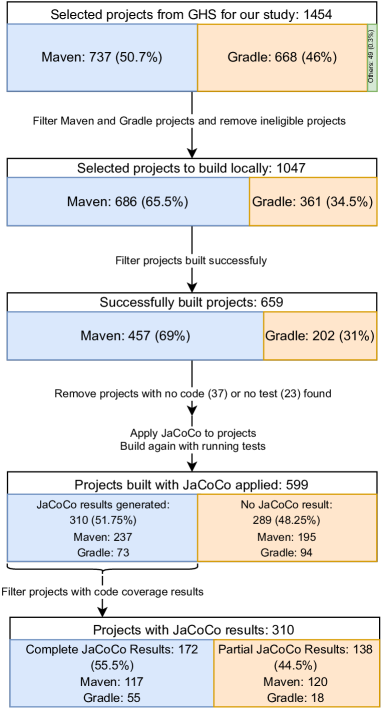
In this section, we first explain how we selected projects for the study, and then describe the data collection steps in detail. Figure 1 details our data collection procedure in 5 steps, each for a specific quality assurance practice.
- Step 1:
-
Build projects locally.
- Step 2:
-
Determine usage of Automated Static Analysis Tools (ASATs).
- Step 3:
-
Investigate CI usage and build result.
- Step 4:
-
Collect code review data from last 20 pull requests.
- Step 5:
-
Collect test coverage results.
3.1 Studied Projects
We used Dabic et al.’s GitHub Search (GHS) dataset [51] to select projects from GitHub based on different criteria. As it is our aim to investigate projects that are likely to be in a position to make optimal use of quality assurance practices, we filtered the projects using the following criteria. We selected popular (100 stars) Java projects that have recently been active (last commit after August 2021). We have settled on one programming language to keep our data analysis pipeline simple, more specifically, we have chosen Java. We have also selected projects to minimally have 10 contributors, as our line of reasoning is that you need to have a sufficient number of developers to make optimal use of quality assurance practices like code reviews. In addition, we haven chosen to only study non-forked projects to avoid duplicate projects. Finally, we put a lower limit of 200 pull requests for a project to be part of our data set; this threshold ensures that we study projects that use the pull based development model, and are thus potentially also doing code reviews on the GitHub platform. We also saved the latest commit hash for each project, and in the next steps, we use this commit hash to run git checkout. This enables (1) us to study each of the projects in a specific state, and (2) to easily replicate our work in future [22].
3.2 Data Collection
In this section we go step by step and explain the path we took to collect data related to each quality assurance practice.
3.2.1 Step 1. Local builds
In this step we describe how we have collected information on the buildability (compilability) of projects. This information first shows us which projects can be built out of the box (without any special configuration, reading project specific documents, and environment setup), only using a minimal environment (a Docker container of Ubuntu 21.04) with the Java Development Kit (Open JDK 11) and build tools such as Maven and Gradle. Secondly, we will use this information to filter successfully built projects and generate test coverage results for them in Step 4. Starting from the collection of GitHub Java projects, first we filtered the projects using Maven and Gradle as their build system. To do this we searched for gradle.build and pom.xml configuration files inside (the root path of project) repositories by querying GitHub. Next, we specifically filtered out Android projects (by searching for the AndroidManifest.xml file inside repositories) to avoid build failures related to Android SDK configurations. After removing non-Gradle, non-Maven, and Android projects, we obtain the set of projects to be built locally. In the next step, we automatically clone projects and after doing git checkout on the latest commit hash, build projects locally using a docker container with Ubuntu 21.04, OpenJDK v11, Gradle v7.1, Python v3.9, and Maven v3.8.1 installed. Similar to Sulír et al. [52] we skip running tests when building projects in this step to avoid test failures. We add relevant flags to our build commands to have full log information in build output logs (see Table 1). Furthermore, we put one hour maximum build execution time to avoid infinite builds (similar to Sulír et al. [52]).
| Build System | Build Command |
|---|---|
| Gradle | ./gradlew clean assemble --stacktrace |
| Maven | mvn clean package -DskipTests --batch-mode -e |
3.2.2 Step 2. Automatic static analysis tools
Similar to the previous step, we again use GitHub’s API to see if there is a configuration file related to one of the more popular Java static analysis tools (SpotBugs, Checkstyle, and FindBugs) in the repositories, similar to Beller et al. [7]. To do this, after running the git checkout on the latest commit hash, we looped through the repository Git tree to check whether it contains a file with a substring of ‘spotbugs’ in their name phrase. If that is the case, then the project is marked as (likely) to use the SpotBugs tool. We performed a similar step for Checkstyle and FindBugs.
3.2.3 Step 3. Continuous integration
In this step, we collected the required data to study both the prevalence of CI and the results of the build steps that are part of CI. For the prevalence of CI, we need CI usage data (whether a project is doing continuous integration). In terms of the result of CI, we are interested in two distinct steps: (1) the overall CI build success, and (2) the result of specifically the build phase of the CI workflow. We need the latter result, to be able to compare the result of the CI build phase, to that of a local build result from Section 3.2.1. Step 3.1. CI usage: To establish whether a project uses continuous integration, we have decided to use a different approach to earlier studies on this topic. In particular, prior studies have used the TravisTorrent dataset [27], or the Travis-CI API to check whether a project is using CI [15]. Also, Vassallo et al.’s work only considered SonarCloud as a CI platform to study projects’ code quality [44], and Gallaba et al.’s study was limited to CircleCI builds [53]. These aforementioned approaches are limited to one particular CI platform, namely Travis-CI, SonarCloud, or CircleCI. To consider different CI platforms together, we followed a different route to establish CI usages, namely the usage of checks on GitHub555https://docs.github.com/en/pull-requests/collaborating-with-pull-requests/collaborating-on-repositories-with-code-quality-features/about-status-checks, last visited May 20th, 2022..
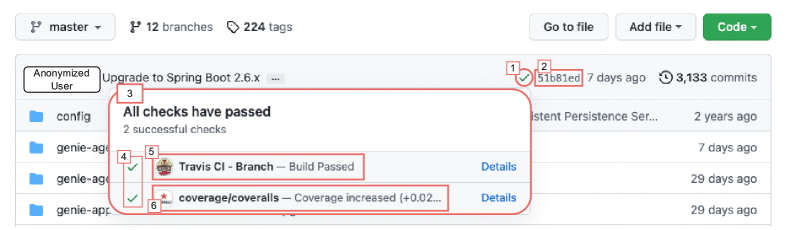
Using GitHub Actions666https://docs.github.com/en/actions, last visited May 20th, 2022. (GHA) projects can automate their workflows, including CI/CDs on GitHub. Events like pushing a commit, creating a pull request, opening an issue, etc. can trigger a workflow run (also referred to as a check). In this paper we collect information related to checks that run after pushing a specific commit, namely latest commit SHA of projects in our dataset. There are two types of checks that can run after pushing a commit777https://docs.github.com/en/pull-requests/collaborating-with-pull-requests/collaborating-on-repositories-with-code-quality-features/about-status-checks, last visited May 20th, 2022.: (1) the ones defined by workflows, which are only available for use with GitHub Apps, and (2) the ones that are marked with external services through the GitHub API (these are called Commit Statuses in GitHub’s documentation), shown in Figure 2. From now on, similar to GitHub’s documentation, we will call the first type: “checks”, the second type: “(commit) statuses”, and both together: “status checks”. What is important to note is that not all status checks are related to CI, and as such can not be unequivocally regarded as a sign of CI usage. To address this, we heuristically filtered CI related status checks. Table 2 shows data attributes of status checks depending on their type. This information is collected from the GitHub GraphQL API888https://docs.github.com/en/graphql, last visited May 20th, 2022.. To filter CI related status checks, depending on their type, we look for some keywords in context, targetUrl, and description of statuses, and for checks we look for usage of specific GitHub Apps related to CI. For GitHub Actions App999GitHub Actions App is a GitHub App and differs from GitHub Actions which is GitHub’s CI/CD platform. In this paper, with GHA we refer to the CI/CD platform on GitHub, and with GHAA we refer to the GitHub Actions App on GitHub’s marketplace. (GHAA) checks, the most used GitHub App, we have also looked to see if they contain any “build” keyword in their name. This is because using GHAA does not always mean a project is using CI, however if there is the build keyword, there is a strong signal of the project doing CI. Table 3 shows the keywords used in filtering CI related status checks.
| Checks’ Attributes | ||
|---|---|---|
| Name | Description | Value(s) |
| conclusion | The conclusion of the check run. | ACTION_REQUIRED / CANCELLED / FAILURE / NEUTRAL / SKIPPED / STALE / STARTUO_ FAILURE / SUCCESS / TIMED_OUT |
| name | The name of the check for this check run. | String |
| status | The current status of the check run. | COMPLETED / IN_PROGRESS / PENDING / QUEUED / REQUESTED / WAITING |
| summary | Summary of the check run. | String |
| text | Text of check run. | String |
| title | Title of check run. | String |
| app | The GitHub App which created the check suite containing this check run. | Name: String Slug: String |
| workflow run | The workflow run associated with the check suite containing this check run. | Number: Int URL: URI |
| workflow | The workflow executed in the workflow run. | Name: String |
| Statuses’ Attributes | ||
| Name | Description | Value(s) |
| context | The name of this status. | String |
| description | The description for this status. | String |
| state | The state of this status. | ERROR / EXPECTED / FAILURE / PENDING / SUCCESS |
| targetUrl | The URL for this status context. | URI |
| Type | Attribute | Keywords | |||
|---|---|---|---|---|---|
| Check | app name |
|
|||
| Status | context | ci, continuous-integration, kokoro, bazel | |||
| description | teamcity, kokoro | ||||
| targetUrl | ci., screwdriver, buildkite, teamcity |
Step 3.2. Overall CI results: To see what is the final state of CI workflows run in a specific state of the project (latest commit hash), we rely on the status checks information. Status checks data collected from the GitHub API contains a status check attribute that represents the rollup for both checks and statuses for a commit101010https://docs.github.com/en/graphql/reference/objects#statuscheckrollup, last visited May 20th, 2022. (also referred to as combined status111111https://docs.github.com/en/rest/commits/statuses#get-the-combined-status-for-a-specific-reference, last visited May 20th, 2022., however only for statuses). We also refer to this rollup result as the CI result of each project for the latest commit hash in our dataset. Of course this only applies to the projects having at least one filtered CI related status check. Step 3.3. Result of build phase in the complete CI workflow: Having local build results in hand from the first step of our data collection (see Section 3.2.1), we want to see how a CI build outcome of a project matches its local build outcome. Therefore, we first heuristically filter build related CI status checks by searching for “build”/“built” keywords in their attributes (Table 4 shows the details). Second, based on the results of each of filtered CI builds, we determine the rollup result of CI builds. Meaning if all statuses’ state and all checks’ conclusion is “SUCCESS”, then the rollup status of CI build is success, otherwise it is failure.
| Type | Attribute | Keyword(s) |
|---|---|---|
| Check | title | built, build |
| text | build | |
| name | build | |
| Status | context | build |
| description | built, build |
3.2.4 Step 4. Code review
To collect information about projects’ code review activity, we focus on the user’s code review behavior during pull-based development in the GitHub environment. When a contributor creates a pull request to merge their contribution to the main repository, integrators or co-contributors can review the pull request [38]. The contributor who created the pull request and the code reviewer(s) can have a conversation through comments. For our dataset we count the number of reviews and the number of comments for the last 20 merged pull requests of projects (reference data August 1st, 2021). We set the specific reference date to ensure future reproducibility. Reviews are defined as pull request review comments with an optional body comment and a state121212https://docs.github.com/en/rest/reference/pulls#reviews, last visited May 20th, 2022.. Approving changes are also considered as a review action. With comments, we mean other comments in a pull request discussion part that are not posted by GitHub bots [54], and are not made on a unified diff and are usually meant for general communication. We analyse the combination of these two data points to show how code review is taking place for a project on GitHub. We only consider merged pull requests (based on the GitHub API131313https://docs.github.com/en/rest/reference/pulls#check-if-a-pull-request-has-been-merged, last visited May 20th, 2022.). To avoid getting into a loop of checking all pull requests to see if they are merged or not, we limit ourselves to the last 100 pull requests. Important to note is that if a project is using Git instead of GitHub to merge pull requests [55], it will not be considered for code reviewing in our dataset, since our approach only monitors code reviews performed through the GitHub web interface. Furthermore, for our correlation analysis in Section 4.6 we collected two other data points for each of the pull requests: total count of lines changed and count of files changed in all commits. We have combined them to formulate our code review rate metric (Equation 1). We settled on this equation for two key reasons. The first one being that we want to include both count of comments and count of reviews, as they are both important during the review process. The second reason being that we want to normalise the combined count of comments and reviews over the number of changed lines of code divided by the number of changed files. This normalisation enables us to more easily compare the review intensity of a changed piece of source code. {equ}[!ht]
| (1) |
*Equation 1: Code review intensity metric formula.
|
|
|
|
|
|
|
|
|
|
||||||||||
|---|---|---|---|---|---|---|---|---|---|---|---|---|---|---|---|---|---|---|---|
| kiegroup/ kogito- runtimes | 57.41 | Maximum | 1473 | Yes | 2 | Yes | 7 | 9 | 8 | ||||||||||
| 1482 | No | 3 | Yes | 0 | 3 | 69 | |||||||||||||
| 1465 | No | 2 | Yes | 0 | 17 | 51 | |||||||||||||
| 1488 | No | 2 | Yes | 0 | 3 | 2 | |||||||||||||
| 1476 | Yes | 4 | Yes | 31 | 25 | 1094 | |||||||||||||
| apache/ activemq- artemis | 2.44 | 80th | 3679 | No | 1 | Yes | 0 | 0 | 6 | ||||||||||
| 3678 | No | 0 | No | 0 | 0 | 2 | |||||||||||||
| 3677 | No | 1 | Yes | 3 | 3 | 74 | |||||||||||||
| 3676 | Yes | 3 | Yes | 0 | 15 | 76 | |||||||||||||
| 3674 | No | 1 | Yes | 0 | 0 | 2 | |||||||||||||
| 3673 | Yes | 2 | Yes | 15 | 11 | 163 | |||||||||||||
| 3668 | No | 1 | Yes | 0 | 1 | 17 | |||||||||||||
| 3665 | Yes | 2 | Yes | 3 | 0 | 67 | |||||||||||||
| 3664 | No | 1 | Yes | 0 | 0 | 9 | |||||||||||||
| 3661 | No | 1 | Yes | 0 | 1 | 57 | |||||||||||||
| 3660 | No | 0 | No | 0 | 0 | 4 | |||||||||||||
| 3658 | No | 0 | No | 0 | 0 | 828 | |||||||||||||
| 3654 | No | 1 | No | 0 | 2 | 235 | |||||||||||||
| 3651 | Yes | 1 | No | 0 | 2 | 698 | |||||||||||||
| 3650 | No | 2 | No | 0 | 13 | 5 | |||||||||||||
| 3649 | Yes | 1 | Yes | 11 | 0 | 67 | |||||||||||||
| 3648 | No | 1 | Yes | 0 | 0 | 2 | |||||||||||||
| 3647 | No | 0 | No | 0 | 0 | 145 | |||||||||||||
| 3645 | No | 1 | Yes | 0 | 0 | 10 | |||||||||||||
| 3641 | No | 0 | No | 0 | 0 | 323 | |||||||||||||
| radargun/ radargun | 1.66 | 60th | 699 | No | 0 | Yes | 0 | 0 | 6 | ||||||||||
| 698 | Yes | 1 | Yes | 1 | 1 | 116 | |||||||||||||
| 697 | No | 0 | No | 0 | 0 | 2 | |||||||||||||
| 696 | No | 1 | Yes | 0 | 1 | 268 | |||||||||||||
| 695 | No | 1 | Yes | 0 | 1 | 10 | |||||||||||||
| 694 | No | 1 | Yes | 0 | 1 | 200 | |||||||||||||
| 692 | No | 2 | Yes | 1 | 0 | 4 | |||||||||||||
| 691 | Yes | 1 | Yes | 2 | 0 | 94 | |||||||||||||
| 690 | No | 1 | Yes | 1 | 1 | 296 | |||||||||||||
| 689 | Yes | 1 | Yes | 4 | 1 | 95 | |||||||||||||
| 688 | No | 1 | Yes | 0 | 1 | 329 | |||||||||||||
| 687 | No | 1 | Yes | 0 | 1 | 8 | |||||||||||||
| 686 | No | 1 | Yes | 0 | 1 | 2 | |||||||||||||
| 685 | No | 1 | Yes | 1 | 1 | 595 | |||||||||||||
| 684 | No | 1 | Yes | 0 | 0 | 27 | |||||||||||||
| 683 | No | 0 | No | 0 | 0 | 2 | |||||||||||||
| 682 | No | 1 | Yes | 0 | 0 | 42 | |||||||||||||
| 681 | No | 1 | Yes | 0 | 0 | 4 | |||||||||||||
| 680 | No | 1 | Yes | 0 | 1 | 11 | |||||||||||||
| 678 | No | 0 | No | 0 | 0 | 2 | |||||||||||||
| wocommunity/ wonder | 0.54 | 40th | 954 | No | 1 | Yes | 0 | 3 | 3 | ||||||||||
| 953 | No | 1 | Yes | 0 | 0 | 2 | |||||||||||||
| 950 | No | 1 | Yes | 0 | 0 | 4 | |||||||||||||
| 949 | No | 1 | Yes | 0 | 1 | 5 | |||||||||||||
| 948 | No | 1 | Yes | 0 | 0 | 2 | |||||||||||||
| 946 | No | 1 | Yes | 0 | 0 | 14 | |||||||||||||
| 945 | No | 1 | Yes | 0 | 3 | 6 | |||||||||||||
| 940 | No | 1 | Yes | 0 | 0 | 2 | |||||||||||||
| 938 | No | 1 | Yes | 0 | 0 | 4 | |||||||||||||
| 937 | No | 2 | Yes | 0 | 1 | 9 | |||||||||||||
| 936 | No | 1 | Yes | 0 | 0 | 2 | |||||||||||||
| 934 | No | 1 | Yes | 0 | 0 | 3 | |||||||||||||
| 933 | Yes | 2 | Yes | 0 | 3 | 978 | |||||||||||||
| 926 | No | 2 | Yes | 0 | 2 | 16 | |||||||||||||
| 925 | No | 1 | Yes | 0 | 3 | 4 | |||||||||||||
| 924 | No | 1 | Yes | 0 | 0 | 3 | |||||||||||||
| 923 | No | 1 | Yes | 0 | 0 | 13 | |||||||||||||
| 920 | No | 1 | Yes | 0 | 0 | 77 | |||||||||||||
| 919 | No | 1 | Yes | 0 | 0 | 56 | |||||||||||||
| 918 | No | 1 | Yes | 0 | 1 | 2 | |||||||||||||
| uwetrottmann/ seriesguide | 0.15 | 20th | 787 | No | 1 | Yes | 0 | 1 | 6 | ||||||||||
| 798 | No | 0 | No | 0 | 1 | 584 | |||||||||||||
| 769 | No | 0 | No | 0 | 0 | 45 | |||||||||||||
| 810 | No | 0 | No | 0 | 1 | 11456 | |||||||||||||
| 790 | No | 0 | No | 0 | 1 | 986 | |||||||||||||
| komamitsu/ luency | 0 | Minimum | 199 | No | 0 | No | 0 | 0 | 2 | ||||||||||
| 223 | No | 0 | No | 0 | 0 | 3 | |||||||||||||
| 192 | No | 0 | No | 0 | 0 | 2 | |||||||||||||
| 248 | No | 0 | No | 0 | 0 | 2 | |||||||||||||
| 204 | No | 0 | No | 0 | 0 | 2 |
3.2.5 Step 5. Testing
To establish whether software projects do testing and at what level of intensity, we measure branch coverage. In order to do so, in this step we build the projects (that we have already successfully built in Step 1) and run their tests. We did remove some buildable projects from our dataset, in case those projects had no code or no tests. For all build configuration files in a project (build.gradle for Gradle or pom.xml for Maven) we search for the src/main path for source code and the src/test path for tests in the same directory. If we could not find any code or test directory for that project then we marked them as projects with no code or no test and removed them for this analysis step. To establish code coverage, we add the JaCoCo plugin141414JaCoCo https://www.jacoco.org, last visited May 20th 2022. to the projects’ build configuration file. We choose JaCoCo because of its popularity, slightly higher visibility, and easier integration [56]. However, integrating JaCoCo with Gradle or Maven projects is not a trivial task. To integrate JaCoCo with a project we need to insert specific configurations in projects’ build file (pom.xml or build.gradle). Depending on the structure of the project (having sub-projects or parent-projects), usage of other plugins, build system of the project (Gradle or Maven), and other configurations (in some cases tests were disabled manually in build configuration) we had to change specific lines of the build configuration. Moreover, for Gradle projects there are two different domain specific language (DSL), i.e., Groovy and Kotlin which makes it non-trivial to automatically apply the JaCoCo plugin to projects without causing a build failure. The process of automatically integrating the JaCoCo plugin for hundreds of projects has proven extremely cumbersome. To the best of our knowledge, we are the first to have created an automatic process for this task. To establish an automated process that works for a majority of projects, we had to finetune our script to cater for different build script structures. Moreover, for Maven projects we usually had to build projects in several steps, since it is quite common for a project to have multiple pom.xml files, e.g., a pom.xml file per module. On the other hand, for Gradle projects we found it easier to build a project, since when building the parent directory all child modules would be built. In the case of Maven projects, we have encountered projects were we could not produce complete coverage results, because not all modules of a project could be built successfully. Also, there are other reasons for not having complete coverage results for a project, for example, when not all modules of a project have tests, when unconventional paths for source code and test code folders are used, or when our general approach of automatically inserting the JaCoCo commands into the build file conflict with specific build file configurations of a project. For this special configurations, we would need a manual action to insert the JaCoCo command. This is one reason why we have partial coverage results for some projects.
4 Results
In this section we will discuss the results of each of the analysis steps that are depicted in Figure 1, which represents our data processing workflow. After presenting the results per analysis step, we elaborate on how the different quality assurance practices are used in parallel in Section 4.6.
4.1 Local Builds
As explained in Section 3.2.1, starting from a set of 1454 projects in our study, we filtered out non-Gradle, non-Maven and Android projects. Moreover, we also removed Gradle and Maven Projects that did not have any build configuration file in their root directory. Furthermore, in cases where we recognized both Gradle and Maven configuration files inside a project, we have labelled them as Gradle projects, our reasoning being that the Maven configuration file might be a legacy element, as the Gradle (∘2008) build system is newer than Maven (∘2004). The aforementioned steps left us with a total of 1047 projects that we could build locally (72% of the original dataset). To filter successful and failed builds we searched for BUILD SUCCESSFUL / BUILD SUCCESS and BUILD FAILED / BUILD FAILURE phrases in respectively Gradle and Maven build logs. However, in some cases none of the aforementioned phrases were found in build logs due to: (for Gradle projects) missing libraries that prevented running the build process, encountering errors when processing Maven’s pom.xml (Project Object Model) file, and encountering errors because of missing environment variables configuration. Even though there was no explicit build failure phrase in the build log, we labeled these builds as failed since no successful build was achieved. Moreover, we also consider the following cases as failed builds: builds in which the build command could not be executed (e.g., due to a missing commit in git tree), and builds that could not finish their execution (reaching the one hour time limit). The summary of local build results is shown in Figure 3. From this graph, we observe that 63% of projects could be built successfully out of the box. We do observe that that despite Gradle being a newer and more popular build system [57], among our selection of projects, it exhibits a relatively lower successful build percentage (56%) compared to Maven (66.6%). We analysed a selection of failed builds to better understand why builds fail. To this end, we first randomly selected 50 projects from the total of 388 projects with build failures, then, we manually labeled them according to their build log outputs. In Table 6 we list the most frequently found build failure categories from our sample. A key observation that we can make is that build failures related to issues with dependencies and compilation errors account for around half of build failures. For 11 projects the cause of failure was unclear due to limited build logs, which were excluded.
| Category | # | % |
|---|---|---|
| Compilation | 13 | 26% |
| Dependency | 10 | 20% |
| Configuration | 6 | 12% |
| Parsing | 5 | 10% |
| Assembling | 3 | 6% |
| Other | 2 | 4% |
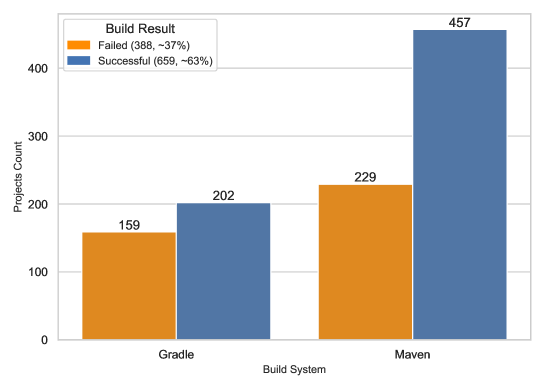
Observation 1: 63% of projects build successfully and Maven projects show a higher percentage of successful builds (67%) compared to Gradle projects (56%).
4.2 Automatic Static Analysis Tools
Overall, we observe that in 38% (548) of all 1454 projects in our study we found evidence of Checkstyle, Findbugs, or SpotBugs Automatic Static Analysis Tools (ASATs). Table 7 shows the frequency of ASAT usage, and also indicates that no project uses more than 2 ASATs in parallel. Among our set of studied projects, Checkstyle is the most popular ASAT with 36% projects using it.
Observation 2: 38% of projects use at least one ASAT.
|
|
|
|
|
|
|
||||||||||||||
|---|---|---|---|---|---|---|---|---|---|---|---|---|---|---|---|---|---|---|---|---|
| 1454 | 519 (36%) | 3 (0%) | 104 (7%) | 906 (62%) | 470 (32%) | 78 (5%) |
4.3 Continuous Integration
We set out to study two aspects of Continuous Integration: firstly, the prevalence of the use of CI in our study set, and secondly, a comparison between CI build results and local build results. As stated in Section 3.2.3, data about CI related activities are derived from GitHub status checks. We will study the usage of status checks separately.
4.3.1 Prevalence of CI
As explained in Section 3.2.3, we study the use of CI for a project at a specific point in time, namely the latest commit hash in our dataset. At that point, we have results stemming from 1131 projects using external services that mark their Commit Status or are using GitHub Actions to run Checks in the form of workflows. Overall, we found that checks (6,906 checks) are more frequently used by projects compared to statuses (1,224 statuses). However, not all checks and statuses can be considered as a use of CI. So, we came up with a heuristic to filter CI related ones (explained in Section 3.2.3). After this filtering we established that 912 (62.7%) projects use status checks in their CI pipelines: 613 projects only used CI checks, 200 projects only used CI commit statuses, and 99 projects used both (more details in Table 8).
| # All Projects | # Projects | # Projects | ||
|---|---|---|---|---|
| Not Using CI | Using CI | |||
| Use Checks | 613 | |||
| Use Statuses | 200 | |||
| 1454 | 542 (37%) | 912 (63%) | Use Both | 99 |
| Successful State | 695 (76.2%) | |||
| Unsuccessful State | 219 (23.8%) | |||
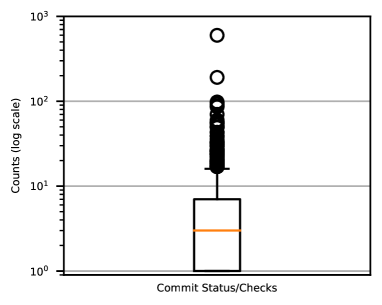
Looking at the rollup state of status checks of projects using CI, we obtained an overview of CI results of our projects. In doing so, we observe that 695 (76.2%) of the 912 projects using CI have a successful state. The other 219 (23.8%) projects had an unsuccessful state (2 pending and 217 failure). Moreover, when we look at counts of status checks on the latest commit of projects, we observe that projects do not have the same approach when following CI practice: there are projects with more than 100 CI checks and also projects with only one CI check. Figure 4 depicts the frequency of the number of status checks in projects using CI (median = 3, and average = 7.35). To have an idea of why some of the projects have a high number of status checks and what is the purpose of it, we selected one project with more than 50 status checks, namely the Checkstyle project which has 60 status checks161616https://github.com/checkstyle/checkstyle/search?q=4ce315d27d387b48befd667c7ed8426a1bad6dbb&type=commits. The project runs many GitHub Apps (such as GitHub Actions App, Cirrus CI, Travis CI, Azure Pipelines, and CloudBees). Additionally, Checkstyle uses many external services to mark a commit’s status (such as Drone CI, Semaphore CI, AppVeyor, Circle CI, and Wercker). When analysing these status checks, we observed some of the motives for running them, including: checking broken links / closed issue references, code analysis to discover vulnerabilities across the codebase using CodeQL, running mutation analysis for different modules using PIT, and building the project with different versions of the JDK and OS (so-called multi-environment builds, see Beller et al. [9]). Outside the scope of our current investigation, it would be interesting to study the various checks that software projects use in more detail in future work to (1) better understand what quality aspects developers care about, and (2) why several CI services and GitHub apps are used in conjunction.
With the CI usage results at hand in Table 8, and with our results from local builds available in Section 4.1, we set out to investigate the relation between using CI and buildability. Specifically, we aim to understand whether projects that use CI in their development process are more likely to build locally without failure? Figure 5 shows the summary of CI usage based on our local build results. Using the Chi-square test (, p-value 0.01 0.05, and Cramer’s V 0.08), there is evidence that a weak, yet statistically significant correlation between CI usage and building locally exists171717The effect size interpretation for Cramer’s V is: 0 V 0.2 is weak, 0.2 V 0.6 is moderate, V 0.6 is strong.
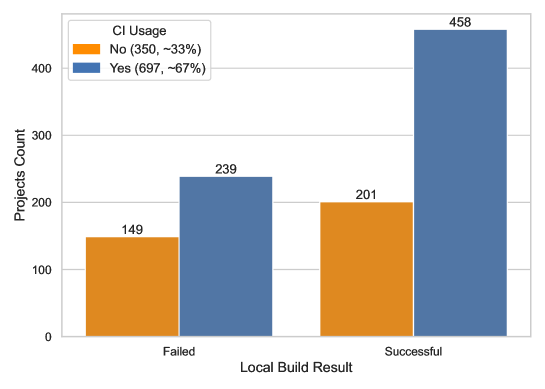
Observation 3: 63% of projects use CI with 76% of them having a successful state. There is a weak, yet statistically significant positive correlation between CI usage and building successfully locally, meaning that using CI does increase the likelihood of a successful local build.
4.3.2 CI Builds vs. Local Builds
In Section 4.1 we have reported on the local build results of projects. Now with the CI results available, we select CI-related checks from the entire collection of checks to compare them with our local builds. The goal of this comparison is to see whether having a successful/failed build on CI is correlated with a successful/failed build on a local machine. Furthermore, we will dive in to see if there is any relation between having more CI builds and a successful build on a local machine. Our reasoning here is to see if building several times on CI, which we assume to be multi-environment builds, can increase projects’ buildability on a local machine with common settings. After filtering build related CI status checks (explained in Section 3.2.3) we obtain 2846 build status checks for a total of 843 projects. It is obvious that there exists more than one CI build for some projects, thus we looked into the data to see what are the reasons: building with different versions of JDK / operating systems (e.g., multiple integration environments [9]), building different modules separately, building and running tests in different blocks, and building with/without cleaning cache. Next, we have combined CI build results for each of the projects to then compare the overall CI build result to the build results of the local machine (explained in Section 3.2.3). Overall, we observe 83.5% successful CI build results among 843 projects using CI build status checks. Next, we have compared CI build results with local build results using the Chi-square test. We have obtained values , p-value 0.014 0.05, and Cramer’s V 0.10. This indicates a weak, yet statistically significant correlation. To put things into context, in 64% of projects (from a total of 644 that we had both CI/local build results) we found the same CI and local build results (shown in Figure 6).
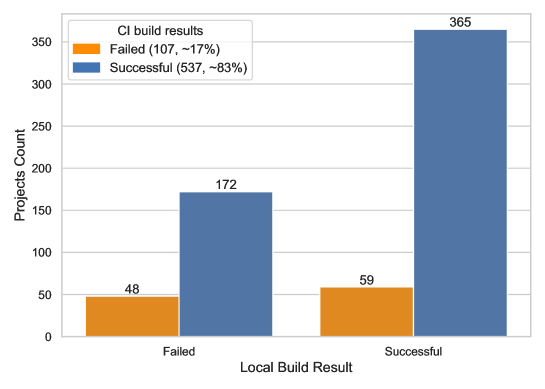
Observation 4: For 64% of projects we found matching CI build related status checks and local build outcomes. Using the Chi-square test, we observe a statistically significant weak correlation between successful local builds and CI builds.
4.4 Code Review
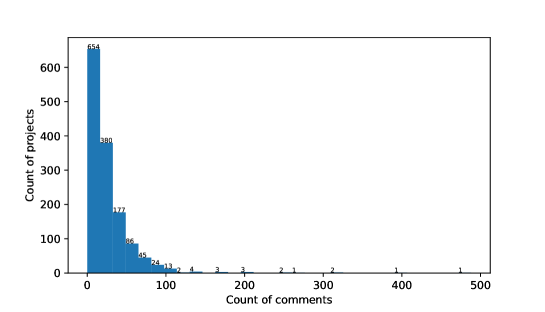
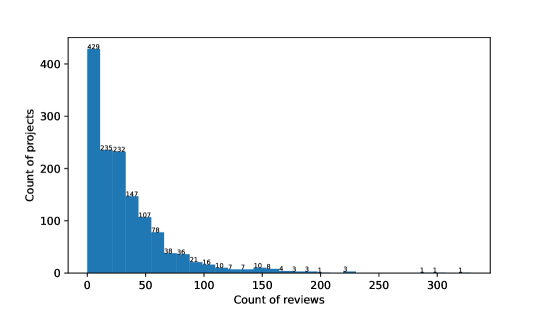
To study how code reviewing is done in our set of GitHub projects, we investigate the users’ activities that are related to code reviewing during the merging of pull requests (PRs) (also see Section 3.2.4). More specifically, we collect the count of comments, reviews, total changed lines, and total changed files for the last 20 merged PRs of 1398 projects. Another 56 projects did not meet our data collection condition of having at least 20 merged PRs while checking the last 100 PRs. To study the state of code review as a quality assurance practice, we start without making any assumptions with regard to what can be expected in terms of the intensity of code review activities. To keep our assumptions in check, we use a benchmarking approach that is taken from Alves et al. [59]. Specifically, the benchmarking enables us to categorise projects into four different groups: projects with very high, high, moderate, and low code reviewing. To determine the thresholds for the 4 categories we use the 70th, 80th, and 90th percentiles of the sum of count of reviews and comments in each of projects as the boundaries. These specific boundaries have previously been empirically established and used in the SIG quality model from Alves et al. [59] and the test code quality model of Athanasiou et al. [41]. An important prerequisite to being able to use this benchmarking approach is that the distribution of values follows a power-law distribution. In order to determine whether the distribution of count of reviews and comments indeed follows a power-law, we plot the values for our metrics for the last 20 merged PRs in the projects that we consider in Figure 7 and 8. Both metrics seemingly follow a power-law-like distribution: count of reviews and comments are mostly low, but there are a few cases with higher values. As such, we can apply Alves et al.’s calibration method to derive different categories of code reviewing intensity [59]. Considering the last 20 merged PRs, projects with less than 38 reviews fall in the low level of code reviewing, projects with review counts between 38 and 50 are classified as doing a moderate level of code reviewing, the ones with review counts between 50 and 73 are considered as projects with high levels of code reviewing, and a review count higher than 73 makes us consider the project doing a very high level of code reviewing. Similar, for comments less than 29, between 29 and 38, between 38 and 56.3, and greater than 56.3 we have low, moderate, high, and very high level of code reviewing. The mentioned thresholds corresponding to percentiles are shown in Table 9.
| Metric |
|
|
|
|
||||||||
|---|---|---|---|---|---|---|---|---|---|---|---|---|
| Reviews Count | 38 | 50 | 73 | >73 | ||||||||
| Comments Count | 29 | 38 | 56.3 | >56.3 |
Observation 5: Projects having more than 50 reviews or 38 comments in their last 20 merged pull requests are among the projects doing more intense code reviewing. Similarly, projects having less than 38 reviews or 29 comments can be considered as projects doing relatively less code reviews.
4.5 Testing
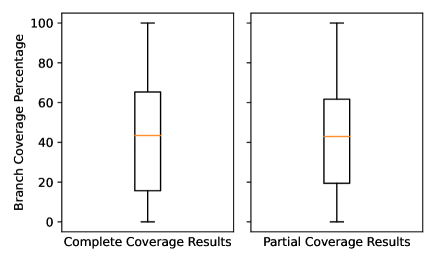
The goal of this section is to see how well projects are doing in terms of testing. In contrast to code reviewing, we have established metrics for measuring the quality of tests, namely code coverage metrics [60]. In addition, to gauge how well software projects are tested in terms of code coverage, we can rely on the existing classification scheme for unit test coverage proposed by Heitlager et al. [61]. This classification ranks projects in 5 different levels according to their unit test coverage and makes it easier to reason about testing (see Table 11). In our investigation, we rely on branch coverage as calculated by the JaCoCo tool.181818https://www.jacoco.org, last visited May 20th, 2022. As mentioned in Section 3.2.5 to see the state of testing in our projects, we selected 599 projects that (1) could be built successfully in the first step of our study and (2) had conventional paths for their source code and test code (at least in one of their subprojects / modules). Having conventional paths for source code and tests means that we could detect their path in a project. We also repeated this for all subprojects / modules inside a project before applying JaCoCo. If source code and tests paths were detected, then we would apply JaCoCo plugin and build them to generate coverage results. The strict interpretation of the necessity to have conventional paths for the tests does imply that there might be projects that do have high quality tests, but that are not part of our analysis. For the 599 projects that we applied JaCoCo to, we obtain JaCoCo test coverage results for 310 of them (51.75%). From these 310 projects, we observe complete coverage results for 172 (28.7%) projects, i.e., we did manage to get coverage results for all of their modules. For another 138 (23%) projects, we could only collect partial coverage results, i.e., we have coverage results for some of the modules. We did not manage to obtain coverage results for the remaining 289 (48.3%) projects. An overview of the aforementioned process can be witnessed in the bottom part of Figure 9. Projects with no coverage results. To investigate the reasons of 289 projects having no JaCoCo output, we randomly selected 50 of them and manually checked their log files. These projects had at least one module with code and tests detected, but we could not see any coverage results after applying the JaCoCo plugin. The most common reasons for this were: (1) JaCoCo failing or skipping its execution due to some (mis)configuration in the project’s build setting, or conflicting with other settings of project, and (2) build failure. See Table 10 for a global overview of reasons. Moreover, for 12 projects the build logs were very sparse, and we could thus not establish the reason of having no coverage result. Projects with partial coverage results. For 138 projects we have obtained partial coverage results: 113 of them had at least one module with no test. In terms of why not all modules have JaCoCo output, we observe similar reasons as to our prior case of projects without any coverage result. If we compare the coverage levels of projects with partial and complete coverage results in Figure 10, we observe a similar distribution. We also observe that from the total of 599 projects 389 (65%) have at least one module with no tests (this is minus the projects without any tests since we removed them in the beginning). Table 11 provides an overview of how well projects are tested. Relying on the classification scheme from Heitlager et al. [61], we observe that 2.9% of projects fall in the category “very high” coverage, while a majority of projects are placed in the category “low”. In fact, combing the categories “low” and “very low”, we see that 68.4% of projects fall into these two categories, giving an indication that not all projects are maximising their testing.
| Reason | # | % |
|---|---|---|
| JaCoCo skipped/failed | 17 | 34% |
| Build failure | 16 | 32% |
| Parsing error | 3 | 6% |
| Test failure | 2 | 4% |
| Rank | Code Coverage | # of Projects | % of Projects |
|---|---|---|---|
| Very High (++) | 95-100% | 9 | 2.9% |
| High (+) | 80-95% | 31 | 10% |
| Moderate (o) | 60-80% | 58 | 18.7% |
| Low () | 20-60% | 129 | 41.6% |
| Very Low () | 0-20% | 83 | 26.8% |
Observation 6: 68.4% of projects among the ones we could calculate code coverage for, are doing very low or low testing. Also, only 13% of them are doing very high or high testing. Moreover, 65% of projects doing testing, do not do it for all modules of their project.
4.6 Quality Assurance Practices Put Together
In this section we set out to answer RQ1.2: Which quality assurance approaches are being used in conjunction? In order to answer this question, we use statistical tests to determine which quality assurance approaches that we previously discussed in isolation in Sections 4.1 through 4.5 are used in conjunction in open source projects. More specifically, we conduct a statistical analysis to calculate the correlation between each of the practices using the results from previous sections: code coverage of 310 projects, code reviewing information of 1398 projects, ASAT usage and CI usage of all 1454 projects. This analysis does raise the issue of data imbalance, as we have less projects for which we have code coverage data (310) than we have projects for which we have code reviewing information (1398). To address this issue, we have performed the statistical test on projects that are in the intersection for two quality assurance practices, i.e., those projects for which we have data of both. The correlation analysis enables us to better understand whether projects that use a quality assurance practice (intensively), are also more inclined to employ another quality assurance approach (intensively). Of importance to note here is that for two quality assurance practices, namely ASAT usage and CI usage, our data is categorical, i.e., a project is or is not using them. The other two practices, namely Testing and Code Reviews, are presented as continuous variables based on respectively the level of code coverage reached and the counts of comments/reviews that we observe. However, while for software testing we can make use of an established code coverage metric (branch coverage), for code reviewing we had to define a new metric to express the intensity of the code reviewing process (Equation 1 explained in Section 3.2.4). In terms of the statistical tests, we use Cramer’s V to measure correlation among categorical variables. Before applying Cramer’s test, we first tested the independence of the variables using the Chi-square test. For the continuous variables vs. continuous variables and vs. categorical variables, we use respectively the Pearson and the Point Biserial correlation coefficient. The results of the correlation analysis are shown in Table 12.
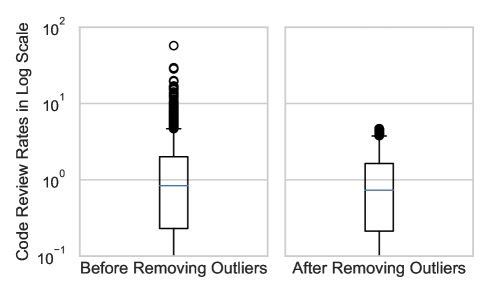
Table 12 shows the results of the statistical tests. The results that are statistically significant are highlighted in light-grey. For our code review metric, since there were quite a lot of outliers (Figure 11 shows the distribution of code review metric values before and after removing outliers), we used the IQR method to identify and then remove outliers [62], which resulted in removing 106 projects (from a total of 1398 projects with code review rates). Therefore, there are two values for code review correlation analysis. Moreover, the same method was then used to remove the outliers of the code review metric in Figure 12. In contrast, the range of values for testing are fixed (0 to 100), and they are binary for ASAT/CI usage, so no outlier exists for other variables.
|
|
Testing |
|
|||||||||||
|---|---|---|---|---|---|---|---|---|---|---|---|---|---|---|
| Testing |
|
|
||||||||||||
|
|
|
|
|||||||||||
|
|
|
|
|
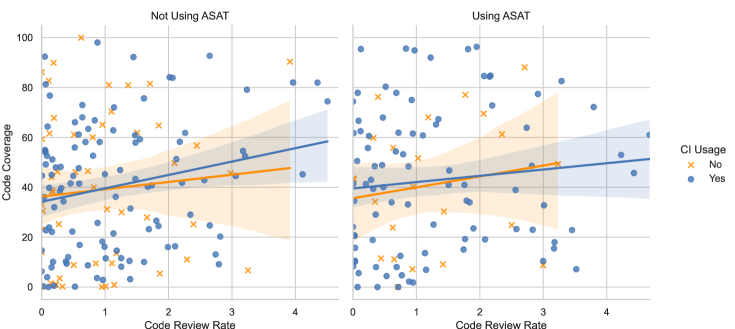
Code reviewing and testing show a positive correlation with small effect size 212121For interpreting the strength of Pearson’s correlation, we use 0 r 0.3 for small, 0.3 r 0.5 for medium, and 0.5 r 1.0 for large effect size. (also when we remove outliers from code review rate). To better understand the small effect size, consider Figure 12. For both the projects that use ASATs and that do not use ASATs, we observe a concentration of projects that have a code review rate between 0 and 0.5 (the X-axis). Yet, that group of projects in that specific (relatively low) code review rate range show a widely dispersed code coverage level, going from 0% all the way to 100% branch coverage. This wide dispersal on the testing axis and clustering on the code reviewing axis (Y-axis) explains the small effect size. It also gives us the insight that projects that heavily invest in high levels of code coverage do not necessarily invest as strongly in code reviewing. Code reviewing and CI usage. We observe a small positive correlation between code reviewing (without outliers) and CI usage . When we look at Figure 12, we need to consider both the left and right graphs and look at the X-axis for the code review rate and the spread of blue dots and orange crosses, signalling respectively the use and non-use of CI. For both the left and right graphs, we see an overall scattering of projects that use CI over the entire range of the code review rate. For the more dense code review rate interval [0,1.5], we visually observe a mix of projects that use or do not use CI. This scattering helps explain the small correlation that we obtained. Code reviewing and ASAT usage. We observe a small positive correlation between code reviewing (without outliers) and ASAT usage . When we look at Figure 12, we need to consider both the left (projects not using any ASATs) and right graphs (projects using ASATs) and look at the X-axis for the code review rate. We see an overall scattering of projects in the entire range of the code review rate. However, the density of projects with a code review rate between 0 and 2 is relatively higher in the left graph, On the other hand, we see more projects having a code review rate higher than 3 in the right graph. This density of projects in different ranges explains the small correlation that we have observed. CI usage and ASAT usage exhibit a weak, yet significant correlation 222222The effect size interpretation for Cramer’s V is: 0 V 0.2 is weak, 0.2 V 0.6 is moderate, V 0.6 is strong. When we turn our attention to Figure 12, we need to compare the distribution of blue and orange (respectively CI usage and no CI usage) dots/crosses in the left (not using an ASAT) and right (using an ASAT) graphs. Both left and right, we observe a multitude of projects that do and that do not use CI, with visually more orange crosses (for non CI usage) in the left most graph, signalling that no ASAT usage is more common amongst projects that do not use CI. To also see this numerically we divide the count of dots in the right graph by the total number of projects using an ASAT, and also divide the count of dots in the left graph by the total number of projects not using an ASAT. The results are respectively 0.79 and 0.67, confirming our earlier intuition that we have a higher percentage of projects that use CI among projects using ASATs, compared to projects not using any ASAT.
Summarising the other relations from Table 12, we observe no other statistically significant correlations between the other quality assurance practices.
Observation 7: Having high code coverage weakly correlates with doing more code reviewing in projects. We also observe weak correlations between (1) the usage of ASATs and CI usage, (2) the code review rate and CI usage, and (3) the code review rate and ASAT usage.
5 Discussion
5.1 Revisiting the Research Questions
In this section, we revisit the research questions from Section 1. In order to answer the over-arching research question
RQ1 What is current state-of-the-practice in quality assurance in open source software development?
We first concentrate on providing a global overview of some of the most popular quality assurance practices in use, thereby answering RQ1.1
RQ1.1 What is the prevalence of quality assurance approaches like software testing, modern code review, automated static analysis, and buildability?
- Testing.
-
From the original set of 1454 GitHub projects, we have been able to establish code coverage for 310 projects (21.3%). Our results show that the median of their branch coverage is 43%. Moreover, using Heitlager’s classification scheme [61] of test coverage for projects, we establish that 68% of them do very low, or low levels of testing. On the other hand, 13% of projects reach high, or very high levels of code coverage. The reason why we could only establish code coverage for 21.3% of the projects in our original dataset can be seen in Figure 9 and can be summarized as a race of attrition because of projects’ inherent attributes that make them ineligible for our study (28%), issues of buildability (26.7%), non-presence of tests and/or source code (4.1%), and our inability to successfully establish code coverage results (19.8%).
- Code Review.
-
For 1398 projects in our dataset we looked at the count of comments, and the count of reviews in their last 20 merged PRs. We have created a code review intensity metric, that expresses the amount of code reviewing normalised by lines of code changed in the PR. Subsequently, using Alves et al.’s calibration method [59] we derived different categories of code reviewing intensity. We observe that projects having more than 50 reviews or 38 comments over their last 20 merged pull requests are among the projects doing more intense code reviewing. In contrast, projects having less than 38 reviews or 29 comments can be considered as projects doing relatively less code reviewing.
- ASAT Usage.
-
To study the usage of ASATs in GitHub projects, we make the assumption that the presence of an ASAT configuration file is an indication of actual ASAT usage. Under this assumption, we have observed that 38% of the projects under observation use at least one ASAT. However, the presence of a configuration file does not causally imply the actual usage of these ASATs.
- Local Buildability.
-
We set out to investigate whether the GitHub projects under study can be built locally out of the box. Our results indicate that 63% of projects build successfully locally.
- Continuous Integration.
-
We have used a new approach of studying usage of CI on GitHub, namely using GitHub’s checks and statuses. This approach enables us to have a wide range of CI platforms in our study compared to previous studies that mainly focused on a single CI provider, e.g., [9]. We find evidence that 63% of overall 1454 projects use CI with 76% of them having a successful state. This also indicates that for 24% of the projects, the final commit that is part of our study led to a failing CI build. Moreover, we observe different strategies in making use of GitHub features (GitHub Actions, and Statuses) to implement CI status checks among projects (e.g., having a few vs. many CI status checks with many different CI platforms or services). In future work, we intend to study the reasons for using multiple CI status checks and platforms.
Now that we have an understanding of how these quality assurance practices are used in isolation, we turn our attention to:
RQ1.2 Which quality assurance approaches are being used in conjunction?
Code Review and Testing. We found statistically significant evidence that higher levels of branch coverage correlate with higher levels of the code review intensity metric with small effect size. This indicates that projects that show a higher level of branch coverage tend to have more code reviewing performed. Code Review and ASAT/CI usage. Using our defined categories of code reviewing intensity, if we look at projects with a very high level of code reviewing, e.g., more than 73 reviews or 56 comments in their last 20 merged PRs (239 projects), for 49% of them we find evidence of ASAT usage, and for 65% we see evidence of CI usage. On the other hand if we look at projects with a low level of code reviewing, e.g., less than 38 reviews and less than 29 reviews in their last 20 merged PRs (781 projects), for 32% of them we find evidence of ASAT usage, while for 61% we see evidence of CI usage. This observation shows that projects with a higher code review intensity tend to use ASAT and CI more when comparing to the ones with lower code review intensity. We also saw statistically significant correlation between our code reviewing intensity metric and ASAT/CI usage when outliers are removed, which strengthens this observation. ASAT usage and CI Usage. Finding evidence of ASAT usage in projects does not imply that these ASATs are actually used and integrated in the CI workflow. However, we did observe a statistically significant, yet weak correlation between their usage, which potentially indicate that projects use both at the same time.
1. 2. 3. 4. 5.
5.2
Difficulty of creating an environment for local build success. We could not build of projects out of the box. Compilation, dependency, and configuration errors are the top three reasons of the build failures. Also, other studies have reported that building Java projects is not always straightforward. Hasan et al. could not build 46% of the projects in their study [25]. Sulir et al. have respectively observed a 38% and 59% build failure percentage in their local build results dataset in their 2017 and 2020 studies [52, 63]. This number of build failures shows that it is non-trivial to create an easy-to-build environment for Java projects. This has far-reaching consequences for both practitioners and researchers. For practitioners, this means that developers that want to contribute to an open source project might find it difficult to build the project on their development machine. On the other hand, researchers might be hindered to conduct their studies on a large variety of projects, or on multiple versions of a project. Several studies have investigated the causes of build failures [11, 29], while other studies have tried to devise approaches to tackle the underlying issues [64, 65, 29, 66]. In an ideal world, creating an environment (e.g., a docker container) for building a large number of projects would benefit researchers to conduct studies that need to build projects as a prerequisite (e.g., dynamic analysis, measuring code coverage, etc.). Interestingly, our results indicate that if project maintainers want more confidence about their projects’ buildability on local machines, they should consider doing continuous integration, because CI increases the likelihood of a successful local build (Cramer’s V 0.08). And also consider having a successful CI build for the latest release of the project. Because, CI builds match with local build outcomes in 64% of projects, and there is a statistically significant correlation between them (Cramer’s V 0.10). Measuring code coverage. Measuring code coverage of many projects automatically is a challenge for researchers. One prerequisite of measuring code coverage of a Java project is building it, and we already discussed that creating an environment for building a large number of projects successfully is a challenge. The next step in the measurement of code coverage is to use a code coverage measurement tool. Our observations are that, first, most projects do not have their code coverage details available in their repository. So, in most cases researchers need to measure projects’ code coverage themselves. Second, automatically generating code coverage information for a large number of projects is a cumbersome task. This is because of the difficulty of integrating a code coverage tool like JaCoCo to generate code coverage results, and also successfully building the project with running all tests. Particularly, this is why we were unable to collect coverage measurements for 48% of projects when trying to measure their code coverage. Third, many projects have several modules (subprojects), and they do not have unit tests for all of them. This issue makes it difficult to have an idea of overall code coverage since some parts of the software project miss tests. This third issue in particular, is also an issue for practitioners, as it leaves them blind with regard to the level of test coverage of specific submodules. Measuring the quality of code review. In this paper we suggested a code review metric to have an idea of the intensity of reviews taking place during pull requests’ discussions. Then we looked at the correlation between testing, ASAT usage, and CI usage with code review intensity. However, the intensity of code review is different from the quality of the code review. Despite the fact that code review quality has been studied in many studies, there is no obvious way to quantitatively measure it [33, 66, 67]. Having a measurement of the quality of the code review would help researchers when comparing projects’ code review and when studying its correlation with other quality assurance practices. Also, with a code quality measurement practitioners have a concrete idea of the state of the quality of the code reviews taking place in their project, and it enables them to improve their code review practices. ASATs actual usage As we pointed out before (see Section ASAT Usage.), the presence of a configuration file does not causally imply the actual usage of these ASATs. Vassallo et al. found that developers use ASATs in different contexts: local programming, code review, and CI [68]. So, to have a notion of ASATs actual usage we need to look at them in all three different contexts, which is a challenge for researchers, keeping in mind that different projects use different CI platforms. We have looked at how other studies approach the study of actual usage of ASATs: Beller et al. investigated the use of ASATs in 122 projects by manual analysis of configuration files and then surveying the contributors of those projects, asking about the actual usage of ASATs [7]. In another work Zampetti et al. studied the actual use of ASCATs (Automated Static Code Analysis Tools) in the CI environment [69]. In their study, they analyzed Travis CI builds and jobs of 20 projects. For researchers, observing and understanding the actual usage of ASATs at scale remains a challenge. A key challenge is that ASATs can be used in multiple contexts (per the observation of Vassallo et al. [68]), thus requiring multiple observation points. Another challenge is that in order to obtain meaningful insights, the dataset would need to be sufficiently large, implying that we need an automated observation tool to perform a longitudinal analysis on multiple projects. GitHub Actions best practices To study the use of CI, we put our focus on the status checks of a project’s latest commit. We found that projects have different approach when configuring their CI using GitHub features: GitHub Actions (checks run using GitHub’s apps) & Commit Statuses (statuses marked by external services). There are projects with more than 100 status checks, and many others with only 1 check / status. Also, in some cases, many GitHub apps are used in parallel to run checks. Here we highlight the challenge for practitioners: configuring their CI using checks (GHA) and statuses. Including choosing the right (combination of) GitHub app(s) for these checks. Kinsman et al. have shown that developers have a positive perception of GHA [50], and in a related work about CI services on GitHub, Golzadeh et al. found that GHA has become the dominant CI service 18 months after its introduction [70], which strengthens the need to address the mentioned challenges by offering best practices to use GHA. In another work, Chen et al. took a different path to study the usage of GHA focusing on the projects’ GHA YAML file (under the workflow path of projects adopting GHA). They similarly found a median of 3 for steps (median of 3 for status checks in our study) used in jobs (with average of 4.7 vs. average of 7.35 status checks in our study), and highlighted the challenge for less experienced developers to configure a GHA workflow when facing with workflows, jobs, and steps with many alternatives.
5.3 The Bigger Context of Quality Assurance Practices
In Section 5.1 we have revisited research questions RQ1.1, RQ1.2 and and gave concrete answer to them. However, we have not answered the over-arching RQ1 yet. In order to do so, we need to look at the bigger context.
RQ1 What is current state-of-the-practice in quality assurance in open source software development?
First of all, we have observed a very diverse level of adoption, or intensity of adoption, of the individual quality assurance practices among our set of 1454 open source software projects on GitHub. We have observed projects that do not invest in any of the practices, but we have also seen projects investing in all, or at least most practices with relatively high intensity. Also, when we look at mature projects we see that they generally tend to invest more in their quality assurance practices. When it comes to using quality assurance practices in conjunction, we have observed weak correlation among some quality assurance practices in projects. But generally speaking, projects do not follow all quality assurance practices together with high intensity. This raises interesting questions for follow-up research that is more qualitative in nature, because some of the studied quality assurance practices are said to be complementary, using them in conjunction would strengthen the overall quality perspective, and might also reduce quality assurance efforts (e.g., an ASAT might pick up code review comments, which would ease the burden of the reviewer [18]).
5.6 Threats to Validity
External validity. We have used the GHS dataset [51] to select 1454 projects from GitHub that are written in the Java programming language, had a sufficiently large number of pull requests (200), minimally 10 contributors, and are popular (100 stars). For some of our investigations, we could not use the entire dataset (e.g., because there was no test code, or we could not measure test coverage). While we have taken great care not to introduce any bias in the projects that we study, the filtering conditions that we use might impact the external validity of our results. We urge the research community to replicate our studies, e.g., with more software projects, also in the context of different programming languages. Another threat is that we only consider 3 different ASATs. While these are the more popular ASATs for the Java programming language [7], we cannot claim that our findings generalize to other ASATs or ASATs in other programming languages. While we have looked at multiple CI platforms, and went beyond the TravisTorrent dataset in terms of scope [27], we have only considered CI tools that are configured in GitHub. We cannot generalize our findings to CI systems that are used outside of GitHub. Construct validity. In Section 4.5 we study test quality through the branch test coverage metric. While test coverage metrics provide a good image of which parts of a code base are not covered by tests, it does not provide insight into how good the tests actually are at detecting faults. Running a full mutation analysis would give us more insight here, but is also a computationally very costly operation. In Section 3.2.4 we create a code review intensity metric, that normalises the number of code review comments per line of code. While we have validated this metric, we do work under the assumption that more code review comments per line of code are better, but we should also take into consideration that a team of experienced contributors might produce higher quality code in the first place, thus requiring less suggestions on how to improve. Future research should look into the relationship between developer experience and code review intensity.
6 Conclusion
In this study, we set out to understand the state-of-the-practice in quality assurance in open source software development. In particular, we have focused on software testing, modern code review, automated static analysis, and build automation. We acknowledge that each of these practices have been studied in-depth in isolation, and as such, the major contribution of this study is that we shed light on how the quality assurance practices are used in conjunction. We have collected quality assurance related information from 1,454 open source Java projects from GitHub. This information includes their local buildability outcomes, code coverage results, discussion & review details at the pull request level, usage of automated static analysis tools, and continuous integration related status checks. In our main research question RQ1 (What is current state-of-the-practice in quality assurance in open source software development?) we first looked into each of the quality assurance practices in isolation, observing a wide variety of their intensity of usage. Moving the goalpost to understand how these quality assurance practices are used together, we observe weak correlation in our set of projects when it comes to (1) code coverage and code review intensity, (2) usage of ASATs and usage of CI, (3) code review intensity and CI usage, and (4) code review intensity and ASAT usage.
Acknowledgements
This research was partially funded by the Dutch science foundation NWO through the Vici “TestShift” grant (No. VI.C.182.032).
References
- [1] J. Patel, Software is still eating the world, https://techcrunch.com/2016/06/07/software-is-eating-the-world-5-years-later/?guccounter=1&guce_referrer=aHR0cHM6Ly93d3cuZ29vZ2xlLmNvbS8&guce_referrer_sig=AQAAADIqx8LBuU1uKI03errh0RlYZjGsX_ZK76KVXqy3KqGkv3xyyXVrxi-46rFMEmZaBV4Na7Cm2lYLUC_QcKfhx0-njTwVR8XKsjkrDvNC9CoaHj4L9SLucX6hkJUcxl-rhBjsxcATrgy0yFSpYqhGgq9yKJY5F8mVs9sSV-AADaO-, last visited May 20th, 2022 (2016).
- [2] M. Jazayeri, The education of a software engineer, in: Proc. International Conference on Automated Software Engineering (ASE), IEEE, USA, 2004.
- [3] A. J. Ko, B. Dosono, N. Duriseti, Thirty years of software problems in the news, in: Proceedings of the 7th International Workshop on Cooperative and Human Aspects of Software Engineering (CHASE), ACM, 2014, pp. 32–39.
- [4] M. Aniche, Effective Software Testing: A Developer’s Guide, Manning Publications, 2022.
- [5] Y. Kamei, E. Shihab, B. Adams, A. E. Hassan, A. Mockus, A. Sinha, N. Ubayashi, A large-scale empirical study of just-in-time quality assurance, IEEE Trans. Software Eng. 39 (6) (2013) 757–773.
- [6] A. Bacchelli, C. Bird, Expectations, outcomes, and challenges of modern code review, in: 35th International Conference on Software Engineering (ICSE), IEEE, 2013, pp. 712–721.
- [7] M. Beller, R. Bholanath, S. McIntosh, A. Zaidman, Analyzing the state of static analysis: A large-scale evaluation in open source software, in: IEEE 23rd International Conference on Software Analysis, Evolution, and Reengineering (SANER), IEEE, 2016, pp. 470–481.
- [8] C. Vassallo, S. Panichella, F. Palomba, S. Proksch, H. C. Gall, A. Zaidman, How developers engage with static analysis tools in different contexts, Empir. Softw. Eng. 25 (2) (2020) 1419–1457.
- [9] M. Beller, G. Gousios, A. Zaidman, Oops, my tests broke the build: an explorative analysis of Travis CI with GitHub, in: Proceedings of the International Conference on Mining Software Repositories (MSR), IEEE, 2017, pp. 356–367.
- [10] A. Rahman, A. Partho, D. Meder, L. Williams, Which factors influence practitioners’ usage of build automation tools?, in: International Workshop on Rapid Continuous Software Engineering (RCoSE), 2017, pp. 20–26.
- [11] T. Rausch, W. Hummer, P. Leitner, S. Schulte, An empirical analysis of build failures in the continuous integration workflows of java-based open-source software, in: Proceedings International Conference on Mining Software Repositories (MSR), IEEE, 2017, pp. 345–355.
- [12] M. Beller, A. Bacchelli, A. Zaidman, E. Jürgens, Modern code reviews in open-source projects: which problems do they fix?, in: 11th Working Conference on Mining Software Repositories (MSR), ACM, 2014, pp. 202–211.
- [13] P. C. Rigby, D. M. Germán, M. D. Storey, Open source software peer review practices: a case study of the apache server, in: International Conference on Software Engineering (ICSE), ACM, 2008, pp. 541–550.
- [14] M. Hilton, T. Tunnell, K. Huang, D. Marinov, D. Dig, Usage, costs, and benefits of continuous integration in open-source projects, in: Proceedings of the 31st IEEE/ACM International Conference on Automated Software Engineering (ASE), ACM, 2016, pp. 426–437.
- [15] N. Cassee, B. Vasilescu, A. Serebrenik, The silent helper: The impact of continuous integration on code reviews, in: Int’l Conference on Software Analysis, Evolution and Reengineering (SANER), IEEE, 2020, pp. 423–434.
- [16] Y. Zhao, A. Serebrenik, Y. Zhou, V. Filkov, B. Vasilescu, The impact of continuous integration on other software development practices: a large-scale empirical study, in: Proceedings of the International Conference on Automated Software Engineering (ASE), IEEE, 2017, pp. 60–71.
- [17] F. Zampetti, G. Bavota, G. Canfora, M. D. Penta, A study on the interplay between pull request review and continuous integration builds, in: 26th IEEE International Conference on Software Analysis, Evolution and Reengineering (SANER), IEEE, 2019, pp. 38–48.
- [18] S. Panichella, V. Arnaoudova, M. D. Penta, G. Antoniol, Would static analysis tools help developers with code reviews?, in: 22nd IEEE International Conference on Software Analysis, Evolution, and Reengineering (SANER), IEEE, 2015, pp. 161–170.
- [19] G. S. Nery, D. A. da Costa, U. Kulesza, An empirical study of the relationship between continuous integration and test code evolution, in: 2019 IEEE International Conference on Software Maintenance and Evolution (ICSME), IEEE, 2019, pp. 426–436.
- [20] M. V. Mäntylä, C. Lassenius, What types of defects are really discovered in code reviews?, IEEE Transactions on Software Engineering 35 (3) (2009) 430–448.
- [21] H. Borges, M. Tulio Valente, What’s in a GitHub star? understanding repository starring practices in a social coding platform, Journal of Systems and Software 146 (2018) 112–129.
-
[22]
A. Khatami, A. Zaidman,
”State-Of-The-Practice in
Quality Assurance in Java-Based Open Source Software Development” Replication
Package (Dec. 2022).
doi:10.5281/zenodo.7404903.
URL https://doi.org/10.5281/zenodo.7404903 - [23] M. Tufano, F. Palomba, G. Bavota, M. D. Penta, R. Oliveto, A. D. Lucia, D. Poshyvanyk, There and back again: Can you compile that snapshot?, J. Softw. Evol. Process. 29 (4) (2017).
- [24] M. Maes-Bermejo, M. Gallego, F. Gortázar, G. Robles, J. M. González-Barahona, Revisiting the building of past snapshots - a replication and reproduction study, Empir. Softw. Eng. 27 (3) (2022) 65. doi:10.1007/s10664-022-10117-6.
- [25] F. Hassan, S. Mostafa, E. S. L. Lam, X. Wang, Automatic building of java projects in software repositories: A study on feasibility and challenges, in: 2017 ACM/IEEE International Symposium on Empirical Software Engineering and Measurement (ESEM), IEEE, 2017, pp. 38–47.
- [26] F. Hassan, X. Wang, Change-aware build prediction model for stall avoidance in continuous integration, in: International Symposium on Empirical Software Engineering and Measurement (ESEM), IEEE, 2017, pp. 157–162.
- [27] M. Beller, G. Gousios, A. Zaidman, Travistorrent: synthesizing Travis CI and GitHub for full-stack research on continuous integration, in: Proceedings of the 14th International Conference on Mining Software Repositories (MSR), IEEE, 2017, pp. 447–450.
- [28] X. Jin, F. Servant, A cost-efficient approach to building in continuous integration, in: Proc. International Conference on Software Engineering (ICSE), ACM, 2020, pp. 13–25.
- [29] Y. Lou, Z. Chen, Y. Cao, D. Hao, L. Zhang, Understanding build issue resolution in practice: symptoms and fix patterns, in: Joint European Software Engineering Conference and Symposium on the Foundations of Software Engineering (ESEC/FSE), ACM, 2020, pp. 617–628.
- [30] S. McIntosh, Y. Kamei, B. Adams, A. E. Hassan, The impact of code review coverage and code review participation on software quality: a case study of the qt, vtk, and ITK projects, in: Proceedings of the 11th Working Conference on Mining Software Repositories (MSR), ACM, 2014, pp. 192–201.
- [31] M. M. Rahman, C. K. Roy, Impact of continuous integration on code reviews, in: Proc. International Conference on Mining Software Repositories (MSR), IEEE, 2017, pp. 499–502.
- [32] M. E. Fagan, Design and code inspections to reduce errors in program development, IBM Syst. J. 15 (3) (1976) 182–211.
- [33] O. Kononenko, O. Baysal, M. W. Godfrey, Code review quality: how developers see it, in: Proceedings of the International Conference on Software Engineering (ICSE), ACM, 2016, pp. 1028–1038.
- [34] R. Gopinath, C. Jensen, A. Groce, Code coverage for suite evaluation by developers, in: 36th International Conference on Software Engineering (ICSE), ACM, 2014, pp. 72–82. doi:10.1145/2568225.2568278.
- [35] M. Hilton, J. Bell, D. Marinov, A large-scale study of test coverage evolution, in: Proceedings of the 33rd ACM/IEEE International Conference on Automated Software Engineering (ASE), ACM, 2018, pp. 53–63.
- [36] S. G. Elbaum, D. Gable, G. Rothermel, The impact of software evolution on code coverage information, in: International Conference on Software Maintenance (ICSM), IEEE, 2001, pp. 170–179.
- [37] A. Zaidman, B. Van Rompaey, A. van Deursen, S. Demeyer, Studying the co-evolution of production and test code in open source and industrial developer test processes through repository mining, Empir. Softw. Eng. 16 (3) (2011) 325–364.
- [38] G. Gousios, A. Zaidman, M. D. Storey, A. van Deursen, Work practices and challenges in pull-based development: The integrator’s perspective, in: 37th IEEE/ACM International Conference on Software Engineering (ICSE), IEEE, 2015, pp. 358–368.
- [39] M. Beller, G. Gousios, A. Panichella, S. Proksch, S. Amann, A. Zaidman, Developer testing in the IDE: patterns, beliefs, and behavior, IEEE Trans. Software Eng. 45 (3) (2019) 261–284.
- [40] P. S. Kochhar, D. Lo, J. Lawall, N. Nagappan, Code coverage and postrelease defects: A large-scale study on open source projects, IEEE Trans. Reliab. 66 (4) (2017) 1213–1228. doi:10.1109/TR.2017.2727062.
- [41] D. Athanasiou, A. Nugroho, J. Visser, A. Zaidman, Test code quality and its relation to issue handling performance, IEEE Trans. Software Eng. 40 (11) (2014) 1100–1125.
- [42] B. Vasilescu, Y. Yu, H. Wang, P. T. Devanbu, V. Filkov, Quality and productivity outcomes relating to continuous integration in GitHub, in: Proceedings of the 2015 10th Joint Meeting on Foundations of Software Engineering (ESEC/FSE), ACM, 2015, pp. 805–816.
- [43] Sonarqube, https://www.sonarqube.org, last visited May 20th, 2022.
- [44] C. Vassallo, F. Palomba, A. Bacchelli, H. C. Gall, Continuous code quality: are we (really) doing that?, in: Proceedings of the International Conference on Automated Software Engineering (ASE), ACM, 2018, pp. 790–795.
- [45] M. Hilton, N. Nelson, T. Tunnell, D. Marinov, D. Dig, Trade-offs in continuous integration: assurance, security, and flexibility, in: Proceedings of the 2017 11th Joint Meeting on Foundations of Software Engineering (ESEC/FSE), ACM, 2017, pp. 197–207. doi:10.1145/3106237.3106270.
- [46] A. Gautam, S. Vishwasrao, F. Servant, An empirical study of activity, popularity, size, testing, and stability in continuous integration, in: Proceedings of the 14th International Conference on Mining Software Repositories (MSR), IEEE Computer Society, 2017, pp. 495–498. doi:10.1109/MSR.2017.38.
- [47] G. Gousios, M. Pinzger, A. van Deursen, An exploratory study of the pull-based software development model, in: 36th International Conference on Software Engineering (ICSE), ACM, 2014, pp. 345–355.
- [48] G. Gousios, A. Zaidman, A dataset for pull-based development research, in: Working Conf. on Mining Software Repositories (MSR), ACM, 2014, pp. 368–371.
- [49] X. Zhang, A. Rastogi, Y. Yu, On the shoulders of giants: A new dataset for pull-based development research, in: MSR ’20: 17th International Conference on Mining Software Repositories, ACM, 2020, pp. 543–547.
- [50] T. Kinsman, M. S. Wessel, M. A. Gerosa, C. Treude, How do software developers use GitHub actions to automate their workflows?, in: International Conference on Mining Software Repositories (MSR), IEEE, 2021, pp. 420–431.
- [51] O. Dabic, E. Aghajani, G. Bavota, Sampling projects in GitHub for MSR studies, in: International Conference on Mining Software Repositories (MSR), IEEE, 2021, pp. 560–564.
- [52] M. Sulír, J. Porubän, A quantitative study of java software buildability, CoRR abs/1712.01024 (2017). arXiv:1712.01024.
- [53] K. Gallaba, M. Lamothe, S. McIntosh, Lessons from eight years of operational data from a continuous integration service (2022).
- [54] M. Wessel, A. Serebrenik, I. Wiese, I. Steinmacher, M. A. Gerosa, Quality gatekeepers: Investigating the effects of code review bots on pull request activities, Empirical Software Engineering To Appear.
- [55] E. Kalliamvakou, G. Gousios, K. Blincoe, L. Singer, D. M. Germán, D. E. Damian, The promises and perils of mining github, in: P. T. Devanbu, S. Kim, M. Pinzger (Eds.), 11th Working Conference on Mining Software Repositories (MSR), ACM, 2014, pp. 92–101. doi:10.1145/2597073.2597074.
- [56] F. Horváth, T. Gergely, Á. Beszédes, D. Tengeri, G. Balogh, T. Gyimóthy, Code coverage differences of java bytecode and source code instrumentation tools, Softw. Qual. J. 27 (1) (2019) 79–123. doi:10.1007/s11219-017-9389-z.
- [57] S. McIntosh, M. Nagappan, B. Adams, A. Mockus, A. E. Hassan, A large-scale empirical study of the relationship between build technology and build maintenance, Empir. Softw. Eng. 20 (6) (2015) 1587–1633.
- [58] P. Thongtanunam, S. McIntosh, A. E. Hassan, H. Iida, Review participation in modern code review: An empirical study of the android, qt, and openstack projects (journal-first abstract), in: 25th International Conference on Software Analysis, Evolution and Reengineering (SANER), IEEE Computer Society, 2018, p. 475. doi:10.1109/SANER.2018.8330241.
- [59] T. L. Alves, C. Ypma, J. Visser, Deriving metric thresholds from benchmark data, in: 26th IEEE International Conference on Software Maintenance (ICSM), IEEE, 2010, pp. 1–10.
- [60] H. Zhu, P. A. V. Hall, J. H. May, Software unit test coverage and adequacy, ACM Computing Surveys 29 (4) (1997).
- [61] I. Heitlager, T. Kuipers, J. Visser, A practical model for measuring maintainability, in: Quality of Information and Communications Technology, 6th International Conference on the Quality of Information and Communications Technology (QUATIC), IEEE Computer Society, 2007, pp. 30–39. doi:10.1109/QUATIC.2007.8.
- [62] F. M. Dekking, C. Kraaikamp, H. P. Lopuhaä, L. E. Meester, A Modern Introduction to Probability and Statistics: Understanding why and how, Vol. 488, Springer, 2005.
- [63] M. Sulír, M. Bacíková, M. Madeja, S. Chodarev, J. Juhár, Large-scale dataset of local java software build results, Data 5 (3) (2020) 86. doi:10.3390/data5030086.
- [64] F. Hassan, Tackling build failures in continuous integration, in: 34th IEEE/ACM International Conference on Automated Software Engineering (ASE), IEEE, 2019, pp. 1242–1245. doi:10.1109/ASE.2019.00150.
- [65] C. Macho, S. McIntosh, M. Pinzger, Automatically repairing dependency-related build breakage, in: 25th International Conference on Software Analysis, Evolution and Reengineering (SANER), IEEE Computer Society, 2018, pp. 106–117. doi:10.1109/SANER.2018.8330201.
- [66] A. Barrak, E. E. Eghan, B. Adams, F. Khomh, Why do builds fail? - A conceptual replication study, J. Syst. Softw. 177 (2021) 110939. doi:10.1016/j.jss.2021.110939.
- [67] O. Kononenko, O. Baysal, L. Guerrouj, Y. Cao, M. W. Godfrey, Investigating code review quality: Do people and participation matter?, in: 2015 IEEE International Conference on Software Maintenance and Evolution (ICSME), IEEE Computer Society, 2015, pp. 111–120. doi:10.1109/ICSM.2015.7332457.
- [68] C. Vassallo, S. Panichella, F. Palomba, S. Proksch, A. Zaidman, H. C. Gall, Context is king: The developer perspective on the usage of static analysis tools, in: 25th International Conference on Software Analysis, Evolution and Reengineering, (SANER), IEEE Computer Society, 2018, pp. 38–49. doi:10.1109/SANER.2018.8330195.
- [69] F. Zampetti, S. Scalabrino, R. Oliveto, G. Canfora, M. D. Penta, How open source projects use static code analysis tools in continuous integration pipelines, in: Proceedings of the 14th International Conference on Mining Software Repositories (MSR), IEEE Computer Society, 2017, pp. 334–344. doi:10.1109/MSR.2017.2.
- [70] M. Golzadeh, A. Decan, T. Mens, On the rise and fall of CI services in GitHub, in: 29th IEEE International Conference on Software Analysis, Evolution and Reengineering (SANER), IEEE, 2022.
- [71] J. H. Bernardo, D. A. da Costa, U. Kulesza, Studying the impact of adopting continuous integration on the delivery time of pull requests, in: Proceedings of the 15th International Conference on Mining Software Repositories (MSR), ACM, 2018, pp. 131–141.
- [72] A. Rahman, A. Agrawal, R. Krishna, A. Sobran, Characterizing the influence of continuous integration: empirical results from 250+ open source and proprietary projects, in: Proceedings of the 4th ACM SIGSOFT International Workshop on Software Analytics, SWAN@ESEC/SIGSOFT FSE, ACM, 2018, pp. 8–14. doi:10.1145/3278142.3278149.
- [73] A. Bosu, M. Greiler, C. Bird, Characteristics of useful code reviews: An empirical study at microsoft, in: 12th IEEE/ACM Working Conference on Mining Software Repositories (MSR), IEEE, 2015, pp. 146–156.
- [74] L. N. Q. Do, J. R. Wright, K. Ali, Why do software developers use static analysis tools? A user-centered study of developer needs and motivations, IEEE Trans. Software Eng. 48 (3) (2022) 835–847. doi:10.1109/TSE.2020.3004525.
-
[75]
Y. Wang, M. V. Mäntylä, Z. Liu, J. Markkula,
Test automation maturity
improves product quality - quantitative study of open source projects using
continuous integration, J. Syst. Softw. 188 (2022) 111259.
doi:10.1016/j.jss.2022.111259.
URL https://doi.org/10.1016/j.jss.2022.111259