Millimeter Observations of the Type II SN 2023ixf: Constraints on the Proximate Circumstellar Medium
Abstract
We present 1.3 mm (230 GHz) observations of the recent and nearby Type II supernova, SN 2023ixf, obtained with the Submillimeter Array (SMA) at days after explosion. The observations were obtained as part the SMA Large Program POETS (Pursuit of Extragalactic Transients with the SMA). We do not detect any emission at the location of SN 2023ixf, with the deepest limits of erg s-1 Hz-1 at 2.7 and 7.7 days, and erg s-1 Hz-1 at 18.6 days. These limits are about a factor of 2 times dimmer than the mm emission from SN 2011dh (IIb), about an order of magnitude dimmer compared to SN 1993J (IIb) and SN 2018ivc (IIL), and about 30 times dimmer than the most luminous non-relativistic SNe in the mm-band (Type IIb/Ib/Ic). Using these limits in the context of analytical models that include synchrotron self-absorption and free-free absorption we place constraints on the proximate circumstellar medium around the progenitor star, to a scale of cm, excluding the range M⊙ yr-1 (for a wind velocity, km s-1, and ejecta velocity, km s-1). These results are consistent with an inference of the mass loss rate based on optical spectroscopy ( M⊙ yr-1 for km s-1), but are in tension with the inference from hard X-rays ( M⊙ yr-1 for km s-1). This tension may be alleviated by a non-homogeneous and confined CSM, consistent with results from high-resolution optical spectroscopy.
TBD
1 Introduction
Over the past few decades observations of core-collapse supernovae (CCSNe) ranging from radio to X-rays have revealed that massive stars may undergo enhanced or eruptive mass loss in the final years and decades prior to core-collapse (e.g., Smith 2014). The resulting circumstellar medium (CSM) around the progenitor stars can be probed using optical spectroscopy shortly after explosion, which can reveal emission from the ionized CSM (so-called flash spectroscopy; e.g., Gal-Yam et al. 2014; Yaron et al. 2017); optical/UV observations of the rising light curves, which can reveal energy deposition from CSM-SN ejecta shock interaction (e.g., Nakar & Piro 2014; Moriya et al. 2018; Hiramatsu et al. 2021); X-ray observations, which track thermal bremsstrahlung emission from CSM-SN ejecta shock interaction and absorption by neutral CSM; and radio/millimeter observations which trace synchrotron emission due to the acceleration of relativistic electrons in CSM-SN shock interaction (e.g., Chevalier & Fransson 2017).
SN 2023ixf was discovered on 2023 May 19.727 UT shortly after explosion in M101 (Itagaki, 2023), at Mpc (Riess et al., 2022), and was classified as a Type II SN shortly thereafter (Perley et al., 2023). Thanks to its early discovery and proximity, extensive data across the electromagnetic spectrum is being collected, including early optical spectra that reveal flash ionization features (Jacobson-Galan et al., 2023; Smith et al., 2023) and narrow absorption due to the pre-shocked CSM (Smith et al., 2023); optical light curves, which point to early excess emission (Hosseinzadeh et al., 2023); and hard X-ray observations, indicating a large neutral hydrogen column density in the vicinity of the SN (Grefenstette et al., 2023). Pre-explosion Hubble Space Telescope, Spitzer Space Telescope, and ground-based observations point to a variable and dusty red supergiant progenitor (Kilpatrick et al., 2023; Neustadt et al., 2023; Pledger & Shara, 2023). Here, we report on early observations obtained with the SMA spanning about 2.7 to 18.6 days after the estimated time of first light, and use these data to constrain the CSM density around the progenitor star. We present the data in §2 and compare to previous mm-band data for CCSNe in §3 and to numerical and analytical models in §4. We discuss and summarize the results in §5.
2 Observation and Data Analysis
Following the discovery and classification of SN 2023ixf, we used the SMA on several occasions to observe the SN, starting on 2023 May 21.17, about 2.4 days after the estimated time of first light (2023 May 18.74 UT; e.g., Hosseinzadeh et al. 2023; Hiramatsu et al. in prep.) The observations were obtained as part of the new Large Project POETS (Pursuit of Extragalactic Transients with the SMA; project 2022B-S046, PI: Berger). The observations are summarized in Table 1. During these observations, the SMA was tuned to an LO frequency of 225.5 GHz, providing spectral coverage between 209.5–221.5 and 229.5–241.5 GHz. Across all nights, 3C454.3 was observed as a bandpass calibrator, Ceres was observed as a flux calibrator, and J1419+543 and J1506+426 were observed as gain calibrators, with a 15-minute cycle time cadence.
| UT Date | |||
|---|---|---|---|
| (d) | (mJy) | ( erg s-1 Hz-1) | |
| May 21.17–21.63 | 2.66 | ||
| May 22.17–22.29 | 3.49 | ||
| May 24.51–24.62 | 5.83 | ||
| May 26.34–26.62 | 7.74 | ||
| May 28.44–28.62 | 9.79 | ||
| June 6.09–6.60 | 18.60 |
Note. — Phases () are given relative to an estimated time of first light of 2023 May 18.74 UT and are at the mid-point of each observation.
a Limits are 3 times the image rms.
Analysis of the data was performed using the SMA COMPASS pipeline (Keating et al., in prep.), which flags spectral data based on outliers in amplitude when coherently averaging over increasing time intervals for each channel within each baseline, as well as baselines where little-to-no coherence is seen on calibrator targets. Flux calibration was performed using the Butler-JPL-Horizons 2012 (Butler, 2012) model for Ceres. The data were imaged, and deconvolution was performed via the CLEAN algorithm (Högbom, 1974).
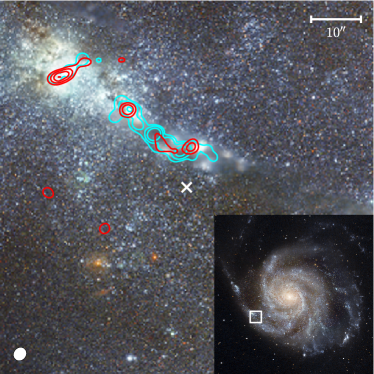
We do not detect emission from the location of SN 2023ixf in any of our observations, with root-mean-square noise levels spanning about mJy. The corresponding luminosity limits are erg s-1 Hz-1 (Table 1). An SMA continuum and CO(2-1) line map are shown in Figure 1 overlaid on a Hubble Space Telescope image of the field.
3 Comparison to Other Core-Collapse Supernovae
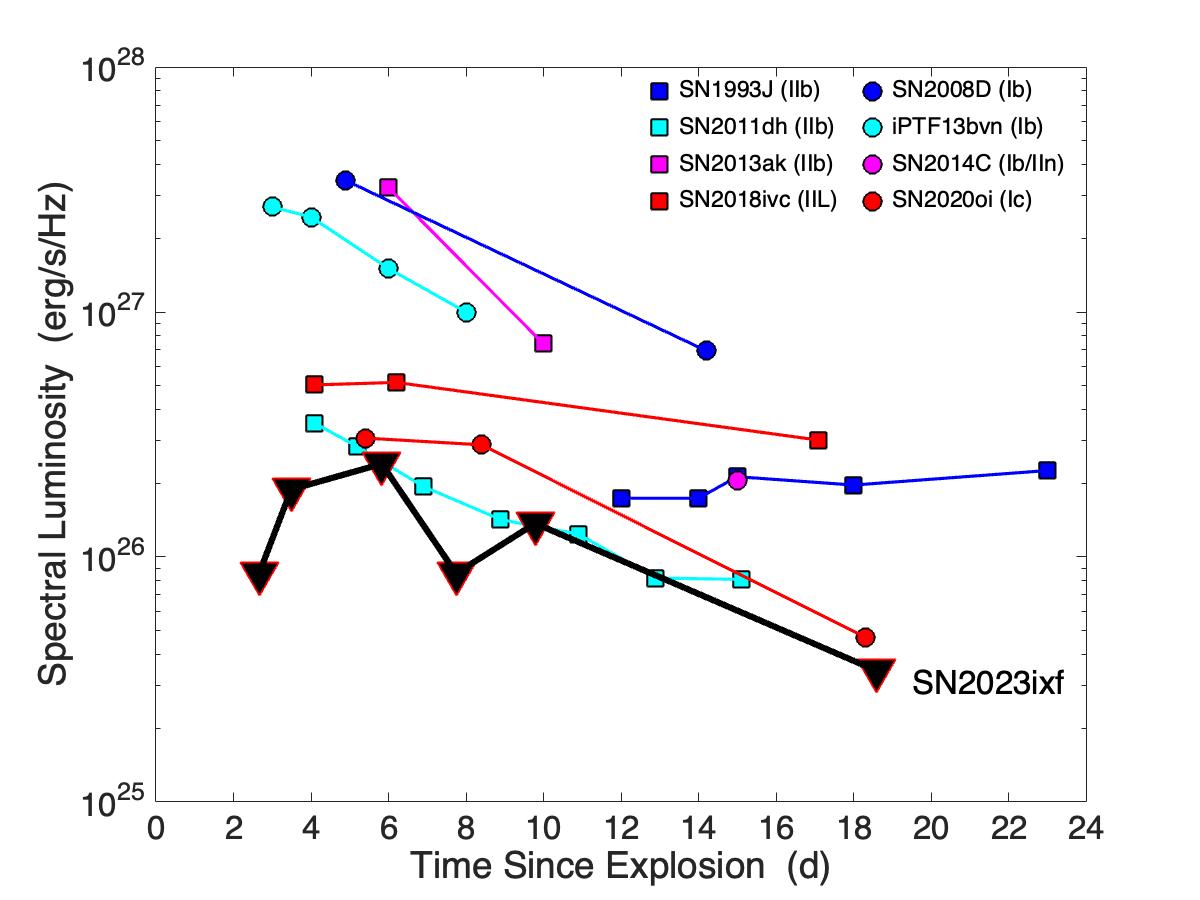
In Figure 2 we show the SMA spectral luminosity upper limits for SN 2023ixf in comparison to the mm-band ( GHz) light curves of several nearby CCSNe (Type II and Ib/c) on timescales of days. Previously detected SNe span luminosities from only a factor of about 2 times higher than our limits (e.g., SN 2011dh; Horesh et al. 2013c) and up to erg s-1 Hz-1, more than an order of magnitude more luminous than our limits for SN 2023ixf (e.g., SN 2018ivc; Maeda et al. 2023). In recent work Maeda et al. (2023) inferred mass loss rates (scaled to a wind velocity of 100 km s-1) of M⊙ yr-1 for SN 2018ivc, M⊙ yr-1 for SN 1993J, and M⊙ yr-1 for SN 2011dh based on mm-band data. Comparable mass loss rates, M⊙ yr-1 have been inferred for other Type IIb SNe based on cm-band data (e.g., Nayana et al. 2022 and references therein). We note that all these comparison SNe are of Type IIb or IIL withmore stripped and compact progenitors than that of SN 2023ixf (Kilpatrick et al., 2023; Neustadt et al., 2023) and likely have higher velocity ejecta that boost their mm-band (and radio) synchrotron emission.
4 CSM Interaction Models
We use the non-detections at 230 GHz to place constraints on the CSM around the progenitor of SN 2023ixf on a scale of cm (for an assumed ejecta velocity of km s-1). In the mm band the expected emission is due to synchrotron radiation arising from shock interaction of the SN ejecta with the CSM. We consider the effects of both synchrotron self-absorption and free-free absorption by an external CSM, following the well established models of Weiler et al. (1986) and Chevalier (1998), which have been used to interpret the radio/mm emission from previous CCSNe.
In the high-density limit, free-free absorption is expected to dominate, with the optical depth given by Weiler et al. (1986): , where is time in days since explosion, and we have assumed that the ejecta are roughly in free expansion (leading to the temporal power law index of ). Setting at 2.7 and 18.6 days we find and , respectively. The mass loss rate is given by (Weiler et al., 1986):
| (1) |
where is the electron temperature, and is the CSM wind velocity. Using our SMA limits at 2.7 and 18.6 days, with km s-1 (Smith et al., 2023), km s-1, and K we find and M⊙ yr-1, respectively.
In the case of synchrotron self-absorption only, the inferred mass loss rate is much lower, and is given by (Chevalier, 1998):
| (2) |
where and are the post-shock energy fractions in the relativistic electrons and magnetic fields, respectively. Using our limits at 2.7 and 18.6 days, and assuming , we find and M⊙ yr-1, respectively.
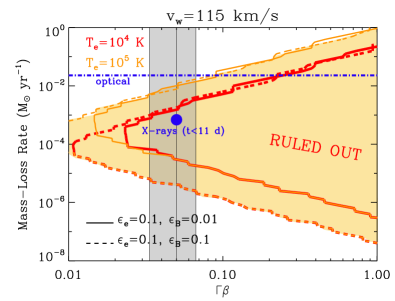
A full calculation of the effects of free-free absorption and synchrotron self-absorption (following Chevalier 1998) is shown in Figure 3, where we constrain the joint phase-space of and ruled out by our SMA data. In this calculation we determine the mm-band luminosity for a range of ejecta velocities and mass loss rates using an input kinetic energy, km s-1, and assuming two sets of equipartition values ( and ) and two values for ( and K). We find that for a reasonable range of km s-1 we can exclude a mass loss rate range of M⊙ yr-1 (for and K).
The constraints shown in Figure 3 are demonstrated by a comparison between model light curves and the observed upper limits in Figure 4. Here, we use the model prescriptions described in Maeda et al. (2021) and Maeda et al. (2023). We adopt a CSM with a wind profile truncated at cm to represent a “confined” CSM. The ejecta mass and energy are set to be and erg, and free-free absorption is included assuming K. Inverse Compton cooling is taken into account, using the -band light curve (Jacobson-Galan et al., 2023) as a proxy for the bolometric light curve of SN 2023ixf. While the model here adopts the self-similar solution for the shock-wave dynamics (Chevalier, 1998), it reproduces the results of the more detailed calculation by Matsuoka et al. (2019).
Adopting our fiducial values of , we find that the 230 GHz upper limits for SN 2023ixf rule out M⊙ yr-1, comparable to the model exclusion region shown in Figure 3. A key point is that the model accounts for the deceleration of the outer ejecta, which is important in the case of the high mass loss rate regime (this means that we need to evaluate the constraints on mass loss rate at somewhat different velocities for the lower and upper bounds in Figure 3). Additionally, we stress that the choice of (unconstrained) microphysical parameters ( and ) are important, as demonstrated in the right panel of Figure 4 where we adopt the smaller values inferred for SN 2020oi (Maeda et al., 2021). In this case, the allowed range of the mass-loss rate is M⊙ yr-1 or yr-1; interestingly, an intermediate mass-loss rate of M⊙ yr-1 is marginally allowed. In any case, it is important to use additional information such as the inverse Compton cooling or multi-wavelength information to robustly constrain the mass-loss rate (e.g., Maeda et al., 2023).
In recent work, Jacobson-Galan et al. (2023) estimated a mass loss rate of M⊙ yr-1 to a scale of cm by comparing the ionization features in early optical spectra (extending to about 14 days) with spectral models of CSM interaction. This result is marked in Figure 3 and is in agreement with the results presented here. On the other hand, Grefenstette et al. (2023) used hard X-ray data at 4 and 11 days to estimate M⊙ yr-1 on a similar radial scale (or M⊙ yr-1 if using km s-1; see Figure 3). This value is in tension with our results for K and marginally for K. However, it is essential to note that each of these approaches to determining the CSM density makes key simplifying assumptions that may lead to disparate estimates of the CSM properties. This includes numerical factors (e.g., , , and in our case) and underlying geometrical assumptions such as spherical symmetry and a homogeneous CSM. For example, it is possible that a non-homogeneous and radially-confined CSM, which may also affect the ejecta velocity angular profile, would lead to X-ray and mm emission regions of different densities. Indeed, an asymmetric and confined CSM on a radial scale of cm has been inferred from high resolution optical spectroscopy (Smith et al., 2023).
5 Conclusions
We have presented mm-band observations of the recently-discovered SN 2023ixf, covering about 2.7 to 18.6 days post-explosion. The non-detections place an upper bound on the luminosity at 230 GHz of erg s-1 Hz-1 at 2.7 and 7.7 days, and erg s-1 Hz-1 at 18.6 days. These limits are about a factor of 2 times lower than the mm-band emission detected from SN 2011dh (IIb) and about an order of magnitude lower than the emission in SN 1993J (IIb) and SN 2018ivc (IIL). Using these limits we place constraints on the proximate CSM of the progenitor of SN 2023ixf, out to a scale of cm of M⊙ yr-1 (free-free absorption) or M⊙ yr-1 (synchrotron self-absorption). We note that these limits are in agreement with the inferences from early optical spectroscopy (Jacobson-Galan et al., 2023; Smith et al., 2023) but are in tension with the inferred mass loss based on early X-ray observations (Grefenstette et al., 2023). A likely scenario that may alleviate this tension is a non-homogeneous and confined dense CSM (Smith et al., 2023), which can lead to the X-ray emission emerging from lower density regions while the mm-band emission is absorbed.
We anticipate that continued observations of SN 2023ixf in the radio/mm and X-ray regimes over the coming weeks, months, and years, as well as joint modeling with the available optical photometry and spectroscopy, will eventually better delineate the complex and likely non-spherical and non-homogeneous CSM environment of the progenitor. More broadly, as demonstrated here, early mm-band observations can provide constraints on the density and geometry of the CSM around SN progenitors on the same spatial scales as rapid optical spectroscopy and X-ray observations, providing an independent constraint with different modeling assumptions. We plan to continue undertaking such observations for nearby CCSNe as part of POETS.
References
- Butler (2012) Butler, B. 2012, Atacama Large Millimeter/Submillimeter Array Memo 594, 594, 1
- Chakraborti et al. (2013) Chakraborti, S., Petitpas, G., Zauderer, A., et al. 2013, The Astronomer’s Telegram, 4947, 1
- Chevalier (1998) Chevalier, R. A. 1998, ApJ, 499, 810
- Chevalier & Fransson (2017) Chevalier, R. A., & Fransson, C. 2017, in Handbook of Supernovae, ed. A. W. Alsabti & P. Murdin
- Gal-Yam et al. (2014) Gal-Yam, A., Arcavi, I., Ofek, E. O., et al. 2014, Nature, 509, 471
- Gorosabel et al. (2010) Gorosabel, J., de Ugarte Postigo, A., Castro-Tirado, A. J., et al. 2010, A&A, 522, A14
- Grefenstette et al. (2023) Grefenstette, B. W., Brightman, M., Earnshaw, H. P., Harrison, F. A., & Margutti, R. 2023, arXiv e-prints, arXiv:2306.04827
- Hiramatsu et al. (2021) Hiramatsu, D., Howell, D. A., Van Dyk, S. D., et al. 2021, Nature Astronomy, 5, 903
- Högbom (1974) Högbom, J. A. 1974, A&AS, 15, 417
- Horesh et al. (2013a) Horesh, A., Cao, Y., Mooley, K., & Carpenter, J. 2013a, The Astronomer’s Telegram, 5198, 1
- Horesh et al. (2013b) Horesh, A., Stockdale, C., Fox, D. B., et al. 2013b, MNRAS, 436, 1258
- Horesh et al. (2013c) Horesh, A., Stockdale, C., Fox, D. B., et al. 2013c, MNRAS, 436, 1258
- Hosseinzadeh et al. (2023) Hosseinzadeh, G., Farah, J., Shrestha, M., et al. 2023, arXiv e-prints, arXiv:2306.06097
- Itagaki (2023) Itagaki, K. 2023, Transient Name Server Discovery Report, 2023-1158, 1
- Jacobson-Galan et al. (2023) Jacobson-Galan, W. V., Dessart, L., Margutti, R., et al. 2023, arXiv e-prints, arXiv:2306.04721
- Kilpatrick et al. (2023) Kilpatrick, C. D., Foley, R. J., Jacobson-Galán, W. V., et al. 2023, arXiv e-prints, arXiv:2306.04722
- Maeda et al. (2021) Maeda, K., Chandra, P., Matsuoka, T., et al. 2021, ApJ, 918, 34
- Maeda et al. (2023) Maeda, K., Chandra, P., Moriya, T. J., et al. 2023, ApJ, 942, 17
- Matsuoka et al. (2019) Matsuoka, T., Maeda, K., Lee, S.-H., & Yasuda, H. 2019, ApJ, 885, 41
- Moriya et al. (2018) Moriya, T. J., Förster, F., Yoon, S.-C., Gräfener, G., & Blinnikov, S. I. 2018, MNRAS, 476, 2840
- Nakar & Piro (2014) Nakar, E., & Piro, A. L. 2014, ApJ, 788, 193
- Nayana et al. (2022) Nayana, A. J., Chandra, P., Krishna, A., & Anupama, G. C. 2022, ApJ, 934, 186
- Neustadt et al. (2023) Neustadt, J. M. M., Kochanek, C. S., & Rizzo Smith, M. 2023, arXiv e-prints, arXiv:2306.06162
- Perley et al. (2023) Perley, D. A., Gal-Yam, A., Irani, I., & Zimmerman, E. 2023, Transient Name Server AstroNote, 119, 1
- Pledger & Shara (2023) Pledger, J. L., & Shara, M. M. 2023, arXiv e-prints, arXiv:2305.14447
- Riess et al. (2022) Riess, A. G., Yuan, W., Macri, L. M., et al. 2022, ApJ, 934, L7
- Smith (2014) Smith, N. 2014, ARA&A, 52, 487
- Smith et al. (2023) Smith, N., Pearson, J., Sand, D. J., et al. 2023, arXiv e-prints, arXiv:2306.07964
- Soderberg et al. (2008) Soderberg, A. M., Berger, E., Page, K. L., et al. 2008, Nature, 453, 469
- Weiler et al. (1986) Weiler, K. W., Sramek, R. A., Panagia, N., van der Hulst, J. M., & Salvati, M. 1986, ApJ, 301, 790
- Weiler et al. (2007) Weiler, K. W., Williams, C. L., Panagia, N., et al. 2007, ApJ, 671, 1959
- Yaron et al. (2017) Yaron, O., Perley, D. A., Gal-Yam, A., et al. 2017, Nature Physics, 13, 510
- Zauderer et al. (2013) Zauderer, A., Soderberg, A., Chakraborti, S., et al. 2013, The Astronomer’s Telegram, 4946, 1
- Zauderer et al. (2014) Zauderer, B. A., Kamble, A., Chakraborti, S., & Soderberg, A. 2014, The Astronomer’s Telegram, 5764, 1