Roughness evolution induced by third-body wear
Abstract
Surface roughness is a key factor when it comes to friction and wear, as well as to other physical properties. These phenomena are controlled by mechanisms acting at small scales, in which the topography of apparently-flat surfaces is revealed. Roughness in natural surfaces has been reported to conform to self-affine statistics in a wide variety of settings (ranging from earthquake physics to micro-electro-mechanical devices), meaning that the height profile can be described using a spectrum where the amplitude is proportional to its wavelength raised to a constant power, which is related to a statistical parameter named Hurst exponent. We analyze the roughness evolution in atomistic surfaces during molecular dynamics simulations of wear. Both pairs of initially-flat and initially-rough surfaces in contact are worn by a third body formed by particles trapped between them during relative sliding. During the first sliding stages, the particles trapped between the first bodies scratch the surfaces. Once the former become coated with atoms from the latter, the wear process slows down and becomes “adhesive-like”. The initial particle sizes are consistent with the minimum size to be expected for the debris, but tend to grow by material removal from the surfaces and to agglomerate. We show that, for the particular configurations under consideration, the surface roughness seems to converge to a steady state characterized by Hurst exponent close to 0.8, independently of the initial conditions.
Keywords Abrasive wear Atom-by-attom attrition Roughness Hurst exponent
1 Introduction
Understanding the geometry and evolution of rough surfaces is an active research endeavor in tribology (Persson et al., 2004, Bonamy and Bouchaud, 2011, Renard et al., 2013, Candela and Brodsky, 2016, Aghababaei et al., 2023) as roughness mediates friction, wear and lubrication (Godet, 1984). Since the pioneering work of Bowden and Tabor, the response of sliding surfaces is known to depend on the real contact area between the surfaces (Bowden and Tabor, 2001), which, due to their roughness, is but a small percentage of the apparent contact area (Dieterich and Kilgore, 1994). In natural surfaces (Renard et al., 2013, Candela and Brodsky, 2016), across a wide range of scales, roughness appears to follow a fractal distribution (we refer in this case to “self-affine surfaces”) which can be characterized in terms of a power law of the wavelengths whose exponent relates to the so-called “Hurst exponent”, see Mandelbrot and Van Ness (1968). A number of factors have been put forward to explain how these particular statistics arise in nature: material heterogeneity (Sundaram et al., 2012), plastic mechanisms (Irani and Nicola, 2019, Hinkle et al., 2020), fracture (Bouchaud and Bouchaud, 1994), and corrosion (ASME, 2013), among others. Hinkle et al. (2020) proved that fractal roughness can arise from inelastic deformation induced by simple compression, combined with material discreteness and heterogeneity.
Recently, molecular dynamic (MD) models with simplified potentials have enabled in silico experiments in which the transition from wear regimes (from asperity plastic smoothing to fracture-induced debris creation) can be observed (Aghababaei et al., 2016, 2017, Garcia-Suarez et al., 2023). In this context, roughness evolution of 1D surfaces was studied (Milanese et al., 2019, 2020), reporting the generation of self-affine surfaces starting from contacting asperities that are subsequently sheared during surface relative sliding, which gives rise to a third body and whose rolling ends up wearing the surfaces through a process of tearing of shallow clumps of atoms (Milanese and Molinari, 2020), leading eventually to the attainment of a steady-state roughness with fractal characteristics.
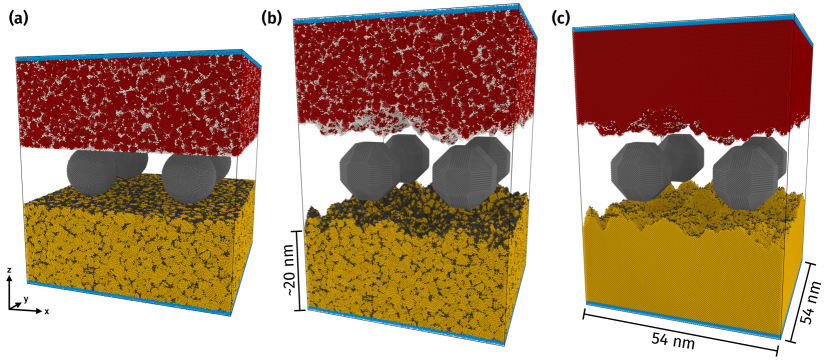
Milanese et al. (2020) was solely concerned with 2D geometries (1D roughness). Recently, Brink et al. (2022) performed 3D simulations, starting from a configuration with two surfaces in relative sliding motion with pre-formed third bodies in between (Figure 1). This work considered both surfaces that were initially rough and flat as well as third-body particles simultaneously, hence a setting that departs starkly from idealized configurations (Sorensen et al., 1996, Mo et al., 2009, Stoyanov et al., 2013, Eder et al., 2015, Yang et al., 2016, Sharp et al., 2017, Aghababaei, 2019). Among the many insights provided by these simulations, the appearance of cylindrical rolling particles as those observed in experiments (Zanoria and Danyluk, 1993, Zanoria et al., 1995a, b) and the attainment of an apparent steady-state roughness regime stood out. The steady-state is reached after substantial material transfer from the surface to the debris particles. This also translates into decimation of the larger topographical features (those associated to the wavelength of the order of the diameter of the debris); this also implies an apparent “flattening” of the surface that, unlike previous results (Sorensen et al., 1996, Spijker et al., 2011, Stoyanov et al., 2013), is not only associated to atomistic mechanisms but also to debris creation and its coating by surface atoms upon subsequent sliding.
Even though the original paper (Brink et al., 2022) was focused on quantifying frictional forces and surface wear, the surface topography state was extracted at regular increments of the simulations (see Methods section). This manuscript presents the post-processing of the roughness and characterizes the steady-state regimes quantitatively. Section 2 briefly reviews the computations’ specificities and presents the topography spectral analysis techniques to be utilized. The surface changes as well as the corresponding Hurst exponent evolution are reported in Section 3 and discussed in Section 4. Conclusions and future work directions are presented in Section 5.
2 Methods
2.1 Data generation
Rough surfaces were generated by MD simulations of rigid particles rolling on surfaces made out of a silicon-like model material (Brink et al., 2022). We used LAMMPS (Thompson et al., 2022) with a modified (Holland and Marder, 1998a, b) Stillinger–Weber (Stillinger and Weber, 1985) potential using GPU acceleration (Brown et al., 2011, Brown and Yamada, 2013). While the modified potential does not reproduce the properties of silicon, it can model the brittle fracture (cleavage without dislocation activity) with low computational cost (for details see Brink and Molinari, 2019, Brink et al., 2022).
We used the setups shown in Figure 1. For two simulations (a–b), we prepared a nanocrystalline material with grain size of , obtained by the Voronoi tesselation method (Derlet and Van Swygenhoven, 2003). For one simulation (c) we used a single-crystalline material with the (100) surface showing in direction. Initially, the top and bottom bulk regions (first bodies) each had a size of around (total of around 8 million atoms in the final simulation cell). For one nanocrystal and for the single crystal, we started from synthetic rough surfaces (Wu, 2000) which were generated with a Hurst exponent of 0.8, a lower wavelength cutoff of , an upper wavelength cutoff of , no roll-off, and an RMS of heights of using the software Tamaas (Frérot et al., 2020). The other nanocrystal had a flat surface initially. We then introduced four rigid particles each into the gaps between the surfaces (third bodies). These particles were polyhedra (rhombicuboctahedral shape), except for case (a), where we used round particles for comparison. Their diameter was chosen at . Note that the particles get coated quickly by material picked up from the surfaces. Therefore (i) their initial shape does not matter and (ii) the simulation resembles more closely the adhesive wear case than the abrasive one (Brink et al., 2022).
The sliding simulations were performed with periodic boundary conditions along and . A layer of thickness was fixed at the ends of the top and bottom surfaces, where a normal force of was applied, corresponding to an average pressure of approximately or 8% of the hardness. Next to these boundary layers, another 0.4-nm-thick layer was used each to apply Langevin thermostats at room temperature with a damping constant of . The center-of-mass velocity of the layer was subtracted from the thermostating calculation to avoid an artificial drag force. Sliding was imposed on the top first body with a velocity of to a total sliding distance of at an angle of off the x direction to avoid that the particles wear the same trench over and over again.
Every sliding distance (), the simulation state was recorded. For post-processing, the third bodies are fixed in place while the surfaces are separated (Brink et al., 2022). The atoms on the surfaces of the first bodies were indentified using a surface mesh generation algorithm (Stukowski, 2014) implemented in Ovito (Stukowski, 2009). This algorithm is based on testing if a virtual probe sphere of radius can penetrate the material or not (Stukowski, 2014). The resulting surfaces are then analyzed as described in the following.
2.2 Post-processing
2.2.1 2D surfaces
The height of a surface is defined by a function , where and span the surface. If we assume a periodic boundary conditions, it follows that and .
Periodicity allows analyzing the surface using Fourier series and, since we work with discrete datasets, discrete Fourier transform. The first step is to interpolate among the original irregular mesh points to then evaluate the interpolant on a regular mesh, being the number of points in either direction. We use a piece-wise constant interpolant between atoms. See that by the end of this procedure one may obtain a set of points that do not reflect the periodicity of the original point cloud; this motivates the use of “windowing” discussed later.
Heights are known in discrete fashion. The position of the -th surface atom comes given by a triple , being the height. The set of all points forms an unstructured mesh which must be re-sampled into a regular grid (sampling intervals ) before using discrete Fourier transform methods. Then, the height of the topography features can be expressed as:
| (1) |
where the wavenumbers appear, horizontal and vertical , taking possible values indexed by . The amplitude corresponding to each combination of wavenumbers is computed as
| (2) |
The heights are rescaled beforehand to guarantee , what amounts to . The set of all Fourier coefficients will be referred henceforth as “the spectrum of the surface”, and any individual coefficient as “a harmonic”.
The is an important parameter when it comes to test if a surface is “self-affine”. This parameter represents an average squared height (Jacobs et al., 2017), and thus it conveys the magnitude of the topography oscillations. The 2D power spectral density (PSD) is a function of the wavenumbers defined using the harmonics’ amplitudes
| (3) |
which is equivalent to the magnitude of the Fourier transform of the height-to-height autocorrelation function (Jacobs et al., 2017), a consequence of Parseval’s theorem (Evans, 2010).
The lack of periodicity associated to discreteness and interpolation can introduce spurious high-frequency oscillations in the spectrum of the surfaces (Jacobs et al., 2017). To avoid this issue, windowing is used. In this text, we use radial Hahn window, implicitly assuming that the roughness we are dealing with is isotropic. The radially-symmetric Hahn window is defined as (Jacobs et al., 2017)
| (4) |
defined like this for and equal to zero everywhere else. The modified “windowed” heights are given by for all such that , and otherwise.
The Fourier transform comes given in terms of the horizontal wavenumber and the vertical one . If the surface is isotropic, then the coefficients of the Fourier series depend on the wavenumbers through , meaning that the spectral amplitude must possess axial symmetry with respect to the origin of the plane. Thus, for any fixed , we can define the radial average of 2D PSDs (implicitly assuming isotropy) as
| (5) |
where is a number of angular probes. We probe at , i.e., we average over points for every fixed .
The PSDs that we obtain seem to reasonably satisfy this assumption. Thus, the 2D spectrum indexed by and is converted into a 1D one that depends on . If the surface is isotropic and self-affine, then the spectral amplitudes must scale as , where is the Hurst exponent.
The value of is obtained through the slope of the line fitted using logarithmic scales, discarding the roll-off phase (Jacobs et al., 2017).
2.2.2 1D line scans
We have also performed 1D scans on the surfaces. Their theory is briefly introduced next, for further details see Milanese et al. (2019) and the appendix A of Jacobs et al. (2017).
In the 1D case, given a height 1D scan along the x-direction, the PSD (per unit length, at a wavelength ) of self-affine surfaces comes given as
| (6) |
which has been discretized using a regular step , thus . Therefore, the discrete spectrum of the PSD contains discrete wavenumbers for Thus
| (7) |
which, after averaging over many scans (Jacobs et al., 2017), must satisfy if the roughness is self-affine.
The height-to-height correlation function, defined as (where means taking the spatial average), is another 1D statistical quantity of interest. It is known to follow if the 1D surface is indeed self-affine.
Results of 1D analyses must be averaged across many scans to render the results consistent with the 2D results (Jacobs et al., 2017). We use ten scans along x-direction and ten more along y.
3 Results
3.1 Visualization of roughness evolution
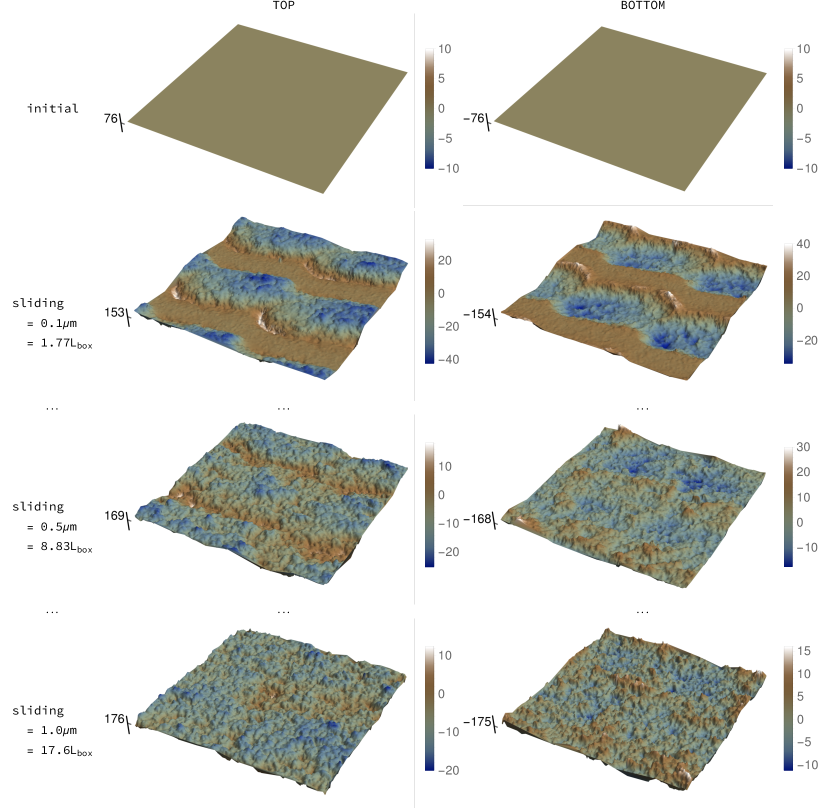
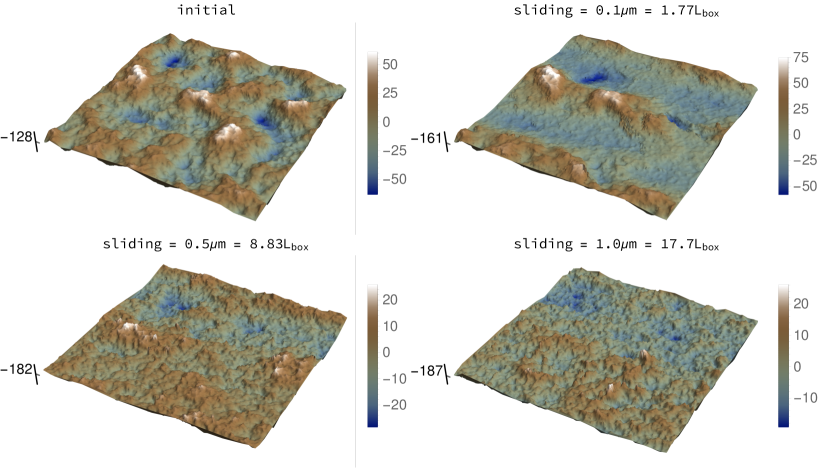
For the geometrical setting and silicon-like material described in the Section 2.1, we show schemes of the roughness evolution in three different cases. The first, Figure 2, corresponds to the surfaces (top and bottom) that are initially flat, and whose bulk contains grain boundaries. The second one, Figure 3, features an initially-rough isotropic surface (bottom one) created with Tamaas (Frérot et al., 2020) with an initial Hurst exponent of whose bulk material also contains grain boundaries. Finally, supplementary material Figure A.1. ,is similar to Figure 3, but the bulk material is crystalline.
Every plot is accompanied by a scale to measure the amplitude of oscillations with respect to the mean. See that the color code remains the same, but the range of the scales changes between surfaces, since the magnitude of the topographical features evolves. The absolute position on the mean plane is marked in the vertical axis to better appreciate how the surface level descends as surface atoms are transferred to the coating of the third body. Note that the middle point between mean planes of the surfaces corresponds to the height equal to . Lighter colors highlight features that “stick out” of the surface, while darker ones penetrate into the bulk.
“Trenches” associated to the scratching by the third body are observed in both top and bottom surfaces after sliding by (see second row in Figure 2). Bear in mind that the particles’ trajectories wind over the whole surface, owing to the sliding direction being not aligned with either axis of the surface. As sliding progresses, the topography “homogenizes”: the initially-flat surfaces become isotropically rough (third and fourth row in Figure 2) and the initially-rough ones evolve to a new state, similarly isotropic but characterized by lower height amplitudes (e.g., Figure 3).
3.2 2D PSDs
We also provide graphics of PSD evolution in the supplementary material. They clearly reveal “textured” surfaces during the first sliding stages, meaning that we see light spots in figures in supplementary material section C, indicating large magnitude oscillations that break the radial symmetry required by isotropy. Physically, this marked wavelengths are related to the deep grooves left by the wear particles during the first runs, which scratch the initial surface in an abrasive manner. As more sliding unfolds, the debris is coated with surface atoms, changing the wear mechanism to tearing of small flakes of material, induced by adhesion and the debris’ rolling movement (Milanese and Molinari, 2020). The texture then fades away, yielding a PSD wavenumber distribution that seems reasonably angle independent, i.e., isotropic, see the final sliding PSD figures in supplementary material section C. This result is reassuring insofar it backs our subsequent analysis as to self-affinity.
3.3 Logarithmic slope of radial PSD (Ciso): fitting the Hurst exponent
As explained in the Methods section, isotropic surfaces depend solely on the modulus of the wavenumber vector , not on the ratio . This motivates the definition of a radial PSD, characterized by , eq. 5. The Hurst exponent can be easily fitted when this function is expressed in log–log scales. This exercise has been pursued in supplemenrary material section B.
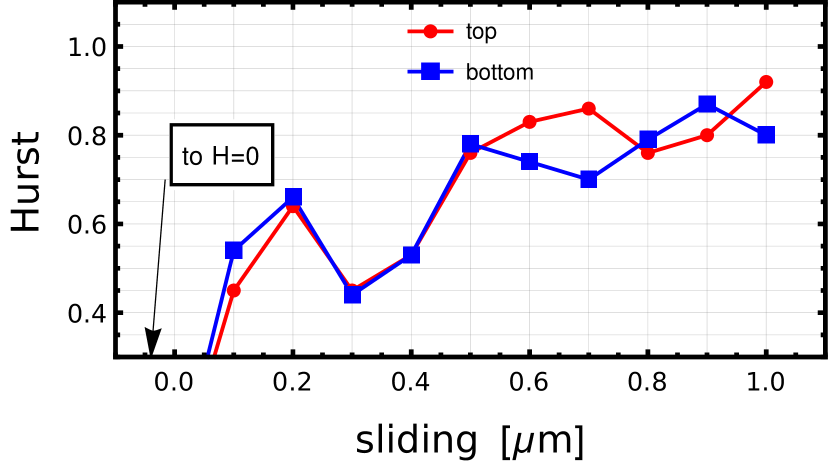
3.4 Hurst exponent evolution
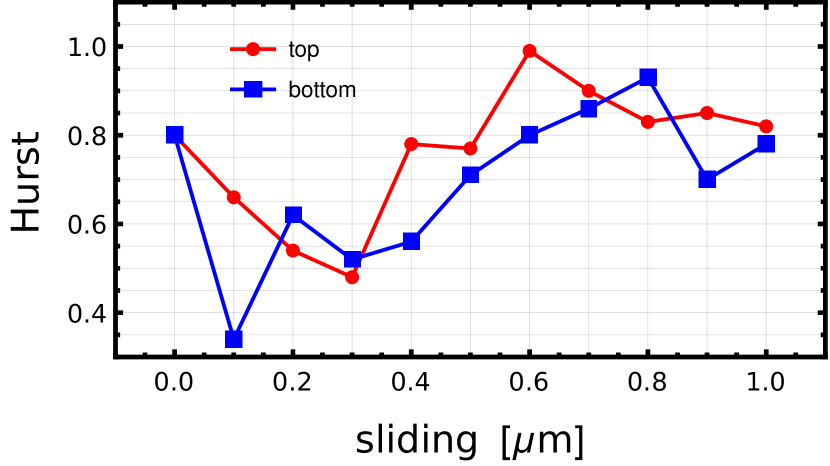
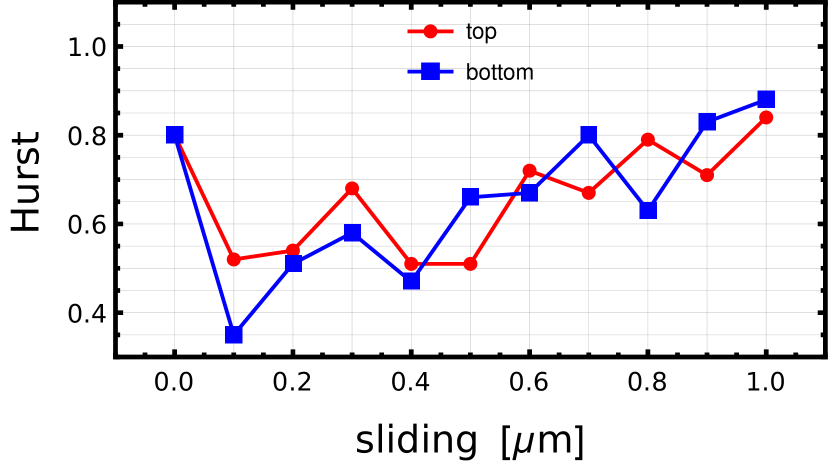
Figures 4(a), 4(b) and 4(c) show the roughness evolution corresponding to the cases presented in Figures 2, 3 and A.1. (supplementary material), respectively. The method to extract the exponent from the discrete data was outlined in Section 2.2. The initial values (before any sliding) are found to be, as expected, in the case of initially-flat surface and approximately in the two initially-rough cases.
| Surface | 1D analysis | 2D analysis |
|---|---|---|
| Initially flat, nanocrystalline bulk | 0.76 | 0.86 |
| Initially rough, nanocrystalline bulk | 0.81 | 0.80 |
| Initially rough, crystalline bulk | 0.78 | 0.86 |
3.5 1D line scans
Since the range of data for the PSDs does not span many decades, it is necessary to verify the self-affinity using further measures in addition to . Averaged 1D line scans of the final surfaces match reasonably well with the ones obtained directly from processing the complete 2D surfaces. See Table 1 for average Hurst exponents from 2D analysis (average between the values inferred from the top and bottom surfaces) and the 1D analysis (averaged over twenty scans, ten along the x direction and ten along y).
We provide plots of such results in supplementary material. Moreover, these scans yield an important piece of information: the Hurst exponents obtained from the 1D PSD predict well the ones of the height-to-height correlation function. This provides a consistency in self-affinity that palliates the lack of roughness information over many decades (Milanese et al., 2019), as would be desirable. Supplementary material figures, section B, show the fitting of the Hurst exponent from the 1D PSD on the left panel, while the right one shows the height correlation and the self-affine slope presumed from the Hurst exponent obtained from the PSD. We acknowledge that the exponent obtained from PSD analysis matches well the slope in the short correlation lengths, before the curves level. These plateaus already occur for height differences above the order of , but this is simply a result of the low values, which in turn are caused by the depletion of the bigger topography features during the wear process: correlations are only possible for features that actually exist, i.e., up to the order of .
4 Discussion
The main insight we can extract, c.f. Milanese et al. (2019), it is that, for this material and system size and configuration, the topography of the three surfaces seems to converge to a steady state, characterized by , independently both of the initial conditions (rough or flat) and of the microstructure of the bulk material. The latter remark is in agreement with the findings of Hinkle et al. (2020): material heterogeneity can have a strong influence on wear at this scale (Wattel et al., 2022), but it cannot be the controlling factor of roughness evolution; rather, discrete deformation mechanisms bear responsibility (Irani and Nicola, 2019, Hinkle et al., 2020); in our case, they amount primarily to wear by tearing of flakes of material (Milanese et al., 2020, Milanese and Molinari, 2020).
It is also remarkable how the initially-flat surface, Figures 2 and 4(a) appears to converge faster to the steady-state roughness regime, with smaller oscillations around a mean slightly greater than 0.8. This seems to indicate that the “memory” of the previous roughness in the other two cases takes longer to be erased. This is reminiscent of the memory length-scale that appears in rate-and-state friction laws (Scholz, 2019). In this context, the frictional state of the interface changes dynamically, reaching the new one after a transient. The extent of this transient is considered a function of the existing microcontacts, i.e, of the roughness. The numerical results seem to reflect this, since the “microcontact population” of the flat surface is very different from the one of the intially-rough surface. Micromechanically, this could be related to the need of attaining an intermediate “indifferent” roughness state (corresponding to , in which the probability of the vertical position of the next atoms is equally probable to be below or above the current one, i.e., the roughness follows a standard random walk). A similar observation is made by Hinkle et al. (2020). From the prior samples, it seems that the roughness may need to oscillate around these values before reaching the steady-state. In order to evolve into the intermediate regime, the features associated to the roughness have to be erased by wear, while in the flat case they are directly created by wear.
As mentioned in the introduction, simulations involving more ductile materials (either zinc, copper or aluminum) converged to surface welding in which both surfaces were joined together, plastically deforming to engulf the particles in their midst. For this brittle materials, the destiny may be the same in the long term: we acknowledge an ever-growing volume of the coated third bodies (Brink et al., 2022), which could ultimately agglomerate and bridge the gap between surfaces forming the aforementioned shear-band state. Hence, this steady-state could be conceived as an “intermediate asymptotics” state, that may seem locally stable but that can devolve into a shearband-like state over longer timescales. In practice, this final state may be avoided by other mechanisms acting on the said extended time spans. One of such is passivation: the coating atoms may react with the atmosphere and form in turn a composite layer that prevents the flake tearing process, thus deactivating the welding.
5 Final remarks
The roughness evolution induced by third-body wear has been studied using large-scale molecular dynamics simulations. Using conventional post-processing techniques (Jacobs et al., 2017), the self-affinity of the resulting surfaces has been verified, yielding in addition evidence as to the existence of convergence to roughness with . This final state, induced under certain circumstances (e.g., brittle enough material and abrasive wear particles), appears to display similar roughness characteristics independently of both the initial topography (either flat or rough with a higher surface roughness ) and bulk lattice structure (either single crystal or presence of grain boundaries).
We stress that this independence from bulk structure is consistent with Hinkle et al. (2020), and that these authors also reported the existence of a transient “random-walk” state () during the evolution of roughness prior to attainment of a steady state. We also emphasize that Hinkle et al. (2020) run purely plasticity-driven simulations, wherein neither third bodies nor fracture were present.
Acknowledgments
J. G.-S. and J.-F. M. gratefully acknowledge the sponsorship of the Swiss National Science Foundation (grant #197152, “Wear across scales”). Computing time was provided by a grant from the Swiss National Supercomputing Center (CSCS) under project IDs s784 (“The evolution of rough surfaces in the adhesive wear regime”) and s972 (“Surface and subsurface evolution of metals in three-body wear conditions”), as well as by École polytechnique fédérale de Lausanne (EPFL) through the use of the facilities of its Scientific IT and Application Support Center.
Supplementary material
Details concerning the intermediate results to obtain Hurst exponents are contained in the supplementary material document. The repository titled roughness_wear within the first author Github page (github.com/jgarciasuarez) contains Mathematica notebooks (Wolfram, 2000) detailing data post-processing leading to the results displayed in the text.
References
- Aghababaei (2019) R. Aghababaei. Effect of adhesion on material removal during adhesive wear. Phys. Rev. Mater., 3:063604, Jun 2019. doi: 10.1103/PhysRevMaterials.3.063604. URL https://link.aps.org/doi/10.1103/PhysRevMaterials.3.063604.
- Aghababaei et al. (2016) R. Aghababaei, D. H. Warner, and J.-F. Molinari. Critical length scale controls adhesive wear mechanisms. Nature Communications, 7(1):11816, Sept. 2016. doi: 10.1038/ncomms11816.
- Aghababaei et al. (2017) R. Aghababaei, D. H. Warner, and J.-F. Molinari. On the debris-level origins of adhesive wear. Proceedings of the National Academy of Sciences, 114(30):7935–7940, July 2017. doi: 10.1073/pnas.1700904114.
- Aghababaei et al. (2023) R. Aghababaei, E. E. Brodsky, J.-F. Molinari, and S. Chandrasekar. How roughness emerges on natural and engineered surfaces. MRS Bulletin, pages 1–8, 2023.
- ASME (2013) ASME, editor. The Relationship Between Surface Roughness and Corrosion, volume Volume 2B: Advanced Manufacturing of ASME International Mechanical Engineering Congress and Exposition, 11 2013. doi: 10.1115/IMECE2013-65498. URL https://doi.org/10.1115/IMECE2013-65498. V02BT02A054.
- Bonamy and Bouchaud (2011) D. Bonamy and E. Bouchaud. Failure of heterogeneous materials: A dynamic phase transition? Physics Reports, 498(1):1–44, 2011. ISSN 0370-1573. doi: https://doi.org/10.1016/j.physrep.2010.07.006. URL https://www.sciencedirect.com/science/article/pii/S0370157310002115.
- Bouchaud and Bouchaud (1994) E. Bouchaud and J.-P. Bouchaud. Fracture surfaces: Apparent roughness, relevant length scales, and fracture toughness. Phys. Rev. B, 50:17752–17755, Dec 1994. doi: 10.1103/PhysRevB.50.17752. URL https://link.aps.org/doi/10.1103/PhysRevB.50.17752.
- Bowden and Tabor (2001) F. P. Bowden and D. Tabor. The friction and lubrication of solids, volume 1. Oxford university press, 2001.
- Brink and Molinari (2019) T. Brink and J.-F. Molinari. Adhesive wear mechanisms in the presence of weak interfaces: Insights from an amorphous model system. Phys. Rev. Mater., 3(5):053604, May 2019. doi: 10.1103/PhysRevMaterials.3.053604. URL https://link.aps.org/doi/10.1103/PhysRevMaterials.3.053604.
- Brink et al. (2022) T. Brink, E. Milanese, and J.-F. Molinari. Effect of wear particles and roughness on nanoscale friction. Phys. Rev. Mater., 6:013606, Jan 2022. doi: 10.1103/PhysRevMaterials.6.013606. URL https://link.aps.org/doi/10.1103/PhysRevMaterials.6.013606.
- Brown and Yamada (2013) W. M. Brown and M. Yamada. Implementing molecular dynamics on hybrid high performance computers—Three-body potentials. Comput. Phys. Commun., 184(12):2785–2793, Dec. 2013. ISSN 0010-4655. doi: 10.1016/j.cpc.2013.08.002. URL http://www.sciencedirect.com/science/article/pii/S0010465513002634.
- Brown et al. (2011) W. M. Brown, P. Wang, S. J. Plimpton, and A. N. Tharrington. Implementing molecular dynamics on hybrid high performance computers – short range forces. Comput. Phys. Commun., 182(4):898–911, Apr. 2011. ISSN 0010-4655. doi: 10.1016/j.cpc.2010.12.021. URL http://www.sciencedirect.com/science/article/pii/S0010465510005102.
- Candela and Brodsky (2016) T. Candela and E. E. Brodsky. The minimum scale of grooving on faults. Geology, 44(8):603–606, 08 2016. ISSN 0091-7613. doi: 10.1130/G37934.1. URL https://doi.org/10.1130/G37934.1.
- Derlet and Van Swygenhoven (2003) P. M. Derlet and H. Van Swygenhoven. Atomic positional disorder in fcc metal nanocrystalline grain boundaries. Phys. Rev. B, 67:014202, Jan 2003. doi: 10.1103/PhysRevB.67.014202. URL https://link.aps.org/doi/10.1103/PhysRevB.67.014202.
- Dieterich and Kilgore (1994) J. H. Dieterich and B. D. Kilgore. Direct observation of frictional contacts: New insights for state-dependent properties. Pure and Applied Geophysics, 143(1):283–302, 1994.
- Eder et al. (2015) S. J. Eder, G. Feldbauer, D. Bianchi, U. Cihak-Bayr, G. Betz, and A. Vernes. Applicability of macroscopic wear and friction laws on the atomic length scale. Phys. Rev. Lett., 115:025502, Jul 2015. doi: 10.1103/PhysRevLett.115.025502. URL https://link.aps.org/doi/10.1103/PhysRevLett.115.025502.
- Evans (2010) L. C. Evans. Partial differential equations. American Mathematical Society, Providence, R.I., 2010.
- Frérot et al. (2020) L. Frérot, G. Anciaux, V. Rey, S. Pham-Ba, and J.-F. Molinari. Tamaas: a library for elastic-plastic contact of periodic rough surfaces. Journal of Open Source Software, 5(51):2121, 2020.
- Garcia-Suarez et al. (2023) J. Garcia-Suarez, T. Brink, and J.-F. Molinari. Breakdown of reye’s theory in nanoscale wear. Journal of the Mechanics and Physics of Solids, 173:105236, 2023. ISSN 0022-5096. doi: https://doi.org/10.1016/j.jmps.2023.105236. URL https://www.sciencedirect.com/science/article/pii/S0022509623000406.
- Godet (1984) M. Godet. The third-body approach: A mechanical view of wear. Wear, 100(1):437–452, 1984. ISSN 0043-1648. doi: https://doi.org/10.1016/0043-1648(84)90025-5. URL https://www.sciencedirect.com/science/article/pii/0043164884900255.
- Hinkle et al. (2020) A. R. Hinkle, W. G. Nöhring, R. Leute, T. Junge, and L. Pastewka. The emergence of small-scale self-affine surface roughness from deformation. Science Advances, 6(7):eaax0847, 2020. doi: 10.1126/sciadv.aax0847. URL https://www.science.org/doi/abs/10.1126/sciadv.aax0847.
- Holland and Marder (1998a) D. Holland and M. Marder. Ideal brittle fracture of silicon studied with molecular dynamics. Physical Review Letters, 80:746–749, 1998a. doi: 10.1103/PhysRevLett.80.746.
- Holland and Marder (1998b) D. Holland and M. Marder. Erratum: Ideal brittle fracture of silicon studied with molecular dynamics [Phys. Rev. Lett. 80, 746 (1998)]. Physical Review Letters, 81:4029–4029, 1998b. doi: 10.1103/PhysRevLett.81.4029.
- Irani and Nicola (2019) N. Irani and L. Nicola. Modelling surface roughening during plastic deformation of metal crystals under contact shear loading. Mechanics of Materials, 132:66–76, 2019. ISSN 0167-6636. doi: https://doi.org/10.1016/j.mechmat.2019.02.007. URL https://www.sciencedirect.com/science/article/pii/S0167663618306227.
- Jacobs et al. (2017) T. D. B. Jacobs, T. Junge, and L. Pastewka. Quantitative characterization of surface topography using spectral analysis. Surface Topography: Metrology and Properties, 5(1):013001, jan 2017. doi: 10.1088/2051-672X/aa51f8. URL https://dx.doi.org/10.1088/2051-672X/aa51f8.
- Mandelbrot and Van Ness (1968) B. B. Mandelbrot and J. W. Van Ness. Fractional brownian motions, fractional noises and applications. SIAM review, 10(4):422–437, 1968.
- Milanese and Molinari (2020) E. Milanese and J.-F. Molinari. A mechanistic model for the growth of cylindrical debris particles in the presence of adhesion. International Journal of Solids and Structures, 203:1–16, 2020. ISSN 0020-7683. doi: https://doi.org/10.1016/j.ijsolstr.2020.06.040. URL https://www.sciencedirect.com/science/article/pii/S0020768320302626.
- Milanese et al. (2019) E. Milanese, T. Brink, R. Aghababaei, and J.-F. Molinari. Emergence of self-affine surfaces during adhesive wear. Nature communications, 10(1):1–9, 2019.
- Milanese et al. (2020) E. Milanese, T. Brink, R. Aghababaei, and J.-F. Molinari. Role of interfacial adhesion on minimum wear particle size and roughness evolution. Phys. Rev. E, 102:043001, Oct 2020. doi: 10.1103/PhysRevE.102.043001. URL https://link.aps.org/doi/10.1103/PhysRevE.102.043001.
- Mo et al. (2009) Y. Mo, K. T. Turner, and I. Szlufarska. Friction laws at the nanoscale. Nature, 457(7233):1116–1119, 2009.
- Persson et al. (2004) B. N. J. Persson, O. Albohr, U. Tartaglino, A. I. Volokitin, and E. Tosatti. On the nature of surface roughness with application to contact mechanics, sealing, rubber friction and adhesion. Journal of Physics: Condensed Matter, 17(1):R1, dec 2004. doi: 10.1088/0953-8984/17/1/R01. URL https://dx.doi.org/10.1088/0953-8984/17/1/R01.
- Renard et al. (2013) F. Renard, T. Candela, and E. Bouchaud. Constant dimensionality of fault roughness from the scale of micro-fractures to the scale of continents. Geophysical Research Letters, 40(1):83–87, 2013. doi: https://doi.org/10.1029/2012GL054143. URL https://agupubs.onlinelibrary.wiley.com/doi/abs/10.1029/2012GL054143.
- Scholz (2019) C. H. Scholz. The Mechanics of Earthquakes and Faulting. Cambridge University Press, 3 edition, 2019. doi: 10.1017/9781316681473.
- Sharp et al. (2017) T. A. Sharp, L. Pastewka, V. L. Lignères, and M. O. Robbins. Scale- and load-dependent friction in commensurate sphere-on-flat contacts. Phys. Rev. B, 96:155436, Oct 2017. doi: 10.1103/PhysRevB.96.155436. URL https://link.aps.org/doi/10.1103/PhysRevB.96.155436.
- Sorensen et al. (1996) M. R. Sorensen, K. W. Jacobsen, and P. Stoltze. Simulations of atomic-scale sliding friction. Phys. Rev. B, 53:2101–2113, Jan 1996. doi: 10.1103/PhysRevB.53.2101. URL https://link.aps.org/doi/10.1103/PhysRevB.53.2101.
- Spijker et al. (2011) P. Spijker, G. Anciaux, and J.-F. Molinari. Dry sliding contact between rough surfaces at the atomistic scale. Tribology Letters, 44:279–285, 2011.
- Stillinger and Weber (1985) F. H. Stillinger and T. A. Weber. Computer simulation of local order in condensed phases of silicon. Physical Review B, 31:5262–5271, Apr 1985. doi: 10.1103/PhysRevB.31.5262.
- Stoyanov et al. (2013) P. Stoyanov, P. A. Romero, T. T. Järvi, L. Pastewka, M. Scherge, P. Stemmer, A. Fischer, M. Dienwiebel, and M. Moseler. Experimental and numerical atomistic investigation of the third body formation process in dry tungsten/tungsten-carbide tribo couples. Tribology Letters, 50:67–80, 2013.
- Stukowski (2009) A. Stukowski. Visualization and analysis of atomistic simulation data with OVITO–the open visualization tool. Modelling and Simulation in Materials Science and Engineering, 18(1):015012, dec 2009. doi: 10.1088/0965-0393/18/1/015012.
- Stukowski (2014) A. Stukowski. Computational analysis methods in atomistic modeling of crystals. JOM, 66(3):399–407, Mar. 2014. ISSN 1047-4838, 1543-1851. doi: 10.1007/s11837-013-0827-5. URL https://link.springer.com/article/10.1007/s11837-013-0827-5.
- Sundaram et al. (2012) N. K. Sundaram, Y. Guo, and S. Chandrasekar. Mesoscale folding, instability, and disruption of laminar flow in metal surfaces. Phys. Rev. Lett., 109:106001, Sep 2012. doi: 10.1103/PhysRevLett.109.106001. URL https://link.aps.org/doi/10.1103/PhysRevLett.109.106001.
- Thompson et al. (2022) A. P. Thompson, H. M. Aktulga, R. Berger, D. S. Bolintineanu, W. M. Brown, P. S. Crozier, P. J. in ’t Veld, A. Kohlmeyer, S. G. Moore, T. D. Nguyen, R. Shan, M. J. Stevens, J. Tranchida, C. Trott, and S. J. Plimpton. LAMMPS - a flexible simulation tool for particle-based materials modeling at the atomic, meso, and continuum scales. Comput. Phys. Commun., 271:108171, Feb. 2022. ISSN 0010-4655. doi: 10.1016/j.cpc.2021.108171. https://lammps.org/.
- Wattel et al. (2022) S. Wattel, J. Garcia-Suarez, and J.-F. Molinari. Understanding the mechanisms of adhesive wear for heterogeneous materials through atomistic simulations. Extreme Mechanics Letters, 57:101913, 2022. ISSN 2352-4316. doi: https://doi.org/10.1016/j.eml.2022.101913. URL https://www.sciencedirect.com/science/article/pii/S2352431622001894.
- Wolfram (2000) S. Wolfram. The mathematica book, volume 4. Cambridge University Press Cambridge, 2000.
- Wu (2000) J.-J. Wu. Simulation of rough surfaces with FFT. Tribol. Int., 33(1):47–58, Jan. 2000. ISSN 0301-679X. doi: 10.1016/S0301-679X(00)00016-5. URL http://www.sciencedirect.com/science/article/pii/S0301679X00000165.
- Yang et al. (2016) Y. Yang, L. Huang, and Y. Shi. Adhesion suppresses atomic wear in single-asperity sliding. Wear, 352-353:31–41, 2016. ISSN 0043-1648. doi: https://doi.org/10.1016/j.wear.2016.02.002. URL https://www.sciencedirect.com/science/article/pii/S0043164816000351.
- Zanoria and Danyluk (1993) E. Zanoria and S. Danyluk. Ball-on-flat reciprocating sliding wear of single-crystal, semiconductor silicon at room temperature. Wear, 162-164:332–338, 1993. ISSN 0043-1648. doi: https://doi.org/10.1016/0043-1648(93)90516-O. URL https://www.sciencedirect.com/science/article/pii/004316489390516O. Wear of Materials: Proceedings of the 9th International Conference.
- Zanoria et al. (1995a) E. Zanoria, S. Danyluk, and M. McNallan. Effects of length, diameter and population density of tribological rolls on friction between self-mated silicon. Wear, 181-183:784–789, 1995a. ISSN 0043-1648. doi: https://doi.org/10.1016/0043-1648(95)90196-5. URL https://www.sciencedirect.com/science/article/pii/0043164895901965. 10th International Conference on Wear of Materials.
- Zanoria et al. (1995b) E. S. Zanoria, S. Danyluk, and M. J. Mcnallan. Formation of cylindrical sliding-wear debris on silicon in humid conditions and elevated temperatures. Tribology Transactions, 38(3):721–727, 1995b. doi: 10.1080/10402009508983464. URL https://doi.org/10.1080/10402009508983464.