New Active Galactic Nuclei Detected by the ART-XC and eROSITA Telescopes during the First Five SRG All-Sky X-ray Surveys–LABEL:lastpage
New Active Galactic Nuclei Detected by the ART-XC and eROSITA Telescopes during the First Five SRG All-Sky X-ray Surveys
Abstract
We present the results of our identification of 14 X-ray sources detected in the eastern Galactic sky ( ) in the 4–12 keV energy band on the combined map of the first five all-sky surveys (from December 2019 to March 2022) with the Mikhail Pavlinsky ART-XC telescope onboard the SRG observatory. All 14 sources are reliably detected by the SRG/eROSITA telescope in the 0.2–8 keV energy band. Six of them have been detected in X-rays for the first time, while the remaining ones have already been known previously as X-ray sources, but their nature has remained unknown. We have taken optical spectra for 12 sources with the 1.6-m AZT-33IK telescope at the Sayan Observatory (the Institute of Solar–Terrestrial Physics, the Siberian Branch of the Russian Academy of Sciences). For two more objects we have analyzed the archival spectra taken during the 6dF survey. All objects have turned out to be Seyfert galaxies (one NLSy1, three Sy1, four Sy1.9, and six Sy2) at redshifts –0.238. Based on data from the eROSITA and ART-XC telescopes onboard the SRG observatory, we have obtained X-ray spectra for all objects in the energy range 0.2–12 keV. In four of them the intrinsic absorption exceeds cm-2 at a 90% confidence level, with one of them being probably heavily obscured ( cm-2 with 90% confidence). This paper continues our series of publications on the identification of hard X-ray sources detected during the all-sky survey with the SRG orbital X-ray observatory.
Keywords: active galactic nuclei, sky surveys, optical observations, redshifts, X-ray observations
1 INTRODUCTION
The Spectrum–RG (SRG) orbital observatory (Sunyaev et al., 2021) has conducted an all-sky X-ray survey since December 2019. There are two telescopes with grazing-incidence X-ray optics onboard the satellite: eROSITA (Predehl et al., 2021) and Mikhail Pavlinsky ART-XC (Pavlinsky et al., 2021) operating in the 0.2–9 and 4–30 keV energy bands, respectively. A total of eight full sky surveys, each with a duration of six months, are planned to be conducted. The first two surveys were completed in December 2020, and the first catalog of X-ray sources (ARTSS12) detected with the ART-XC telescope in the 4–12 keV energy band was produced from their results (Pavlinsky et al., 2022). Among 867 sources it contains dozens of astrophysical objects (the exact number is unknown, since there are false X-ray sources in the catalog) whose nature was unknown when the catalog was released, with some of them having not been detected previously in X-rays.
The SRG/ART-XC all-sky survey allows representative samples of such classes of objects as active galactic nuclei (AGNs) and cataclysmic variables (CVs) to be obtained. Therefore, it is important to identify a maximally large number of new objects detected during the survey. Such a work was begun when producing the ARTSS12 catalog and is continued at present. The optical observations being carried out with the 1.6-m AZT-33IK telescope at the Sayan Observatory (the Institute of Solar-Terrestrial Physics, the Siberian Branch of the Russian Academy of Sciences) and the 1.5-m Russian–Turkish telescope (RTT-150) at the TÜBITAK National Observatory incorporated into the SRG ground support complex play a major role in this work. The first results of this observational campaign were presented in Zaznobin et al. (2021); Uskov et al. (2022); Zaznobin et al. (2022), where the identification of 25 AGNs (including eight objects from the archival data of the spectroscopic 6dF survey, Jones et al. 2004) and three CVs was reported. In addition, during the SRG/ART-XC sky survey several X-ray binaries with neutron stars and black holes were discovered and then identified (Lutovinov et al., 2022; Mereminskiy et al., 2022).
The fourth SRG all-sky survey was completed in December 2021, and approximately a third of the sky had been scanned for the fifth time by March 7, 2022. Then, the all-sky survey was suspended, and the ART-XC telescope began to conduct a deep survey of the sky along the Galactic plane. At present, the work on producing the catalog of sources detected by the ART-XC telescope based on data from the first five surveys (below we will use precisely this wording, although the fifth survey has not been completed), ARTSS1-5, is being completed. Many new objects appeared in the new catalog, and the work on their identification is underway.
In this paper we present the results of our identification and classification of 14 AGNs selected among the hard X-ray sources from the ARTSS1-5 catalog in the eastern Galactic half of the sky (). All these sources are reliably detected by the SRG/eROSITA telescope in the 0.2–8 keV energy band. We analyzed the broadband X-ray spectra obtained from the eROSITA and ART-XC data and the optical spectra taken by us with the AZT-33IK telescope and previously during the 6dF survey. To calculate the luminosities of the objects, we use the model of a flat Universe with parameters km s-1 Mpc-1, .
2 THE SAMPLE OF OBJECTS, OBSERVATIONS
| eROSITA source | Optical counterpart | |||||||||
|---|---|---|---|---|---|---|---|---|---|---|
| № | ART-XC source | Discovered | ||||||||
| 1 | SRGA J001439.6183503 | 3.66955 | 18.58246 | 11.0\arcsec | 3.66712 | 18.58203 | 10.6\arcsec | 8.4\arcsec | XMM, Swift | |
| 2 | SRGA J002240.8804348 | 5.68178 | 80.72962 | 2.2\arcsec | 5.68204 | 80.72947 | 7.2\arcsec | 0.6\arcsec | ROSAT | |
| 3 | SRGA J010742.9574419 | 16.92936 | 57.73894 | 2.7\arcsec | 16.92964 | 57.73825 | 2.2\arcsec | 2.6\arcsec | SRG | |
| 4 | SRGA J021227.3520953 | 33.11066 | 52.16487 | 2.5\arcsec | 33.11032 | 52.16483 | 7.6\arcsec | 0.8\arcsec | ROSAT | |
| 5 | SRGA J025208.4482955 | 43.04074 | 48.49992 | 2.7\arcsec | 43.04017 | 48.49983 | 13.1\arcsec | 1.4\arcsec | ROSAT | |
| 6 | SRGA J045432.1524003 | 73.63236 | 52.66875 | 2.8\arcsec | 73.63262 | 52.66847 | 4.3\arcsec | 1.2\arcsec | SRG | |
| 7 | SRGA J051313.5662747 | 78.31903 | 66.46429 | 3.2\arcsec | 78.31846 | 66.46398 | 17.9\arcsec | 1.4\arcsec | Swift | |
| 8 | SRGA J110945.8800815 | 167.43408 | 80.13535 | 5.5\arcsec | 167.43237 | 80.13489 | 10.8\arcsec | 2.0\arcsec | SRG | |
| 9 | SRGA J161251.4052100 | 243.21307 | -5.35506 | 3.0\arcsec | 243.21342 | -5.35485 | 17.7\arcsec | 1.5\arcsec | ROSAT | |
| 10 | SRGA J161943.7132609 | 244.93418 | -13.43768 | 3.4\arcsec | 244.93354 | -13.43781 | 8.7\arcsec | 2.3\arcsec | SRG | |
| 11 | SRGA J182109.8765819 | 275.29902 | 76.97126 | 5.4\arcsec | 275.29846 | 76.97139 | 6.5\arcsec | 0.7\arcsec | SRG | |
| 12 | SRGA J193707.6660816 | 294.28375 | 66.13904 | 2.1\arcsec | 294.28417 | 66.13925 | 6.4\arcsec | 1.0\arcsec | ROSAT | |
| 13 | SRGA J200331.2701332 | 300.89093 | 70.22678 | 2.2\arcsec | 300.89162 | 70.22692 | 15.0\arcsec | 1.0\arcsec | ROSAT | |
| 14 | SRGA J211149.5722815 | 317.96266 | 72.47104 | 3.0\arcsec | 317.96575 | 72.47122 | 10.4\arcsec | 3.4\arcsec | SRG | |
Column 1: the ordinal source number in the sample being studied. Column 2: the source name from the preliminary ARTSS1-5 catalog (the coordinates of the X-ray sources used in the names are given for epoch J2000.0). Column 3, 4: the source coordinates from the eROSITA data. Column 5: the radius of the 98% eROSITA position error circle. Column 6, 7: the coordinates of the suspected optical counterpart. Column 8: the angular separation between the ART-XC source and the optical counterpart. Column 9: the angular separation between the eROSITA source and the optical counterpart. Column 10: the average 4–12 keV X-ray flux from the sum of five ART-XC sky surveys, in units of erg s-1 cm-2. Column 11: the orbital observatory that detected the X-ray source for the first time.
Objects from the catalog of sources detected in the 4–12 keV energy band on the combined map of the first five SRG/ART-XC sky surveys (from December 12, 2019, to March 7, 2022) (the ARTSS1-5 catalog, being prepared for publication) constitutes the sample. We considered only point sources from this catalog detected at a confidence level no less than 4.5 standard deviations in the half of the sky (for which we also have SRG/eROSITA data). The sample includes a total of 14 objects.
Table 1 for all objects gives the coordinates of the X-ray source from the ART-XC and eROSITA data, the radius of the eROSITA position error circle (at 98% confidence), the coordinates of the suspected optical counterpart (see the Section Results), the angular separation between the X-ray source (from the ART-XC and eROSITA data) and the optical counterpart, the flux in the 4–12 keV energy band (from the ART-XC data), and the name of the observatory that detected the source in X-rays for the first time. Six sources were detected for the first time with the ART-XC and eROSITA telescopes onboard the SRG observatory.
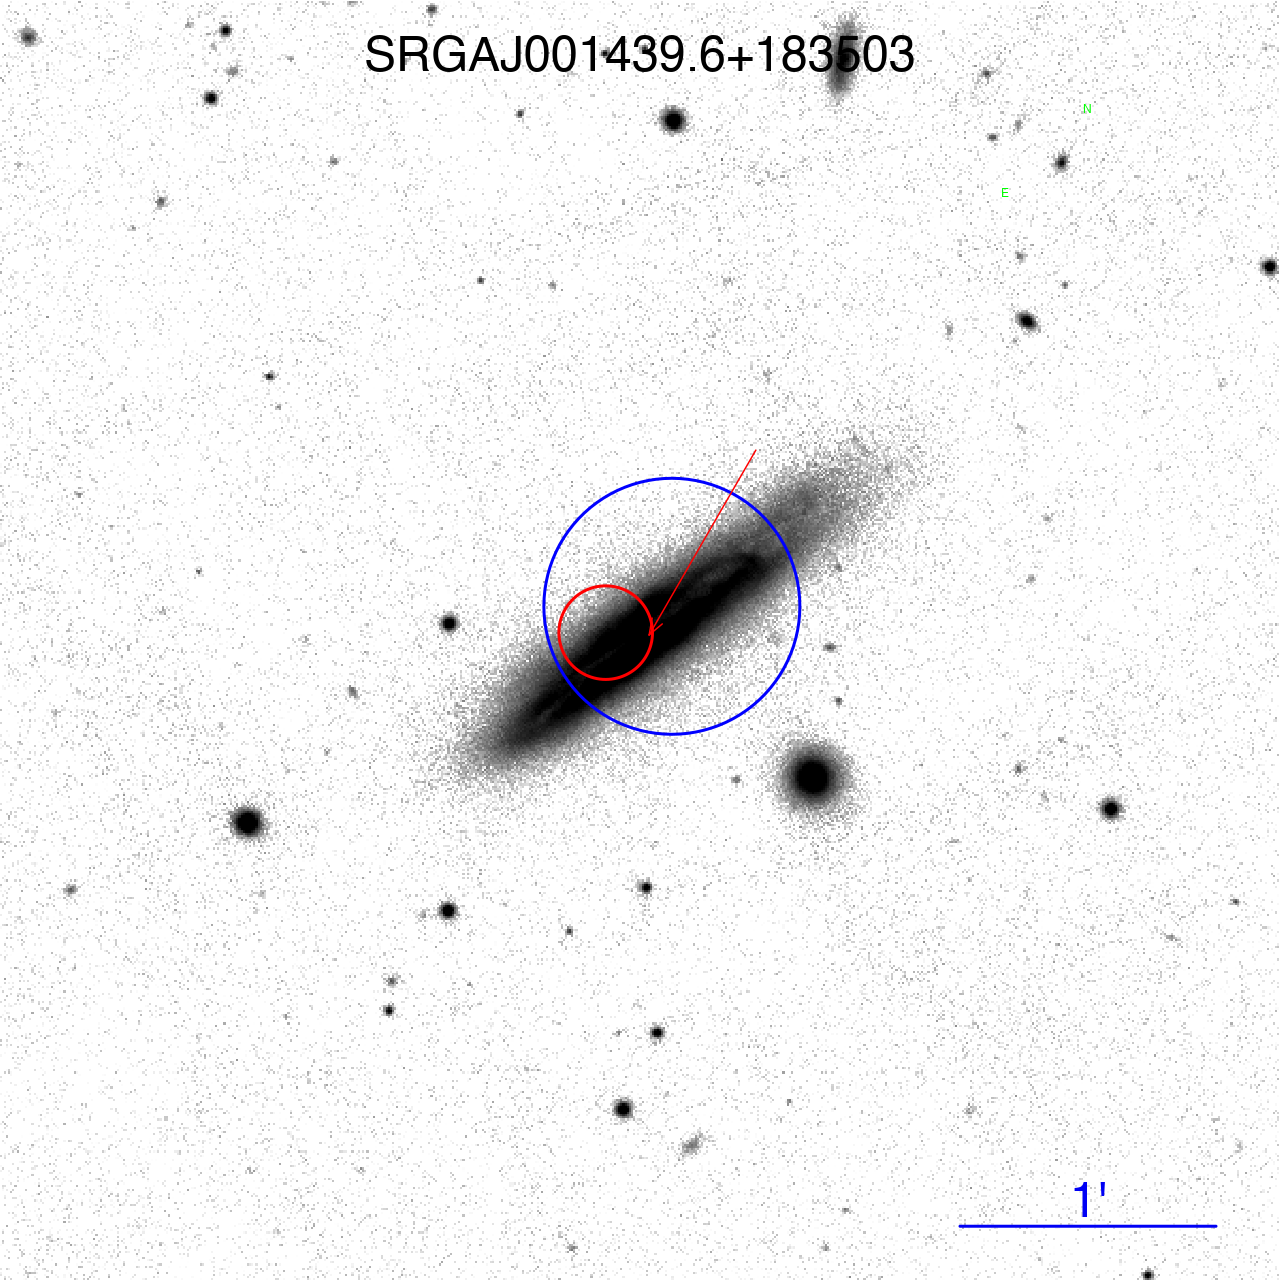
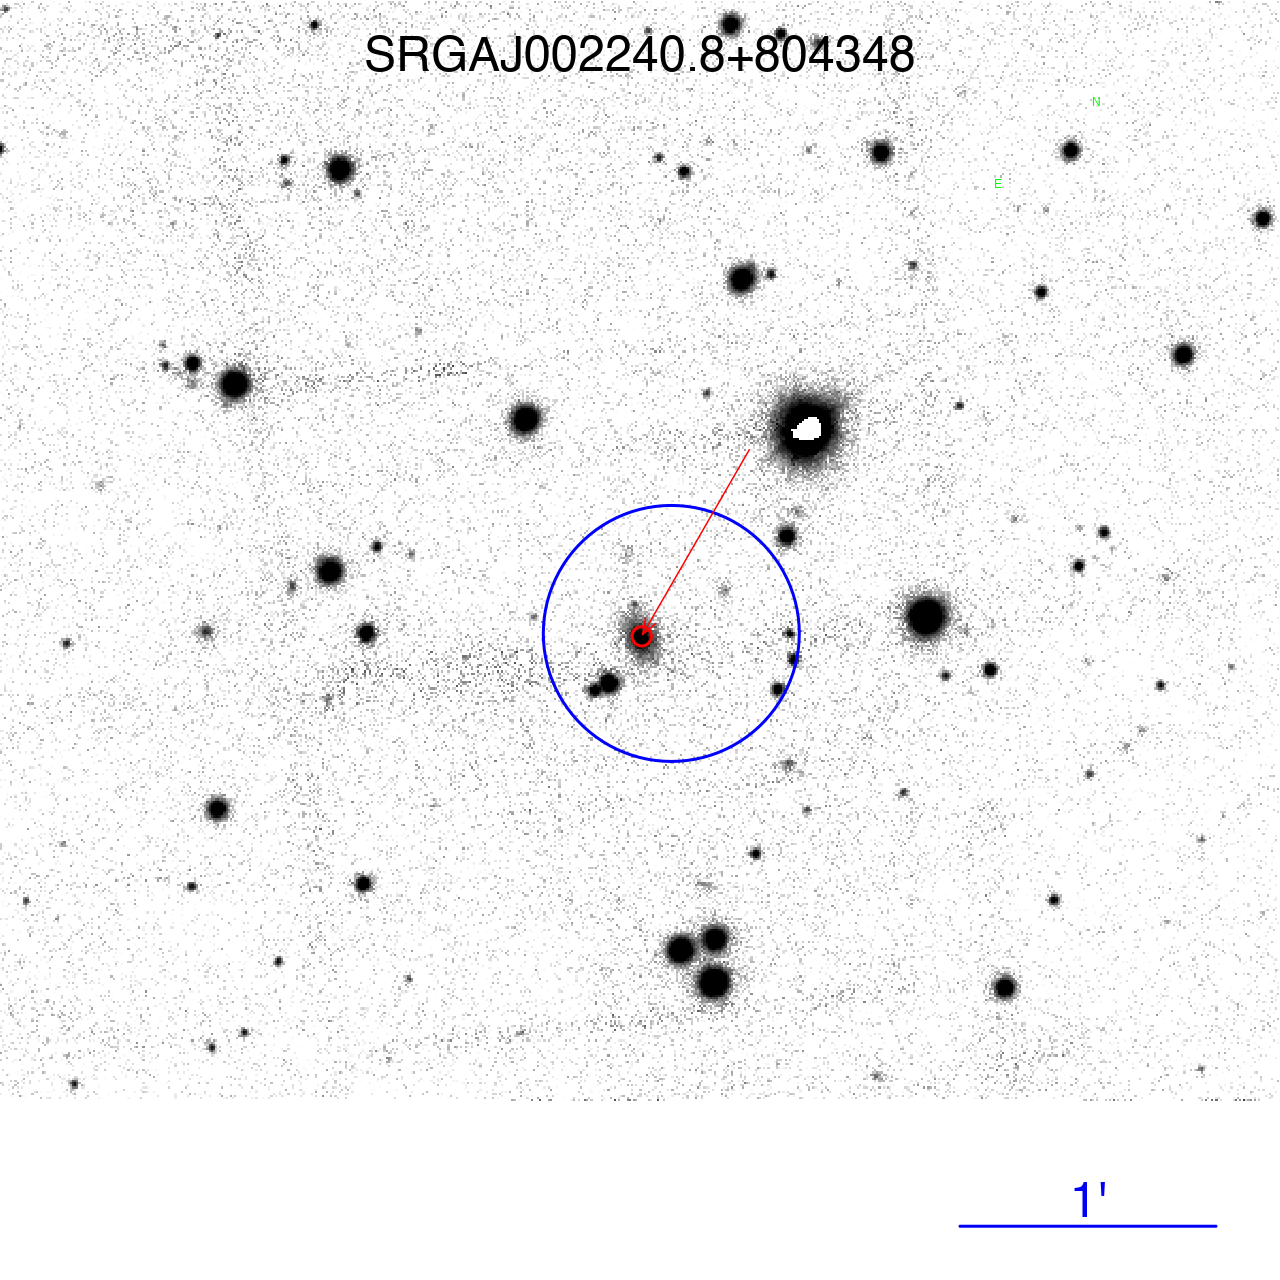
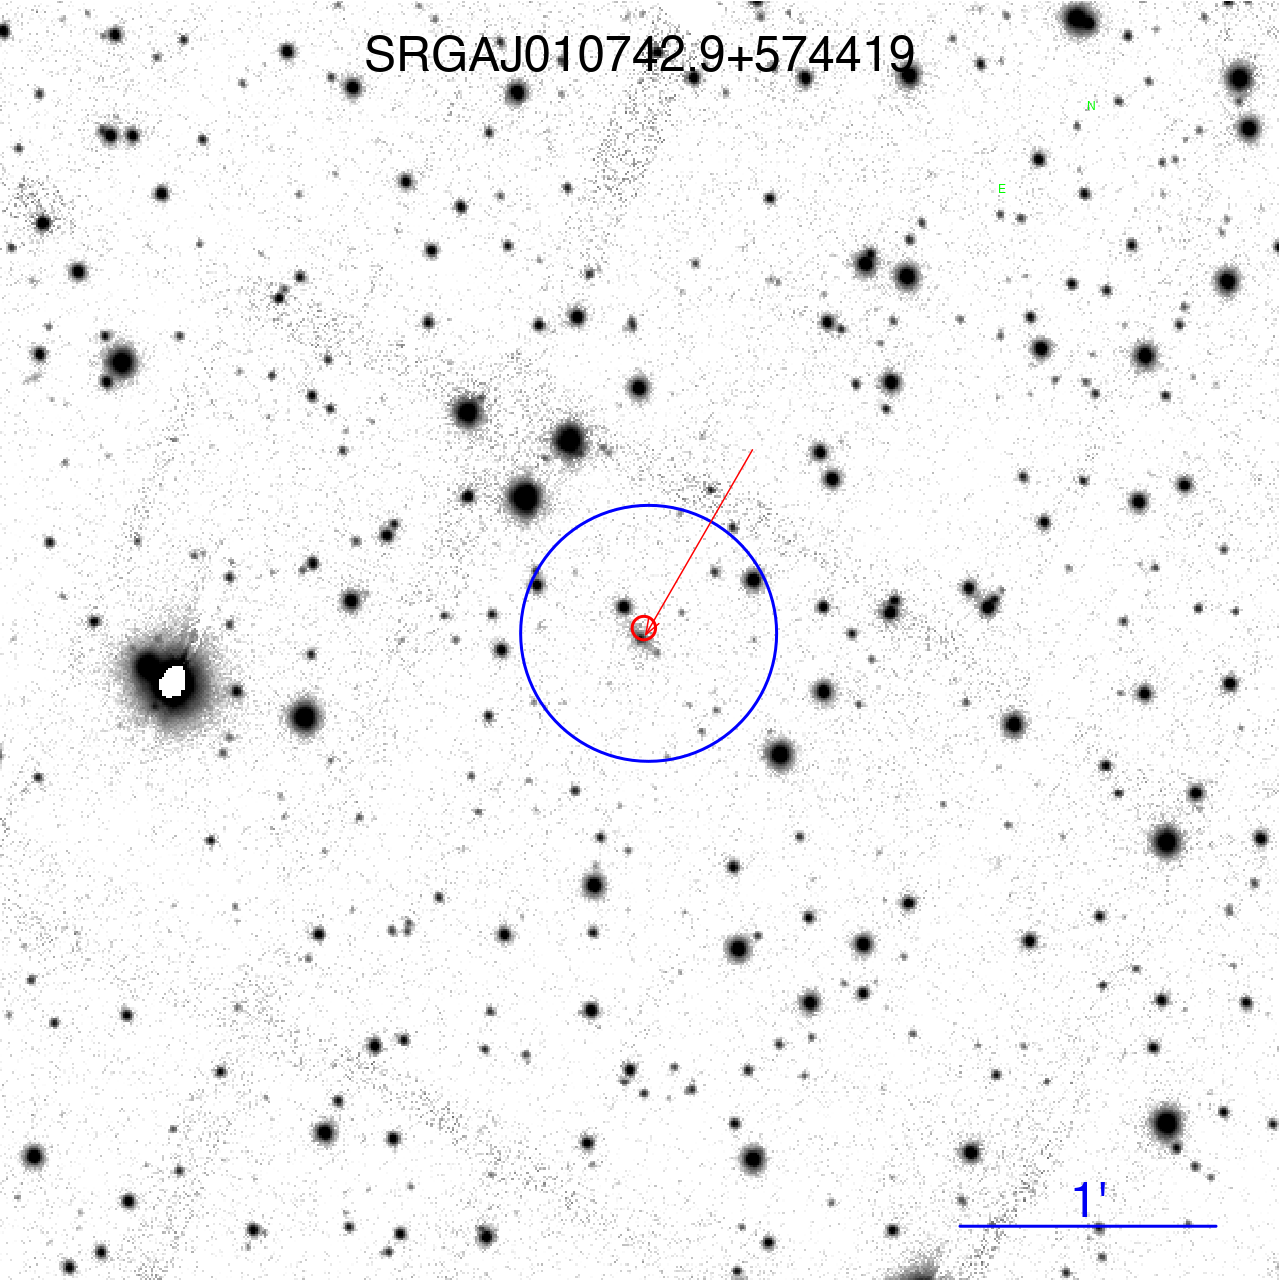
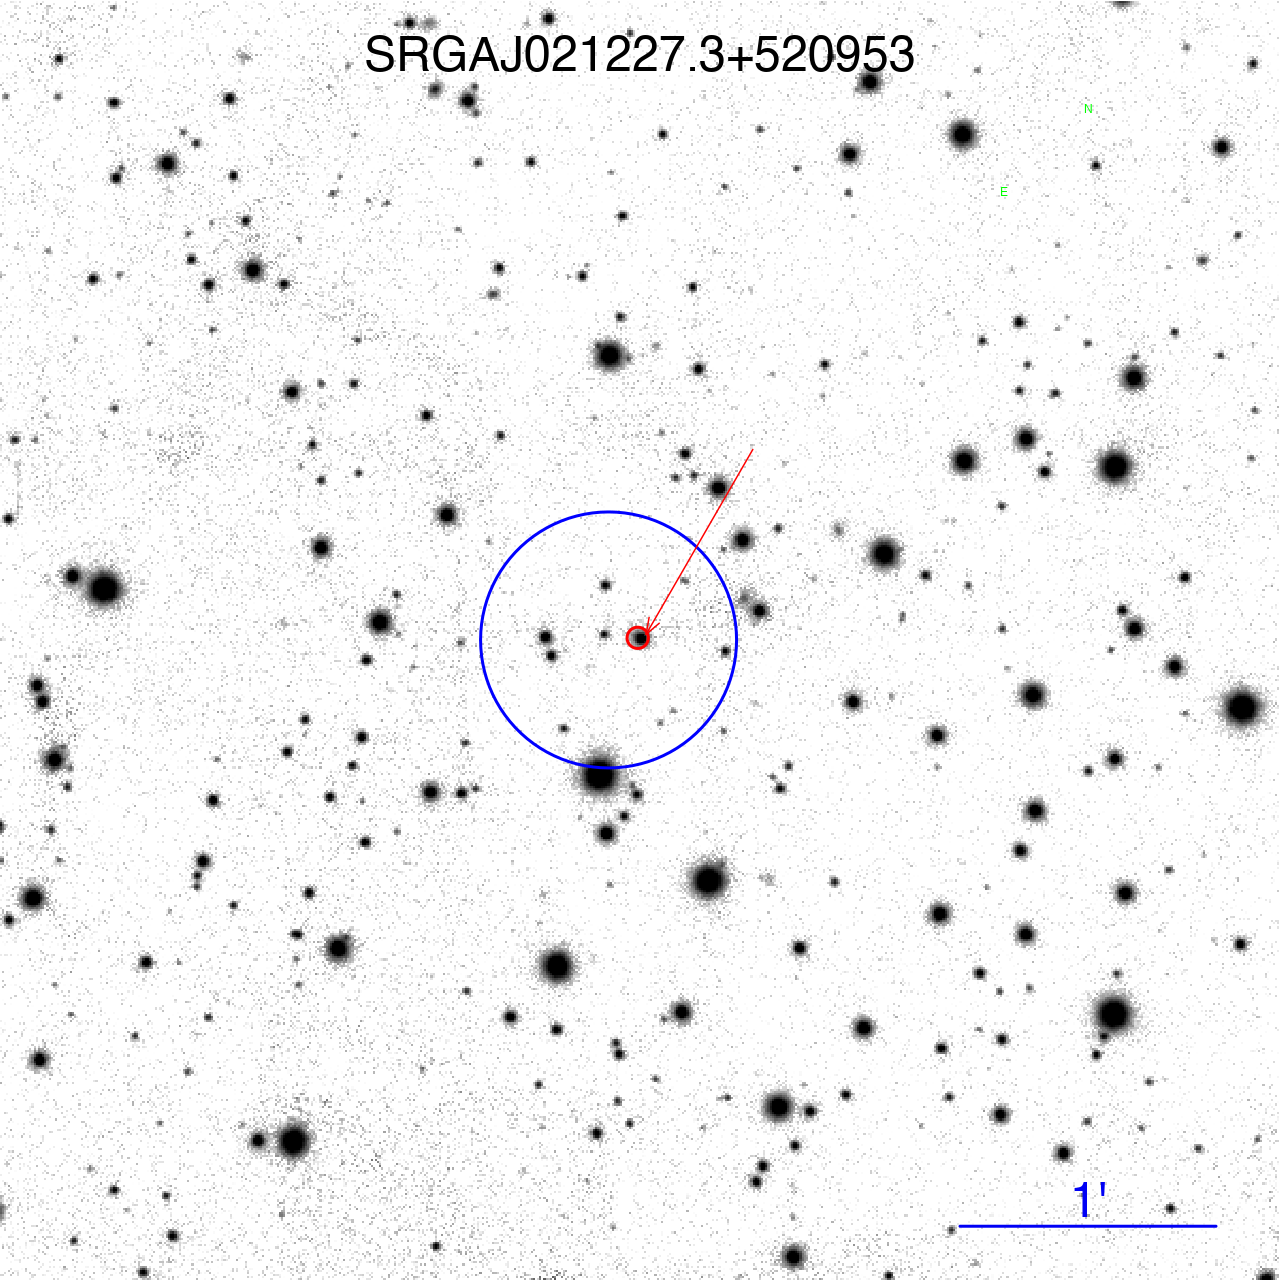
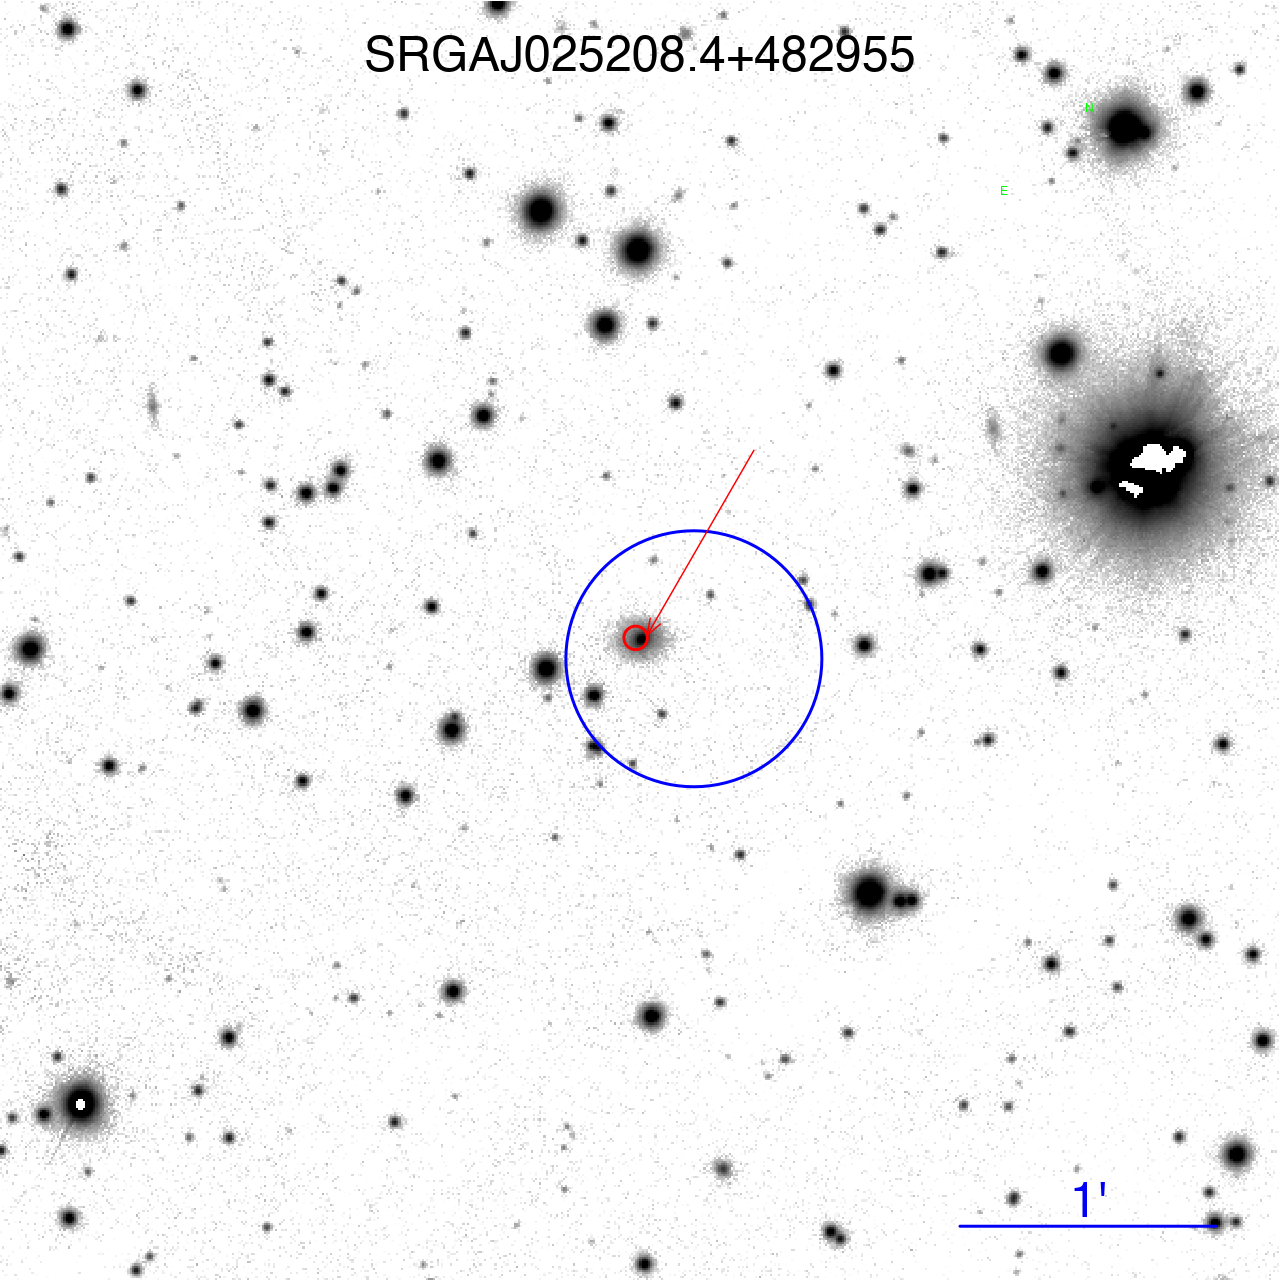
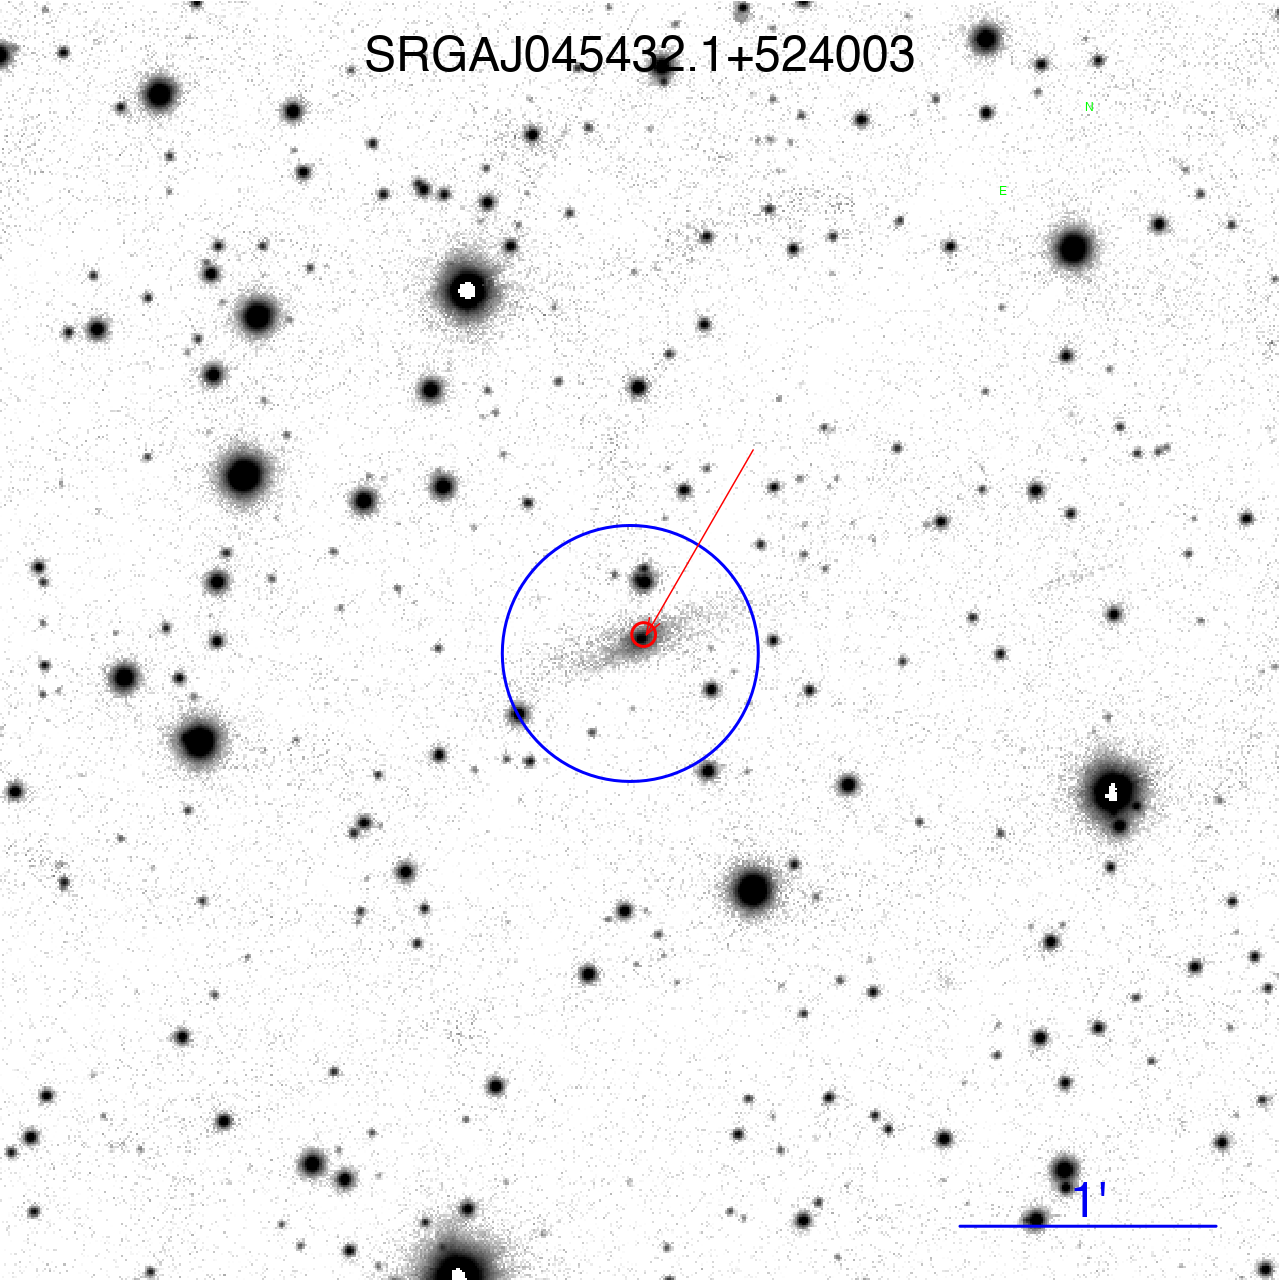
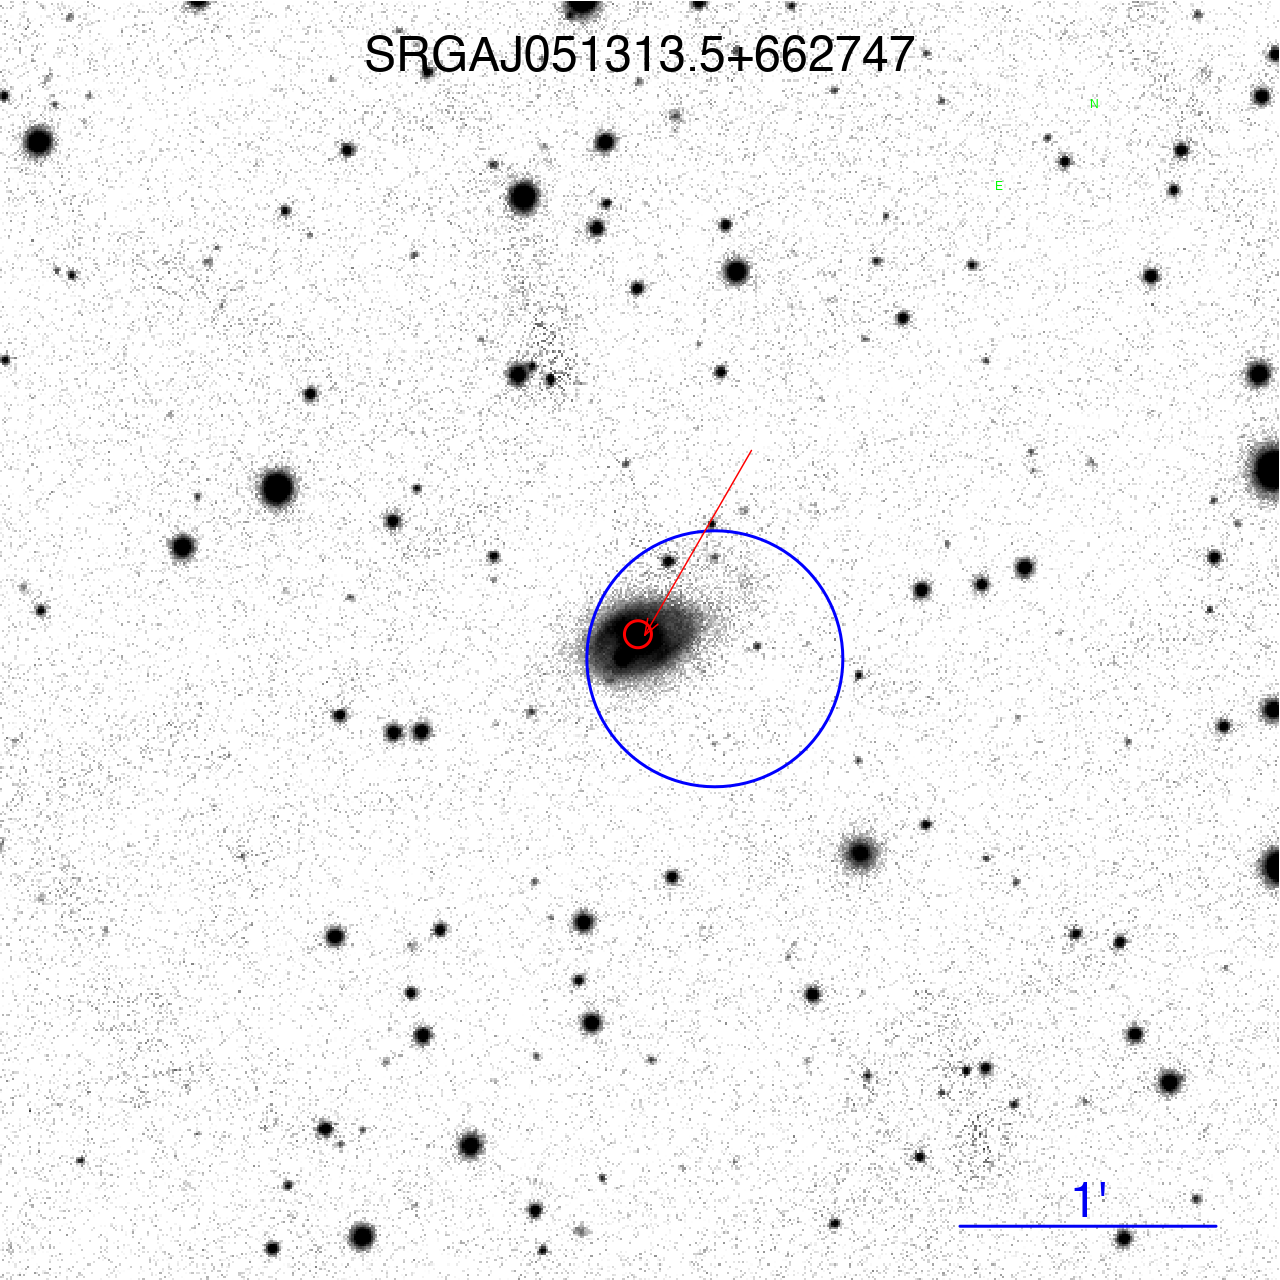
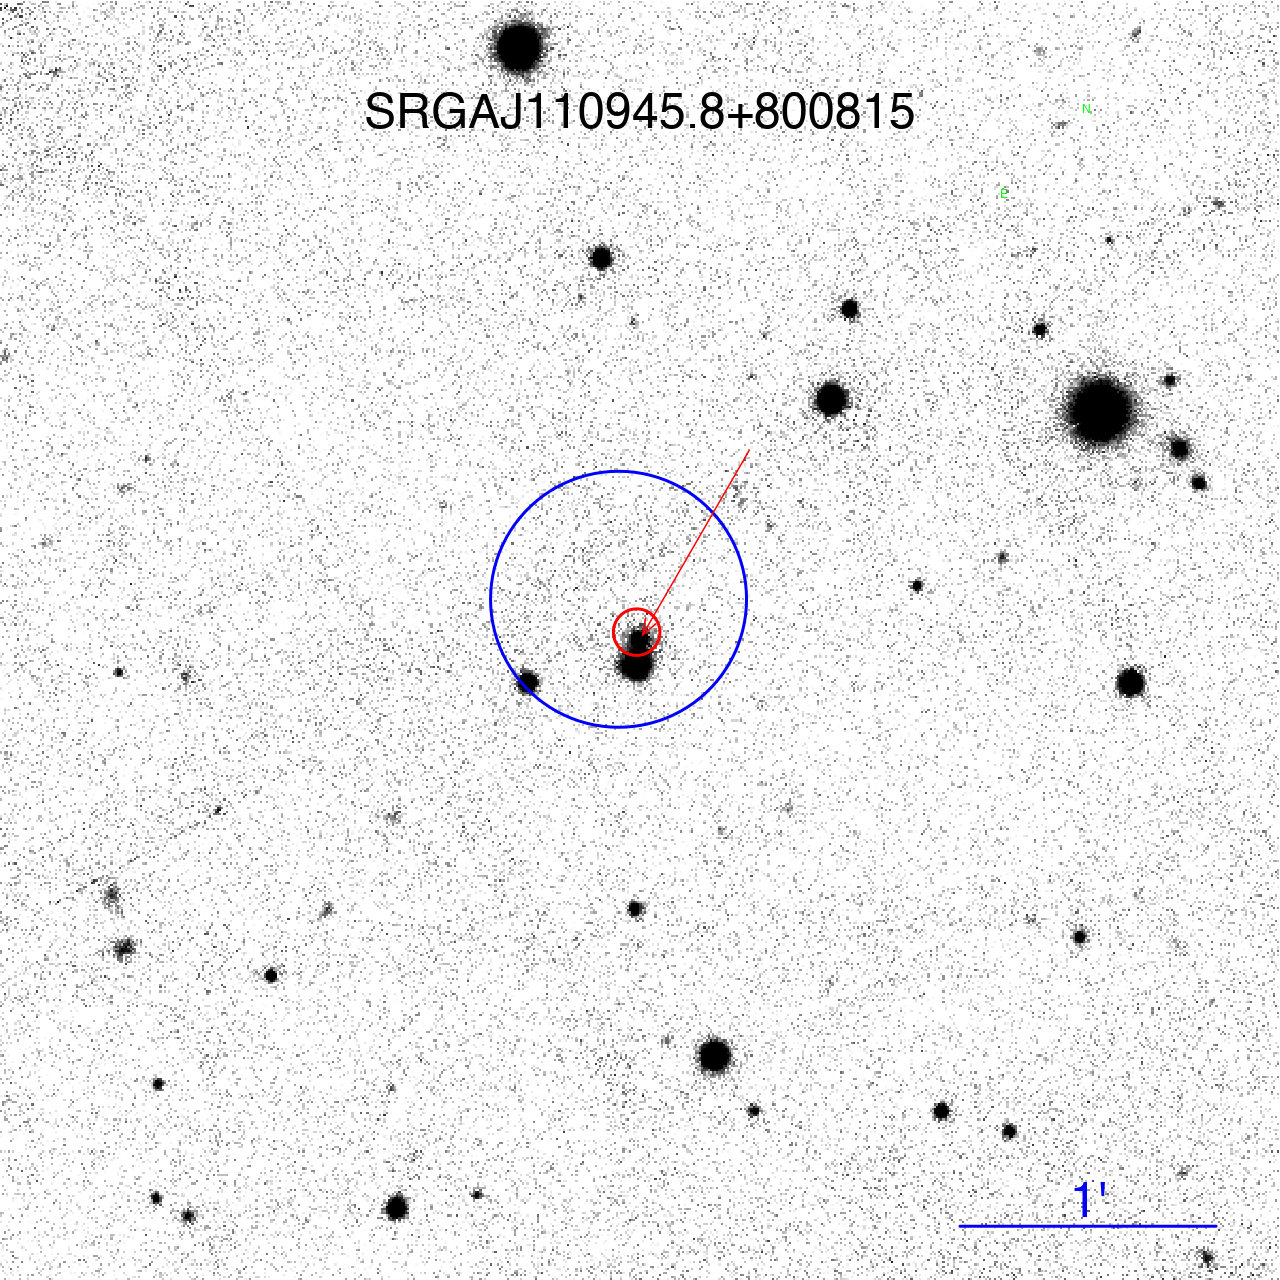
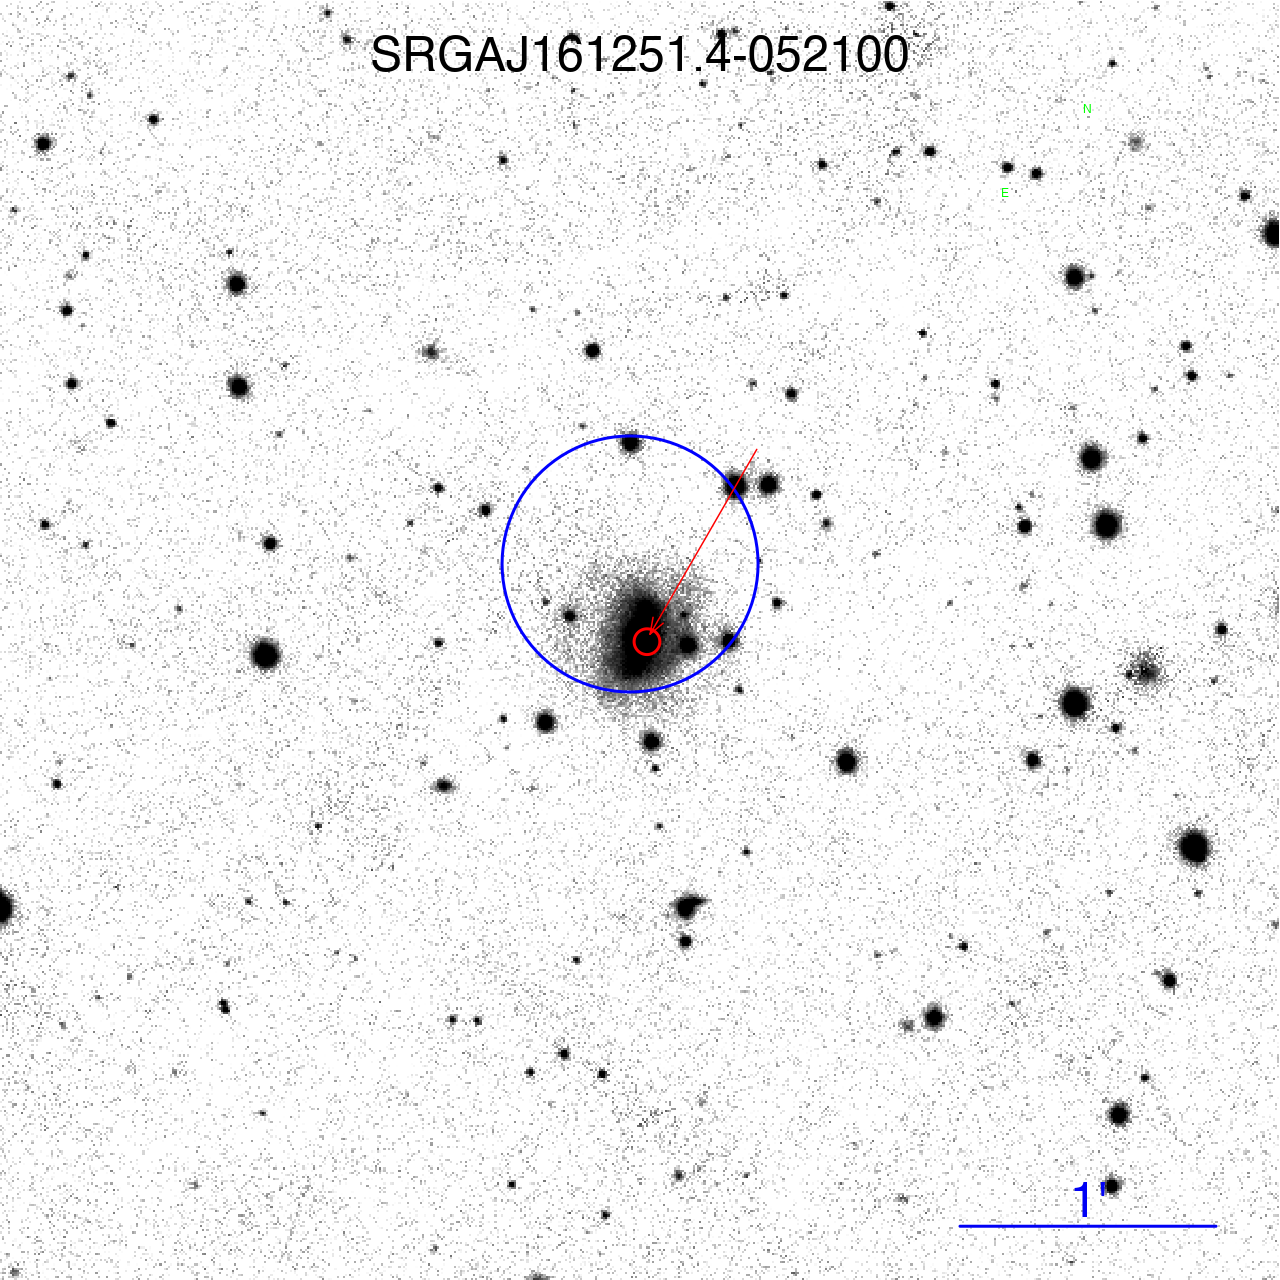
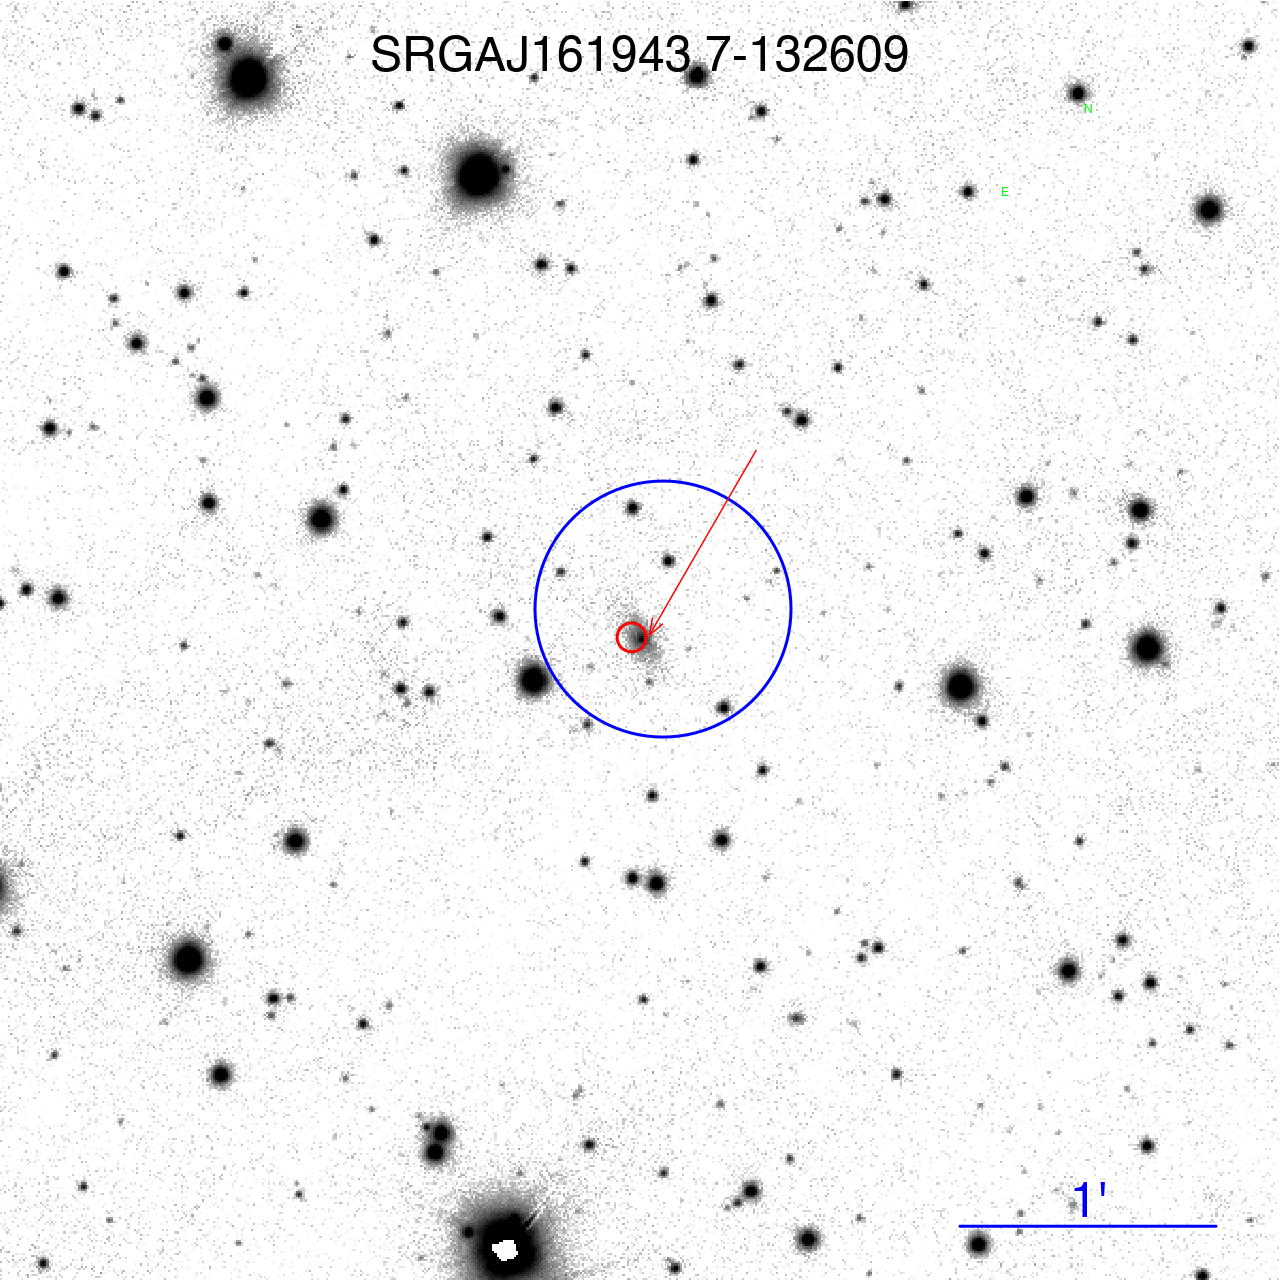
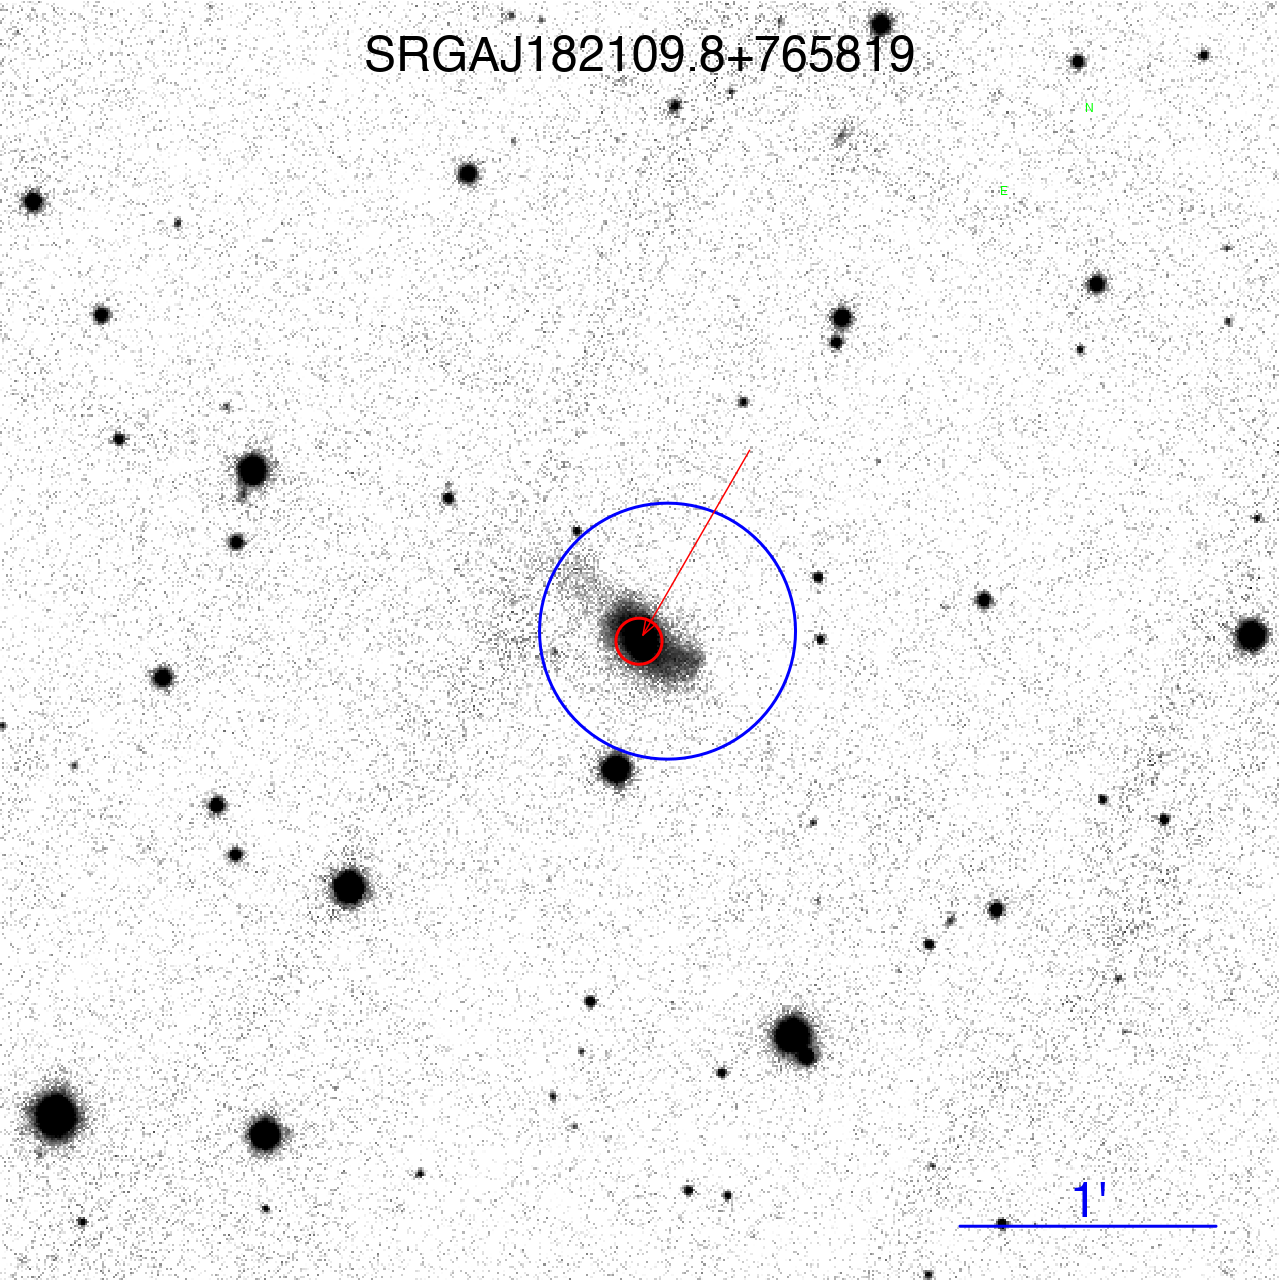
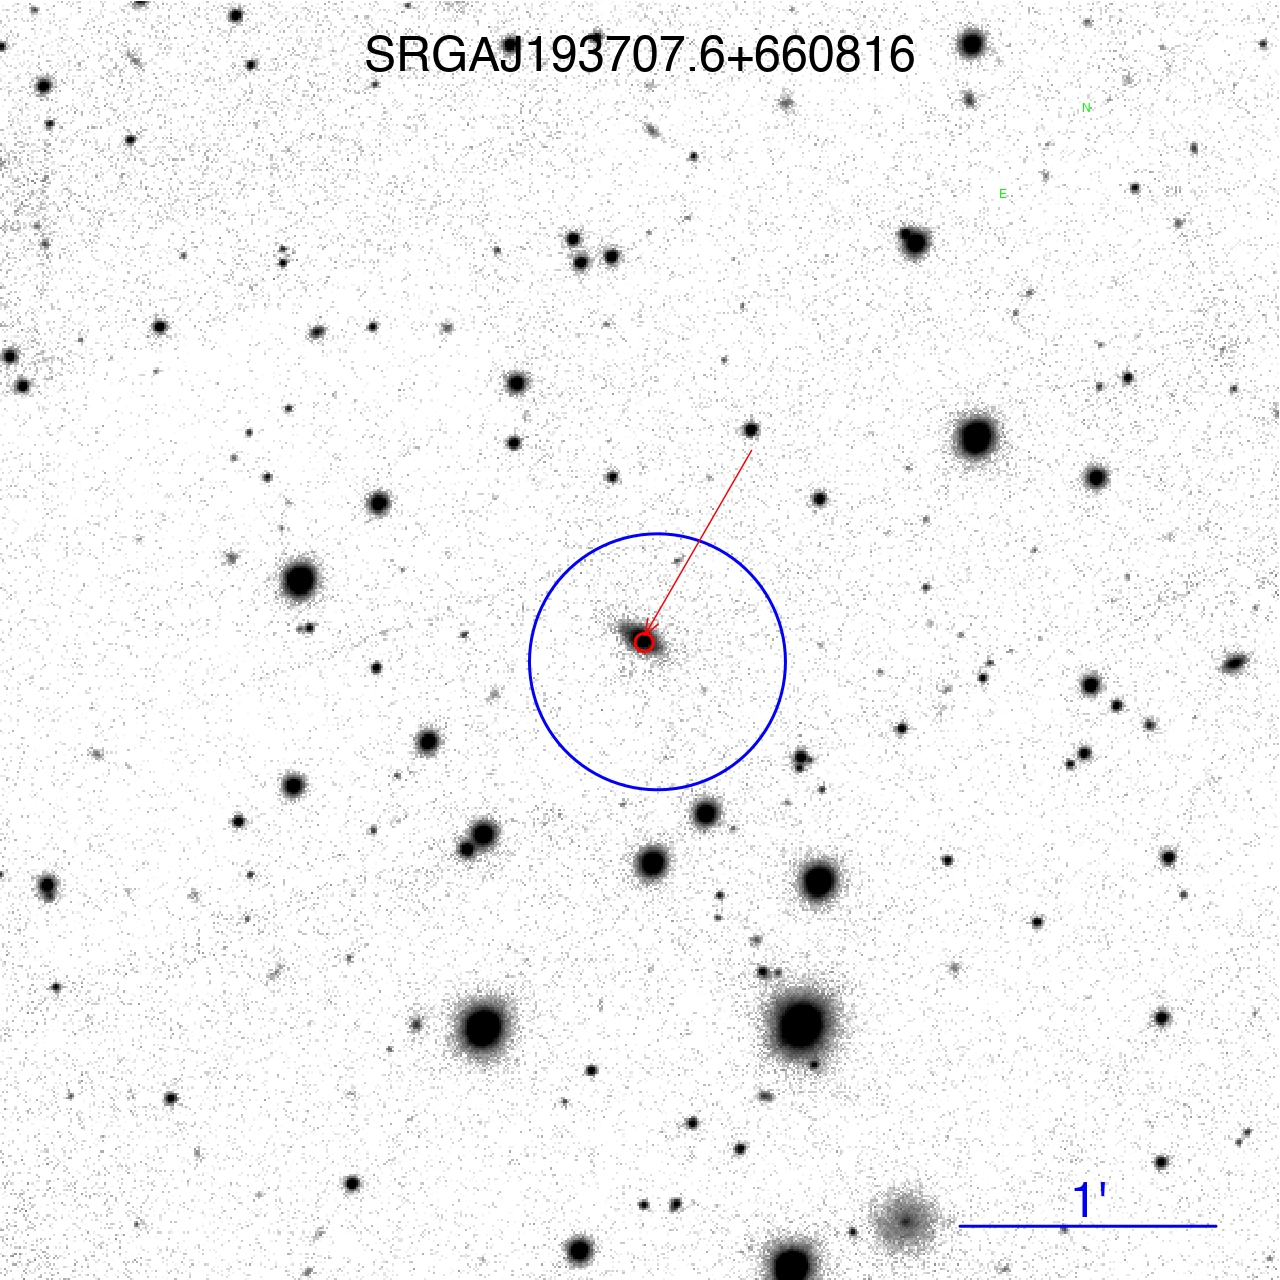
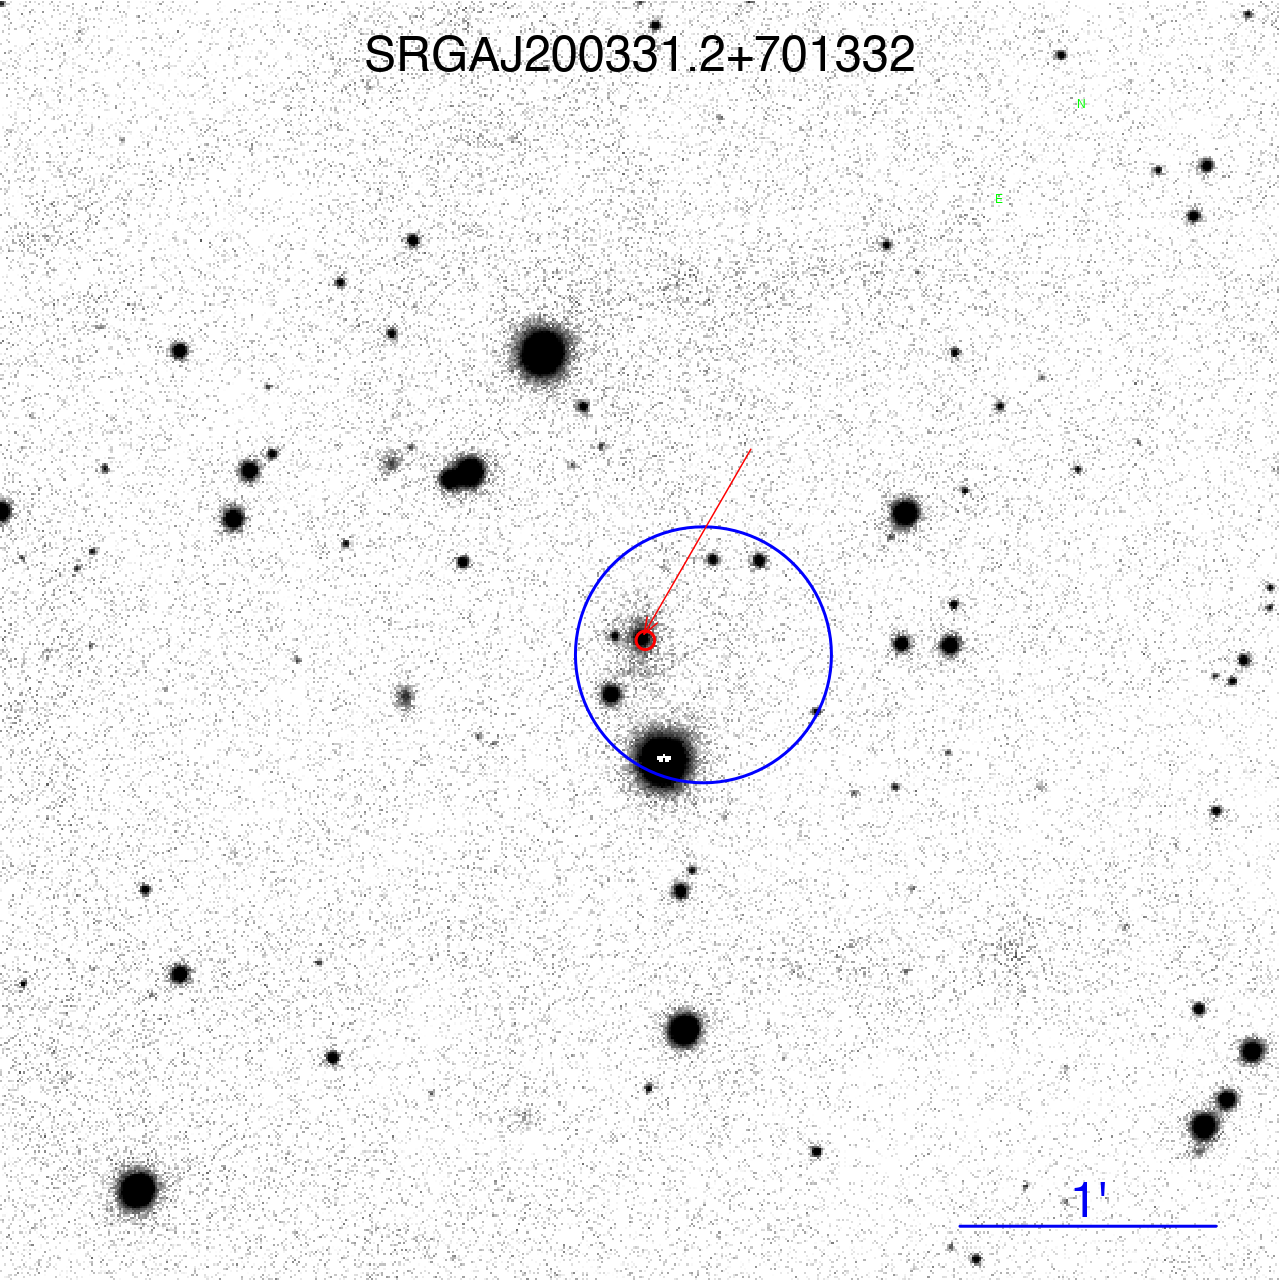
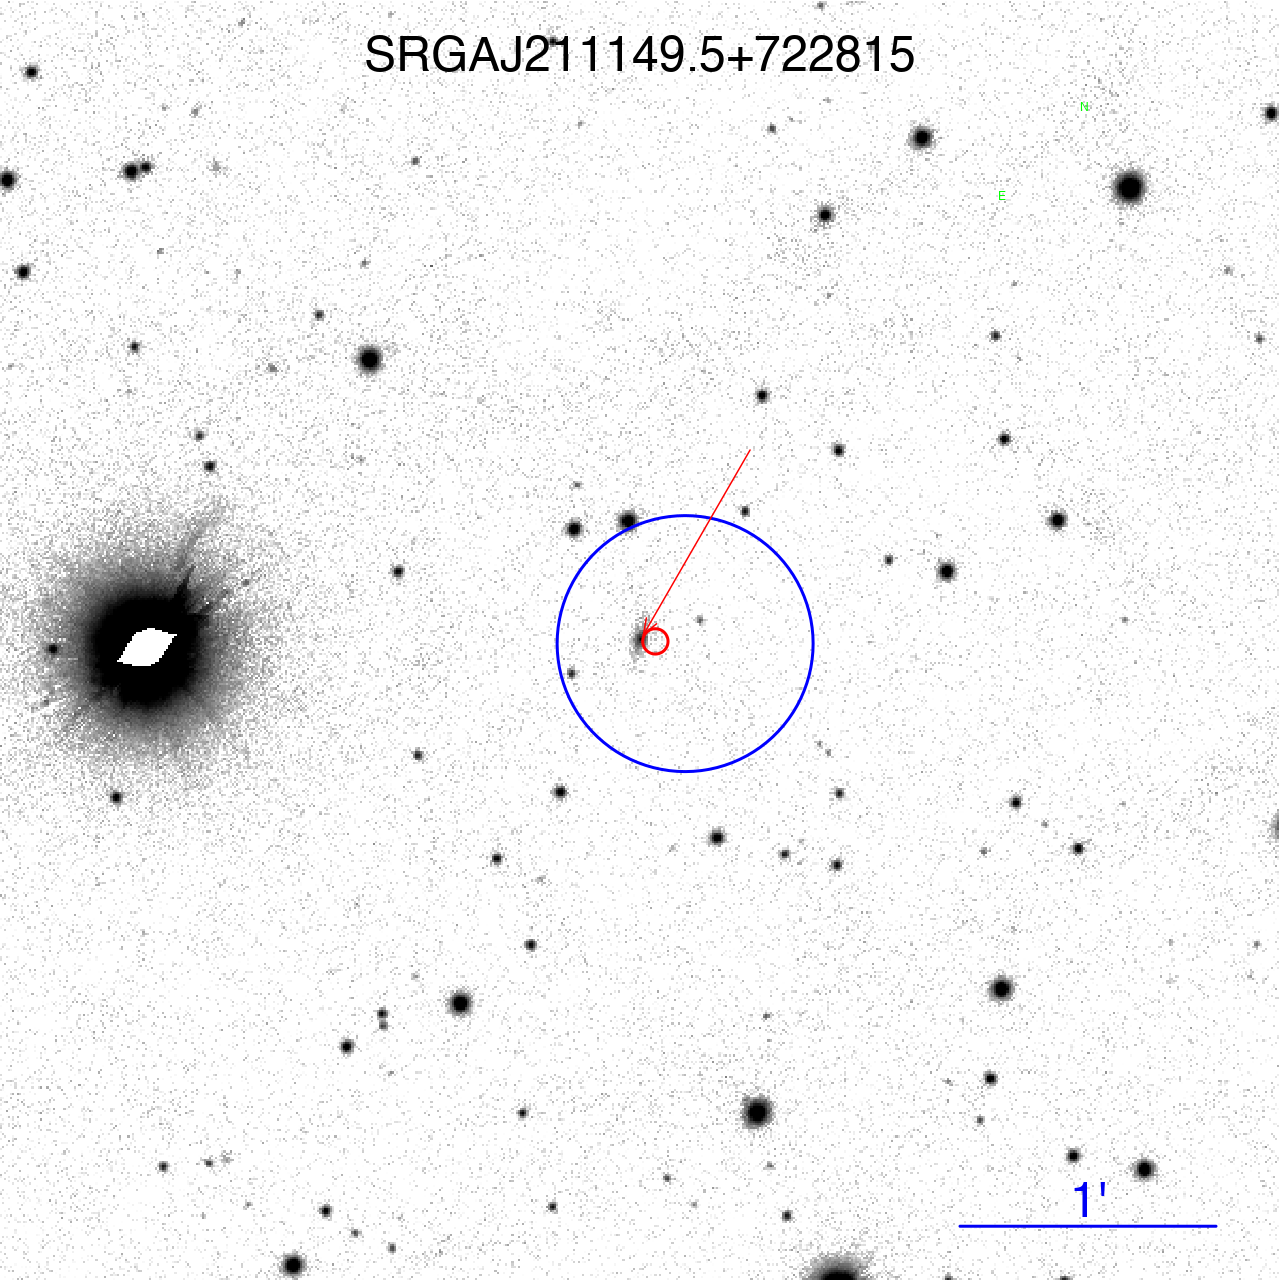
Figure 1 shows optical images of the objects being studied and the corresponding ART-XC and eROSITA position error circles of the X-ray sources. A specific extended optical object can be unambiguously associated with each X-ray source.
2.1 X-ray Observations
Depending on their positions in the sky, the sample sources were scanned during four or five SRG all-sky surveys. The combined data of these surveys were used to construct the spectra of the sources in the energy range 0.2–12 keV.
The ART-XC X-ray spectra were extracted from the all-sky survey data with the standard software that was used to process the survey data (Pavlinsky et al., 2021, 2022). The data from all seven ART-XC modules were combined. We used the data in two broad energy bands, 4–7 and 7–12 keV, that were extracted in a circle of radius 120. We calibrated the count rate-to-flux conversion factors using Crab Nebula observations (see Pavlinsky et al. 2022) and constructed a diagonal response matrix based on them. The background level was estimated using the data in the hard 30–70 keV energy band and the wavelet decomposition survey images (see Pavlinsky et al. 2022).
The eROSITA data were processed with the calibration and data processing system created and maintained at the Space Research Institute of the Russian Academy of Sciences, which uses the elements of the eSASS (eROSITA Science Analysis Software System) package and the software developed by the science group on the X-ray catalog of the Russian eROSITA consortium. We extracted the source spectra in a circle of radius 60 and the background spectra in a ring with an inner radius of 120 and an outer radius of 300 around the source. If other sources fell into the background region, then the photons in a region of radius 40 around them were excluded. The spectra were extracted from the data of all seven ART-XC modules in the energy range 0.2–9.0 keV. When fitting the spectra, the data were binned in such a way that there were at least three counts in each energy channel.
2.2 Optical Observations
| ART-XC source | Date | Telescope | Grism | Slit, \arcsec | Exposure time, s |
|---|---|---|---|---|---|
| SRGA J001439.6+183503 | 2022-10-31 | AZT-33IK | VPHG600G | 3 | |
| SRGA J002240.8+804348 | 2022-10-31 | AZT-33IK | VPHG600G | 2 | |
| 2022-11-01 | AZT-33IK | VPHG600R | 2 | ||
| SRGA J010742.9+574419 | 2022-03-04 | AZT-33IK | VPHG600G | 3 | |
| SRGA J021227.3+520953 | 2022-11-18 | AZT-33IK | VPHG600G | 2 | |
| 2022-11-21 | AZT-33IK | VPHG600R | 2 | ||
| SRGA J025208.4+482955 | 2022-11-01 | AZT-33IK | VPHG600G | 2 | |
| SRGA J045432.1+524003 | 2022-11-01 | AZT-33IK | VPHG600G | 2 | |
| SRGA J051313.5+662747 | 2022-11-01 | AZT-33IK | VPHG600G | 2 | |
| SRGA J110945.8+800815 | 2022-11-03 | AZT-33IK | VPHG600G | 2 | |
| 2022-11-03 | AZT-33IK | VPHG600R | 2 | ||
| SRGA J161251.4052100 | 2003-05-30 | UKST | VPH580V | ||
| 2003-05-30 | UKST | VPH425R | |||
| SRGA J161943.7132609 | 2004-04-16 | UKST | VPH580V | ||
| 2004-04-16 | UKST | VPH425R | |||
| SRGA J182109.8+765819 | 2022-11-17 | AZT-33IK | VPHG600G | 2 | |
| SRGA J193707.6+660816 | 2022-11-01 | AZT-33IK | VPHG600G | 1.5 | |
| SRGA J200331.2+701332 | 2022-11-18 | AZT-33IK | VPHG600G | 3 | |
| 2022-11-18 | AZT-33IK | VPHG600R | 3 | ||
| SRGA J211149.5+722815 | 2022-11-21 | AZT-33IK | VPHG600G | 2 | |
| 2022-11-21 | AZT-33IK | VPHG600R | 2 |
Our spectroscopy was carried out at the AZT-33IK telescope using the low- and medium-resolution ADAM spectrograph (Afanasiev et al., 2016; Burenin et al., 2016) (see the log of observations in Table 2). We used long slits of width 1.5\arcsec, 2\arcsec, and 3\arcsecat the ADAM spectrograph. The slit center was brought into coincidence with the central region of the observed galaxy. The observations were performed at a seeing (FWHM) better than 2.5\arcsec.
We used volume phase holographic gratings (VPHGs, grisms), 600 lines per millimeter, to take the spectra at the ADAM spectrograph. As a dispersive element we used VPHG600G for the spectral range 3650–7250 Å with a resolution of 8.6 Å for a 2\arcsecslit and VPHG600R for the spectral range 6460–10050 Å with a resolution of 12.2 Å for a 2\arcsecslit. When using VPHG600R, we set the OS11 filter, which removes the second interference order from the image. A thick e2v CCD30-11 array produced by the deep depletion technology is installed at the spectrograph. This allows the spectroscopic images to be obtained at a wavelength of 10 000 Å without interference on the thin CCD substrate. All our observations were performed with zero slit position angle. After each series of spectroscopic images for each object, we obtained the calibration images of a lamp with a continuum spectrum and the line spectrum of a He–Ne–Ar lamp.
On each observing night we took the spectra of spectrophotometric standards from the ESO111https://www.eso.org/sci/observing/tools/standards list for all of the sets of diffraction gratings and slits being used. The spectrophotometric standards were chosen so that they were approximately at the same elevation with the optical source observed by us. The data reduction was performed using the IRAF222http://iraf.noao.edu/ software and our own software. The flux calibration was performed by standard IRAF procedures from the onedspec package.
The spectra of the objects were corrected for interstellar extinction with the deredden procedure from the onedspec IRAF package in a standard way (Cardelli et al., 1989). The color excess was determined with the help of the GALExtin333www.galextin.org service using the model of Schlegel et al. (1998). We took from Schlafly & Finkbeiner (2011).
For two objects from the sample we analyzed the archival spectroscopic data from the 6dF survey (Jones et al., 2009). This survey was conducted at the UKST 1.2-m Schmidt telescope using a multifiber spectrograph with a field of view equipped with two low-resolution () gratings with overlapping spectral ranges. The range 4000–7500 Å was completely covered. The spectra taken during the survey were not flux-calibrated and are presented in counts, which does not allow the absolute fluxes in emission lines to be measured. However, these data can be used to estimate the line equivalent widths and the ratios of the fluxes in pairs of closely spaced lines, which is quite enough for the classification of AGNs.
3 RESULTS
3.1 X-ray Spectra
Our spectral analysis was performed jointly using the eROSITA and ART-XC data. The spectra were fitted in the energy range 0.2–12 keV with the XSPEC v12.12.0444https://heasarc.gsfc.nasa.gov/xanadu/xspec software (Arnaud, 1996). The -statistic that takes into account the X-ray background was used for our model fitting.
To fit the spectra, we used the model of a power-law continuum with a low-energy cutoff due to photoabsorption in the Galaxy and the object itself. In the spectra of several sources with a great intrinsic absorption we detected an excess of the observed counts compared to the prediction of the power-law model at energies below kev. This excess can be caused by a slight inaccuracy in the current version of the eROSITA response matrix. On the other hand, in the X-ray spectra of type 2 AGNs at energies below 2 keV additional emission is often observed (see, e.g., Guainazzi et al. 2005) against the background of an absorbed power-law continuum. The nature of this emission can be varied, and it is by no means always possible to establish it. The following is discussed in the literature as possible mechanisms (see, e.g., Guainazzi & Bianchi 2007): (1) the emission from the central source scattered in the rarefied gas outside the dusty torus around the supermassive black hole (SMBH), (2) the emission from the gas in the galactic nucleus photoionized by the emission and/or shocks associated with the SMBH activity, and (3) the emission from the galaxy itself associated with active star formation.
Determining the nature of the observed excess emission at low energies requires refining the eROSITA response matrix, which is beyond the scope of this paper. Therefore, when fitting the spectra of the sources with such an excess, we included an additional soft component that was described by the thermal hot optically thin plasma emission spectrum (APEC, Smith et al. 2001) in the spectral model. Thus, we used the following two models in XSPEC:
where TBabs is the absorption in the Galaxy from HI4PI data (HI4PI Collaboration et al., 2016), zTBabs is the intrinsic absorption in the AGN frame, and cflux is the absorption-corrected flux of the power-law component in the 2–10 keV energy band.
When making a decision about the necessity of adding the soft component to the model, we used a likelihood ratio test: if decreased by more than (corresponding to a statistical significance of more than 95% for two degrees of freedom) when adding the soft component, then preference was given to the two-component model.
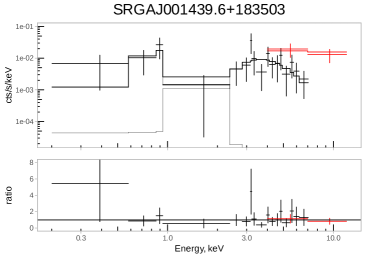
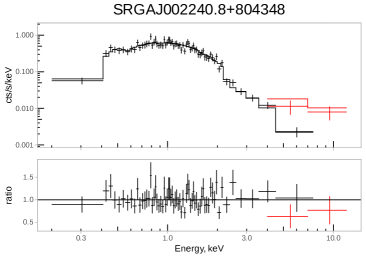
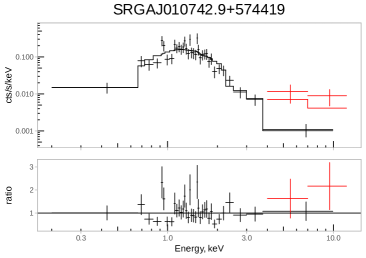
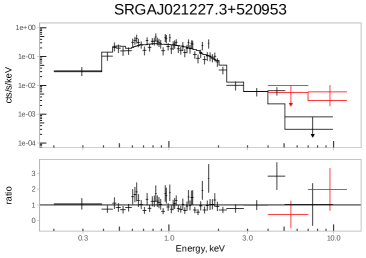
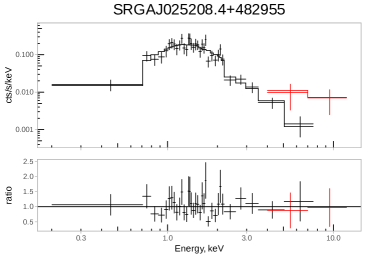
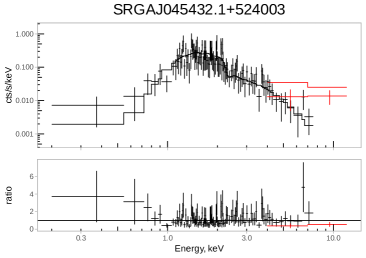
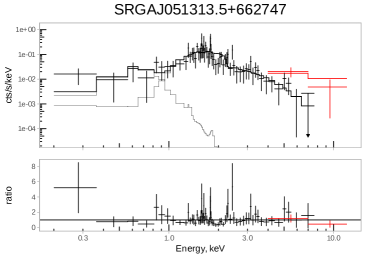
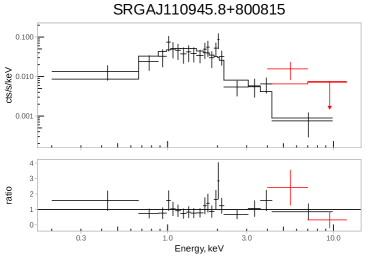
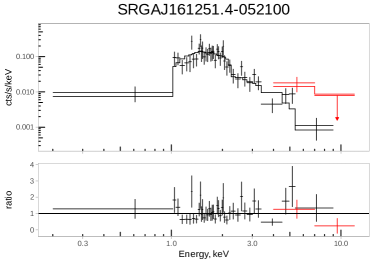
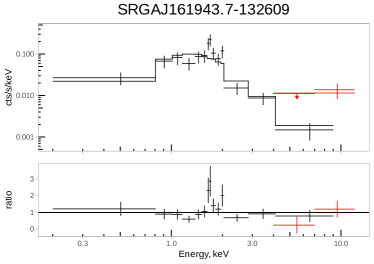
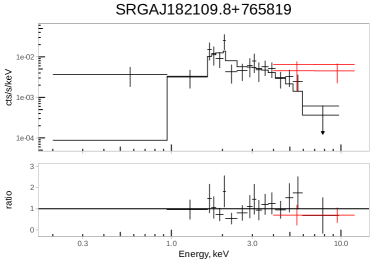
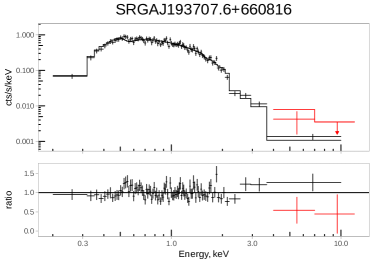
The X-ray spectrum fitting results are presented in Table 3. The 90% confidence intervals of the parameters are given. The spectra themselves are presented in Fig. 4, with the eROSITA spectra having been rebinned for clarity. We will reiterate that when interpreting the spectral parameters given in Table 3, it should be kept in mind that the final conclusion about the nature of the excess at low energies requires a further study and a refinement of the eROSITA response matrix, which is planned to be done in our succeeding papers. It is important to note that the power-law parameters (the slope and the hydrogen column density) do not change greatly when adding the soft component to the model.
| TBabs zTBabs(ZPL), TBabs (zTBabs ZPL + APEC) models | ||||||||
|---|---|---|---|---|---|---|---|---|
| ART-XC source | dof | Cstat | ||||||
| SRGA J001439.6183503 | ||||||||
| SRGA J002240.8804348 | ||||||||
| SRGA J010742.9574419 | ||||||||
| SRGA J021227.3520953 | ||||||||
| SRGA J025208.4482955 | ||||||||
| SRGA J045432.1524003 | ||||||||
| SRGA J051313.5662747 | ||||||||
| SRGA J110945.8800815 | ||||||||
| SRGA J161251.4052100 | ||||||||
| SRGA J161943.7132609 | ||||||||
| SRGA J182109.8765819 | ||||||||
| SRGA J193707.6660816 | ||||||||
| SRGA J200331.2701332 | ||||||||
| SRGA J211149.5722815 | ||||||||
and are the gas column densities in the Galaxy and the object, respectively, in units of cm-2; is the absorption-corrected flux in the main power-law component in the observed 2–10 keV energy band, in units of erg s-1 cm-2; is the optically thin plasma temperature, in keV; is the normalization of the plasma emission, in units of , where is the angular diameter distance to the source (cm), is a volume element (cm3), and arethe number densities (cm-3) of electrons and hydrogen nuclei, respectively.
3.2 Optical Spectra
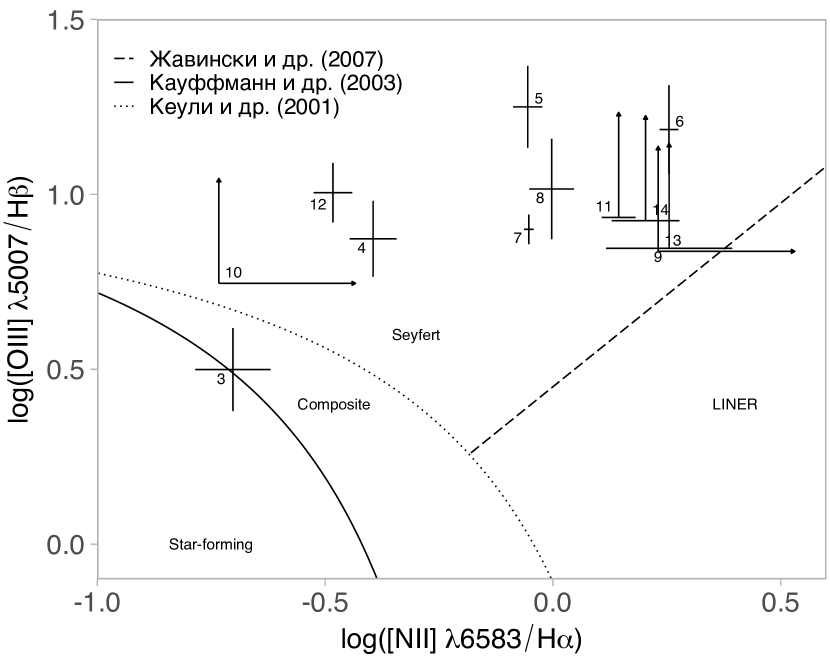
Standard criteria based on the emission line flux ratios (Osterbrock, 1981; Véron-Cetty et al., 2001) were used to classify the Seyfert galaxies. The spectral continuum was fitted by a polynomial, while the emission lines were fitted by Gaussians. Thus, for each line we determined the central wavelength, the full width at half maximum , the flux, and the equivalent width . The of the broad Balmer lines was corrected for the spectral resolution of the instrument: , where was determined for each dispersive element and each slit as the of the lines in the calibration lamp spectrum.
The errors of the emission line parameters are given at 68% confidence. The confidence level of the redshift was determined as the error of the mean narrow-line redshift. The measured of the narrow emission lines are consistent with the instrumental broadening and, therefore, the values of are not given for them. The confidence intervals for the line equivalent widths () were obtained by the Monte Carlo method. Assuming that the flux errors obeyed a normal distribution, we selected spectrum realizations. Then, for each of the realizations we estimated . The confidence intervals were estimated from the derived distribution. To obtain an upper limit on the line flux, we fixed the center of the Gaussian and took its width to be equal to the instrumental broadening. The estimated line parameters for each of the sources are given below in Table 6.
The redshifts of the objects were determined from the narrow emission lines and are given in the observatory frame. For the sources from the spectroscopic 6dF survey we used the redshifts from the same catalog. The results of the classification of sources and their redshift measurements are presented in Table 4.
3.3 Results on Individual Objects
3.3.1 SRGA J001439.6+183503
This X-ray source is present in the catalog of the XMM-Newton slew survey (XMM-SSC, 2018; Saxton et al., 2008) and the catalog of point sources detected by XRT onboard the Swift observatory (Evans et al., 2019): the sources XMMSL2 J001439.6+183450 and 2SXPS J001440.0+183455, respectively. There is the edge-on galaxy NGC52 in the ART-XC and eROSITA position error circles (Fig. 1). It is located at redshift (according to the SIMBAD database) and has an infrared color . The radio source NVSS J001440+183455 can also be associated with this object.
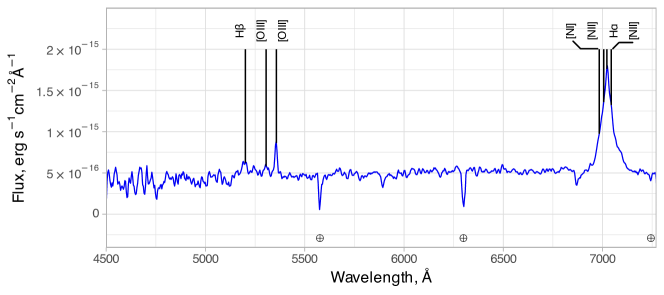
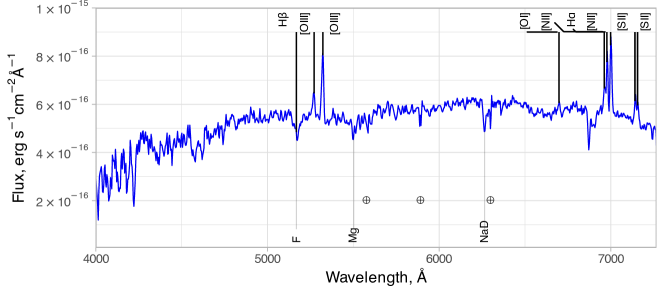
Weak narrow H and [NII]6583 emission lines are seen in the optical spectrum (Fig. 5, Table 6). The Fraunhofer MgI and NaD absorption lines are also seen. The redshift was measured from the emission lines: .
The narrow-line flux ratio = points to the presence of an active nucleus in the galaxy, according to the BPT diagram (see Fig. 2), while the absence of a broad component in the H line suggests that this is a Seyfert 2 (Sy2) galaxy. In principle, the absence of the [OIII]5007 and H emission lines supposes that this is a LINER object, but this is highly unlikely, taking into account the object’s high X-ray luminosity ( erg s-1 in the 4–12 keV energy band). The weakness of the emission lines in the optical spectrum probably stems from the fact that the active nucleus is observed through a thick layer of interstellar matter in the galaxy.
Our X-ray spectrum modeling (Fig. 4) shows the presence of substantial absorption in the source, cm-2, at 90% confidence (Fig. 3, Table 3). This is consistent with the weakness of the emission lines and may also be related mainly to the thick layer of interstellar matter in the edge-on galaxy and not with the dusty torus around the supermassive black hole.
3.3.2 SRGA J002240.8+804348
This X-ray source was discovered during the ROSAT all-sky survey (RASS, Boller et al. (2016)): 2RXS J002247.6+804418. There is the extended optical and infrared object WISEA J002243.69+804346.1 (Fig. 1) with a color typical for AGNs in the ART-XC and eROSITA position error circles.
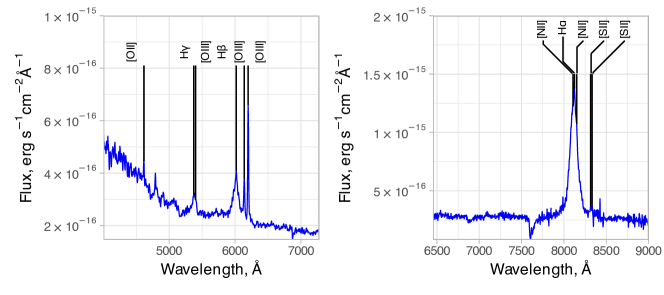
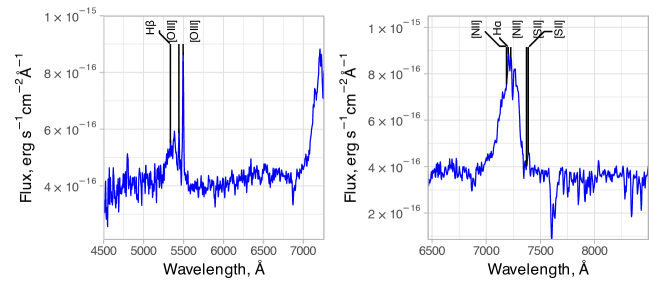
Balmer emission lines, broad H and H, are observed in the galaxy’s spectrum (Fig. 5, Table 6). The forbidden [OIII]4959, [OIII]5007 lines are also present. The redshift of the source is .
Against the background of the broad H line it is impossible to distinguish its narrow component and the narrow [NII]6583 line. In the case of H we can set only an upper limit on the flux in the narrow component and, accordingly, a 2-lower limit on the flux ratio, . However, the presence of broad H and H components allows us to say with confidence that this is a Seyfert 1 (Sy1) galaxy. In the X-ray spectrum there is evidence only for slight intrinsic absorption ( cm-2).
3.3.3 SRGA J010742.9+574419
This is a new X-ray source discovered in the first year of the SRG/ART-XCsky survey. There is the extended optical and infrared object WISEA J010743.11+574417.7 (Fig. 1) with a color typical for AGNs in the ART-XC and eROSITA position error circles.
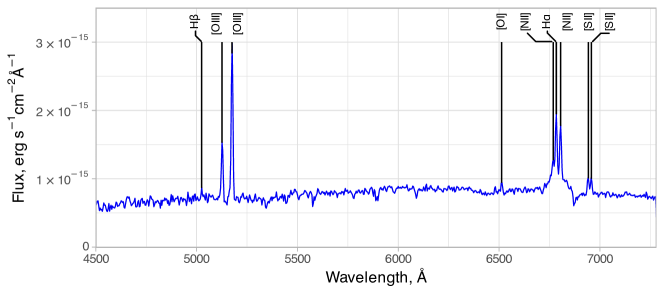
A broad H line and narrow , [OIII]4959, [OIII]5007, H, and [NII]6583 lines are observed in the optical spectrum (Fig. 5, Table 6). The redshift of the source is .
The line flux ratios = and = , according to the BPT diagram (Fig. 2), and the presence of a broad component with km s-1 with the absence of a broad component allow the object to be classified as Sy1.9. On the BPT diagram the source falls into the region of galaxies with a composite spectrum most likely because we cannot reliably distinguish the narrow H and [NII]6583 lines for it. No significant absorption was revealed in the X-ray spectrum.
3.3.4 SRGA J021227.3+520953
This X-ray source was discovered in RASS: 2RXS J021225.5+521004. There is the extended optical and infrared object 2MASS J02122646+5209533 (Fig. 1) with a color typical for AGNs in the ART-XC and eROSITA position error circles.
Balmer emission lines with broad H and H components and narrow forbidden [OIII]4959, [OIII]5007, [NII]6548, and [NII]6583 lines are seen in the optical spectrum (Fig. 5, Table 6). The measured redshift is . The narrow-line flux ratios = and = (Fig. 2) and the presence of broad H and H components allow the object to be classified as Sy1. No significant absorption was revealed in the X-ray spectrum.
3.3.5 SRGA J025208.4+482955
This X-ray source was discovered in RASS: 2RXS J025208.8+482956. There is the extended optical and infrared object WISEA J025209.64+482959.4 (Fig. 1) with a color typical for AGNs in the ART-XC and eROSITA position error circles.
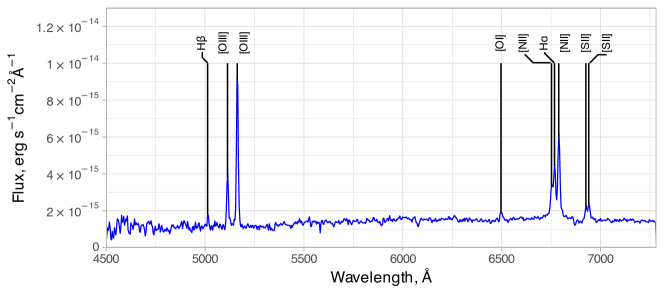
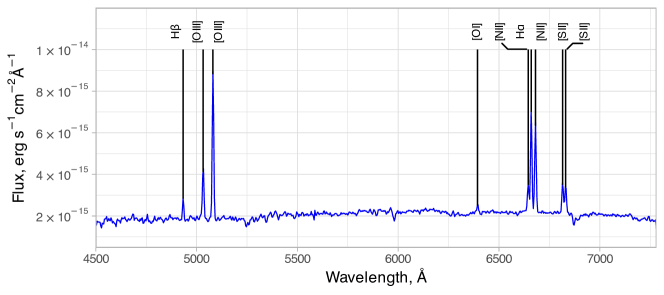
Emission lines are seen in the optical spectrum (Fig. 5, Table 6): broad H, narrow H and H, and forbidden [OIII]4959, [OIII]5007, [OI]6300, [NII]6548, [NII]6583, [SII]6716, and [SII]6730. The measured redshift is . The narrow-line flux ratios =, = (Fig. 2) and the presence of a broad H component allow the object to be classified as Sy1.9. Moderate absorption ( cm-2) was revealed in the X-ray spectrum.
3.3.6 SRGA J045432.1+524003
This is a new X-ray source discovered in the SRG/ART-XC survey. In the ART-XC and eROSITA position error circles there is the galaxy LEDA 16297 (Fig. 1) with redshift (SIMBAD) and color with which the radio source NVSS J045432+524009 can also be associated.
Emission lines are seen in the optical spectrum (Fig. 5, Table 6): broad and narrow H, narrow H, and forbidden [OIII]4959, [OIII]5007, [OI]6300, [NII]6548, [NII]6583, [SII]6716 and [SII]6730. The measured redshift is . Based on the narrow-line flux ratios =, = (Fig. 2) and the presence of a broad H component, the object can be classified as Sy1.9. Significant absorption ( cm-2) was revealed in the X-ray spectrum.
3.3.7 SRGA J051313.5+662747
This X-ray source is present in the 2SXPS catalog: 2SXPS J051316.0+ 662750. In the ART-XC and eROSITA position error circles there is the galaxy 2MASX J05131637+6627498 (Fig. 1) at redshift (SIBMAD) with a color with which the radio source NVSS J051316+662801 can also be associated.
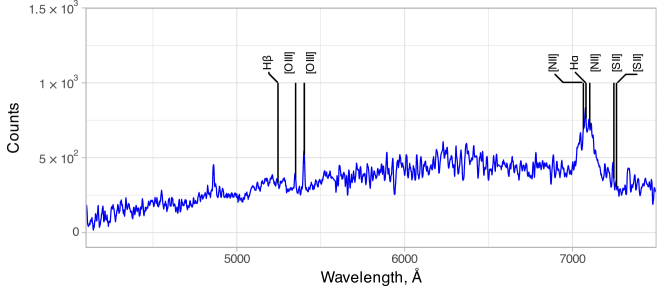
Narrow Balmer H and H emission lines and narrow forbidden [OIII]4959, [OIII]5007, [OI]6300, [NII]6548, [NII]6583, [SII]6716, and [SII]6730 lines are seen in the optical spectrum (Fig. 5, Table 6). The measured redshift is . The narrow-line flux ratios =, = (Fig. 2) and the absence of broad H and H components allow the object to be classified as Sy2. This is consistent with significant absorption ( cm-2) in the X-ray spectrum.
3.3.8 SRGA J110945.8+800815
This is a new X-ray source discovered in the SRG/ART-XC sky survey. There is the infrared and radio source WISEA J110943.77+800805.6 = NVSS J110944+800807 (Fig. 1) with a color typical for AGNs in the ART-XC and eROSITA position error circles. It should be noted that there is a star mag only 6\arcsec away from this object (located at a distance kpc from the Sun, Gaia DR3, Gaia Collaboration et al. 2022). It lies at the boundary of the 98% eROSITA position error circle, and the possibility that it makes some contribution to the X-ray flux measured by ART-XC and eROSITA if it has an active corona or, for example, is a cataclysmic variable must not be ruled out.
Narrow H and H emission lines and narrow forbidden [OII]3727, [OIII]4959, [OIII]5007, [OI]6300, [NII]6548, [NII]6583, [SII]6716, and [SII]6730 lines are seen in the optical spectrum (Fig. 5, Table 6). The measured redshift is . The narrow-line flux ratios =, = (Fig. 2) and the absence of broad H and H components allow the object to be classified as Sy2. In spite of this, no statistically significant intrinsic absorption is revealed in the X-ray spectrum, while the upper limit on the absorption column density is cm-2 at 90% confidence. At the same time, the power-law continuum is unusually hard for AGNs, with a slope . This may suggest that the spectrum of this source actually has a more complex shape, which is impossible to ascertain due to the insufficient number of photons in the spectrum being analyzed.
3.3.9 SRGA J161251.4052100
This X-ray source was discovered in RASS: 2RXS J161250.6052118. In the ART-XC and eROSITA position error circles there is the galaxy LEDA 3097794 (Fig. 1) with a redshift (SIMBAD, based on the 6dF survey) and an infrared color typical for AGNs.
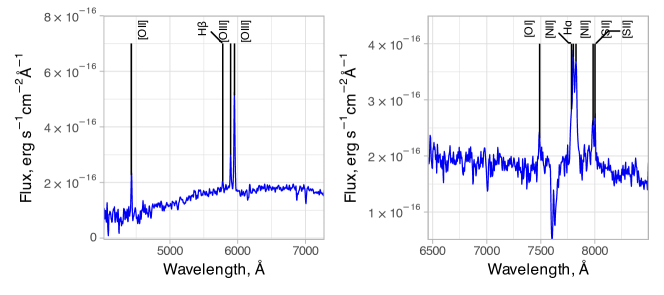
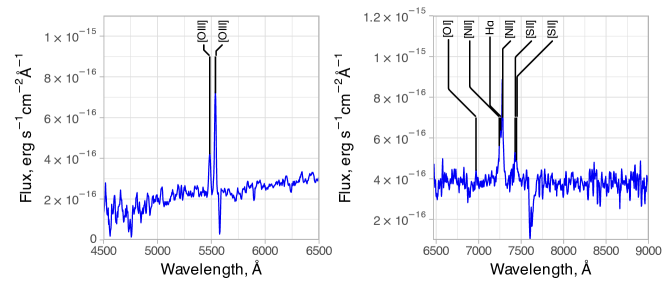
Narrow Balmer H and H emission lines and narrow forbidden [OIII]4959, [OIII]5007, [NII]6548, and [NII]6583 lines are seen in the optical spectrum (Fig. 5, Table 6). The narrow-line flux ratios =, and the absence of broad H and H components allow the object to be classified as Sy2 (Fig. 2). This is consistent with significant absorption ( cm-2) in the X-ray spectrum.
3.3.10 SRGA J161943.7132609
This is a new X-ray source discovered in the SRG/ART-XC sky survey. In the ART-XC and eROSITA position error circles there is the galaxy 2MASX J161944071326166 (Fig. 1) with a redshift (SIMBAD, based on the 6dF survey) and an infrared color typical for AGNs.
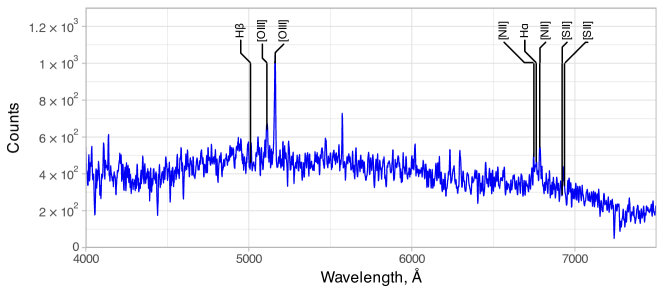
A broad H emission line and narrow forbidden [OIII]4959, [OIII]5007, [NII]6548, and [NII]6583 lines are seen in the optical spectrum (Fig. 5, Table 6). The narrow-line flux ratios , (Fig. 2) and the presence of a broad H component allow the object to be classified as Sy1.9. No significant absorption was revealed in the X-ray spectrum.
3.3.11 SRGA J182109.8+765819
This is a new X-ray source discovered in the SRG/ART-XCsky survey. In the ART-XC and eROSITA position error circles there is the galaxy LEDA 2772547 (Fig. 1) with a color typical for AGNs. The radio source VLASS1QLCIR J182111.52+765816.6. can also be associated with it.
A narrow H emission line and narrow forbidden [OIII]4959, [OIII]5007, [OI]6300, [NII]6548, [NII]6583, [SII]6716, and [SII]6730 lines are seen in the optical spectrum (Fig. 5, Table 6). The Fraunhofer MgI and NaD, F absorption lines are also seen.
The redshift was measured from the emission lines, . The narrow-line flux ratios =, (Fig. 2) and the absence of broad H and H components allow the object to be classified as Sy2. Significant X-ray absorption ( cm-2) is observed.
3.3.12 SRGA J193707.6+660816
This X-ray source was discovered in RASS (2RXS J193708.1+660821). In the ART-XC and eROSITA position error circles there is the optical and radio source 2MASS J19370820+6608213 = NVSS J193710+660830 (Fig. 1) with an infrared color typical for AGNs.
Balmer emission lines are seen in the optical spectrum (Fig. 5, Table 6): broadH, broad H, broad and narrow H, broad and narrow H. Narrow forbidden [OIII]4959, [OIII]5007, [NII]6548, [NII]6583, [SII]6716, and [SII]6730 lines are also observed.
The measured redshift is . The narrow-line flux ratios =, = (Fig. 2) and the presence of broad H, H, H, and H components with a typical line FWHM km s-1 allow the object to be classified as a narrow-line Seyfert 1 (NLSy1) galaxy. There may be slight absorption ( cm-2) in the X-ray spectrum.
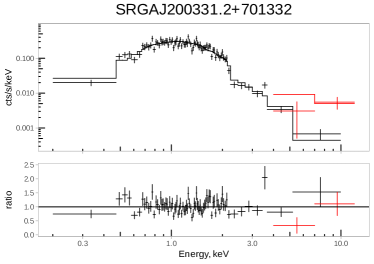
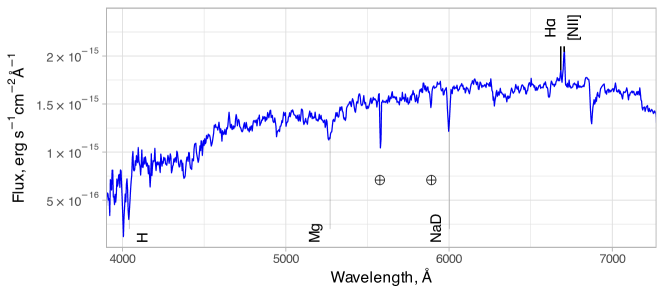
3.3.13 SRGA J200331.2+701332
This X-ray source was discovered in RASS: 2RXS J200332.1+701331. It is also known as a hard X-ray source, SWIFT J2003.4+7023 (Oh et al., 2018). In ART-XC and eROSITA position error circles there is the optical object 2MASS J20033397+7013369 (Fig. 1) with a color typical for AGNs.
Broad H and H emission lines and narrow forbidden [OIII]4959, [OIII]5007, [NII]6548 and [NII]6583 lines are observed in the optical spectrum (Fig. 5, Table 6). The measured redshift is . The narrow-line flux ratios , (Fig. 2) and the presence of broad H and H components allow the object to be classified as Sy1. Slight absorption ( cm-2) was revealed in the X-ray spectrum.
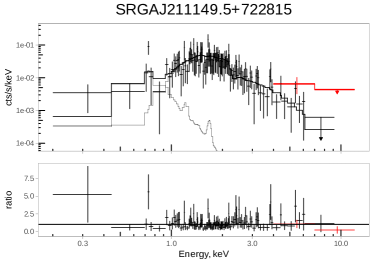
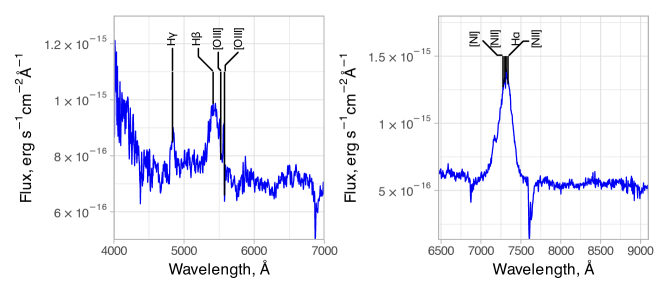
3.3.14 SRGA J211149.5+722815
This is a new X-ray source discovered in the SRG/ART-XC sky survey. In the ART-XC and eROSITA position error circles there is the optical and radio source WISEA J211151.78+722816.4 = NVSS J211152+722819 (Fig. 1) with an infrared color typical for AGNs.
A narrow H emission line and narrow forbidden [OIII]4959, [OIII]5007, [NII]6548, and [NII]6583 lines are observed in the optical spectrum (Fig. 5, Table 6). The measured redshift is . The narrow-line flux ratios =, (Fig. 2) and the absence of broad H and H components allow the object to be classified as Sy2. Significant absorption ( cm-2) is present in the X-ray spectrum.
4 PROPERTIES OF THE AGN SAMPLE
| № | Object | Optical type | ||
|---|---|---|---|---|
| 1 | SRGA J001439.6183503 | Sy2 | ||
| 2 | SRGA J002240.8804348 | Sy1 | ||
| 3 | SRGA J010742.9574419 | Sy1.9 | ||
| 4 | SRGA J021227.3520953 | Sy1 | ||
| 5 | SRGA J025208.4482955 | Sy1.9 | ||
| 6 | SRGA J045432.1524003 | Sy1.9 | ||
| 7 | SRGA J051313.5662747 | Sy2 | ||
| 8 | SRGA J110945.8800815 | Sy2 | ||
| 9 | SRGA J161251.4052100+ | Sy2 | ||
| 10 | SRGA J161943.7132609+ | Sy1.9 | ||
| 11 | SRGA J182109.8765819 | Sy2 | ||
| 12 | SRGA J193707.6660816 | NLSy1 | ||
| 13 | SRGA J200331.2701332 | Sy1 | ||
| 14 | SRGA J211149.5722815 | Sy2 |
1 The redshifts were measured from emission lines.
2 The absorption-corrected luminosity in the 2–10 keV energy band in erg s-1.
+ The redshifts were taken from the 6dFcatalog.
The error corresponds to the 68% confidence interval for the redshift and 90% for the luminosity without including the error in .
| Object | BH mass, | , erg s-1 | |
|---|---|---|---|
| SRGAJ002240.8+804348 | |||
| SRGAJ021227.3+520953 | |||
| SRGAJ193707.6+660816 | |||
| SRGAJ200331.2+701332 |
is the bolometric luminosity derived for a fixed bolometric correction ; is the bolometric-to-Eddington luminosity ratio. The errors correspond to the 68% confidence interval.
Table 4 presents basic characteristics of the identified AGNs: the optical type, the redshift, and the X-ray luminosity . The latter was calculated using the single-component X-ray spectrum model from Table 3 in the 2–10 keV energy band555Taking into account the low redshifts of the objects, we do not make the -correction. (in the ob- served frame) and was corrected for Galactic and intrinsic absorption.
The X-ray luminosities of the objects vary in the range from to erg s-1, typical for AGNs at the present epoch. According to the narrow-line flux ratios, and , all sources fall into the region of Seyfert galaxies on the BPT diagram (Fig. 2), except for SRGA J001439.6+183503, SRGA J002240.8+804348, and SRGA J010742.9+574419. However, the high X-ray luminosity, the presence of broad hydrogen line components in SRGA J002240.8+804348 and SRGA J010742.9+574419, and the ratio in SRGA J001439.6+183503 point to the presence of active nuclei in these galaxies.
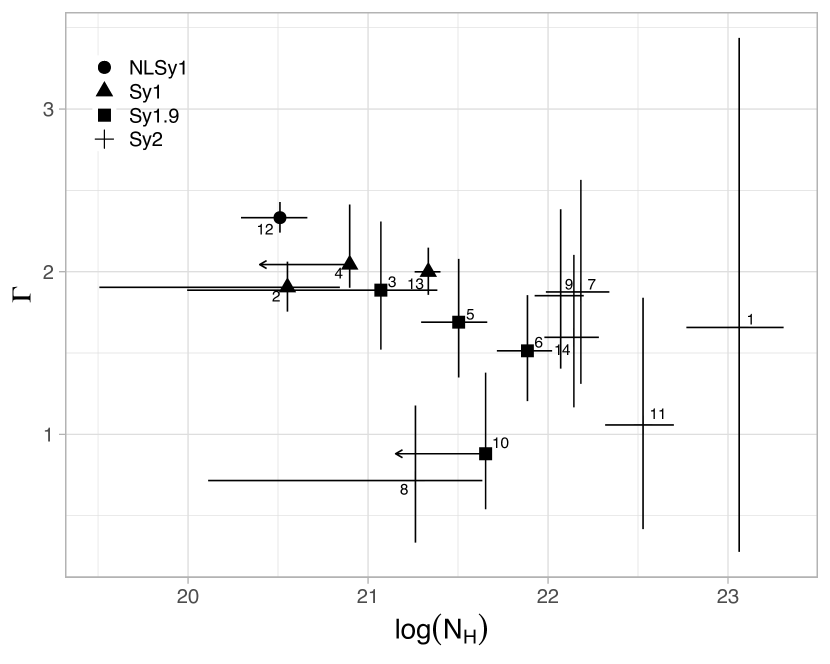
In Fig. 3 the slope of the power-law continuum is plotted against the intrinsic absorption column density for the objects being studied. Almost all of the slopes are close, within the error limits, to the canonical slope for AGNs, . The slope is considerably larger for only one narrow-line Seyfert 1 galaxy in the sample, SRGA J193707.6+660816: , typical for AGNs of this type (see, e.g., Brandt et al. 1997; Leighly 1999). Significant intrinsic absorption was revealed only in Seyfert 2 galaxies (Sy2 and Sy1.9).
For four Seyfert 1 galaxies, including NLSy1 SRGA J193707.6+660816, we can estimate the masses of the central black holes from the luminosity and the width of the broad H emission line based on the well-known empirical relation (see Eq. (6) in Greene & Ho 2005) using the flux and the width of this line from Table 6666We do not make such estimates for Sy1.9 objects, since the H emission for them can be subject to significant intrinsic absorption.. In addition, we can estimate the bolometric luminosities of these objects. For this purpose, we took the bolometric correction for the 2–10 keV energy band from Sazonov et al. (2012), which was obtained for a representative sample of Seyfert galaxies in the nearby Universe. It should be kept in mind that this correction has an uncertainty that we ignore.
Table 5 gives the derived black hole masses, bolometric luminosities, and bolometric-to-Eddington luminosity ratios (). The latter quantity characterizes the accretion regime. The derived vary from 1 to 10%, which, on the whole, is typical for Seyfert galaxies (see, e.g., Khorunzhev et al. 2012).
5 CONCLUSIONS
Using the observations carried out at the AZT-33IK telescope and the archival spectroscopic data from the 6dF survey, we managed to identify 14 new AGNs among the X-ray sources detected in the 4–12 keV energy band during the first five SRG/ART-XC all-sky surveys. All sources are also detected with confidence by eROSITA in the 0.2–8.0 keV energy band. All objects turned out to be nearby () Seyfert galaxies (one NLSy1, three Sy1, four Sy1.9, and six Sy2).
For all objects we constructed broadband (0.2–12 keV) X-ray spectra based on data from the ART-XC and eROSITA telescopes onboard the SRG observatory. In four objects the intrinsic absorption exceeds cm-2 at 90% confidence, and one of them (SRGA J001439.6+183503) is probably heavily obscured ( cm-2 with 90% confidence). Interestingly, in the latter case the absorption can be mainly associated not with the dusty torus around the central supermassive black hole, but with the great thickness of the interstellar medium of an edge-on galaxy.
This paper continues our series of publications on the optical identification of X-ray sources detected during the SRG/ART-XC all sky survey. The result obtained will help to obtain a large (2000 objects), statistically complete sample of AGNs selected by their emission in the hard 4–12 keV X-ray energy band on completion of the planned eight sky surveys.
Acknowledgements
This work was supported by RSF grant no. 19-12-00396. The measurements with the AZT-33IK telescope were supported by the Ministry of Education and Science of Russia and were obtained using the equipment of the Angara sharing center777http://ckp-rf.ru/ckp/3056/. In this study we used observational data from the ART-XC and eROSITA telescopes onboard the SRG observatory. The SRG observatory was built by Roskosmos in the interests of the Russian Academy of Sciences represented by its Space Research Institute (IKI) within the framework of the Russian Federal Space Program, with the participation of the Deutsches Zentrum fur Luft- und Raumfahrt (DLR). The SRG spacecraft was designed, built, launched, and is operated by the Lavochkin Association and its subcontractors. The science data are downlinked via the Deep Space Network Antennae in Bear Lakes, Ussuriysk, and Baykonur, funded by Roskos- mos. The eROSITA X-ray telescope was built by a consortium of German Institutes led by MPE, and supported by DLR. The eROSITA data used in this work were processed using the eSASS software developed by the German eROSITA consortium and the proprietary data reduction and analysis software developed by the Russian eROSITA Consortium.
References
- Afanasiev et al. (2016) Afanasiev V. L., Dodonov S. N., Amirkhanyan V. R., Moiseev A. V., 2016, Astrophysical Bulletin, 71, 479
- Arnaud (1996) Arnaud K. A., 1996, in Jacoby G. H., Barnes J., eds, Astronomical Society of the Pacific Conference Series Vol. 101, Astronomical Data Analysis Software and Systems V. p. 17
- Baldwin et al. (1981) Baldwin J. A., Phillips M. M., Terlevich R., 1981, Publications of the Astronomical Society of the Pacific, 93, 5
- Boller et al. (2016) Boller T., Freyberg M. J., Trümper J., Haberl F., Voges W., Nandra K., 2016, Astronomy & Astrophysics, 588, A103
- Brandt et al. (1997) Brandt W. N., Mathur S., Elvis M., 1997, MNRAS, 285, L25
- Burenin et al. (2016) Burenin R. A., et al., 2016, Astronomy Letters, 42, 295
- Cardelli et al. (1989) Cardelli J. A., Clayton G. C., Mathis J. S., 1989, ApJ, 345, 245
- Chambers et al. (2016) Chambers K. C., et al., 2016, arXiv e-prints, p. arXiv:1612.05560
- Evans et al. (2019) Evans P. A., et al., 2019, VizieR Online Data Catalog, p. IX/58
- Gaia Collaboration et al. (2022) Gaia Collaboration et al., 2022, arXiv e-prints, p. arXiv:2208.00211
- Greene & Ho (2005) Greene J. E., Ho L. C., 2005, ApJ, 630, 122
- Guainazzi & Bianchi (2007) Guainazzi M., Bianchi S., 2007, MNRAS, 374, 1290
- Guainazzi et al. (2005) Guainazzi M., Matt G., Perola G. C., 2005, A&A, 444, 119
- HI4PI Collaboration et al. (2016) HI4PI Collaboration et al., 2016, A&A, 594, A116
- Jones et al. (2004) Jones D. H., et al., 2004, Monthly Notices of the Royal Astronomical Society, 355, 747
- Jones et al. (2009) Jones D. H., et al., 2009, Monthly Notices of the Royal Astronomical Society, 399, 683
- Kauffmann et al. (2003) Kauffmann G., et al., 2003, Monthly Notices of the Royal Astronomical Society, 346, 1055
- Kewley et al. (2001) Kewley L. J., Dopita M. A., Sutherland R. S., Heisler C. A., Trevena J., 2001, The Astrophysical Journal, 556, 121
- Khorunzhev et al. (2012) Khorunzhev G. A., Sazonov S. Y., Burenin R. A., Tkachenko A. Y., 2012, Astronomy Letters, 38, 475
- Leighly (1999) Leighly K. M., 1999, ApJS, 125, 317
- Lutovinov et al. (2022) Lutovinov A. A., et al., 2022, A&A, 661, A28
- Mereminskiy et al. (2022) Mereminskiy I. A., et al., 2022, A&A, 661, A32
- Oh et al. (2018) Oh K., et al., 2018, The Astrophysical Journal Supplement Series, 235, 4
- Osterbrock (1981) Osterbrock D. E., 1981, The Astrophysical Journal, 249, 462
- Pavlinsky et al. (2021) Pavlinsky M., et al., 2021, Astronomy & Astrophysics, 650, A42
- Pavlinsky et al. (2022) Pavlinsky M., et al., 2022, Astronomy & Astrophysics, 661, A38
- Predehl et al. (2021) Predehl P., et al., 2021, Astronomy & Astrophysics, 647, A1
- Saxton et al. (2008) Saxton R. D., Read A. M., Esquej P., Freyberg M. J., Altieri B., Bermejo D., 2008, VizieR Online Data Catalog, pp J/A+A/480/611
- Sazonov et al. (2012) Sazonov S., et al., 2012, ApJ, 757, 181
- Schawinski et al. (2007) Schawinski K., Thomas D., Sarzi M., Maraston C., Kaviraj S., Joo S.-J., Yi S. K., Silk J., 2007, Monthly Notices of the Royal Astronomical Society, 382, 1415
- Schlafly & Finkbeiner (2011) Schlafly E. F., Finkbeiner D. P., 2011, ApJ, 737, 103
- Schlegel et al. (1998) Schlegel D. J., Finkbeiner D. P., Davis M., 1998, ApJ, 500, 525
- Smith et al. (2001) Smith R. K., Brickhouse N. S., Liedahl D. A., Raymond J. C., 2001, ApJ, 556, L91
- Sunyaev et al. (2021) Sunyaev R., et al., 2021, Astronomy & Astrophysics, 656, A132
- Uskov et al. (2022) Uskov G. S., et al., 2022, Astronomy Letters, 48, 87
- Véron-Cetty et al. (2001) Véron-Cetty M.-P., Véron P., Gonçalves A. C., 2001, Astronomy & Astrophysics, 372, 730
- XMM-SSC (2018) XMM-SSC 2018, VizieR Online Data Catalog, p. IX/53
- Zaznobin et al. (2021) Zaznobin I. A., et al., 2021, Astronomy Letters, 47, 71
- Zaznobin et al. (2022) Zaznobin I., et al., 2022, Astronomy & Astrophysics, 661, A39
6 APPENDIX
SRGA J001439.6+183503
 SRGA J002240.8+804348
 SRGA J010742.9+574419
SRGA J021227.3+520953
 SRGA J025208.4+482955
 SRGA J045432.1+524003
SRGA J051313.5+662747
 SRGA J110945.8+800815
 SRGA J161251.4052100
SRGA J161943.7132609
 SRGA J182109.8+765819
 SRGA J193707.6+660816
SRGA J200331.2+701332
 SRGA J211149.5+722815
| Line | Wavelength, Å | Flux, erg s-1 cm-2 | Equiv. width, Å | , km/s |
|---|---|---|---|---|
| SRGA J001439.6+183503 | ||||
| H | ||||
| [NII]6583 | ||||
| SRGA J002240.8+804348 | ||||
| H, broad | ||||
| H, broad | ||||
| H | ||||
| [OIII]4959 | ||||
| [OIII]5007 | ||||
| H, broad | ||||
| SRGA J010742.9+574419 | ||||
| H | ||||
| [OIII]4959 | ||||
| [OIII]5007 | ||||
| [NII]6548 | ||||
| H, broad | ||||
| H | ||||
| [NII]6583 | ||||
| SRGA J021227.3+520953 | ||||
| H, broad | ||||
| H | ||||
| [OIII]4959 | ||||
| [OIII]5007 | ||||
| [NII]6548 | ||||
| H, broad | ||||
| H | ||||
| [NII]6583 | ||||
| [SII]6716 | ||||
| [SII]6730 | ||||
| SRGA J025208.4+482955 | ||||
| H | ||||
| [OIII]4959 | ||||
| [OIII]5007 | ||||
| [OI]6300 | ||||
| [NII]6548 | ||||
| H, broad | ||||
| H | ||||
| [NII]6583 | ||||
| [SII]6716 | ||||
| [SII]6730 | ||||
| Line | Wavelength, Å | Flux, erg s-1 cm-2 | Equiv. width, Å | , km/s |
|---|---|---|---|---|
| SRGA J045432.1+524003 | ||||
| H | ||||
| [OIII]4959 | ||||
| [OIII]5007 | ||||
| [OI]6300 | ||||
| [NII]6548 | ||||
| H | ||||
| H, broad | ||||
| [NII]6583 | ||||
| [SII]6716 | ||||
| [SII]6730 | ||||
| SRGA J051313.5+662747 | ||||
| H | ||||
| [OIII]4959 | ||||
| [OIII]5007 | ||||
| [OI]6300 | ||||
| [NII]6548 | ||||
| H | ||||
| [NII]6583 | ||||
| [SII]6716 | ||||
| [SII]6730 | ||||
| SRGA J110945.8+800815 | ||||
| [OII]3727 | ||||
| H | ||||
| [OIII]4959 | ||||
| [OIII]5007 | ||||
| [OI]6300 | ||||
| [NII]6548 | ||||
| H | ||||
| [NII]6583 | ||||
| [SII]6716 | ||||
| [SII]6730 | ||||
| SRGA J161251.4052100 | ||||
| H | ||||
| [NII]6548 | ||||
| [NII]6583 | ||||
| H | ||||
| [OIII]4959 | ||||
| [OIII]5007 | ||||
| SRGA J161943.7132609 | ||||
| H | ||||
| H, broad | ||||
| [NII]6548 | ||||
| [NII]6583 | ||||
| H | ||||
| [OIII]4959 | ||||
| [OIII]5007 | ||||
| Line | Wavelength, Å | Flux, erg s-1 cm-2 | Equiv. width, Å | , km/s |
|---|---|---|---|---|
| SRGA J182109.8+765819 | ||||
| H | ||||
| [OIII]4959 | ||||
| [OIII]5007 | ||||
| [OI]6300 | ||||
| [NII]6548 | ||||
| H | ||||
| [NII]6583 | ||||
| [SII]6716 | ||||
| [SII]6730 | ||||
| SRGA J193707.6+660816 | ||||
| H, broad | ||||
| H, broad | ||||
| H, broad | ||||
| H | ||||
| [OIII]4959 | ||||
| [OIII]5007 | ||||
| [NII]6548 | ||||
| H, broad | ||||
| H | ||||
| [NII]6583 | ||||
| [SII]6716 | ||||
| [SII]6730 | ||||
| SRGA J200331.2+701332 | ||||
| H, broad | ||||
| H | ||||
| [OIII]4959 | ||||
| [OIII]5007 | ||||
| [NII]6548 | ||||
| H, broad | ||||
| H | ||||
| [NII]6583 | ||||
| SRGA J211149.5+722815 | ||||
| H | ||||
| [OIII]4959 | ||||
| [OIII]5007 | ||||
| [NII]6548 | ||||
| H | ||||
| [NII]6583 | ||||
| [SII]6716 | ||||
| [SII]6730 | ||||