Adaptation of Student Behavioural Routines during COVID-19: A Multimodal Approach
Abstract
One population group that had to significantly adapt and change their behaviour during the COVID-19 pandemic is students. While previous studies have extensively investigated the impact of the pandemic on their psychological well-being and academic performance, limited attention has been given to their activity routines. In this work, we analyze students’ behavioural changes by examining qualitative and quantitative differences in their daily routines between two distinct periods (2018 and 2020). Using an Experience Sampling Method (ESM) that captures multimodal self-reported data on students’ activity, locations and sociality, we apply Non-Negative Matrix Factorization (NMF) to extract meaningful behavioural components, and quantified the variations in behaviour between students in 2018 and 2020. Surprisingly, despite the presence of COVID-19 restrictions, we find minimal changes in the activities performed by students, and the diversity of activities also remains largely unaffected. Leveraging the richness of the data at our disposal, we discovered that activities adaptation to the pandemic primarily occurred in the location and sociality dimensions.
keywords:
Research
1 Introduction
The COVID-19 pandemic has had a wide-ranging impact on various components of our daily lives. The implementation of government restrictions such as travel bans, business and school closures, stay-at-home orders and physical distancing mandates aimed at preventing the spread of the virus Perra (2021); Brauner et al. (2021); Chinazzi et al. (2020). These measures resulted in substantial changes in how we live, work, and socialize with long lasting impacts, among others, on human mobility and encounters Chinazzi et al. (2020); Lucchini et al. (2021); Yabe et al. (2023), employment Adams-Prassl et al. (2020); Baek et al. (2021), education Van Lancker and Parolin (2020); Betthäuser et al. (2023); Yang et al. (2021a), mental health and well-being Oved et al. (2021); Delussu et al. (2022); Brodeur et al. (2021).
Traditionally, social scientists have relied on qualitative techniques such as direct observation and fieldwork to study various aspects of our daily lives and gain insights into these social phenomena Goffman (1959); Brown and Shortell (2014). However, these methods have limitations as they can be time-consuming, resource-intensive, and challenging to replicate, making them less suitable for large-scale studies.
In the last decades, the emergence of the digital sensing revolution has provided researchers with vast amounts of quantitative data generated by, among others, social media platforms, credit cards, and mobile phones. Digital data sources collected with these technologies offer unprecedented opportunities to gain insights into individual and group behaviours with a breadth and depth that was previously inconceivable Lazer et al. (2009, 2020). This wealth of digital data has become particularly valuable during the COVID-19 pandemic, enabling researchers to uncover patterns and trends in human behaviour and to understand the changes that have occurred in our daily lives and society as a whole Hou et al. (2021); Bonaccorsi et al. (2021); Persson et al. (2021).
While these data sources allow us to track the behaviour of thousands or even millions of individuals, it’s important to note that the temporal resolution of the collected data is not continuous but rather tied to specific events (e.g., phone calls or traffic data for mobile phone data, app usage for GPS location data, credit card usage for spending data, etc.). Furthermore, these data sources often represent only one aspect of human behaviour at a time such as communication, spending, and mobility.
To overcome these limitations researchers have implemented “living labs” studies, which collect multiple sources of data Eagle and Pentland (2006); Stopczynski et al. (2014); Centellegher et al. (2016); Giunchiglia et al. (2021); Madan et al. (2011); Nepal et al. (2022); Aharony et al. (2011). In these studies, participants were equipped with mobile phones and/or sensing apps installed on their devices to collect data from diverse sources and sensors, including phone and SMS logs, Bluetooth proximity interactions, GPS location data, accelerometer data, etc. Additionally, surveys and experience sampling methodologies were employed to gather information on individual characteristics (e.g., attitudes, personality traits, etc.), on states (e.g., mood, stress levels, etc.) as well as situational and activity data. By integrating data from multiple sources, living labs deployments offer the advantage of capturing a richer representation of the individuals under study.
In our work, we leverage an Experience Sampling Method (ESM) Csikszentmihalyi et al. (2014) approach on smartphones to capture self-reported information on the daily activities of university students. ESM is a methodology aiming at collecting information on the behaviours and emotions of study participants throughout their daily activities and routines Raento et al. (2009); Pejovic et al. (2016); Van Berkel et al. (2017). As in traditional time diary studies, ESM collects data by means of study participants’ self-reports. However, participants, unlike in diary studies, are proactively triggered at various moments during the day. In our work, we ask the study participants to report information on their activities with a prompt every 30 minutes, and we collect not only the activity of the students but also their location and sociality (i.e., with whom they were). Hence, this approach produces a unique understanding of students’ behaviour from the point of view of these three different behavioural dimensions. Moreover, the ESM-based data collection happened in two periods, in 2018 and 2020, and we leverage these data to analyse how students’ routines changed across all these three behavioural dimensions during the COVID-19 pandemic.
In particular, we use Non-Negative Matrix Factorization (NMF) Sra and Dhillon (2005); Cichocki and Phan (2009) to extract meaningful behavioural components (i.e., routines) from self-reported data. By analyzing the extracted components and their associated weights, we are able to quantify the differences in behaviour between students in 2018 and students in 2020. Our findings indicate that despite the impact of the pandemic, the activity routines of students in 2018 and 2020 remained largely similar with minimal differences observed. However, with the multimodal information collected through the time diaries, we discovered that the behavioural dimensions of location and sociality exhibited stronger signals of adaptation. To delve deeper into this shift of behaviour, we first examine the relationship between activities and locations, then the relationship between activities and sociality. This approach allows us to identify the activities that were associated with diverse locations and sociality routines before and during the pandemic. Notably, activities such as studying and attending lessons, which had a social component before the pandemic, transitioned to solitary activities, done in private homes, even if students could go to the university. We find that most of the extracted routines in 2020 follow this pattern, and take place at home and alone, while in 2018 students visited more diverse locations and spent more time with friends. For example, social life is more present in 2018, with students spending time with friends, while in 2020 this activity is done with roommates, thus people residing in the same household.
2 Related Work
2.1 Behaviours and Routines Modelling
In recent years, the field of modelling human behaviour and routines has witnessed significant growth, thanks to advancements in mobile sensing Lane et al. (2010) and experience sampling approaches Raento et al. (2009).
Various techniques have been employed to understand individual behaviour. Principal Component Analysis (PCA) was used to extract students’ routines (eigenbehaviours) Eagle and Pentland (2009), from the Reality Mining dataset Eagle and Pentland (2006). Techniques typically used for Natural Language Processing tasks Yao et al. (2009) have been used to extract regular behavioural patterns from sequential data, such as Latent Dirichlet Allocation Blei et al. (2003), which was also used to group individual activities into routines Huynh et al. (2008); Farrahi and Gatica-Perez (2010). Other sequence analysis techniques have been used as well Brdiczka et al. (2010); Vagni and Cornwell (2018), from modelling purchasing behaviour Di Clemente et al. (2018) to the analysis of individual mobility Lucchini et al. (2021).
Other methods include more complex tools, such as Hidden Markov Models Pierson et al. (2018), Conditional Random Fields Fatima et al. (2013) and Bayesian Networks Xu et al. (2017). These approaches are commonly used to build predictive and generative models, and can be used to detect the activities from sensor data and images Fatima et al. (2013); Xu et al. (2017) or to model cyclic behaviour and its anomalies Pierson et al. (2018). While these methods have their advantages, in our study, we aim to identify easily interpretable and human-readable patterns to compare and measure behavioural differences.
In recent years, Non-Negative Matrix Factorization (NMF) Sra and Dhillon (2005) has gained popularity, thanks to its interpretability. NMF has proven to be effective in identifying repeating patterns in the daily behaviours of people, both at an individual and a collective level. NMF has been successfully applied in various domains, such as in analyzing social interactions in networks Gauvin et al. (2014), understanding of chronotypes Aledavood et al. (2022), and identifying routines in urban environments Di Clemente et al. (2018); Yang et al. (2023). Inspired by these studies, we use NMF in our methodology, as it allows us to associate the resulting patterns with realistic individual behaviour, and the weights associated with these patterns provide a quantitative measure of behavioural differences. Additionally, following Zhang et al. (2021), we include in our methodology, the use of multiple modalities to analyse subjects’ behaviour, which includes (i) activity, (ii) location, and (iii) sociality dimensions.
2.2 Behavioural Change and the Pandemic
There has been an upsurge of scientific research in response to the COVID-19 crisis aimed at understanding and mitigating the spread of the virus Chinazzi et al. (2020); Aleta et al. (2020). The various consequences and effects of COVID-19 restrictions on the population, spanning economic, social, and psychological domains have been tackled in diverse disciplines.
From an economic perspective, studies have demonstrated that the effects of restrictions differ across individuals with varying income levels, often increasing segregation. For instance, in Italy, the mobility reduction was higher in high fiscal capacity municipalities, which also display high income inequality Bonaccorsi et al. (2020). Similar findings have emerged in other countries such as France and the United Kingdom, where the mobility network became more fragmented on a national scale but maintained more connections on a small scale Galeazzi et al. (2021). In the United States, researchers have observed a decrease in encounters between citizens of different income levels in urban areas, hindering economic recovery and city growth Yabe et al. (2023), despite mobility returning to pre-pandemic levels.
Another area of interest has been the well-being of the population, with a particular focus on students, enhancing research that was present even before the pandemic Xu et al. (2019). The impact of the pandemic on students’ educational paths has been substantial Betthäuser et al. (2023), as shown in studies on academic performance and mental well-being Gonzalez et al. (2020). Research has indicated a significant increase in stress and anxiety levels among younger students during lockdowns Guo et al. (2021), particularly college and university students Yang et al. (2021b, a); Ochnik et al. (2021).
Previous studies on students primarily rely on surveys and self-reported data, often neglecting the impact on behavioural routines. Furthermore, only a few studies consider multiple dimensions of behaviour and well-being with high-resolution data. For instance, the study conducted in Nepal et al. (2022) combines surveys with mobile sensing data to explore how students’ perspectives and concerns regarding the pandemic lead to diverse responses to restrictions and shifts in behaviour.
In contrast, our work demonstrates the utility of Experience Sampling Methods on smartphones, which provide a wealth of information on activities, locations, and social interactions in a real-world setting. These methodologies offer a level of granularity, particularly in activity definition, that cannot be achieved through passive sensor data collected by mobile phones. Moreover, we highlight how these methodologies can be harnessed to understand multiple dimensions of students’ behaviour, both independently and in conjunction with one another.
3 Data
The data utilized in this work are derived from two separate datasets collected during two distinct living lab studies: the SmartUniTn study Giunchiglia et al. (2017a); Giunchiglia et al. (2017b, 2018) conducted in 2018, and the subsequent WeNet study Giunchiglia et al. (2021); Assi et al. (2023); Meegahapola et al. (2023) conducted in 2020.
The SmartUniTn study gathered both sensor data and questionnaire responses from students at the University of Trento, employing the iLog Zeni et al. (2014) smartphone application. Over a period of two weeks, with a frequency of 30 minutes, participants were requested to complete a Time Diary via the Experience Sampling Method (ESM) application. Each entry in the diary required students to report their activity (e.g., studying, eating, etc.), location (e.g., home, university, bar, etc.), and sociality, indicating whether they were alone or in the company of others (e.g., alone, friends, relatives, etc.). The response options were predefined to ensure uniformity and minimize user biases in activity descriptions (refer to Giunchiglia et al. (2017a) for the available sets of responses). This comprehensive dataset, which was collected from May 10th to May 23rd, 2018, provides a multimodal representation of student behaviour in a period when students attended classes and prepared for the summer exam session.
The subsequent WeNet study Giunchiglia et al. (2021) expanded upon the SmartUniTn study by extending the data collection to include seven universities worldwide, including the University of Trento. To ensure consistency with the previous study, we only focused on the data from the latter university. The data collection process closely followed that of the SmartUniTn study, with refinements made to the sets of activities and locations (for detailed information, see Giunchiglia et al. (2021)). Notably, the data collection occurred during the COVID-19 pandemic, and as such, specific government restrictions were in place at the time. The Time Diaries were collected between November 14th and November 30th, 2020, a period during which the government of the province of Trento implemented several restrictions covid_tn . Certain activities, such as gyms, were closed, while others, like shops, had limited access. Distancing measures were enforced in various contexts, including bars and restaurants, where in addition to physical distancing, time restrictions were imposed on the duration people could spend at these locations. Moreover, while schools were generally closed, first-year students participating in our study could attend lessons in-person.
4 Methods
4.1 Data Processing
Since the data collection of the two studies was performed in different iterations, the student samples are different. However, the study settings remained consistent, and the population under examination was similar as both studies focused on students. To facilitate a more robust comparison between the groups of students in 2018 and 2020, we performed a mapping between the categories in the Time Diaries to ensure the comparability of activities, locations, and sociality categories. Given that the data collected in 2020 were more refined, the mapping primarily involved the alignment of certain activities and locations, where multiple entries from 2020 were mapped into a single entry from 2018. For instance, activities like Free Time Study, Arts, Hobbies, and Games in 2020 were all mapped to Hobbies as in 2018. A comprehensive list of activity and location mappings can be found in Appendix A.
Subsequently, we organized the data to follow circadian cycles starting at 5 AM, ensuring that the daily Time Diaries of each student were appropriately aligned. We excluded days and students with insufficient reported data. Additionally, as our focus was on typical behaviour during a regular student week, we excluded weekends from our analysis.
Given that Time Diaries provide insights into three different facets of behaviour (activity, location and sociality), we created three distinct matrices, each corresponding to the type of information collected. In these matrices, the rows represent students, while the columns represent their behaviour throughout the day. To achieve this, we allocated a number of columns (or features) equal to , where represents the set of possible choices for each data type (e.g., the possible activities for the activity matrix), and 48 represents the number of time intervals within a day (given that the data was collected every 30 minutes). Consequently, the matrices have dimensions of , with denoting the 247 students from both datasets. Each matrix contains the normalized counts of observed behaviour (activity, location and socialty) within specific time slots for each student.
4.2 Non-Negative Matrix Factorization
To extract meaningful daily routines from our data, we applied Non-Negative Matrix Factorization (NMF) Sra and Dhillon (2005); Cichocki and Phan (2009), a matrix decomposition technique. The algorithm111The algorithm was implemented using the scikit-learn Python package, identifies recurring patterns within the input data and approximates the original data by representing it as a linear combination of these patterns. NMF operates on non-negative matrices and decomposes them into two non-negative matrices, making the results easier to interpret, as applications in image analysis Lee and Seung (1999) and text mining Pauca et al. (2004) show.
In more detail, NMF decomposes each of our behavioural matrices, denoted as , into an approximation . Here, represents the matrix of extracted components, where denotes the number of features defining the behaviour (as defined in Section 4.1), and represents the number of extracted components or rank. Consequently, the matrix contains the weights of each feature for each component, while the matrix has dimensions and contains the weights of the components for each student. The algorithm leverages its inherent clustering property to identify common observations within , storing the discovered repeating patterns in . For example, in the location matrix, the matrix of extracted components captures common textitlocation routines among students, while the matrix contains the weights of the extracted components for each student. The original behaviour of a student can thus be reconstructed as: .
The approximation is achieved by minimizing the reconstruction error computed using the Frobenius distance:
| (1) |
The NMF algorithm takes the rank as a parameter, indicating the number of components to extract. To determine the optimal number of components, we used the cophenetic correlation coefficient Brunet et al. (2004), a common practice in the literature Aledavood et al. (2022); Yabe et al. (2023). The coefficient measures the preservation of the distance between different observations during the NMF transformation, indicating the reliability of the components. Typically, the rank is chosen where the cophenetic coefficient is maximized and begins to decline. In our analysis, we selected the number of components by considering the cophenetic coefficient, and when the choice was not evident, we prioritized the rank that yielded the most interpretable components.
5 Results
5.1 Investigating Students’ Behaviour in 2018 and 2020
We started our analysis by examining the behavioural patterns present in both samples of students in 2018 and 2020. We applied NMF, as described in Section 4, on the matrices with students from both the 2018 and 2020 data collection campaigns. Including both samples allowed us to analyze the behaviour of the two groups of students and to extract the most dominant students’ routines in both 2018 and 2020. By using the three separate matrices that represented activity, location, and sociality behaviours, we identified 6 activity routines, 4 location routines, and 7 sociality routines.
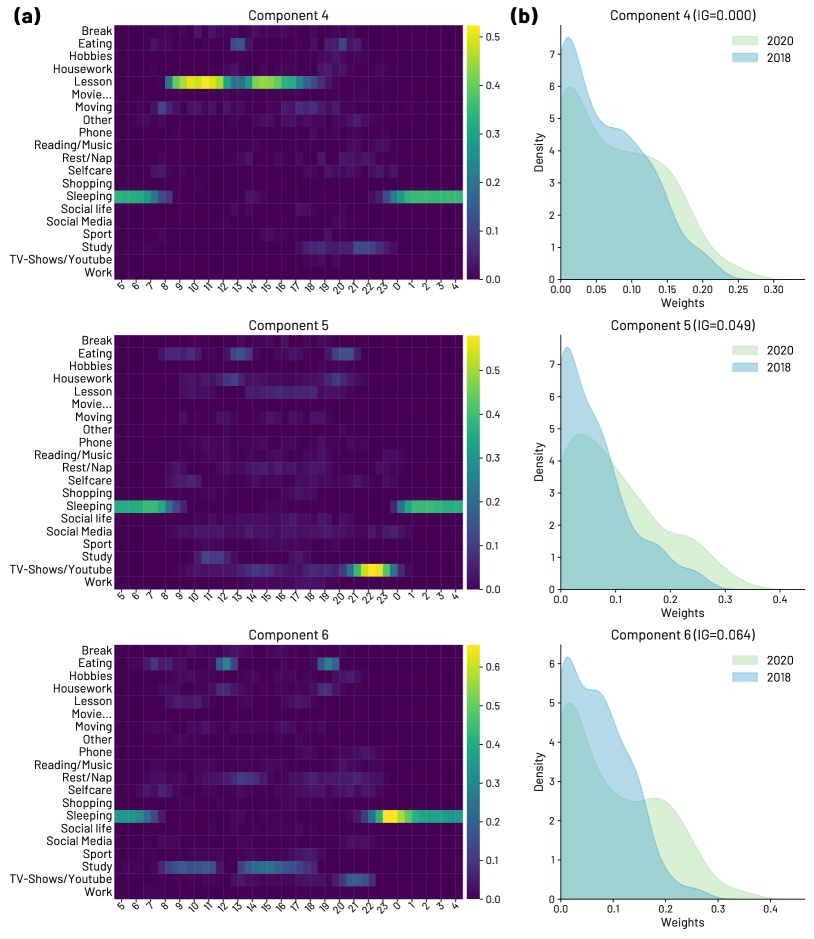
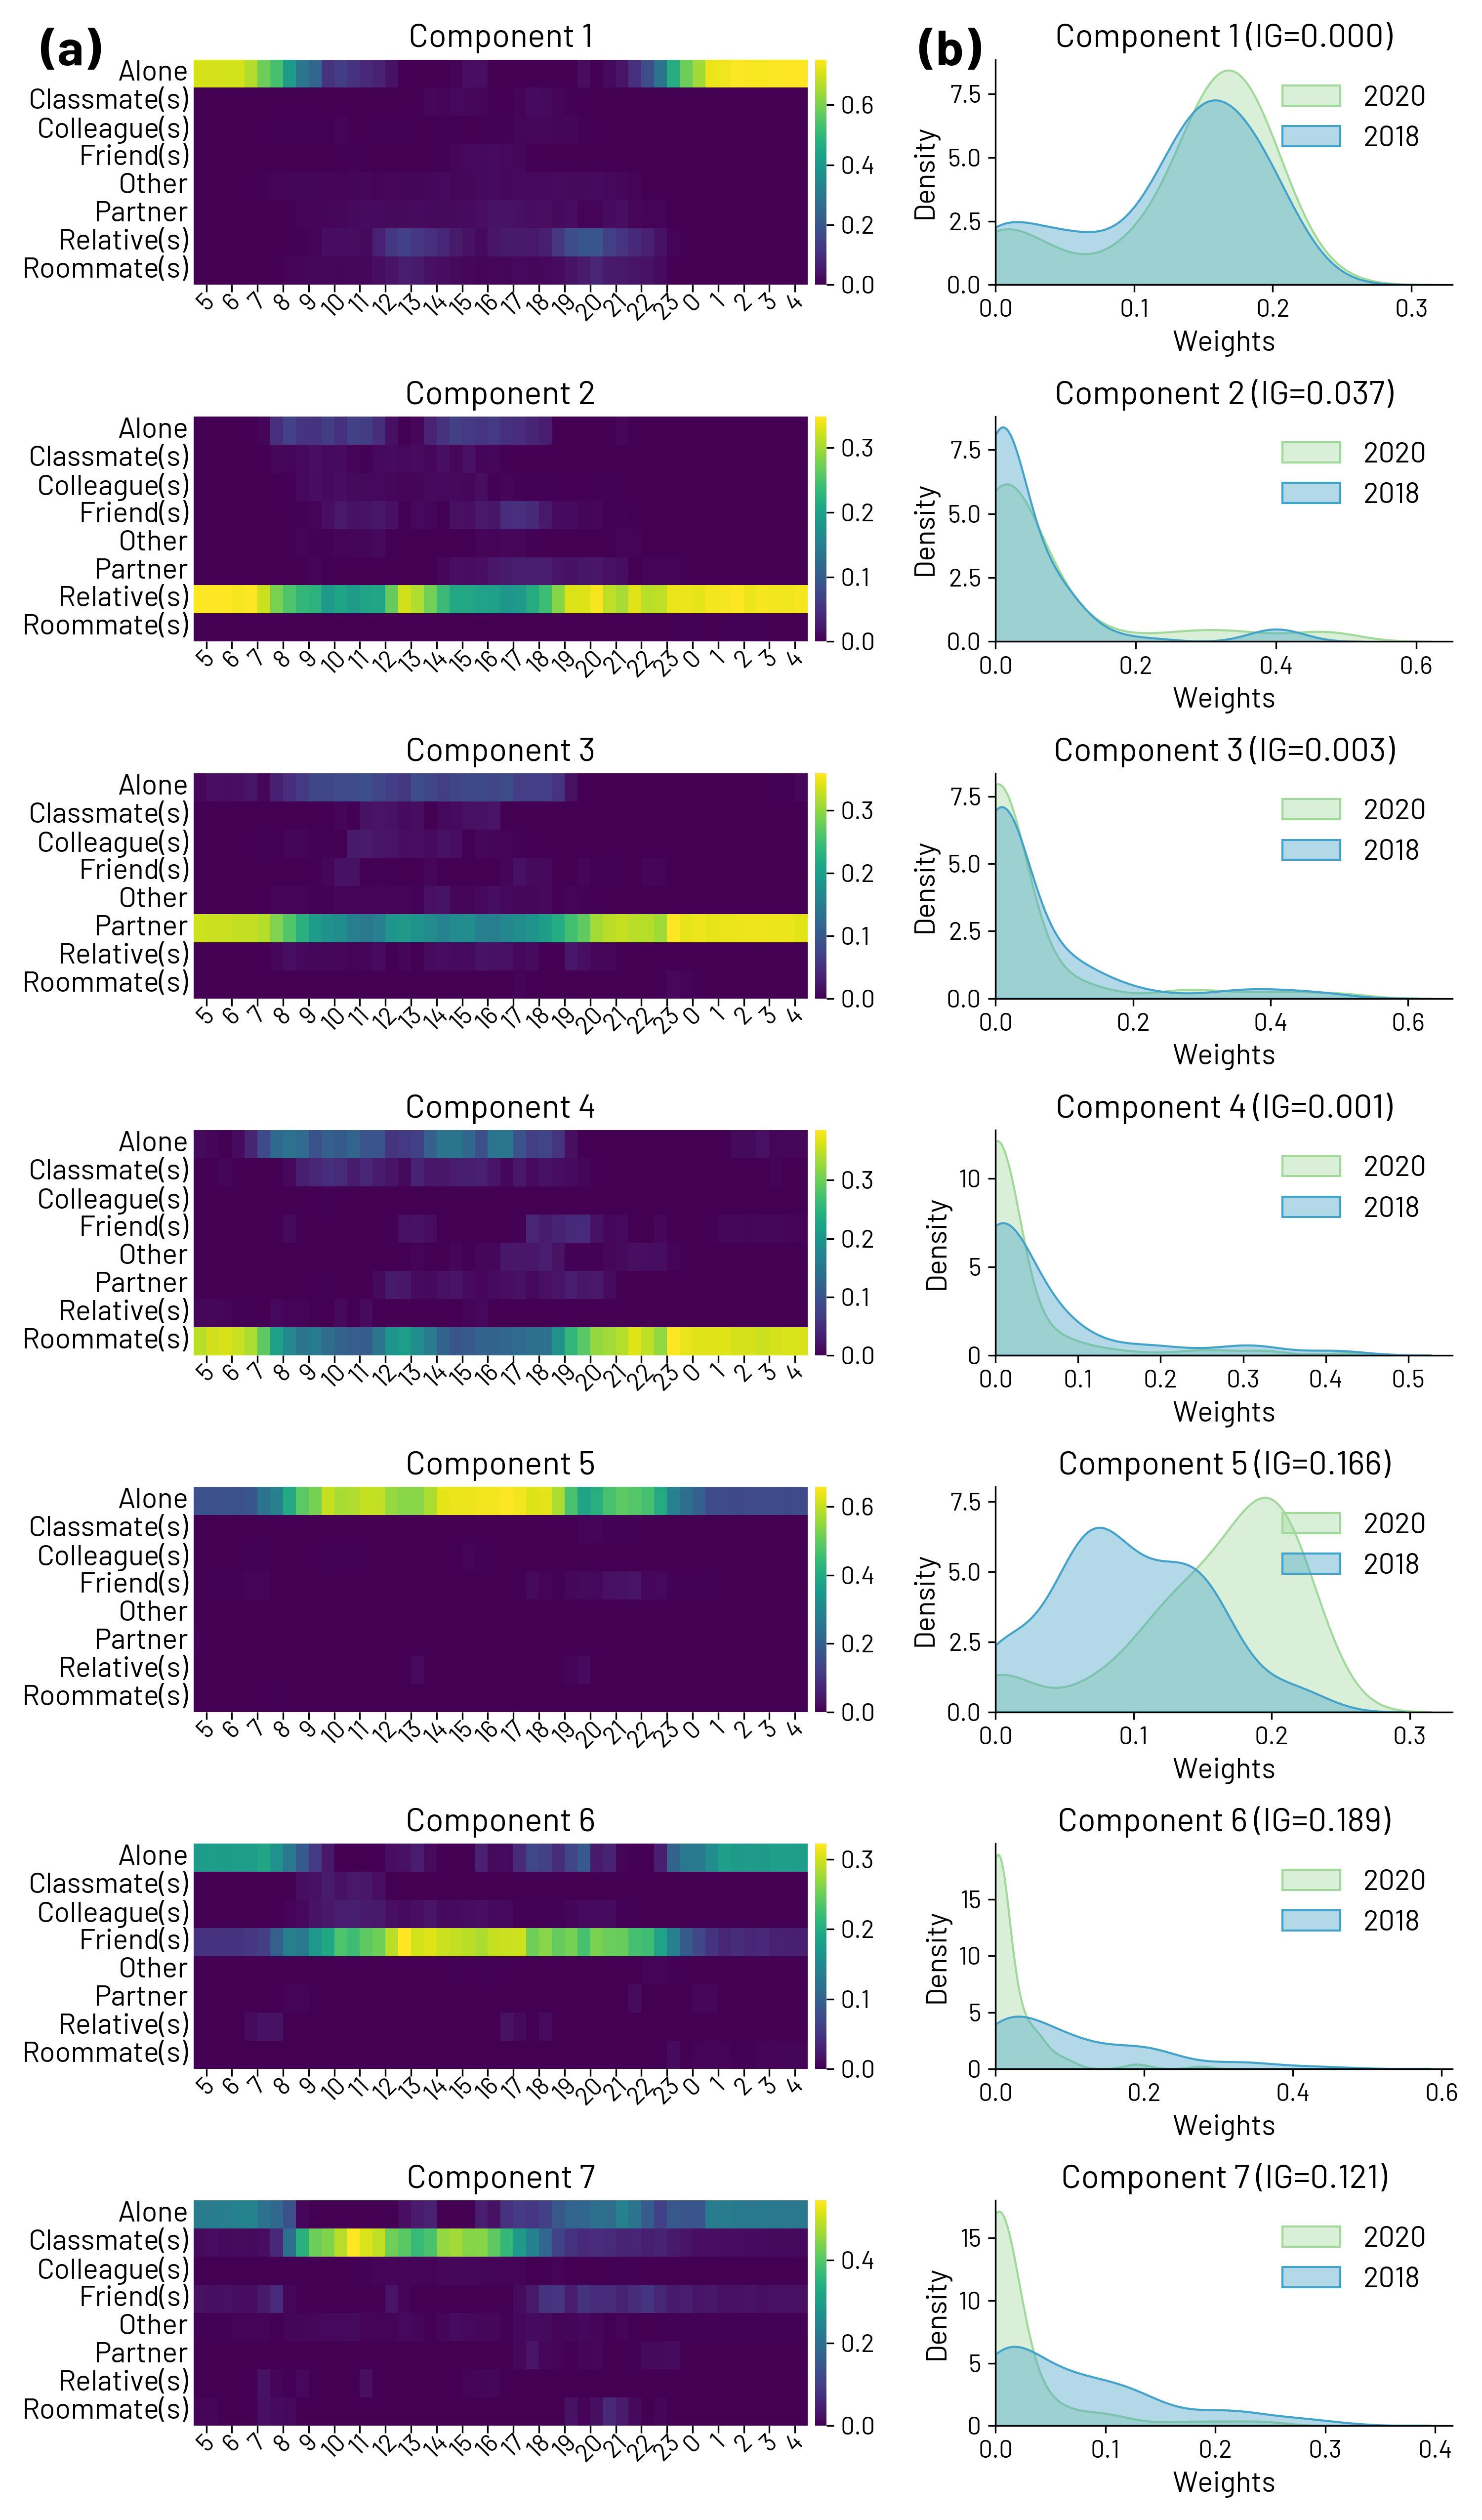
In Figure 1 and Figure 2, we observe the 6 activity components (or routines) extracted by the algorithm. Note that the order of the components is not related to their significance, unlike other techniques such as Principal Component Analysis. The heatmaps (Figure 1(a) and Figure 2(a)) illustrate the weight of each activity at specific times of the day, with higher weights indicating a higher occurrence of the activity. As it is possible to observe, during the day, certain routine patterns are more prominent than others, with essential activities like eating and sleeping being influenced by other activities of the day. For example, this can be seen in Component 5, where students go to sleep later than other components (e.g., Component 6) because they watch YouTube and TV shows. Furthermore, NMF correctly extracts routines related to a student’s academic life, and activities such as attending lessons and studying exhibit high weights in three components (3, 4, and 6). However, other behavioural patterns are less clear. Components 1 and 2 (in Figure 1(a)) include several activities that share time allocations, indicating more complex daily routines. Component 1 is the routine that mostly captures social life, with higher weights for commuting (Moving) and social activities during the late afternoon and evening (Social Life).
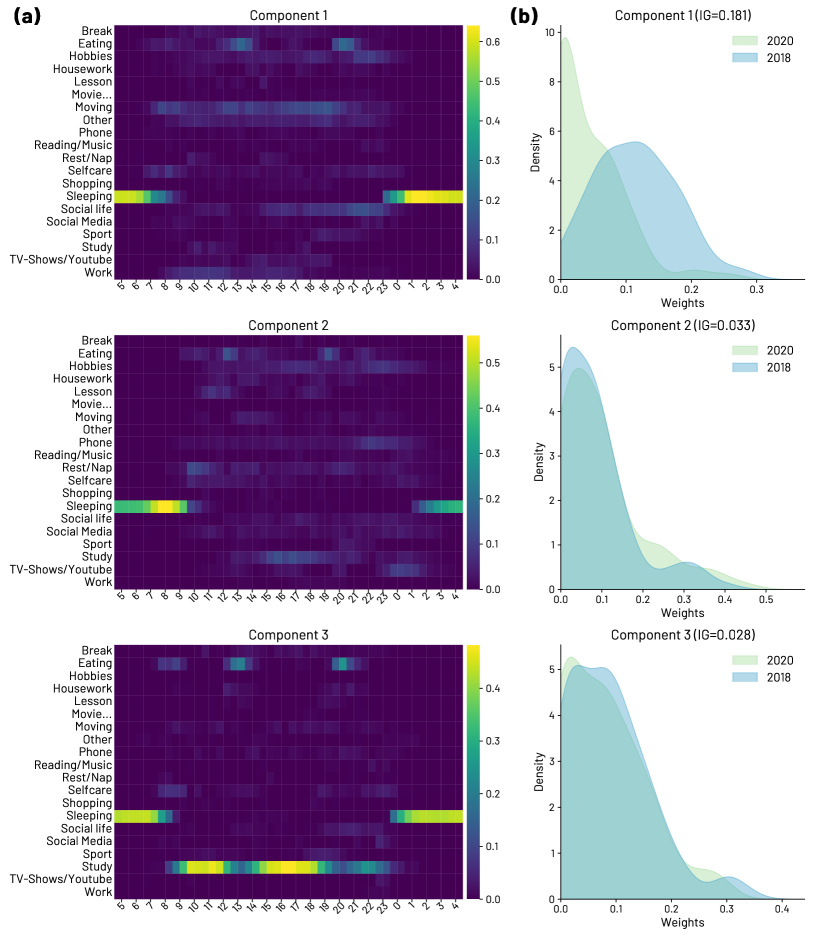
A natural question that follows after looking at the most dominant activity routines extracted by the NMF algorithm, is whether the behaviour described by a component is more associated with typical behaviours of students in 2018 or 2020. We can investigate such association by looking at the weights extracted by the NMF algorithm present in matrix (see Section 4.2).
The weights assigned to students on the extracted components provide a measure of the presence of each component in their behaviour. Higher weights indicate a stronger association with the respective NMF component. Figure 1(b) and Figure 2(b) display the distributions of component weights for students in 2018 and 2020. A noticeable difference is observed in the first component, characterized by students moving around and engaging in evening social activities, which is more closely associated with a behaviour typical of 2018, as indicated by the higher values of the weight distribution. The distribution for students in 2020 is much more skewed towards 0, meaning that this kind of behaviour was not present, probably due to the COVID-19 restrictions imposed during 2020 (see Section 3). Also, Component 6 (Figure 2) displays a (small) distinction between the 2018 and 2020 students groups, with typical behaviours in which students study during the day and watch YouTube, TV shows, or similar activities in the evening. Here, the weight distribution for students in 2020 exhibits a heavier tail and a second saddle point, with larger values compared to the weights of 2018 students, thus associating this more sedentary routine more with 2020 than 2018.
Examining the weight distributions of the other components, it becomes evident that there are just small differences between the two groups of students. This observation is quantitatively supported by the Information Gain (IG), computed for each of the components, which quantifies the amount of information that knowing the weight of a component gives in discriminating whether the described behaviour is typical of a student in 2018 or 2020 (higher IG values indicate a larger separation in the distributions). As reported in Figure 1(b) and Figure 2(b), we can see that the first component carries the most informative weight, while the remaining components do not exhibit notable differences between 2018 and 2020.
Interestingly, the extracted activity routines displayed minimal changes between 2018 and 2020. Despite the pandemic restrictions, students in Trento maintained their activity behaviours focused on lessons and studying, while adapting their location and social interactions.
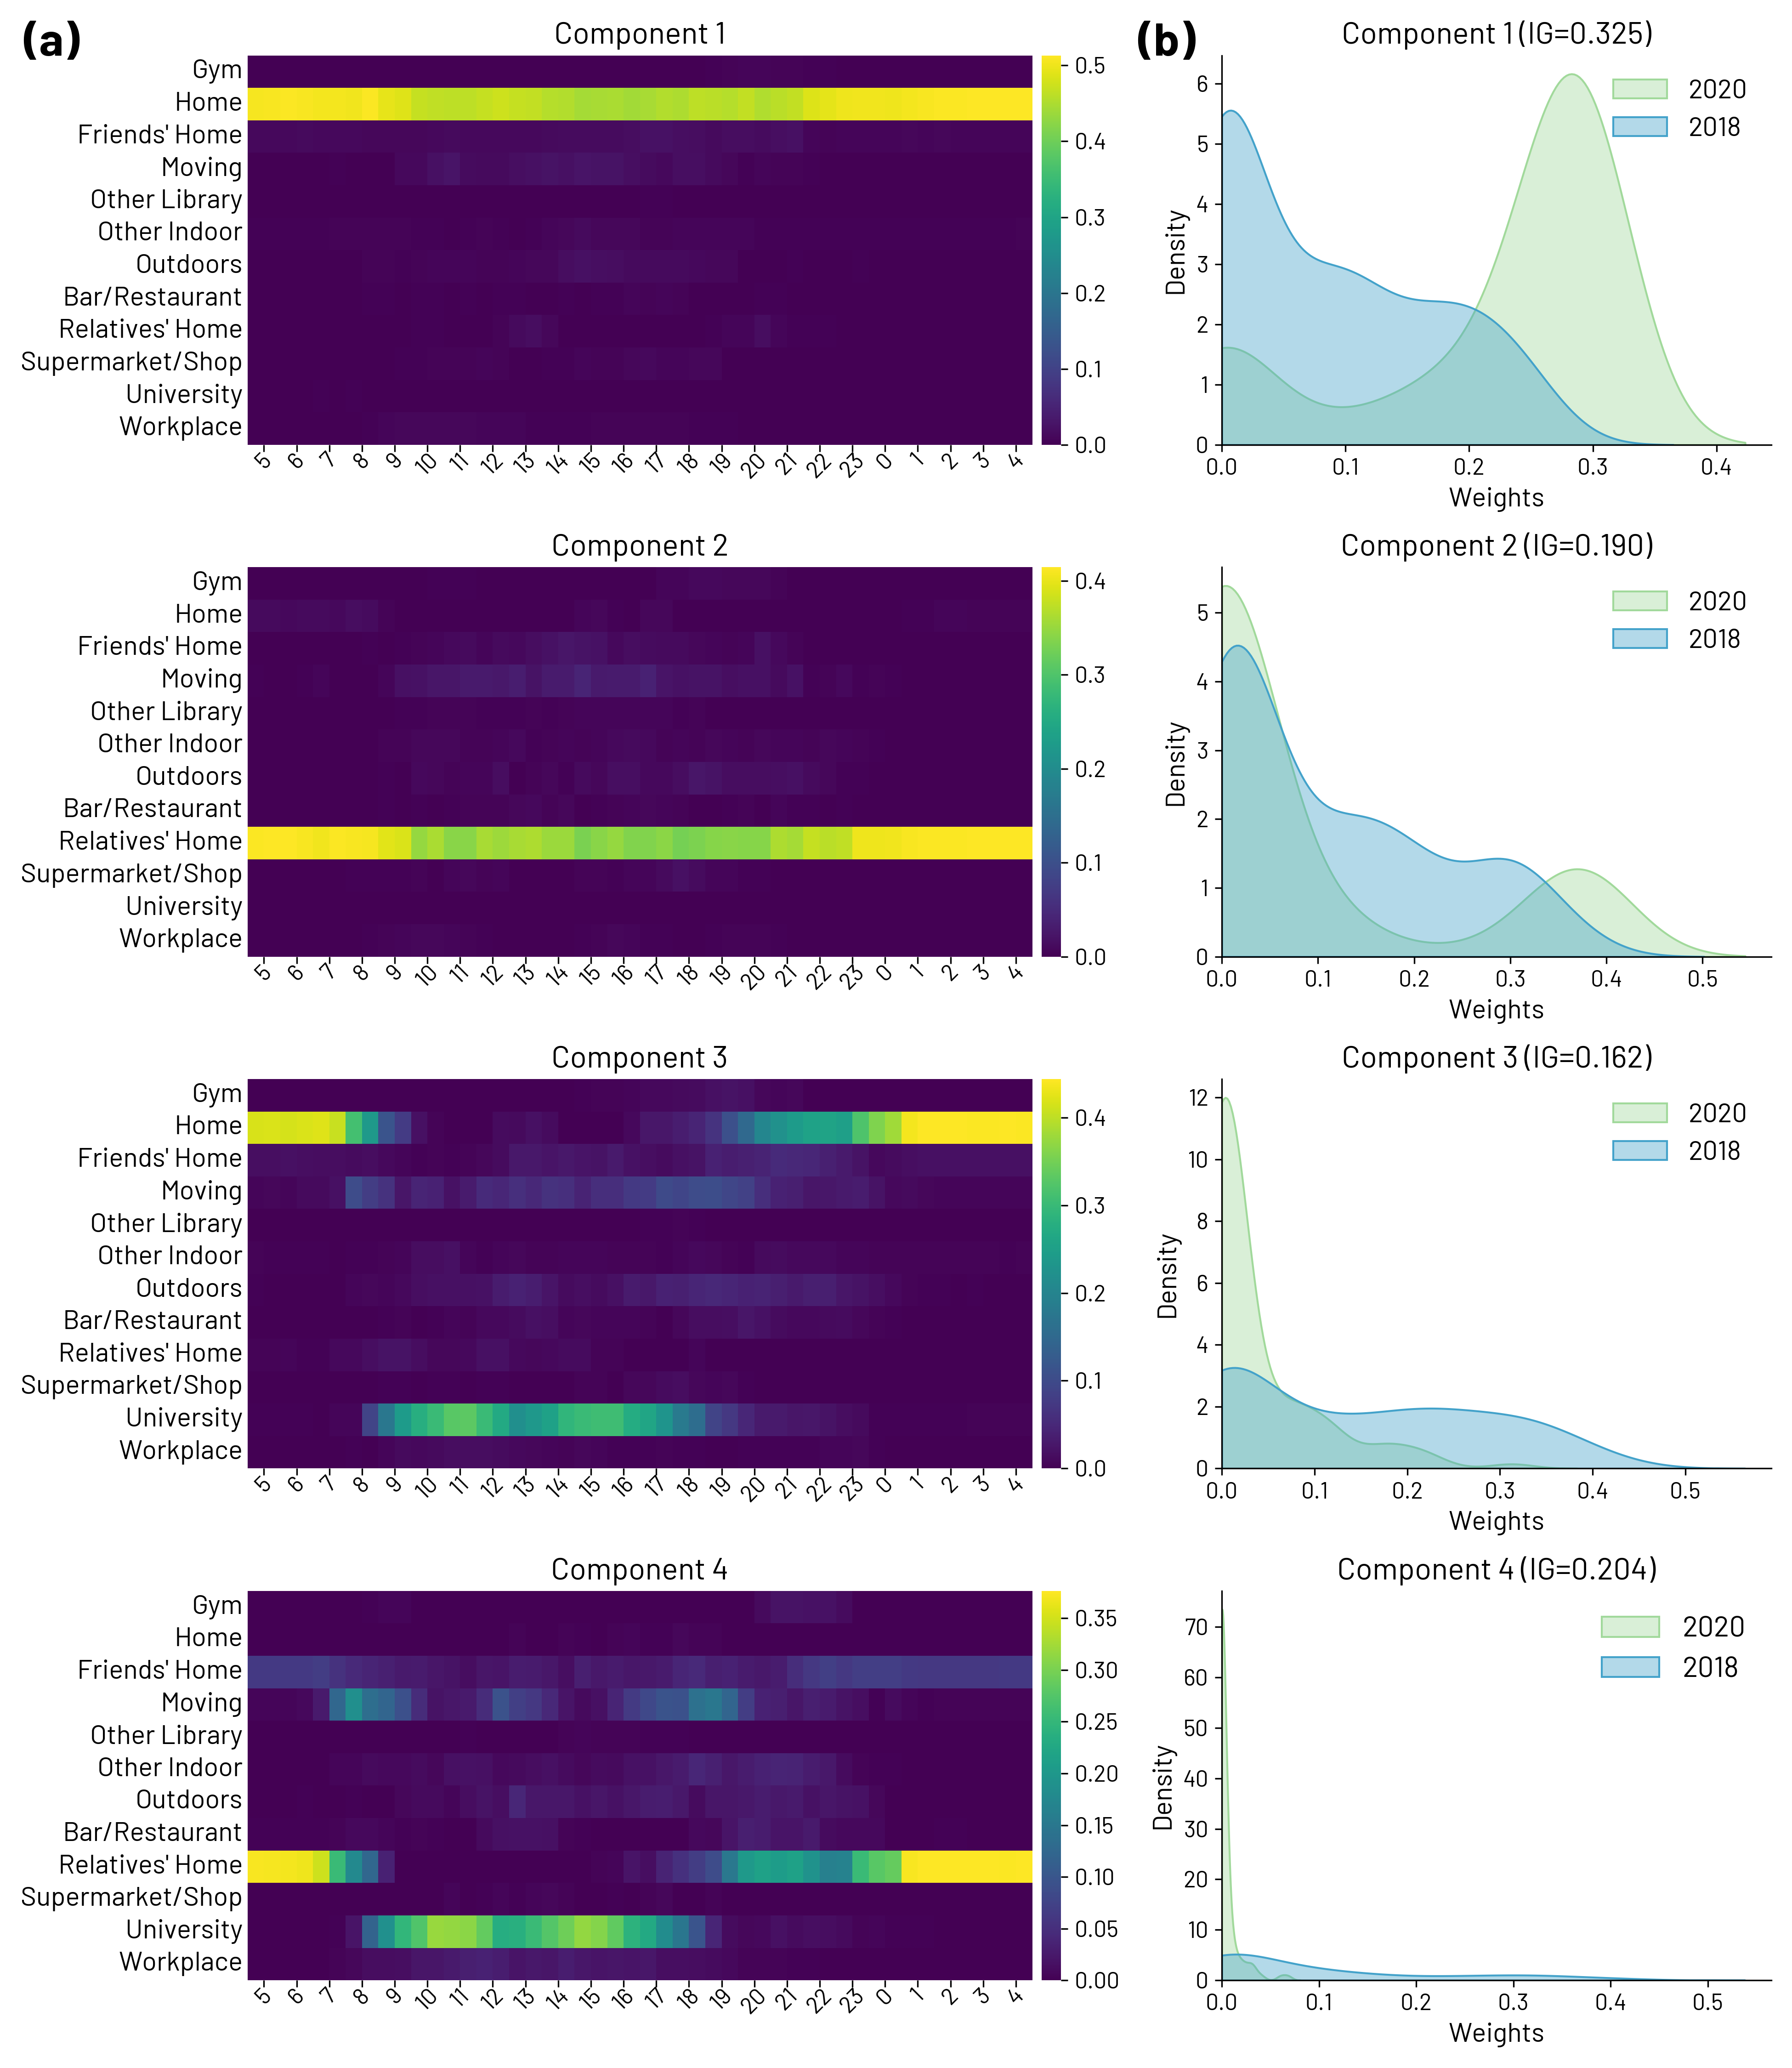
As detailed in Appendix B, more pronounced differences were observed in the locations visited and in the social interactions between the two time periods. These disparities were expected due to the imposed restrictions, which limited mobility and reduced interpersonal interactions in 2020. Among the four location routines identified through the NMF decomposition, staying at home throughout the day exhibited a significantly stronger association with students in 2020, while going to the university was less common in 2020 compared to 2018 (Components 1 and 4, see Figure A1). These differences are supported by higher values of Information Gain.
Furthermore, the imposed restrictions also affected social gatherings, which, along with limitations on location visits, influenced students’ social behaviour. Our analysis revealed differences in three out of seven extracted sociality components. These three routines encompassed spending a day alone, spending a day with friends, and a working day with classmates (Components 5, 6, 7, see Figure A2). As expected, higher weights were observed for a day spent alone among 2020 students, while routines involving friends and classmates showed higher weights for 2018 students.
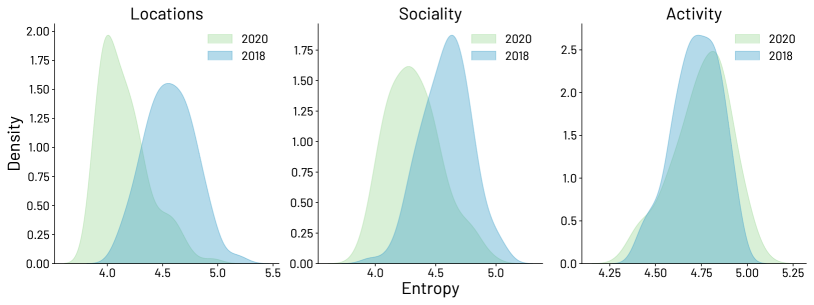
To support our findings, we conducted a quantitative evaluation of the diversity of behaviours between 2018 and 2020. To measure this diversity, we calculated the Shannon’s entropy of students’ behaviours using the activity, location, and sociality matrices. The distributions depicted in Figure 3 represent the entropy computed for each student’s normalized counts across the three types of information captured in the Time Diaries.
The results clearly indicate that in the activity dimension, the diversity of activities performed by students in 2018 and 2020 is similar, suggesting that the variety of activities did not decrease significantly in 2020. However, in the location, and sociality dimensions, the entropy for 2020 is lower than the entropy of 2018. This indicates that the COVID-19 restrictions had a noticeable impact on the diversity of behaviours in these dimensions, with a reduction in the range of locations visited and the social interactions engaged in by students in 2020. The lower entropy values suggest a more limited range of options and routines in terms of locations and social behaviours due to the pandemic restrictions.
5.2 Exploring Variations in Student Routines: Where and With Whom
In the previous section, we observed that despite the COVID-19 pandemic’s government restrictions, there were minimal changes in the activities performed by students in 2020 compared to those in 2018. However, as expected, the location and sociality dimensions of their behaviour exhibited larger variations. This observation raised the question of how these two dimensions changed in conjunction with the activities, specifically where and with whom these activities were performed.
To gain insights into these variations, we applied the NMF decomposition once again, but this time we concatenated the behavioural matrices. Initially, to examine changes in locations for the activities, we concatenated the activity behaviour matrix with the location behaviour matrix. Subsequently, we explored the social dimension of activities by concatenating the activity and sociality behaviour matrices. Additionally, to enable a more focused analysis, we separated the groups of students in 2018 and 2020. By doing so, the NMF algorithm can extract the most dominant behaviours specific to each group. This approach allowed us to look into routines specific to each year and subsequently compare them, to potentially reveal shifts in location and sociality of the activities.
5.2.1 Where: Activities and Locations
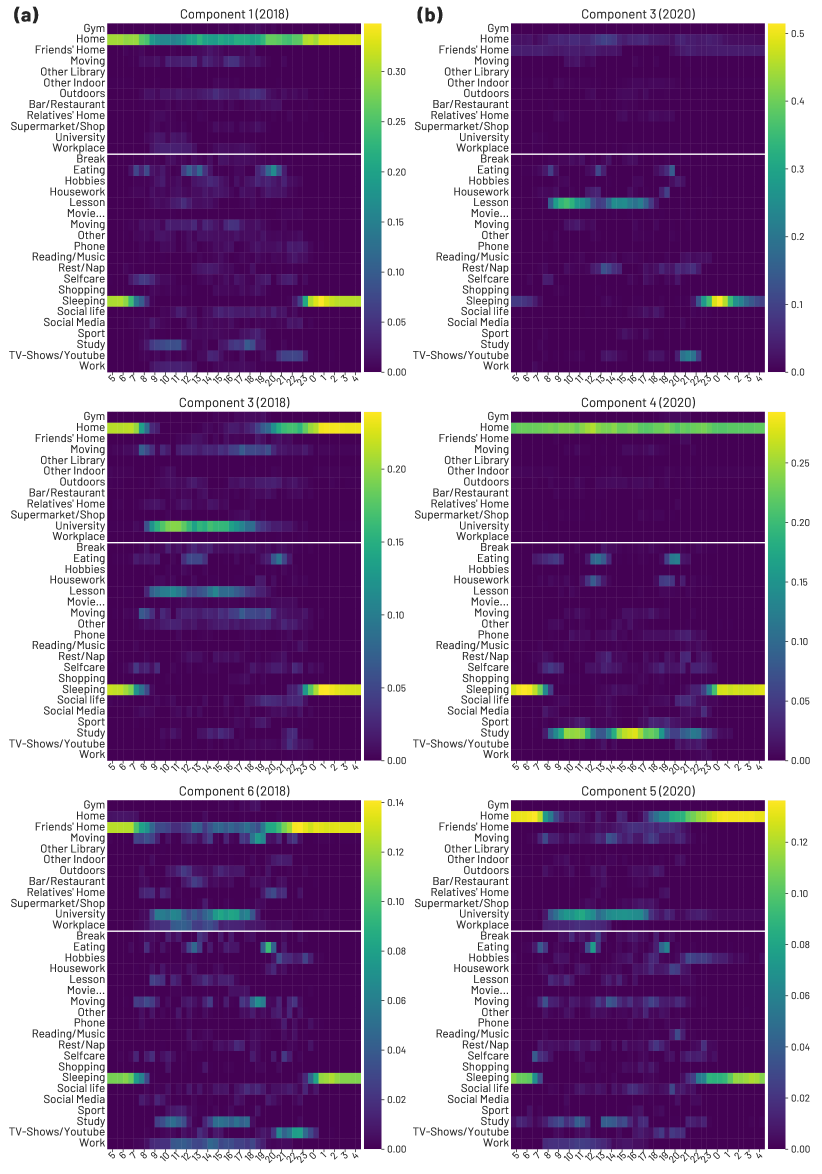
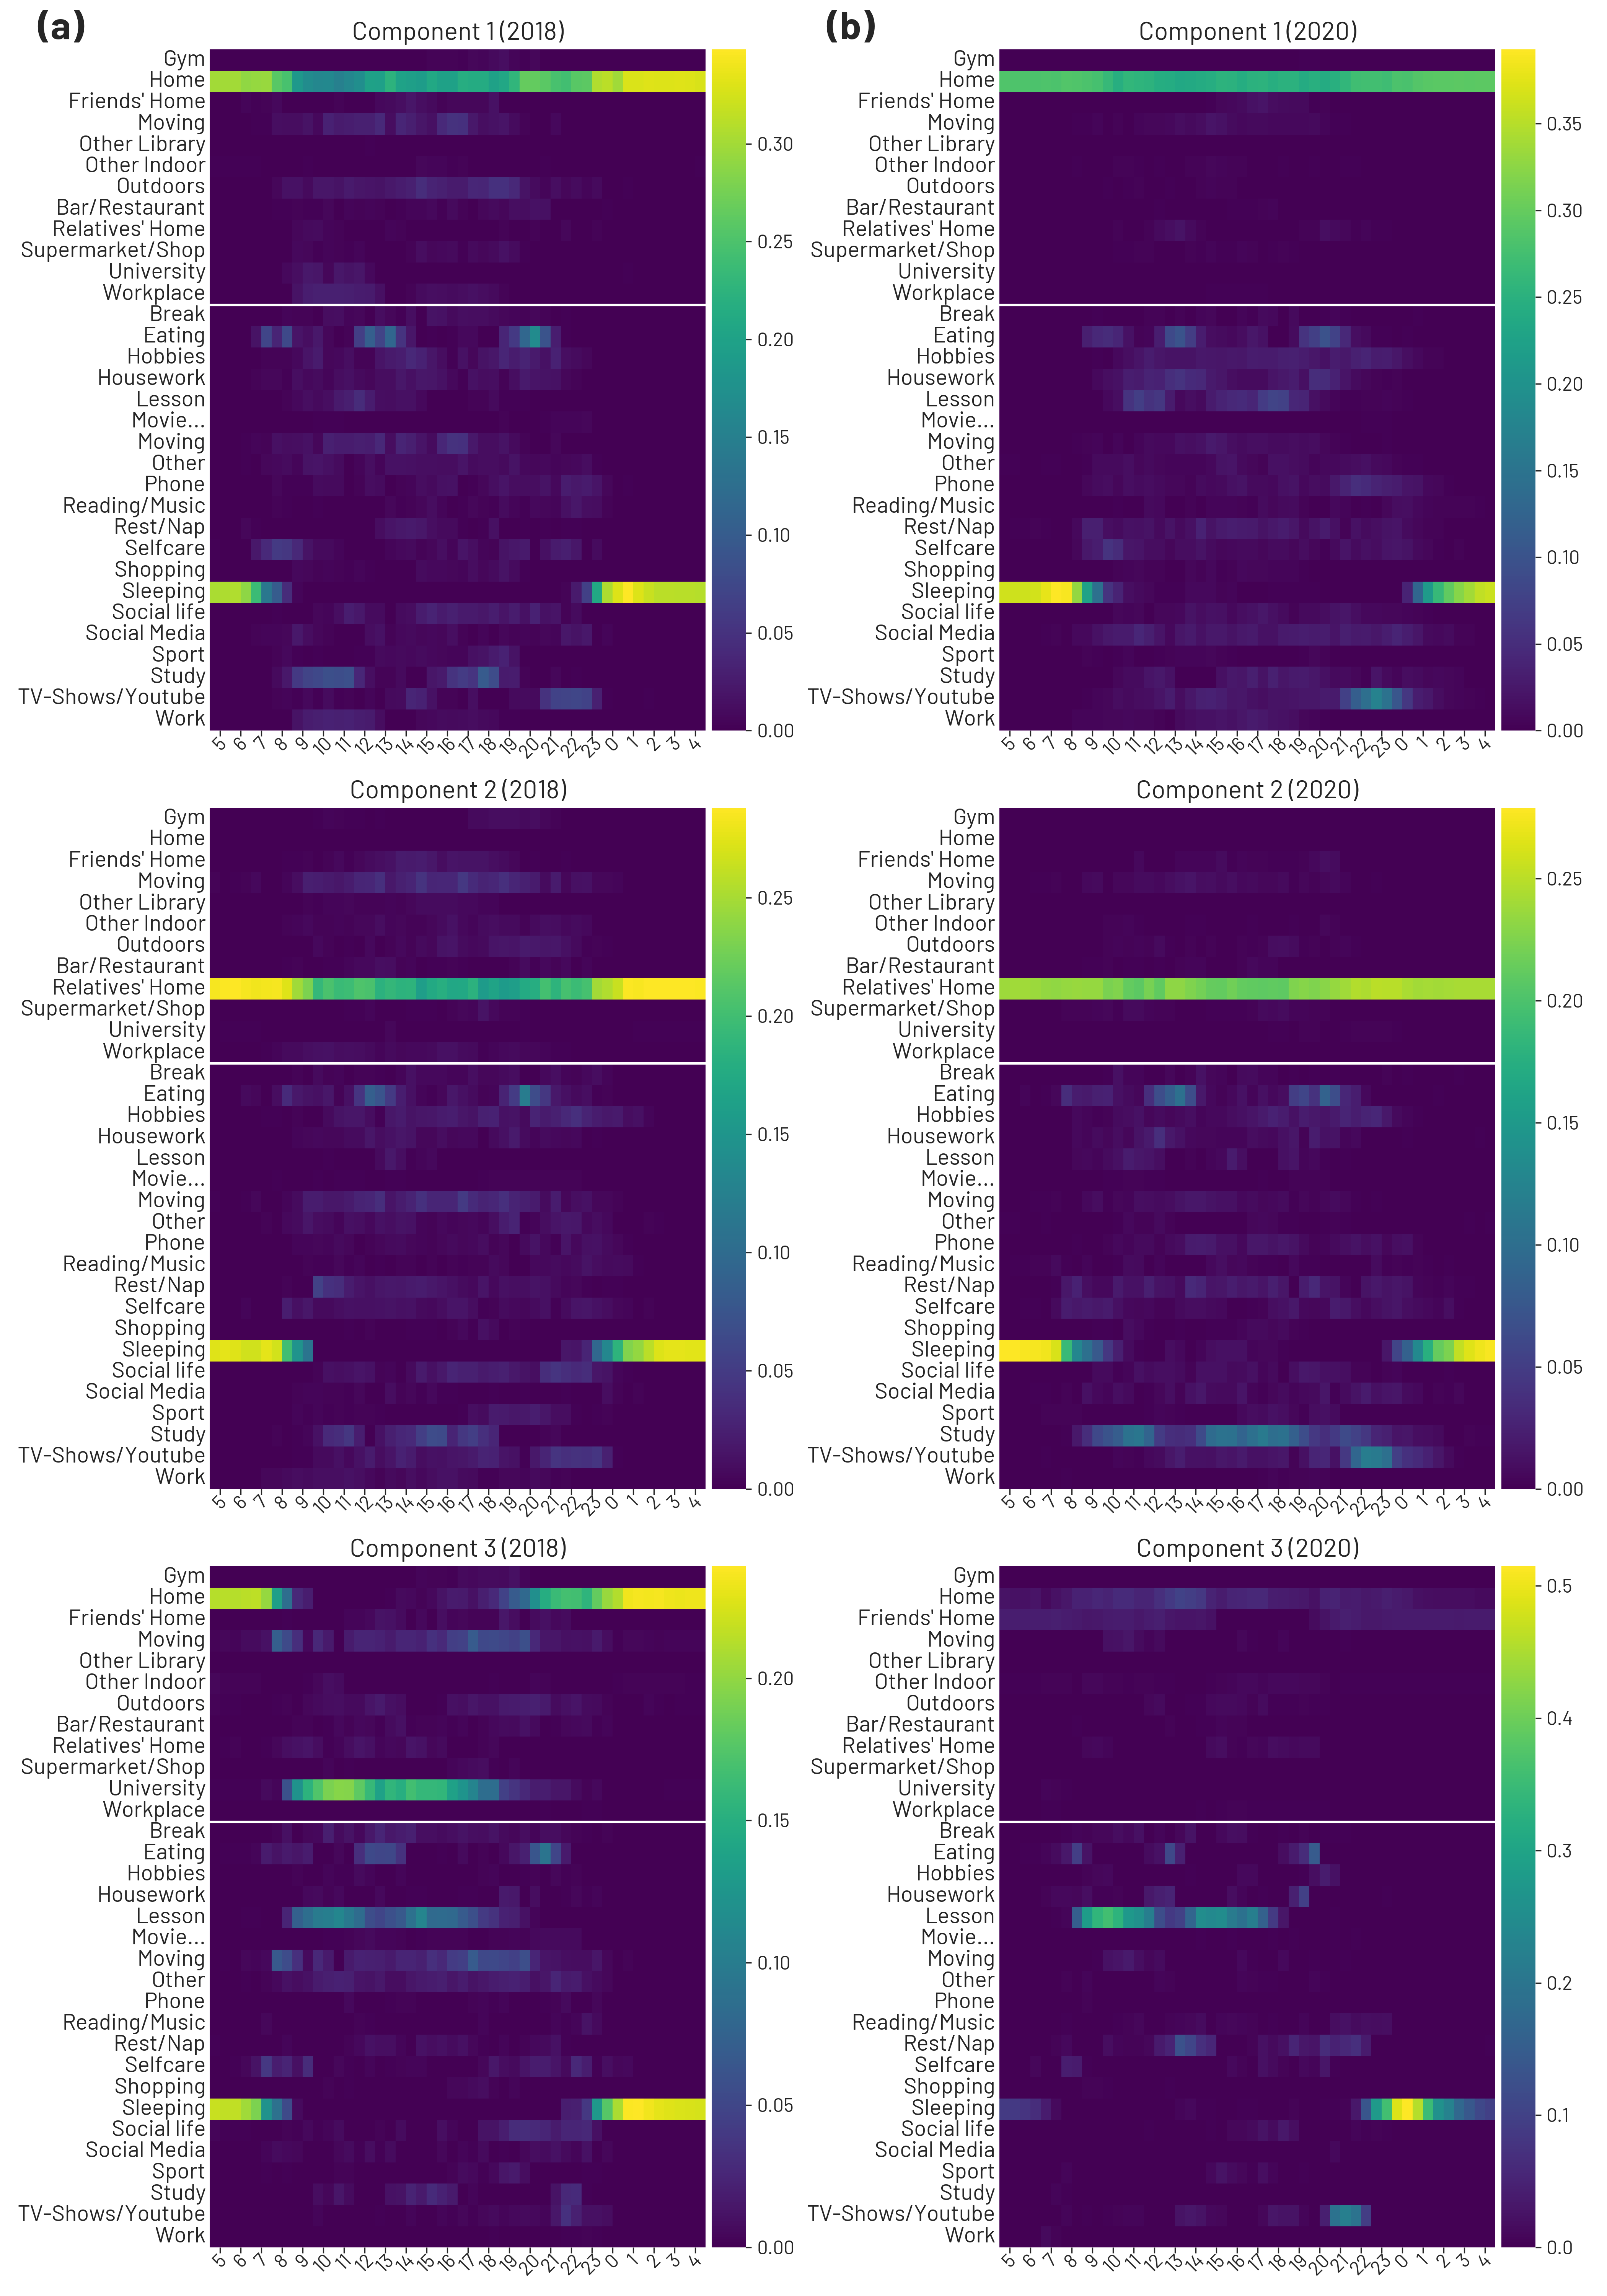
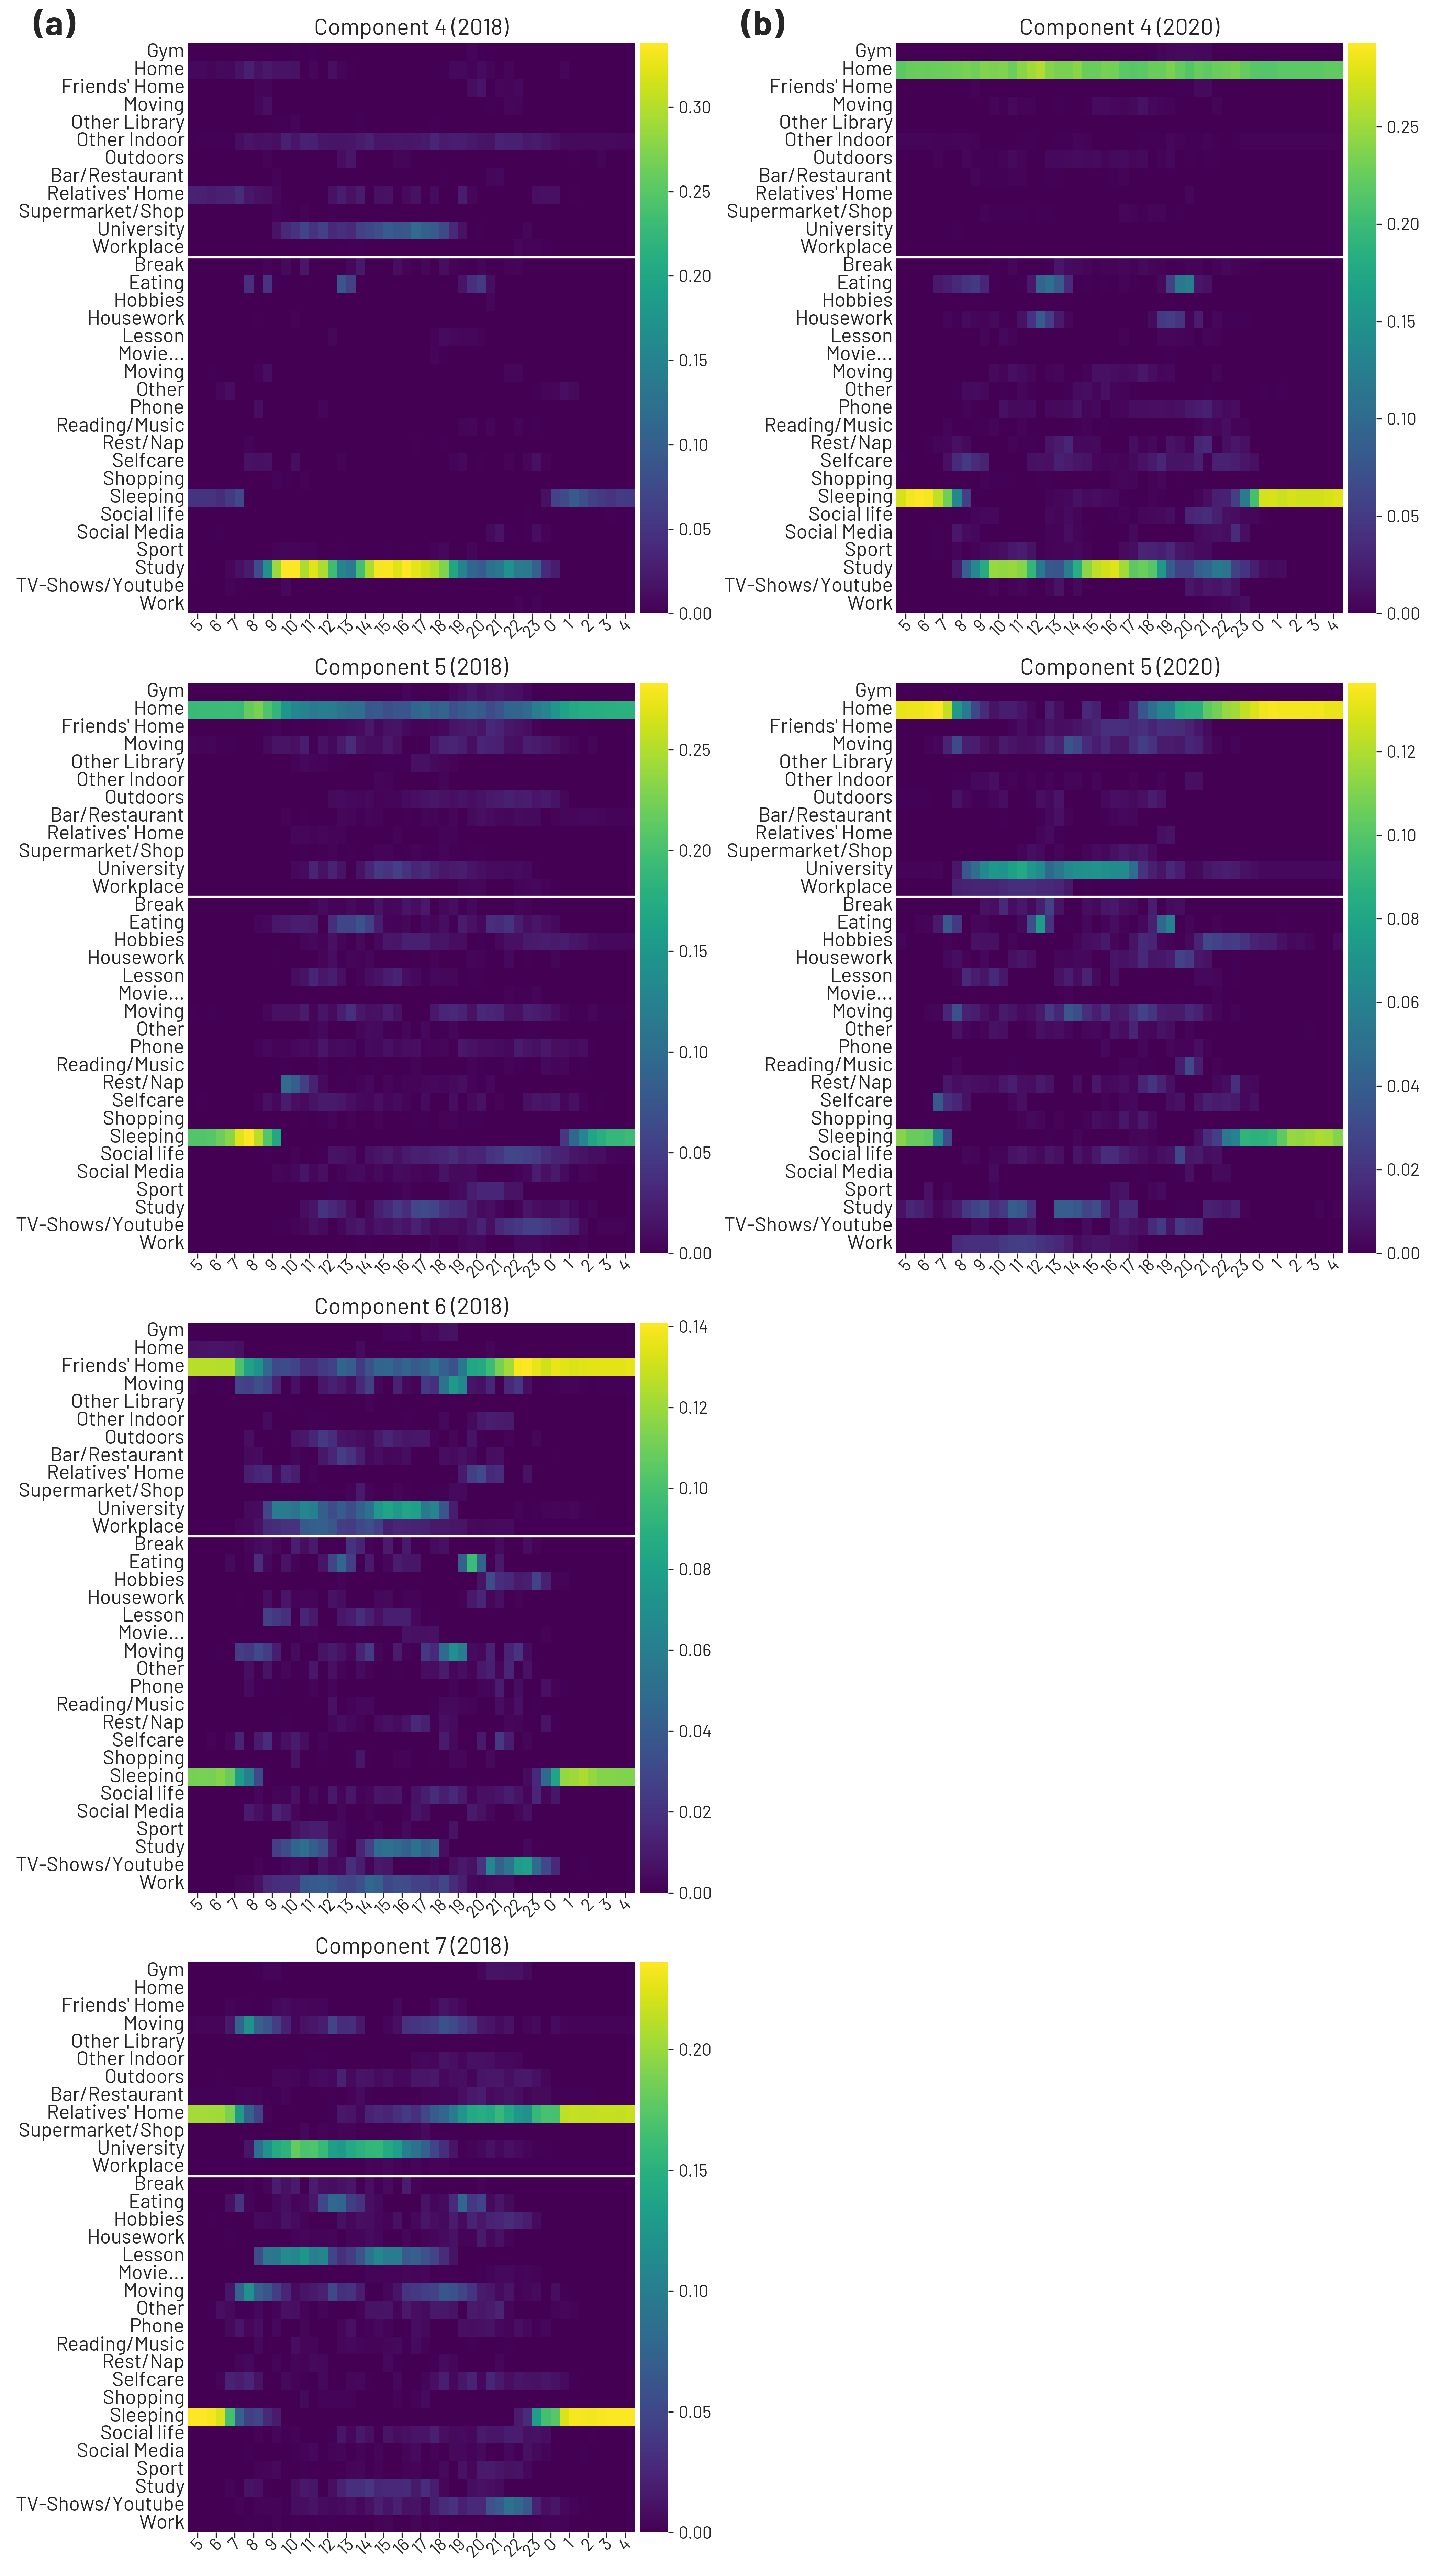
We begin our exploration of the variation in students’ routines by examining the relationship between activities and their respective locations. Firstly, we observe that the optimal number of components of the NMF algorithm, determined using the cophenetic coefficient, differs between students in 2018 and 2020, with values of 7 and 5, respectively. This difference suggests that the extracted behaviour in 2018 exhibits greater diversity compared to 2020, which aligns with our previous findings regarding the entropy of students in the location behavioural matrix, where the diversity of locations is lower in 2020 (Section 5.1). In 2020, all activity routines predominantly occur either at home or at relatives’ homes except Component 6, which includes days at the university and Component 3, which does not retain much information about the location. Conversely, in 2018, we observe that activity routines, in addition to the home or at relatives’ homes, took place at university, friends’ homes, and even workplaces (Components 3 and 6).
The differentiation in students’ behaviour can be observed in Figure 4 (the complete components can be found in Section C.1). When examining the activities, we find that the main routines extracted by NMF for both groups of students primarily revolve around activities such as lessons and studying. In 2018 (Figure 4(a)), these activities are closely associated with being at university (as seen in Components 3 and 6). When, instead, students are at home (either alone or with their relatives), studying and having lesson are not as present, and their routine is more varied. Conversely, in 2020 students carry out the majority of their activities, including lessons and studying, at home. It is interesting that in 2020, there is still a component associated with being at the university, namely Component 6. In fact, it was still possible for students to go to the library and follow lessons in-person (if they were of the first year). Moreover, we see that when students go to the university, their routine gets more complicated and they do more activities.
There were also other minor differences, such as having social life being a unique activity in 2018, while housework is more distinctive among students in 2020, further highlighting the impact of the pandemic (see Figure A3, Figure A4). These results indicate that while the main activities remained consistent between the two groups of students, the pandemic restriction forced these activities to be done in different locations.
5.2.2 With Whom: Activities and Sociality
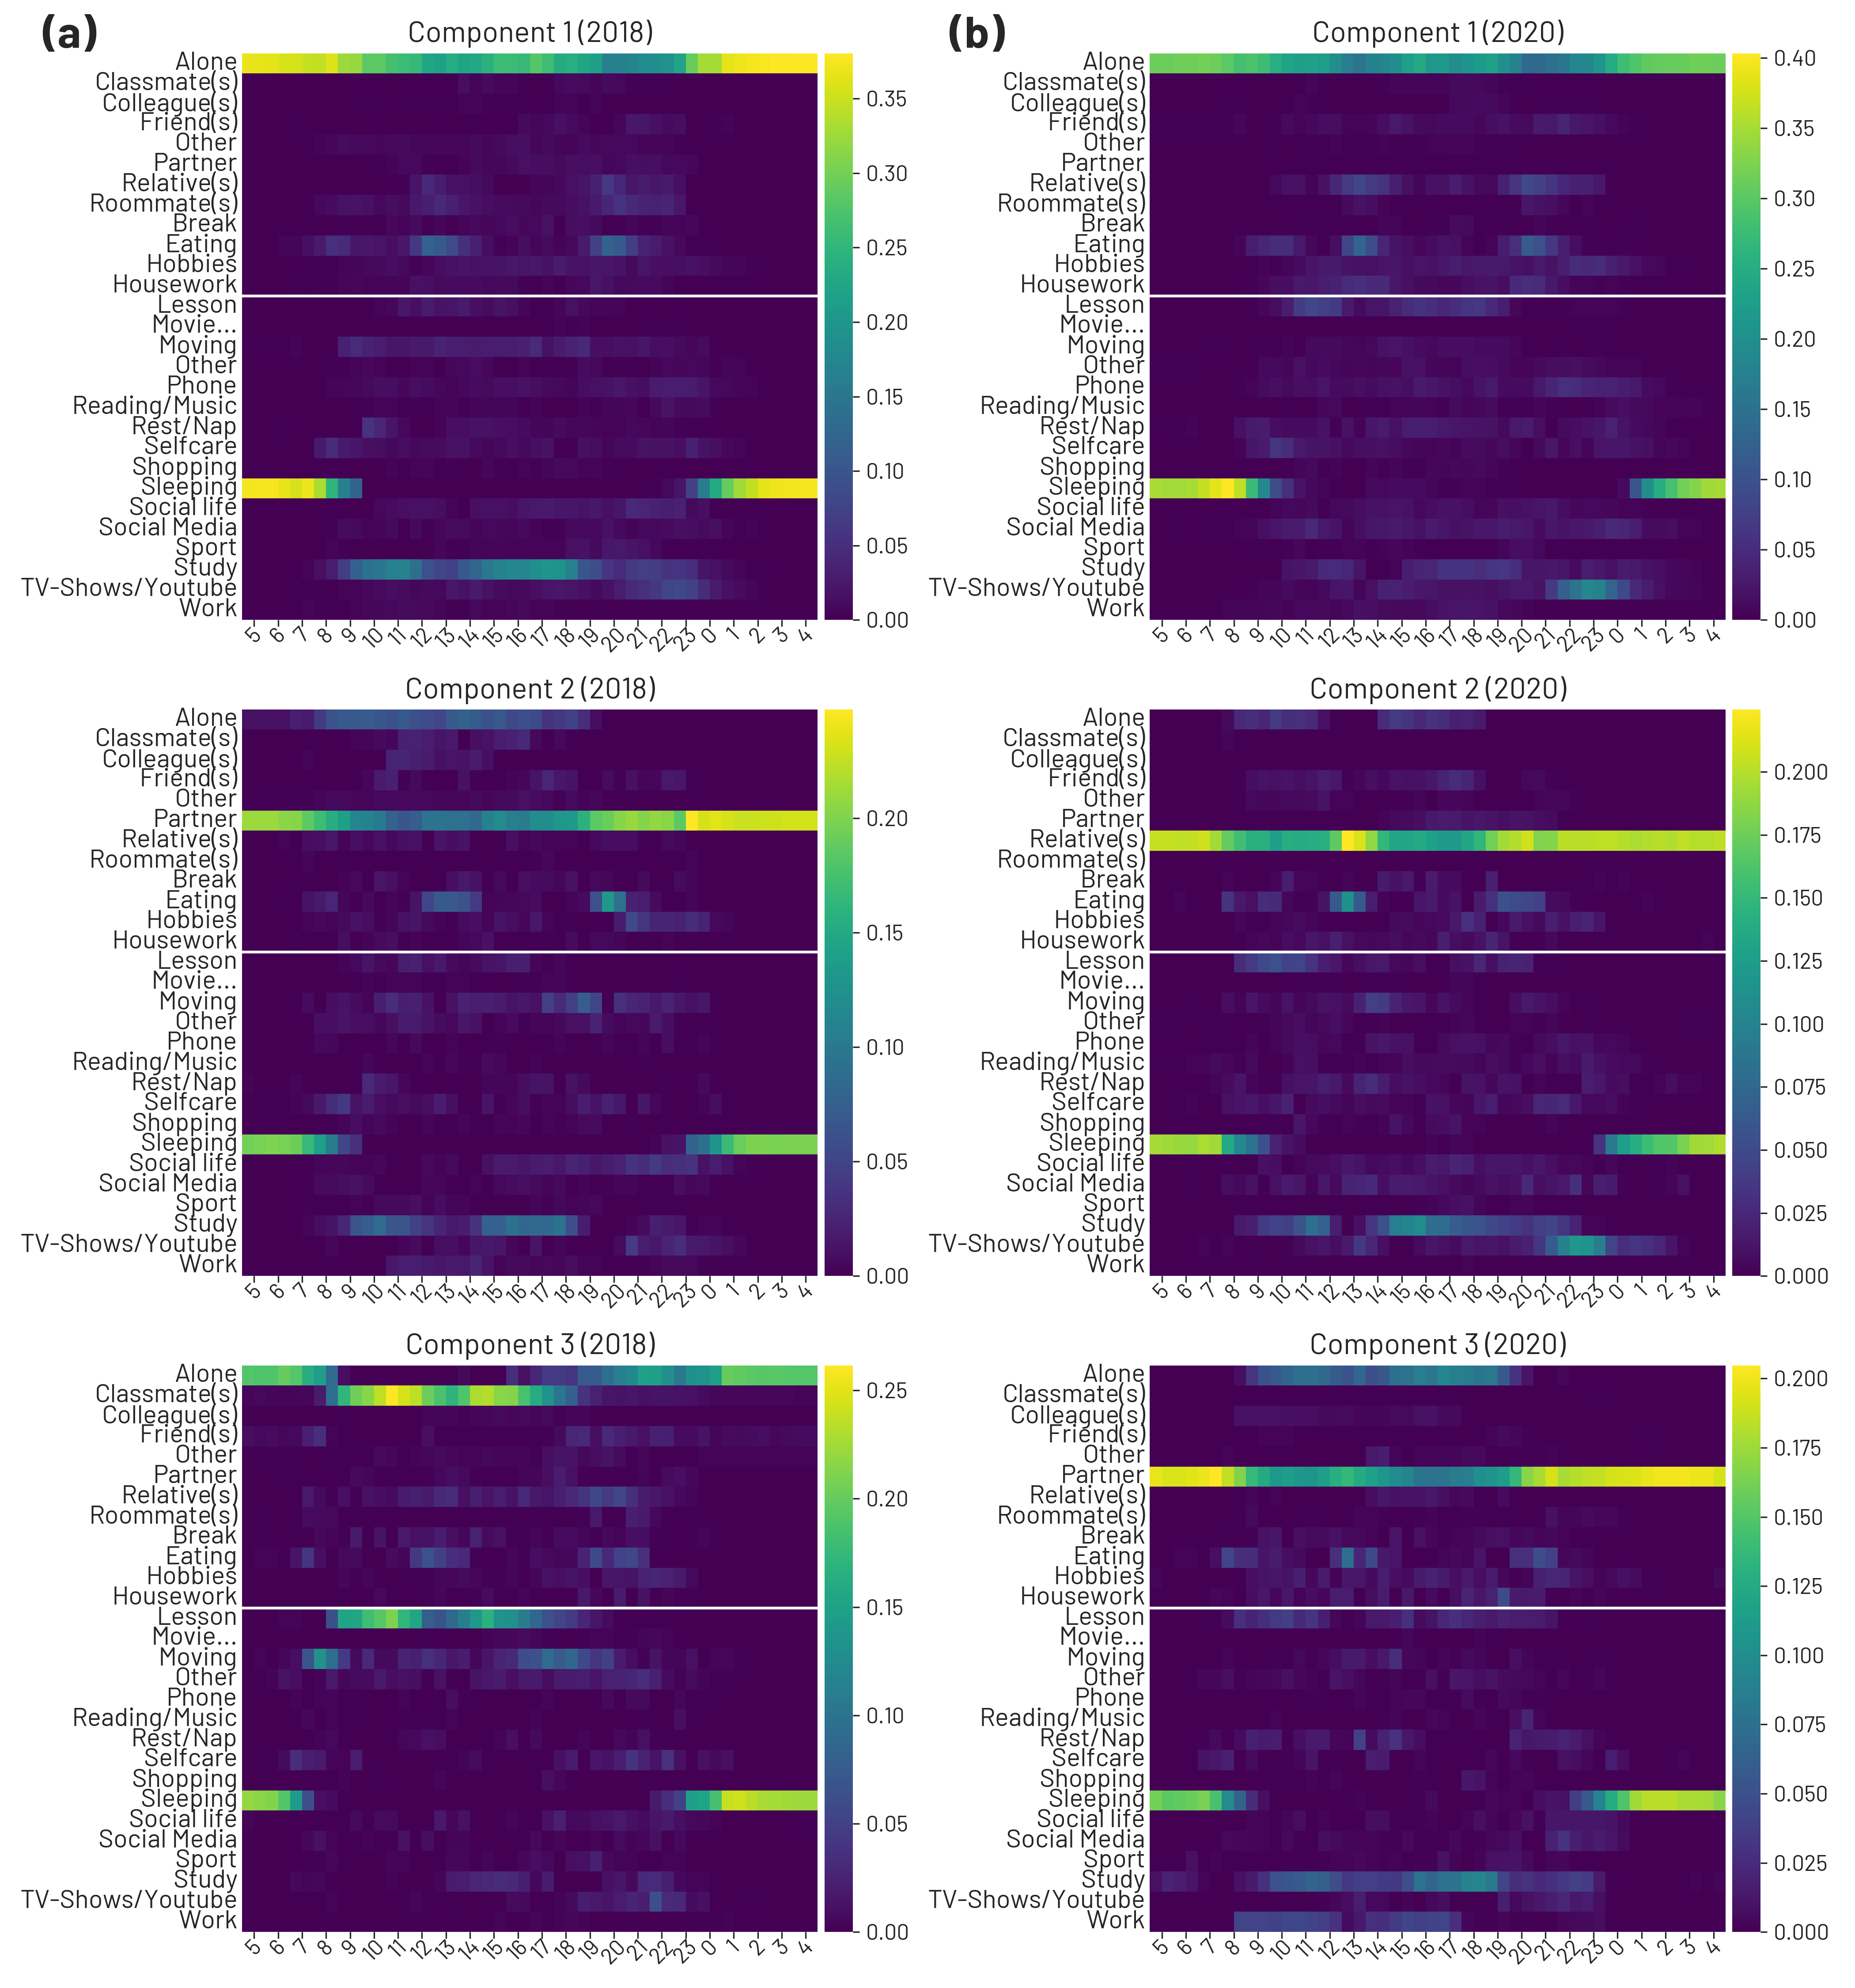
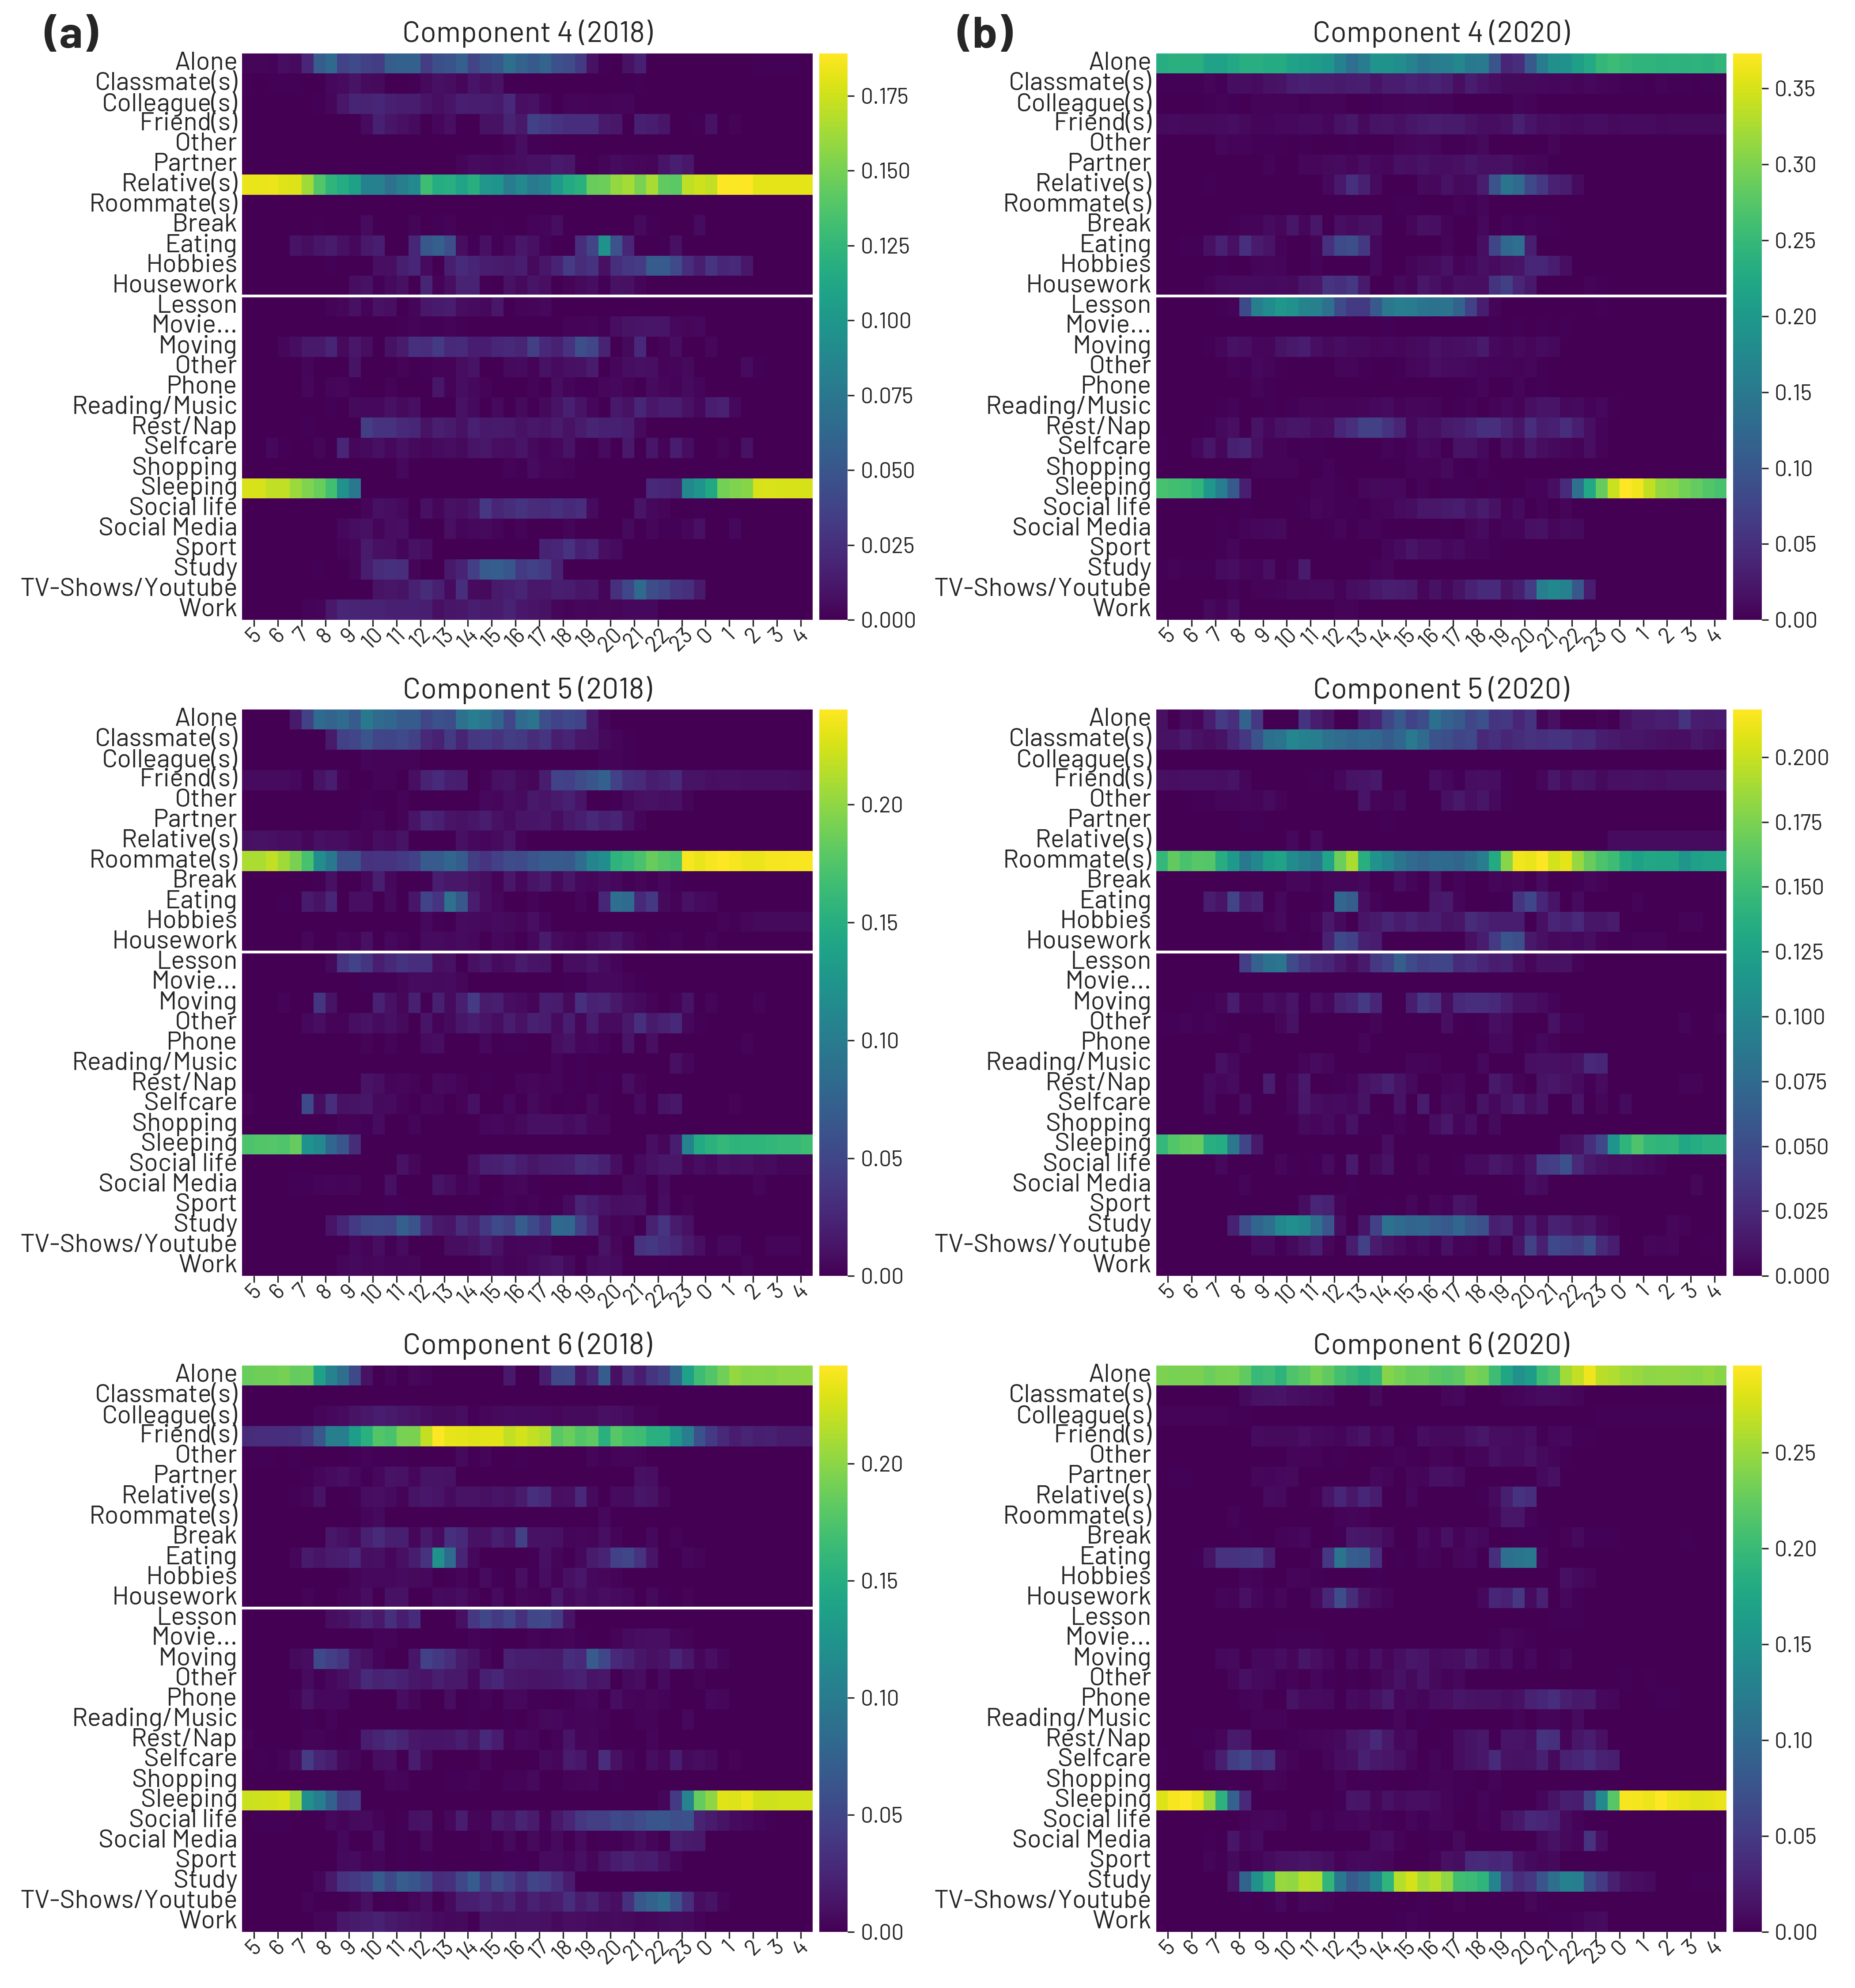
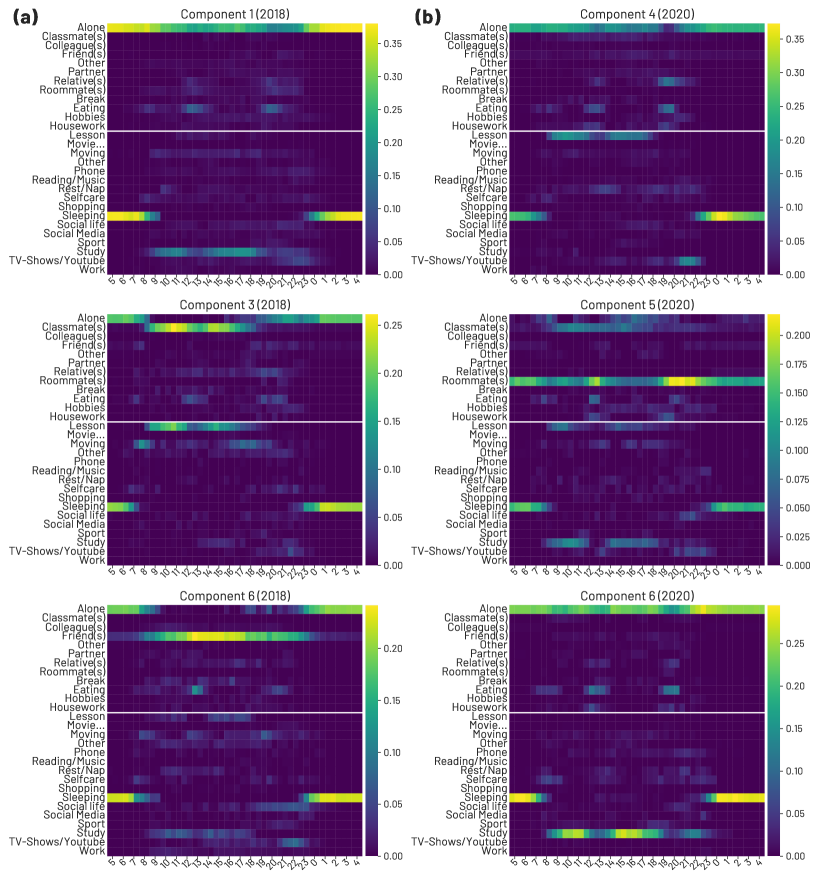
Turning our attention to the social component of activities, we observe that in 2020, the majority of the extracted components primarily involve activities performed alone, see Figure 5(b) (the complete components can be found in Section C.2). Alternatively, these components involve a small number of individuals who likely reside in the same household, such as relatives, partners, or roommates. This finding is consistent with the COVID-19 restrictions that limited the variety of social interactions during that period.
In contrast, as shown in Figure 5(a), the social component of activities in 2018 exhibits a greater variation, which involved also interactions with friends and classmates (e.g., Components 3 and 6), while studying is the only activity strongly associated with being alone (Component 1).
Although the NMF algorithm extracted six dominant components for both years, in 2018, there is a greater diversity of activities compared to students in 2020, where the weights in the heatmaps are more concentrated on specific activities. The activity patterns observed in the resulting routines are similar to those detected when considering the combined locations and activities matrices, which again involve as main activities studying and having lessons.
Notably, in 2018, there is a presence of mobility activities (e.g., Moving), which are almost absent in 2020. Additionally, in Component 5 of 2020 (Figure 5(b)), we can observe the presence of social activities in the evening, primarily involving interactions with roommates. In contrast, in 2018, without government restrictions, social activities are more consistently carried out in the company of friends.
6 Discussion and Conclusions
In this work, we have analyzed the changes in the behavioural routines of students of the University of Trento due to the COVID-19 pandemic, focusing on three dimensions of behaviour: their activity, their location and their sociality. Few studies have considered students’ behaviour, and generally, they tend to examine just one facet of behaviour Nepal et al. (2022). Moreover, existing studies are often limited to the analysis of data that comes from either survey, where data is collected manually, or mobile phones, where data is generally passively collected when triggered by specific events (e.g., phone calls, app usage, etc.). By leveraging an Experience Sampling Method (ESM) approach on smartphones, we collected self-reported information on the daily activities of university students by means of Time Diaries, which allowed for high-resolution and multimodal experience sampling data collection in a real-world setting, with a high-level of control over participants’ responses.
To investigate how students’ routines and behaviours have changed during the COVID-19 pandemic, we applied Non-Negative Matrix Factorization (NMF). Thanks to its interpretability and clustering properties, this technique is particularly useful in identifying repeating patterns in the daily behaviours of people, both at an individual and a collective level. It has been successfully used to study behavioural routines in different contexts such as urban mobility Yang et al. (2023), people’s chronotypes Aledavood et al. (2022) and interactions Gauvin et al. (2014). Our findings suggest that despite the COVID-19 restrictions, which have significantly altered various aspects of our lives Lucchini et al. (2021); Yabe et al. (2023); Adams-Prassl et al. (2020); Van Lancker and Parolin (2020); Oved et al. (2021), there is surprisingly little change in the activities performed by students between 2018 (pre-pandemic) and 2020 (during the pandemic). Additionally, as shown in our analysis, the diversity of activities did not change significantly.
However, leveraging the richness of the data at our disposal, which enables a comprehensive multimodal analysis of students’ behaviour, we discovered that their adaptation to the pandemic circumstances primarily occurred in the location and sociality dimensions. We observed differences in these dimensions for dominant activities that constitute typical student routines, such as studying and attending classes. For these routines, our results indicate that, while the main activities remained consistent between the two groups of students, the pandemic restriction forced these activities to be done in different locations, and, thus, with different people.
More in detail, in 2018, students’ activities such as studying and having lessons were often located at the university. In contrast, in 2020, due to the COVID-19 pandemic, students predominantly engaged in activities, including studying and lessons, from home, although there was the possibility for them to follow lessons at the university. Notably, when students went to university, their routines became more complex and involved a broader range of activities. From a sociality point of view, in 2020, the majority of social activities were performed alone or with a small number of individuals from the same household, reflecting the impact of COVID-19 restrictions on limiting social interactions. In contrast, the sociality components of activities in 2018 exhibited greater variation, including interactions with friends and classmates, indicating a broader range of social engagements before the pandemic.
While our results stem from data collected from two living lab initiatives, in which the sample of students is different for 2018 and 2020, we believe that the outcomes are still reliable. In fact, this limitation is mitigated by the fact that the samples are from similar populations (students), and the data is collected in similar settings: they attend the same university and faculty in the same city.
Concluding, in applying Non-Negative Matrix Factorization, we have shown its usefulness in modelling students’ behaviour and in extracting meaningful patterns, i.e., routines. We believe that our contribution can be valuable for further understanding the impact of the COVID-19 pandemic on students. Moreover, we show that using a multimodal approach can be useful in identifying patterns of joint behavioural dimensions, and, thus, be used to understand the correlations among these dimensions. Finally, this methodology can also help correlate the behavioural dimensions with other facets of human activity, enriching the literature on well-being Nepal et al. (2022), stress levels Yang et al. (2021b), and mood Meegahapola et al. (2023) of students who were significantly affected by the pandemic.
List of Abbreviations
-
•
ESM: Experience Sampling Method
-
•
NMF: Non-Negative Matrix Factorization
-
•
PCA: Principal Component Analysis
-
•
IG: Information Gain
Availability of data and materials
The datasets generated and analysed during the current study are not publicly available due to GDPR regulation and pending full approval from UniTN DPO but may be available from Fausto Giunchiglia (fausto.giunchiglia@unitn.it).
Competing interests
The authors declare that they have no competing interests.
Funding
BL and SC are partly supported by the PNRR ICSC National Research Centre for High Performance Computing, Big Data and Quantum Computing (CN00000013), under the NRRP MUR program funded by the NextGenerationEU. BL and SC received also support from the project “AIAAA - Applicazioni di Intelligenza Artificiale e Analisi Avanzata”, funded by the Autonomous Province of Trento.
The research by IB and FG has received funding from the European Union’s Horizon 2020 FET Proactive project “WeNet – The Internet of us”, grant agreement No 823783.
Author’s contributions
NAG, SC and BL designed the research. IB and FG designed the data collection experiments and provided the data after cleaning and preparation. NAG processed the data and performed the analysis. All the authors contributed to the writing of the article. All authors read and approved the final manuscript.
Acknowledgements
Not applicable
References
- Adams-Prassl et al. (2020) Adams-Prassl, A., Boneva, T., Golin, M., Rauh, C.: Inequality in the impact of the coronavirus shock: Evidence from real time surveys. Journal of Public economics 189, 104245 (2020). doi:10.1016/j.jpubeco.2020.104245
- Aharony et al. (2011) Aharony, N., Pan, W., Ip, C., Khayal, I., Pentland, A.: Social fMRI: Investigating and shaping social mechanisms in the real world. Pervasive and mobile computing 7(6), 643–659 (2011). doi:10.1016/j.pmcj.2011.09.004
- Aledavood et al. (2022) Aledavood, T., Kivimäki, I., Lehmann, S., Saramäki, J.: Quantifying daily rhythms with non-negative matrix factorization applied to mobile phone data. Scientific reports 12(1), 5544 (2022). doi:10.1038/s41598-022-09273-y
- Aleta et al. (2020) Aleta, A., Martin-Corral, D., Pastore y Piontti, A., Ajelli, M., Litvinova, M., Chinazzi, M., Dean, N.E., Halloran, M.E., Longini Jr, I.M., Merler, S., et al.: Modelling the impact of testing, contact tracing and household quarantine on second waves of COVID-19. Nature Human Behaviour 4(9), 964–971 (2020). doi:10.1038/s41562-020-0931-9
- Assi et al. (2023) Assi, K., Meegahapola, L., Droz, W., Kun, P., De Götzen, A., Bidoglia, M., Stares, S., Gaskell, G., Chagnaa, A., Ganbold, A., et al.: Complex Daily Activities, Country-Level Diversity, and Smartphone Sensing: A Study in Denmark, Italy, Mongolia, Paraguay, and UK. In: Proceedings of the 2023 CHI Conference on Human Factors in Computing Systems, pp. 1–23 (2023). doi:10.1145/3544548.3581190
- Baek et al. (2021) Baek, C., McCrory, P.B., Messer, T., Mui, P.: Unemployment effects of stay-at-home orders: Evidence from high-frequency claims data. The Review of Economics and Statistics 103(5), 979–993 (2021). doi:10.1162/rest_a_00996
- Betthäuser et al. (2023) Betthäuser, B.A., Bach-Mortensen, A.M., Engzell, P.: A systematic review and meta-analysis of the evidence on learning during the COVID-19 pandemic. Nature Human Behaviour 7(3), 375–385 (2023). doi:10.1038/s41562-022-01506-4
- Blei et al. (2003) Blei, D.M., Ng, A.Y., Jordan, M.I.: Latent dirichlet allocation. Journal of machine Learning research 3(Jan), 993–1022 (2003). doi:10.5555/944919.944937
- Bonaccorsi et al. (2020) Bonaccorsi, G., Pierri, F., Cinelli, M., Flori, A., Galeazzi, A., Porcelli, F., Schmidt, A.L., Valensise, C.M., Scala, A., Quattrociocchi, W., et al.: Economic and social consequences of human mobility restrictions under COVID-19. Proceedings of the National Academy of Sciences 117(27), 15530–15535 (2020). doi:10.1073/pnas.2007658117
- Bonaccorsi et al. (2021) Bonaccorsi, G., Pierri, F., Scotti, F., Flori, A., Manaresi, F., Ceri, S., Pammolli, F.: Socioeconomic differences and persistent segregation of Italian territories during COVID-19 pandemic. Scientific reports 11(1), 21174 (2021). doi:10.1038/s41598-021-99548-7
- Brauner et al. (2021) Brauner, J.M., Mindermann, S., Sharma, M., Johnston, D., Salvatier, J., Gavenčiak, T., Stephenson, A.B., Leech, G., Altman, G., Mikulik, V., et al.: Inferring the effectiveness of government interventions against COVID-19. Science 371(6531), 9338 (2021). doi:10.1126/science.abd9338
- Brdiczka et al. (2010) Brdiczka, O., Su, N.M., Begole, J.B.: Temporal Task Footprinting: Identifying Routine Tasks by Their Temporal Patterns. In: Proceedings of the 15th International Conference on Intelligent User Interfaces. IUI ’10, pp. 281–284 (2010). doi:10.1145/1719970.1720011. Association for Computing Machinery
- Brodeur et al. (2021) Brodeur, A., Clark, A.E., Fleche, S., Powdthavee, N.: Covid-19, lockdowns and well-being: Evidence from google trends. Journal of public economics 193, 104346 (2021). doi:10.1016/j.jpubeco.2020.104346
- Brown and Shortell (2014) Brown, E., Shortell, T.: Walking in the European City: Quotidian Mobility and Urban Ethnography. Ashgate Publishing, Ltd, Farnham (2014). doi:10.4324/9781315547770
- Brunet et al. (2004) Brunet, J.-P., Tamayo, P., Golub, T.R., Mesirov, J.P.: Metagenes and molecular pattern discovery using matrix factorization. Proceedings of the national academy of sciences 101(12), 4164–4169 (2004). doi:10.1073/pnas.0308531101
- Centellegher et al. (2016) Centellegher, S., De Nadai, M., Caraviello, M., Leonardi, C., Vescovi, M., Ramadian, Y., Oliver, N., Pianesi, F., Pentland, A., Antonelli, F., et al.: The Mobile Territorial Lab: a multilayered and dynamic view on parents’ daily lives. EPJ Data Science 5, 1–19 (2016). doi:10.1140/epjds/s13688-016-0064-6
- Chinazzi et al. (2020) Chinazzi, M., Davis, J.T., Ajelli, M., Gioannini, C., Litvinova, M., Merler, S., Pastore y Piontti, A., Mu, K., Rossi, L., Sun, K., et al.: The effect of travel restrictions on the spread of the 2019 novel coronavirus (COVID-19) outbreak. Science 368(6489), 395–400 (2020). doi:10.1126/science.aba9757
- Cichocki and Phan (2009) Cichocki, A., Phan, A.-H.: Fast Local Algorithms for Large Scale Nonnegative Matrix and Tensor Factorizations. IEICE transactions on fundamentals of electronics, communications and computer sciences 92(3), 708–721 (2009). doi:10.1587/transfun.E92.A.708
- Csikszentmihalyi et al. (2014) Csikszentmihalyi, M., Larson, R., Csikszentmihalyi, M.: The experience sampling method. Flow and the foundations of positive psychology: The collected works of Mihaly Csikszentmihalyi, 21–34 (2014). doi:10.1007/978-94-017-9088-8_2
- Delussu et al. (2022) Delussu, F., Tizzoni, M., Gauvin, L.: Evidence of pandemic fatigue associated with stricter tiered COVID-19 restrictions. PLOS Digital Health 1(5), 0000035 (2022). doi:10.1371/journal.pdig.0000035
- Di Clemente et al. (2018) Di Clemente, R., Luengo-Oroz, M., Travizano, M., Xu, S., Vaitla, B., González, M.C.: Sequences of purchases in credit card data reveal lifestyles in urban populations. Nature communications 9(1), 1–8 (2018). doi:10.1038/s41467-018-05690-8
- Eagle and Pentland (2006) Eagle, N., Pentland, A.S.: Reality mining: sensing complex social systems. Personal and ubiquitous computing 10(4), 255–268 (2006). doi:10.1007/s00779-005-0046-3
- Eagle and Pentland (2009) Eagle, N., Pentland, A.S.: Eigenbehaviors: Identifying structure in routine. Behavioral ecology and sociobiology 63, 1057–1066 (2009). doi:10.1007/s00265-009-0739-0
- Farrahi and Gatica-Perez (2010) Farrahi, K., Gatica-Perez, D.: Probabilistic Mining of Socio-Geographic Routines From Mobile Phone Data. IEEE Journal of Selected Topics in Signal Processing 4(4), 746–755 (2010). doi:10.1109/JSTSP.2010.2049513
- Fatima et al. (2013) Fatima, I., Fahim, M., Lee, Y.-K., Lee, S.: A unified framework for activity recognition-based behavior analysis and action prediction in smart homes. Sensors 13(2), 2682–2699 (2013). doi:10.3390/s130202682
- Galeazzi et al. (2021) Galeazzi, A., Cinelli, M., Bonaccorsi, G., Pierri, F., Schmidt, A.L., Scala, A., Pammolli, F., Quattrociocchi, W.: Human mobility in response to COVID-19 in France, Italy and UK. Scientific reports 11(1), 13141 (2021). doi:10.1038/s41598-021-92399-2
- Gauvin et al. (2014) Gauvin, L., Panisson, A., Cattuto, C.: Detecting the community structure and activity patterns of temporal networks: a non-negative tensor factorization approach. PloS one 9(1), 86028 (2014). doi:10.1371/journal.pone.0086028
- Giunchiglia et al. (2017a) Giunchiglia, F., Bignotti, E., Zeni, M.: Personal context modelling and annotation. In: 2017 IEEE International Conference on Pervasive Computing and Communications Workshops (PerCom Workshops), pp. 117–122 (2017a). doi:10.1109/PERCOMW.2017.7917543
- Giunchiglia et al. (2017b) Giunchiglia, F., Zeni, M., Gobbi, E., Bignotti, E., Bison, I.: Mobile social media and academic performance. In: Social Informatics: 9th International Conference, SocInfo 2017, Oxford, UK, September 13-15, 2017, Proceedings, Part II 9, pp. 3–13 (2017b). doi:10.1007/978-3-319-67256-4_1. Springer
- Giunchiglia et al. (2018) Giunchiglia, F., Zeni, M., Gobbi, E., Bignotti, E., Bison, I.: Mobile social media usage and academic performance. Computers in Human Behavior 82, 177–185 (2018). doi:10.1016/j.chb.2017.12.041
- Giunchiglia et al. (2021) Giunchiglia, F., Bison, I., Busso, M., et al.: A worldwide diversity pilot on daily routines and social practices (2020-2021). University of Trento Technical Report (#DISI-2001-DS-01) (2021). doi:10.13140/RG.2.2.35261.54244
- Goffman (1959) Goffman, E.: The Presentation of Self in Everyday Life. Doubleday, New York (1959)
- Gonzalez et al. (2020) Gonzalez, T., De La Rubia, M.A., Hincz, K.P., Comas-Lopez, M., Subirats, L., Fort, S., Sacha, G.M.: Influence of COVID-19 confinement on students’ performance in higher education. PloS one 15(10), 0239490 (2020). doi:10.1371/journal.pone.0239490
- Guo et al. (2021) Guo, Y.-f., Liao, M.-q., Cai, W.-l., Yu, X.-x., Li, S.-n., Ke, X.-y., Tan, S.-x., Luo, Z.-y., Cui, Y.-f., Wang, Q., et al.: Physical activity, screen exposure and sleep among students during the pandemic of COVID-19. Scientific reports 11(1), 8529 (2021). doi:10.1038/s41598-021-88071-4
- Hou et al. (2021) Hou, X., Gao, S., Li, Q., Kang, Y., Chen, N., Chen, K., Rao, J., Ellenberg, J.S., Patz, J.A.: Intracounty modeling of COVID-19 infection with human mobility: Assessing spatial heterogeneity with business traffic, age, and race. Proceedings of the National Academy of Sciences 118(24), 2020524118 (2021). doi:10.1073/pnas.2020524118
- Huynh et al. (2008) Huynh, T., Fritz, M., Schiele, B.: Discovery of activity patterns using topic models. In: Proceedings of the 10th International Conference on Ubiquitous Computing, pp. 10–19 (2008). doi:10.1145/1409635.1409638
- Lane et al. (2010) Lane, N.D., Miluzzo, E., Lu, H., Peebles, D., Choudhury, T., Campbell, A.T.: A survey of mobile phone sensing. IEEE Communications magazine 48(9), 140–150 (2010). doi:10.1109/MCOM.2010.5560598
- Lazer et al. (2020) Lazer, D.M.J., Pentland, A., Watts, D.J., Aral, S., Athey, S., Contractor, N., Freelon, D., Gonzalez-Bailon, S., King, G., Margetts, H., Nelson, A., Salganik, M.J., Strohmaier, M., Vespignani, A., Wagner, C.: Computational social science: Obstacles and opportunities. Science 369(6507), 1060–1062 (2020). doi:10.1126/science.aaz8170
- Lazer et al. (2009) Lazer, D., Pentland, A., Adamic, L., Aral, S., Barabási, A.-L., Brewer, D., Christakis, N., Contractor, N., Fowler, J., Gutmann, M., et al.: Computational social science. Science 323(5915), 721–723 (2009). doi:10.1126/science.1167742
- Lee and Seung (1999) Lee, D.D., Seung, H.S.: Learning the parts of objects by non-negative matrix factorization. Nature 401(6755), 788–791 (1999). doi:10.1038/44565
- Lucchini et al. (2021) Lucchini, L., Centellegher, S., Pappalardo, L., Gallotti, R., Privitera, F., Lepri, B., De Nadai, M.: Living in a pandemic: changes in mobility routines, social activity and adherence to COVID-19 protective measures. Scientific reports 11(1), 24452 (2021). doi:10.1038/s41598-021-04139-1
- Madan et al. (2011) Madan, A., Cebrian, M., Moturu, S., Farrahi, K., et al.: Sensing the” health state” of a community. IEEE Pervasive Computing 11(4), 36–45 (2011). doi:10.1109/MPRV.2011.79
- Meegahapola et al. (2023) Meegahapola, L., Droz, W., Kun, P., de Götzen, A., Nutakki, C., Diwakar, S., Correa, S.R., Song, D., Xu, H., Bidoglia, M., et al.: Generalization and Personalization of Mobile Sensing-Based Mood Inference Models: An Analysis of College Students in Eight Countries. Proceedings of the ACM on Interactive, Mobile, Wearable and Ubiquitous Technologies 6(4), 1–32 (2023). doi:10.1145/3569483
- Nepal et al. (2022) Nepal, S., Wang, W., Vojdanovski, V., Huckins, J.F., daSilva, A., Meyer, M., Campbell, A.: COVID student study: A year in the life of college students during the COVID-19 pandemic through the lens of mobile phone sensing. In: Proceedings of the 2022 CHI Conference on Human Factors in Computing Systems, pp. 1–19 (2022). doi:10.1145/3491102.3502043
- Ochnik et al. (2021) Ochnik, D., Rogowska, A.M., Kuśnierz, C., Jakubiak, M., Schütz, A., Held, M.J., Arzenšek, A., Benatov, J., Berger, R., Korchagina, E.V., et al.: Mental health prevalence and predictors among university students in nine countries during the COVID-19 pandemic: A cross-national study. Scientific reports 11(1), 18644 (2021). doi:10.1038/s41598-021-97697-3
- Oved et al. (2021) Oved, S., Mofaz, M., Lan, A., Einat, H., Kronfeld-Schor, N., Yamin, D., Shmueli, E.: Differential effects of COVID-19 lockdowns on well-being: interaction between age, gender and chronotype. Journal of the Royal Society Interface 18(179), 20210078 (2021). doi:10.1098/rsif.2021.0078
- Pauca et al. (2004) Pauca, V.P., Shahnaz, F., Berry, M.W., Plemmons, R.J.: Text mining using non-negative matrix factorizations. In: Proceedings of the 2004 SIAM International Conference on Data Mining, pp. 452–456 (2004). doi:10.1137/1.9781611972740.45. SIAM
- Pejovic et al. (2016) Pejovic, V., Lathia, N., Mascolo, C., Musolesi, M.: Mobile-Based Experience Sampling for Behaviour Research. In: Emotions and Personality in Personalized Services: Models, Evaluation and Applications, pp. 141–161 (2016). doi:10.1007/978-3-319-31413-6_8. Springer International Publishing
- Perra (2021) Perra, N.: Non-pharmaceutical interventions during the COVID-19 pandemic: A review. Physics Reports 913, 1–52 (2021). doi:10.1016/j.physrep.2021.02.001
- Persson et al. (2021) Persson, J., Parie, J.F., Feuerriegel, S.: Monitoring the COVID-19 epidemic with nationwide telecommunication data. Proceedings of the National Academy of Sciences 118(26), 2100664118 (2021). doi:10.1073/pnas.2100664118
- Pierson et al. (2018) Pierson, E., Althoff, T., Leskovec, J.: Modeling individual cyclic variation in human behavior. In: Proceedings of the 2018 World Wide Web Conference, pp. 107–116 (2018). doi:10.1145/3178876.3186052
- Raento et al. (2009) Raento, M., Oulasvirta, A., Eagle, N.: Smartphones: An emerging tool for social scientists. Sociological methods & research 37(3), 426–454 (2009). doi:10.1177/0049124108330005
- Sra and Dhillon (2005) Sra, S., Dhillon, I.: Generalized Nonnegative Matrix Approximations with Bregman Divergences. In: Weiss, Y., Schölkopf, B., Platt, J. (eds.) Advances in Neural Information Processing Systems, vol. 18 (2005). MIT Press
- Stopczynski et al. (2014) Stopczynski, A., Sekara, V., Sapiezynski, P., Cuttone, A., Madsen, M.M., Larsen, J.E., Lehmann, S.: Measuring large-scale social networks with high resolution. PloS one 9(4), 95978 (2014). doi:10.1371/journal.pone.0095978
- Vagni and Cornwell (2018) Vagni, G., Cornwell, B.: Patterns of everyday activities across social contexts. Proceedings of the National Academy of Sciences 115(24), 6183–6188 (2018). doi:10.1073/pnas.1718020115
- Van Berkel et al. (2017) Van Berkel, N., Ferreira, D., Kostakos, V.: The experience sampling method on mobile devices. ACM Computing Surveys (CSUR) 50(6), 1–40 (2017). doi:10.1145/3123988
- Van Lancker and Parolin (2020) Van Lancker, W., Parolin, Z.: COVID-19, school closures, and child poverty: a social crisis in the making. The Lancet Public Health 5(5), 243–244 (2020). doi:10.1016/S2468-2667(20)30084-0
- Xu et al. (2019) Xu, X., Chikersal, P., Doryab, A., Villalba, D.K., Dutcher, J.M., Tumminia, M.J., Althoff, T., Cohen, S., Creswell, K.G., Creswell, J.D., et al.: Leveraging routine behavior and contextually-filtered features for depression detection among college students. Proceedings of the ACM on Interactive, Mobile, Wearable and Ubiquitous Technologies 3(3), 1–33 (2019). doi:10.1145/3351274
- Xu et al. (2017) Xu, Y., Bull, D., Damen, D.: Unsupervised Long-Term Routine Modelling Using Dynamic Bayesian Networks. In: 2017 International Conference on Digital Image Computing: Techniques and Applications (DICTA), pp. 1–8 (2017). doi:10.1109/DICTA.2017.8227502
- Yabe et al. (2023) Yabe, T., Bueno, B.G.B., Dong, X., Pentland, A., Moro, E.: Behavioral changes during the COVID-19 pandemic decreased income diversity of urban encounters. Nature Communications 14(1), 2310 (2023). doi:10.1038/s41467-023-37913-y
- Yang et al. (2021a) Yang, C., Chen, A., Chen, Y.: College students’ stress and health in the COVID-19 pandemic: The role of academic workload, separation from school, and fears of contagion. PloS one 16(2), 0246676 (2021a). doi:10.1371/journal.pone.0246676
- Yang et al. (2021b) Yang, C., Chen, A., Chen, Y.: College students’ stress and health in the COVID-19 pandemic: The role of academic workload, separation from school, and fears of contagion. PloS one 16(2), 0246676 (2021b). doi:10.1371/journal.pone.0246676
- Yang et al. (2023) Yang, Y., Pentland, A., Moro, E.: Identifying latent activity behaviors and lifestyles using mobility data to describe urban dynamics. EPJ Data Science 12(1), 1–15 (2023). doi:10.1140/epjds/s13688-023-00390-w
- Yao et al. (2009) Yao, L., Mimno, D., McCallum, A.: Efficient methods for topic model inference on streaming document collections. In: Proceedings of the 15th ACM SIGKDD International Conference on Knowledge Discovery and Data Mining, pp. 937–946 (2009). doi:10.1145/1557019.1557121
- Zeni et al. (2014) Zeni, M., Zaihrayeu, I., Giunchiglia, F.: Multi-device activity logging. In: Proceedings of the 2014 ACM International Joint Conference on Pervasive and Ubiquitous Computing: Adjunct Publication, pp. 299–302 (2014). doi:10.1145/2638728.2638756
- Zhang et al. (2021) Zhang, W., Shen, Q., Teso, S., Lepri, B., Passerini, A., Bison, I., Giunchiglia, F.: Putting human behavior predictability in context. EPJ Data Science 10(1), 42 (2021). doi:10.1140/epjds/s13688-021-00299-2
- (67) Covid Restrictions for the Trento Province in the Sampling Period (in Italian) (2020). Last Accessed May 2nd, 2023. https://www.ufficiostampa.provincia.tn.it/content/download/174818/3026422/file/ORDINANZA_N_54_prot_726529_del_14_novembre_2020.pdf
Appendix A Data Mapping
Because of the refinement in the WeNet study, a mapping is needed to make the two datasets comparable. Table A1 shows the mapping for the activities, while Table A2 contains the locations mapping. For activities, the SmartUniTn (a bit different from the cited paper, as there were refinements from 2017 to 2018) is on the left and it is the one used for the analysis. Note that for the mobility part, all the possibilities have been further mapped to Moving. For the location data, we also aggregated some very specific locations to make spotting patterns an easier task.
| SmartUniTn | WeNet |
| Sleeping | (1) Sleeping; (41) I will go to sleep |
| Selfcare | (2) Personal care |
| Eating | (3) Eating |
| Study | (5) Study/work group; (38) I have a work/study meeting |
| Lesson | (6) Lecture/seminar/conference/university meeting; (40) I am starting classes/lessons/lab |
| Social life | (12) Social life; (13) Happy Hour/Drinking/Party |
| Watching Youtube Tv-shows etc. | (18) Watching TV, video, YouTube, etc. |
| Social media (Facebook Instagram etc.) | (16) Surfed or seeking via Internet; (17) Social media (Facebook Instagram etc.) |
| Coffee break cigarette beer etc. | (9) Break (coffee, cigarette, drink, etc.) |
| All the phone; in chat WhatsApp | (14) Phone/Video calling; (15) In chat on Internet or reading, sending e-mail; |
| Reading a book; listening to music | (19) Listening to music; (20) Reading a book, periodicals, news, etc. |
| Movie Theater Theater Concert Exhibit Entertainment and Culture | (21) Movie Theatre Concert … ; (22) Entertainment Exhibit, and Culture; (23) Others Entertainment and Culture; (39) I am at the cinema/theater/hospital/church |
| Housework | (4) Cooking, Food preparation & management; (30) Household and family care |
| Shopping | (31) Grocery Shopping; (32) Other Shopping |
| Sport | (28) Sport; (37) I will participate in sports activities |
| Rest/nap | (7) Did not do anything special; (8) Rest/nap |
| Hobbies | (27) Free Time Study; (24) Arts; (25) Hobbies; (26) Games |
| Work | (33) Work |
| By car | (48) by car; (49) by car as passenger |
| By foot | (10) Walking; (42) on foot |
| By bike | (43) by bike |
| By bus | (11)Travelling (44)by bus/tram; (45)by metro/subway/underground |
| By train | (46) by train |
| By motorbike | (47) by motorbike |
| Other | (34)Other (36)Others; (29)Voluntary work, and participatory activities |
| Final Mapping | SmartUniTn | WeNet |
| Gym | Gym, swimming pool, Sports centre… | Gym, swimming pool, Sports centre… |
| Home | Home apartment/room; Home garden/patio/courtyard | Home apartment/room; Home garden/patio/courtyard |
| Friends’ Home | House (friends’ others’) | House (friends’ others’) |
| Moving | Moving… From.. To | Moving… From.. To |
| Other Library | Other Library | Other Library |
| Other Indoor | Movie Theatre Museum… | Movie Theatre Museum…; Another indoor place |
| Outdoors | Outdoors | In the street; Public Park/Garden; Countryside/mountain/hill/beach; Another outdoor place; Hotel, guesthouse, camping site |
| Bar/Restaurant | Café, pub, bar; Restaurant, pizzeria, Street food vendor | Café, pub, bar; Restaurant, pizzeria, Street food vendor |
| Relatives’ Home | Relatives’ Home | Relatives’ Home; Weekend home or holiday apartment |
| Supermarket/Shop | Grocery Shop; Shops, shopping centres; Supermarket; Street markets | Grocery Shop; Shops, shopping centres, indoor markets, other shops; Supermarket; Street markets |
| University | Canteen; Classroom/Study hall; Classroom/Laboratory; University Library; Other university place | Canteen; Classroom/Study hall; Classroom/Laboratory; University Library; Other university place |
| Workplace | Workplace | Workplace/office |
Appendix B Location and Sociality Routines
In this section we show the NMF extracted components for the location and the sociality behaviour dimensions.
B.1 Locations
Figure A1 shows the 4 location routines and their weights. We see how staying at home has higher weights for 2020, while going to the university is way more common in 2018. These results show the effect of the restrictions.
B.2 Sociality
In Figure A2 we see that some sociality routines remain the same. Still, there are changes, in the fact that being alone is much more common in 2020 and, consequently, social gatherings with friends and classmates are very rare during.
Appendix C Joint Activities, Locations and Sociality
In this section, we show the complete outcome of the NMF algorithm applied to the joint information of activities, location and sociality.
C.1 Activities with Locations
Figure A3 and Figure A4 show the components for the joint information of locations and activities. Like in the main text we see Component 4 of 2018 and Component 3 of 2020 without high weights for locations: this because they are already encoded by the other components. The other components show how the study and lesson activity moved from the university to private homes. Activity routines are very clear for 2020 when students are at home, while they vary more if they go to the university.
C.2 Activities with Sociality
The joint components of activity and sociality are shown in Figure A5 and Figure A6. We see how there is almost no social activity large groups (i.e., classmates and friends) in 2020, and activities that were done with a bigger company in 2018 (i.e., study and having lesson) are done mostly alone. We also see the absence of social life done with friends in 2020, which is instead present in 2018, and social life is just with roommates.