Questioning the Survey Responses of Large Language Models
§ELLIS Institute Tübingen, Germany
‡Tübingen AI Center )
Abstract
As large language models increase in capability, researchers have started to conduct surveys of all kinds on these models with varying scientific motivations. In this work, we examine what we can learn from language models’ survey responses on the basis of the well-established American Community Survey (ACS) by the U.S. Census Bureau. Using a de-facto standard multiple-choice prompting technique and evaluating 40 different language models, hundreds of thousands of times each on questions from the ACS, we systematically establish two dominant patterns. First, models have significant position and labeling biases, for example, towards survey responses labeled with the letter “A”. Second, when adjusting for labeling biases through randomized answer ordering, models across the board trend towards uniformly random survey responses. In fact, binary classifiers can almost perfectly differentiate between models’ responses to the ACS and the responses of the US census. Taken together, our findings suggest caution in treating survey responses from language models as equivalent to those of human populations at present time.
1 Introduction
Surveys have a long tradition in social science research as a means for gathering statistical information about the characteristics, values, and opinions of human populations [Groves et al., 2009]. Insights from surveys inform policy interventions, business decisions, and science across various domains. Surveys typically consist of a series of well-curated questions in a multiple-choice format, with unambi-guous framing and a set of answer choices carefully selected by domain experts. These survey are then given to a group of individuals and their answers are aggregated to gain statistical insights about the population they represent. As large language models increase in capabilities and complexity, researchers have identified the potential benefits of building on well established public surveys for systematically prompting and studying large language models [Santurkar et al., 2023].
While it is tempting to prompt large language models with survey questions, it is unclear what to expect from a model’s survey answers. Modern language models excel at many tasks, including question answering [Brown et al., 2020; Liang et al., 2022]. However, despite the syntactical similarities, surveys pursue a different goal than question answering tasks. Rather than knowledge testing, surveys aim to elicit aggregate statistics over responses. The quality of a survey hinges on how faithfully these statistics represent the reference population.
In this work we investigate the survey responses of large language models on the basis of a widely studied demographic survey in order to determine whether they resemble those of human populations. We employ novel investigative tools and provide abundant evidence that this is presently not the case.
1.1 Our work
The basis of our investigation is the American Community Survey111https://www.census.gov/programs-surveys/acs (ACS), a demographic survey conducted by the US Census Bureau at a national level, on a yearly basis. We curate a questionnaire of 25 multiple choice questions from the 2019 ACS. We prompt 40 language models of varying size with these questions, individually and in sequence, and we collect information about the probability distribution over answers. Based on the collected data, we investigate two questions:
-
1.
When prompting models to answer individual survey questions, to what extent are models’ distributions over answers similar to those of the US census population?
-
2.
Does the data generated by repeatedly prompting models to answer the ACS questionnaire resemble the ACS census data collected by surveying the US population?
First, we inspect models’ distributions over answers to individual survey questions when the questions are asked independently. We observe that the distributions over answers of small language models exhibit significantly lower entropy than those of larger models. We find that this is due to strong position and labeling biases, for example, towards picking the multiple choice answer labeled “A”. We propose to adjust for such ordering biases by aggregating survey responses under randomized answer choice orderings. After this adjustment, we find that language models’ distributions over answers to individual survey questions are predominantly uniform. As a consequence, language models’ distributions over answers happen to coincide with those of the US census population for some well-balanced questions, such as “SEX” (coded as male/female). However, in general, we observe that
language models’ distributions over answers to individual survey questions are significantly more similar to the uniform distribution than to the overall US Census population or the population of any state within the US.
Second, we prompt language models to repeatedly answer entire survey questionnaires, generating for each language model a synthetic dataset which emulates in form the ACS census data. We present questions in a sequential manner, keeping a model’s previous answers in context when prompting the model to answer subsequent questions of the questionnaire. We then investigate whether these synthetic datasets resemble the dataset of responses collected by the US Census. We propose the discriminator test as an investigative tool: we construct a prediction task aiming to discriminate between the model-generate data and the US census data, and we show that this prediction task can be solved with very high accuracy (>97%) for all language models. This indicates that
data generated by sequentially prompting large language models to fill entire survey questionnaires does not resemble the census data collected by surveying the US population.
Taken together, our findings suggest caution in treating the survey responses of large language models as equivalent to those of human populations. We conclude by discussing the implications of our findings for two emerging lines of research: the use of opinion surveys as an investigative tool to quantify the alignment of models to different demographic groups, and the use of language models as a computational tool to emulate the survey responses of human populations in the social sciences.
1.2 Related work
Evaluating language models on the basis of their survey responses differs from traditional evaluations in question answering. Question answering (QA) tasks predominantly serve the purpose of knowledge testing [e.g., Kwiatkowski et al., 2019; Rajpurkar et al., 2016; Talmor et al., 2019; Mihaylov et al., 2018]. In such setting, a language model’s answer to some unambiguous input question (e.g., “What is the capital of France?”) is extracted by (approximately) computing its most likely completion [Vinyals and Le, 2015; Roberts et al., 2020]. Alternatively, respenses to questions that lack a clear answer are considered (e.g., “Angela and Patrick are sitting together. Who is an entrepreneur?”) in order to investigate various biases in language models’ responses [Li et al., 2020; Mao et al., 2021; Perez et al., 2022; Abid et al., 2021; Feng et al., 2023; Jiang et al., 2022].
But little work has been dedicated to investigating models’ distributions over answers, beyond considering a model’s most likely answer. A notable exception is the recent work by Santurkar et al. [2023], who study language models’ answer distributions for multiple-choice opinion polling questions, measuring their similarity to those of various US demographic groups. Durmus et al. [2023] employ a similar methodology but instead consider transnational opinion surveys. We also study models’ distributions over answers to multiple-choice survey questions, but we use a demographic survey as the basis of our study. Furthermore, we place emphasis on investigating models’ answer distributions beyond their relative similarity to human subpopulations. Thereby, our findings add important context to these recent investigations, which we elaborate in more detail in Section 6.
Another differentiating aspect of our work is that, beyond asking questions individually, we also prompt models to complete entire survey questionnaires. We present questions in a sequential manner, keeping a model’s previous answers in context when prompting the model to answer subsequent questions. Hartmann et al. [2023]; Rutinowski et al. [2023]; Motoki et al. [2023] sequentially prompt ChatGPT to answer entire political compass or voting advice questionnaires. They sample up to 100 questionnaire responses and combine them into a score that measures political affinity. Instead of aggregating models’ responses, we examine whether models’ responses resemble those of human populations. Additionally, we consider dozens of publicly available language models in addition to GPT3 and sample 100,000 questionnaire responses for each model.
Previous works have identified that the performance of language models in QA tasks can vary significantly depending on the input prompt [Shin et al., 2020; Jiang et al., 2020; Mishra et al., 2022], such as the order in which few-shot examples are presented [Zhao et al., 2021; Lu et al., 2022]. Robinson and Wingate [2022] identify that in zero-short multiple-choice QA, a model’s most likely answer can change depending on the order in which answer choices are presented. While we also study models’ sensitivity to answer choice ordering, we instead study the extent to which changes in choice ordering affect a model’s output distribution over answers.
Lastly, there is an emerging body of research that integrates large language models into computational social science [Ziems et al., 2023]. This includes tasks such as taxonomic labeling, where language models are employed for tasks such as opinion prediction [Kim and Lee, 2023], and free-form coding, where language models are used to generate explanations for social science constructs [Nelson et al., 2021]. Recent studies have also investigated the feasibility of using language models to simulate human participants in psychological, psycholinguistic, and social psychology experiments [Dillion et al., 2023; Aher et al., 2023], or as proxies for specific human populations in social science research [Argyle et al., 2022] and economics [Brand et al., 2023; Horton, 2023]. Within this context, our work suggests that standard approaches of prompting large language models with multiple-choice surveys do not elicit synthetic responses which resemble those of human populations.
2 Surveying language models
We survey language models with a set of multiple-choice questions from the 2019 American Community Survey. We seek to study, for each survey question, language models’ probability distribution over answers. Formally, for a given model and survey question we define the model’s survey response as a categorical random variable which can take on values corresponding to the number of answer choices to question . Similar to Santurkar et al. [2023], we determine the event probabilities of (i.e., the model’s probability of selecting each answer choice) by prompting model as follows:
-
1.
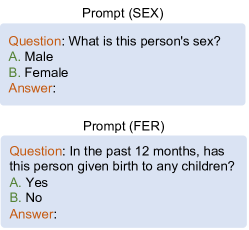
We construct an input prompt of the form “Question: <question> \n A. <choice 1> \n B. <choice 2> \n ... <choice > \n Answer:”. We refer to Figure 1(a) for an illustration at the example of two representative survey questions. This style of prompt is standard for question answering tasks [Hendrycks et al., 2021] and it follows the best practices recommended by Ziems et al. [2023]. We perform several prompt ablations (Appendix D.1).
-
2.
We query the language model with the input prompt and obtain its output distribution over next-token probabilities. We select the output probabilities corresponding to each answer choice (e.g., the tokens “A”, “B”, etc.), and we renormalize.
For GPT3, we only have access to the top-5 next-token log probabilities through the OpenAI API. In this case, we assign to the unseen probabilities (if any) the minimum between the remaining probability mass and the smallest observed probability, following Santurkar et al. [2023].
Survey questions.
We survey language models using a representative subset of 25 multiple-choice questions from the 2019 ACS questionnaire. We denote the set of questions by . The questions cover basic demographic information, education attainment, healthcare coverage, disability status, family status, veteran status, employment status, and income. We generally consider the questions and answers as they appear in the ACS questionnaire, with few exceptions. We refer to Appendix A.1 for the exact framing we used for each question.
Models surveyed.
We survey a dozen publicly available pre-trained language models of size varying from 110M to 175B parameters. This includes GPT2 [Radford et al., 2019], GPT-Neo [Black et al., 2021], Pythia [Biderman et al., 2023], MPT [MosaicML, 2023], LLaMA [Touvron et al., 2023a] and Llama 2 [Touvron et al., 2023b]. We additionally consider the instruct variants of MPT 7B and GPT NeoX 20B, the Dolly fine-tune of Pythia 12B [Databricks, 2023], and the Vicuna and Koala fine-tunes of the LLaMA models [Geng et al., 2023; Chiang et al., 2023]. We retrieve the model weights from Hugging Face.222https://huggingface.co We additionally survey GPT3 and its text-davinci variants [Brown et al., 2020].
Evaluation.
We evaluate language models’ responses against those collected by the U.S. Census Bureau when surveying the US population. In particular, we use the 2019 ACS public use microdata sample333https://www.census.gov/programs-surveys/acs/microdata.html released by the U.S. Census Bureau (henceforth census data). The data contains the anonymized responses of around 3.2 million individuals in the United States. For each survey question , we denote the census’ population-level response as a categorical random variable whose event probabilities are the relative frequency of each answer choice among survey respondents. We use to denote the uniform distribution over answers, which will serve as an additional reference point. Given these reference points, we evaluate language models’ responses along two dimensions:
We use entropy to measure the degree of variation or “randomness” in models’ distributions over answers. We denote the entropy of a random variable as . To meaningfully compare the entropy of responses across questions with varying number of choices , we report normalized entropy, that is, the entropy relative to the uniform distribution. Normalized entropy implies that model ’s survey response to question is uniformly distributed. Naturally, .
We use the Kullback–Leibler (KL) divergence to measure the “similarity” between two answer distributions. We write for the KL divergence between the model response distribution and the corresponding response distribution in the census data.
3 Initial observations
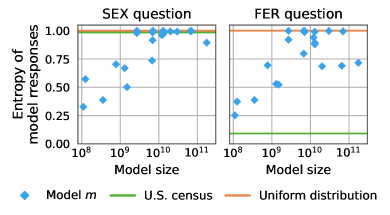
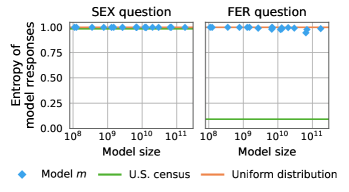
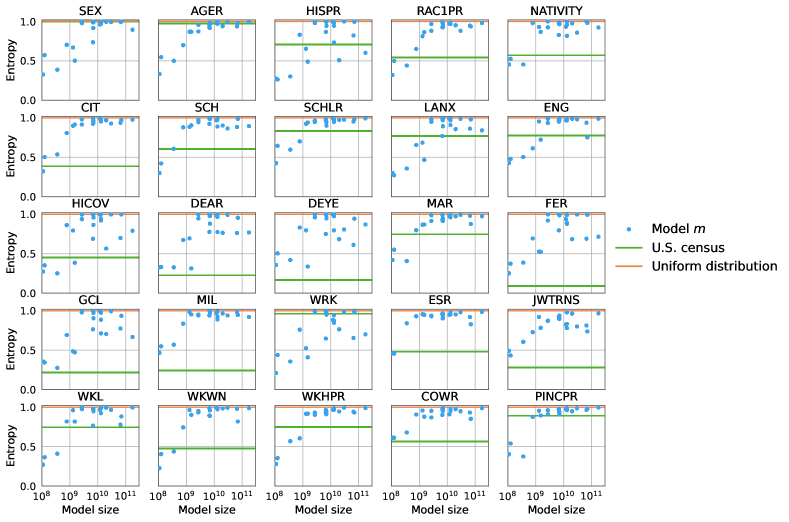
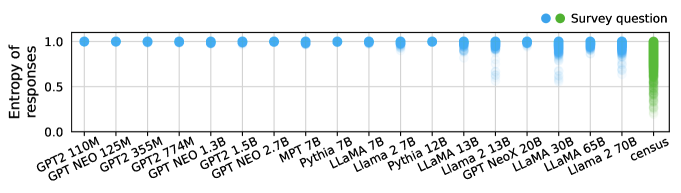
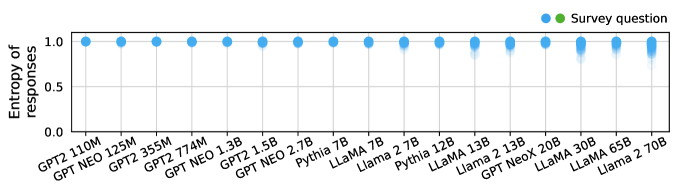
We start by surveying the base pre-trained models (i.e., those without instruction tunning). We survey models with 25 questions from the ACS. We present the survey questions independently and without context, showing the answer choices in the same order as the ACS. For an initial investigation, we compare the entropy of the responses of the different language models. In Figure 1(b) we plot the results for the questions and . Similar plots for all ACS survey questions are provided in Appendix B. As a reference point, we additionally include the entropy of uniformly distributed answers and the entropy observed in the census data.
The dominant trend we observe is that the entropy of the survey responses of language models tends to increase log-linearly with model size, tending towards the entropy of the uniform distribution. This trend holds consistently across questions, irrespective of the response entropy observed in the census data. For instance, as illustrated in Figure 1(b), while the “SEX” and “FER” survey questions have dramatically different response distributions in the U.S. census, the response distributions of language models to these questions are surprisingly similar.
Language models suffer form ordering bias.
Upon closer inspection, we notice a tendency of the smaller language models towards selecting the first presented choice (i.e., “A”). We posit that ordering bias explains the observed dependence between model size and response entropy. To systematically test for ordering bias in language models’ survey responses, we randomize the choice ordering used to prompt the model instead of presenting answer choices in the order in which they appear in the ACS444Note that the ACS questions contain predominantly categorical answer choices (i.e., without ordinal structure)., and measure the effect of such randomization on the models’ survey responses.
3.1 Randomized choice ordering
For a given question , we prompt models with different permutations of the answer choice ordering, i.e., the assignment of answers (e.g., “male”, “female”) to choice labels (“A”, “B”, etc). This allows us to (approximately) compute a models’ expected survey response under uniformly random choice ordering. We use to denote the expected distribution over answers and to denote the expected distribution over selected choice labels. This distinction serves to decouple the model’s tendency towards picking a particular answer from the tendency towards picking a particular choice label. We evaluate a maximum of 5000 permutations per survey question.555 For GPT3 we put the threshold at 50 permutations due to the costs associated with querying the OpenAI API.
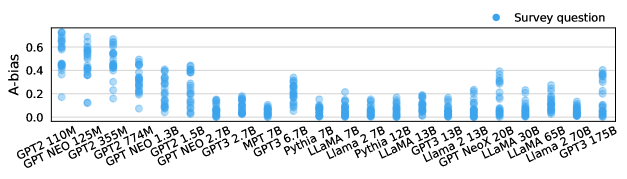
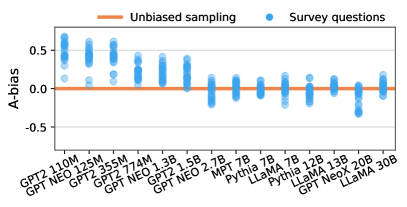
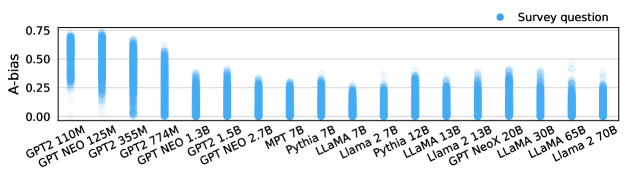
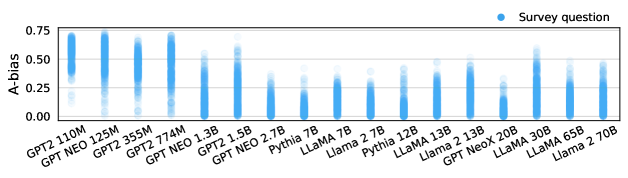
3.2 Quantifying A-bias
For an unbiased model that outputs the same answers irrespective of choice ordering, the expected choice distribution would match precisely the uniform distribution. We define a model’s A-bias as the absolute deviation from this unbiased baseline:
| (1) |
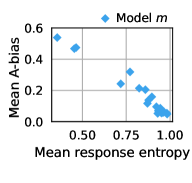
We measure A-bias for each question and model . Results are illustrated in Figure 2(a). We sort models by their size. We observe that while all models exhibit substantial A-bias, models in the order of a few billion parameters or fewer consistently exhibit particularly strong A-bias. In fact, we find a strong negative correlation between a model’s A-bias and its entropy over answers. We visualize this in Figure 2(b) by averaging entropy and A-bias across questions.
We consider additional randomization experiments in Appendix C, where we investigate other types of labelling and position bias (e.g., last-choice bias). Overall, we find a strong tendency of language models to pick up on spurious signals in the way that answers are ordered and labeled, rather than their semantic meaning.
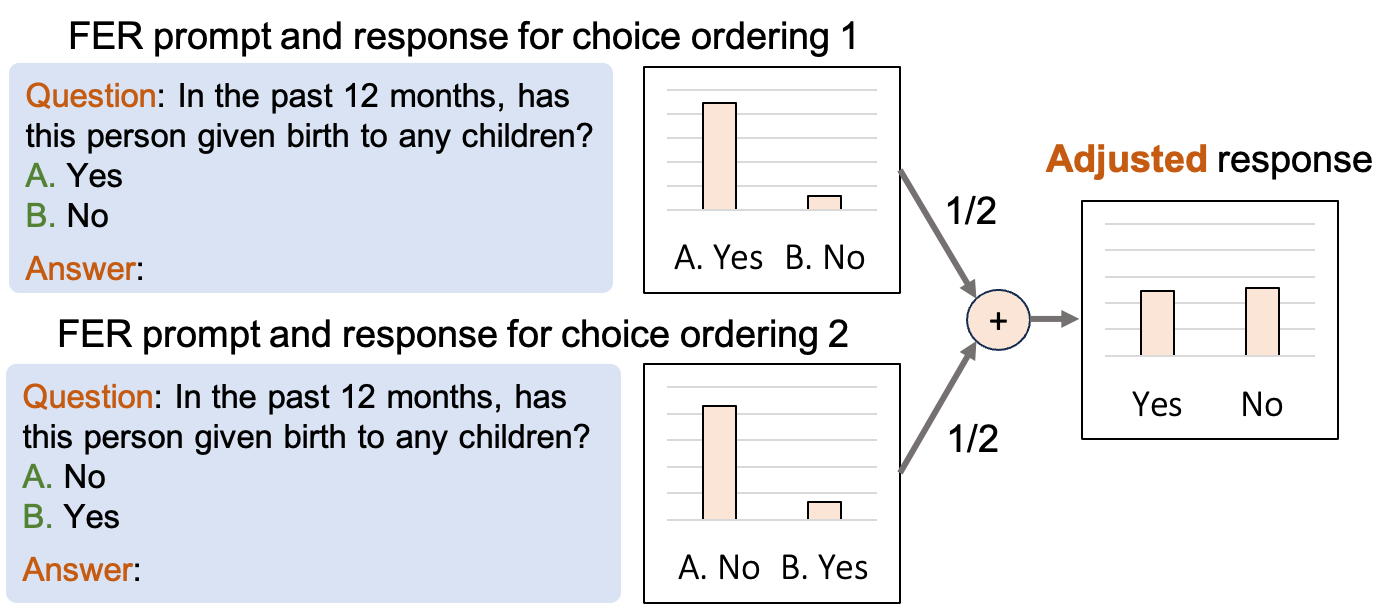
4 Adjusted survey responses
We evaluate survey responses under randomized choice ordering, in order to mitigate confounding caused by labeling and ordering biases, as motivated in the previous section. We refer to the expected survey response under uniformly distributed choice ordering as the adjusted survey response . Similarly to the previous section, we compute a model’s adjusted survey response by averaging over its response distributions under different answer choice orderings, as illustrated in Figure 3(a).
4.1 Adjusted model responses are close to uniformly random
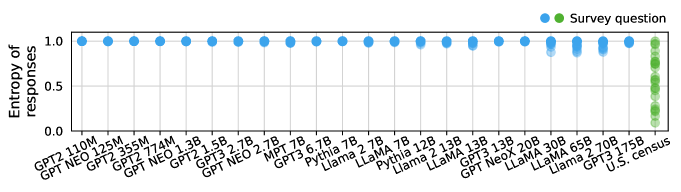
First, we investigate the entropy of model responses after adjustment. We observe that the results differ very substantially from those observed in Section 3.1. Most notably, we no longer observe the trend of the entropy of model responses increasing log-linearly with model size. Instead, language models’ survey responses have a normalized entropy of approximately irrespective of model size. See Figure 3(b) for the entropy of the adjusted responses to the SEX and FER question. These results are meant to be contrasted with those in Figure 1(b).
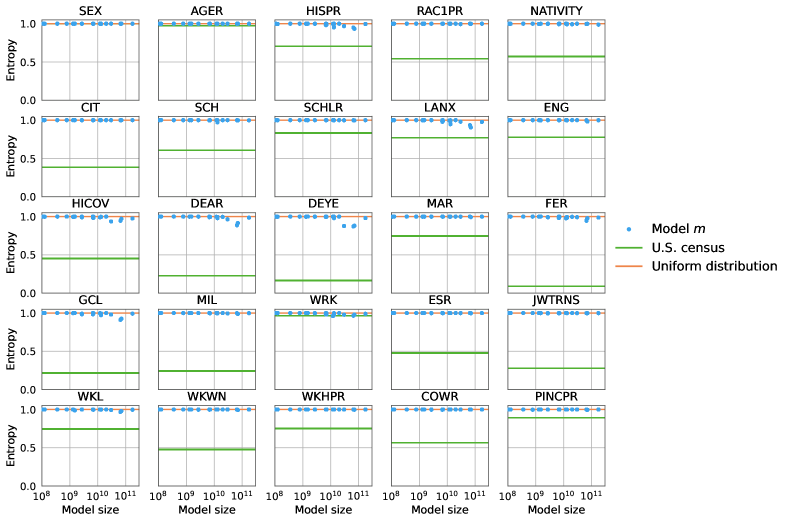
In Figure 4 we plot the normalized entropy of models’ responses for all ACS questions considered. While the entropy of the responses in the census data varies substantially across questions, we observe that post-adjustment all model responses have entropy close to 1. These stark results indicate that after adjusting for choice ordering biases, language models produce close to uniform responses irrespective of the survey question used to prompt the model.
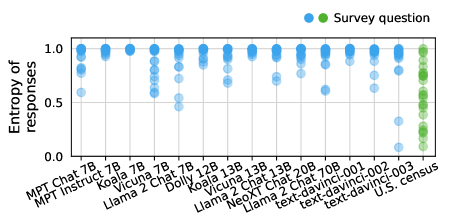
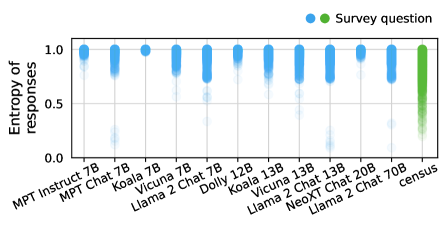
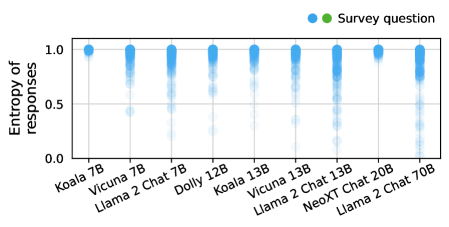
4.2 Effect of instruction-tuning and RLHF on survey responses
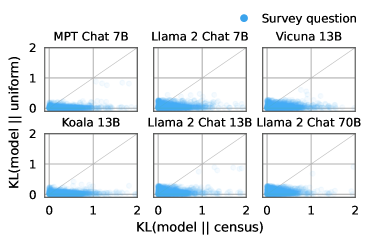
We seek to determine the extent to which instruction-tuned or reinforcement learning with human feedback (RLHF) tuned models differ in their survey responses to the base models from which they are fine-tuned. As before, we first consider the entropy of their responses. We observe that instruction-tuning and RLHF-tuning tends to reduce the entropy of models’ responses compared to their respective base models, see Figure 5(a). Since instruction/RLHF-tuning results in model responses that deviate more strongly from the uniform baseline compared to the base models, we next consider whether their responses end up being more similar to the census data.
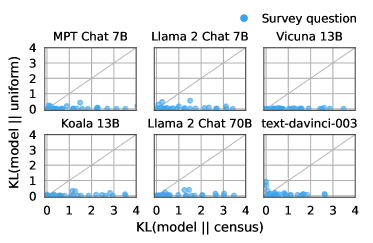
In Figure 5(b) we plot the KL divergence of models’ responses to both the census responses and to the uniform distribution. We observe that models’ responses are still substantially closer to the uniform distribution than to the census responses. The model with the largest number of responses being closer to the US census is text-davinci-003, for which only 3 out of 25 questions (12%) are closer to the US census than to uniform. Thus, while the responses of instruction/RLHF-tuned models deviate more strongly from uniform, nonetheless models’ responses to almost all survey questions are closer to the uniform distribution than to the census data.
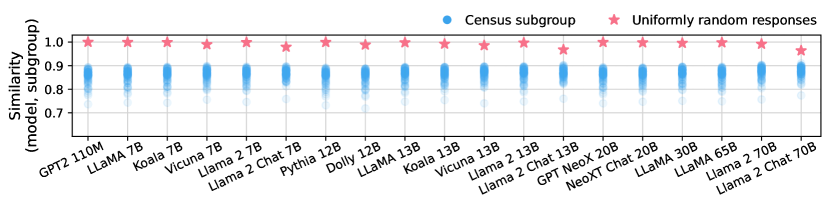
4.3 Similarity of responses to different reference populations
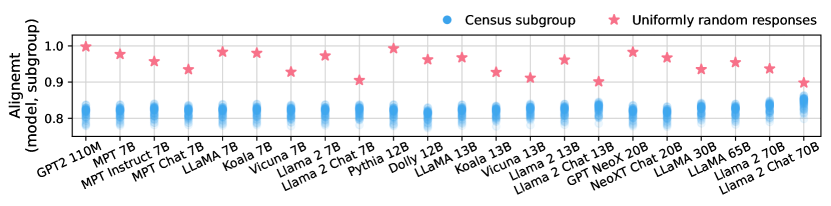
Next, we investigate whether language models’ responses are more similar to certain subpopulations of the U.S. census compared to others. To do so, we consider 50 U.S. census subgroups, corresponding to every state in the United States. The census data contains the state as an attribute which allows us to split the data by subgroup. We denote as the census’ distribution over answers to question for the census subgroup . We measure divergence of a language model to a census subgroup by the mean KL divergence across survey questions. More formally:
| (2) |
where we recall that denotes the model’s adjusted survey response. This divergence measure is motivated by the alignment metric proposed by Santurkar et al. [2023], where we use the KL divergence instead of the Wasserstein distance, as questions in the ACS are predominantly nominal.

In Figure 6 we depict the divergence of language models’ responses to each of the 50 census subgroups. We observe that divergence varies significantly across census subgroups. Therefore, models’ responses appear to be more aligned with certain census subgroups than with others. However, when additionally comparing models’ responses to a “uniformly random baseline” that picks answers uniformly at random for all survey responses, we observe that the survey responses of all models are strikingly more similar to the uniformly random baseline than to any of the 50 census subgroups.
5 Sampling responses to entire survey questionnaires
In the previous sections, survey responses to each questions in the ACS were obtained independently of each other. We now seek to fill entire ACS questionnaires in a sequential manner, in order to generate for each language model a synthetic dataset of survey responses. We then study the extent to which such synthetic dataset resembles the ACS dataset collected by the US Census Bureau.
5.1 Methodology: Sequential sampling
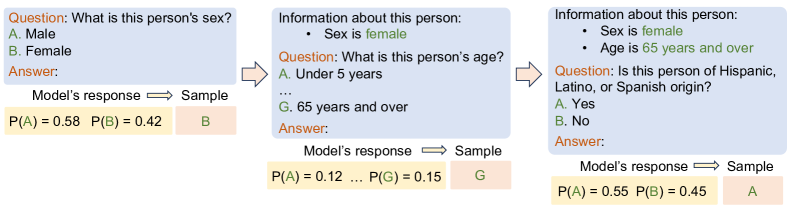
We present survey questions in the same order as in the ACS questionnaire. When querying a model to answer survey question , we include a summary of the previously sampled answers in context. We then sample from the model’s output probability distribution over answers, and continue to the next question. We illustrate this sequential process in Figure 7. We refer to Appendix D.2 for results collected with different variations of how a model’s previous answers are integrated into the prompt. Overall our results are robust to different ways of providing context.
For each language model, we sample 100,000 model-generate responses to the ACS. We only consider models with publicly available model weights, since conducting a similar scale experiment through the OpenAI API exceeds our budget. Therefore, we generate for each language model a synthetic dataset similar in form to the ACS census data, with 100,000 rows corresponding to each filled questionnaire and 25 columns corresponding to each survey question.
5.2 The discriminator test
We investigate whether the model-generated datasets resemble the US census data by constructing a binary prediction task aiming to discriminate synthetic data from census data. Intuitively, if the model-generated data were to be very dissimilar from the census data, then a classifier would be able to discriminate between model-generated and census data with high accuracy. Formally, let be class of binary prediction functions mapping each datapoint (corresponding to a row in the dataset) to , then the accuracy of the best on the discriminator task provides a lower bound on the total variation (TV) distance between the two empirical data distributions.
Hence, we train a predictor to discriminate between the model-generated data and the census data in order to obtain an empirical lower bound on the distance between the two datasets. Specifically, we concatenate to each model-generated dataset a random sample of 100,000 individuals from the ACS census data, and introduce a binary label indicating whether each row of the concatenated dataset was model-generated or not. We train an XGBoost classifier in such binary prediction task.
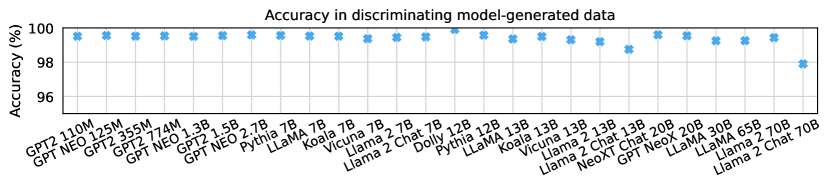
We report mean test accuracy in Figure 8. We consider 100 different random seeds, and find very little variability, making error bars negligible. We find that the trained classifiers can differentiate between model-generated data and census data with very high accuracy (>97%) irrespective of model size or whether the model was instruction/RLHF-tuned. Thus, we conclude that the empirical distributions corresponding to the model-generated data and the census data have have TV distance of approximately (i.e., are maximally dissimilar in TV). These stark results indicate that data generated by sequentially prompting language models with the ACS survey questionnaire do not resemble the data collected by surveying the US population.
6 Discussion and implications of our results
Our work provides necessary context to recent works that employ surveys to systematically prompt language models with various scientific motivations. We discuss our findings in the context of two representative lines of work: the use of opinion surveys as an investigative tool to study the biases of LLMs [Santurkar et al., 2023; Durmus et al., 2023], and the use of language models as a computational tool to emulate the survey responses of human populations in the social sciences [Argyle et al., 2022].
6.1 Opinion surveys and alignment
Santurkar et al. [2023] propose to use opinion polls to study the opinions expressed by LLMs and assess their degree of similarity or “alignment” to those of 60 different US demographic subgroups (i.e., stratified by age or income) by leveraging approximately 1500 multiple-choice questions from Pew Research’s American Trends Panel (ATP) surveys. Durmus et al. [2023] seek to measure alignment to the opinions expressed by the populations of roughly 60 different countries, using approximately 2300 multiple-choice questions from Pew Research’s Global Attitudes Surveys (GAS) and the World Values Survey (WVS). These works measure alignment between models and populations using the 1-Wasserstein distance and 1-Jensen-Shannon distance between their corresponding survey responses, respectively. We adopt these measures for the investigations detailed below.
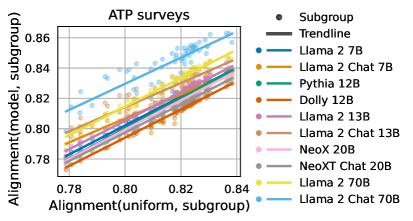
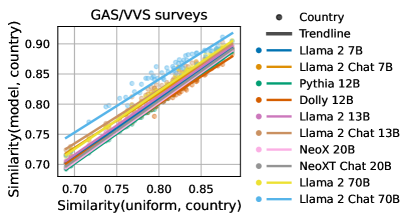
We reproduce the experiments of Sections 3 and Section 4 for the ATP and GAS/WVS survey questions considered by these works. The results and overall conclusions closely match those obtained by surveying models using the ACS (Appendix E). In particular, all models exhibit substantial ordering biases for the ATP, GAS, and WVS questions. After adjusting for ordering bias, we observe that models are more aligned with uniformly random responses than any subpopulation considered by Santurkar et al. [2023] and Durmus et al. [2023]. Additionally, we observe that alignment between models and some demographic group is highly correlated with the “aligment” of the demographic group with uniformly random responses, as shown in Figure 9. This implies that the alignment measures proposed by prior work may be more informative of the survey responses of the reference population, rather than of the language models they aim to evaluate and their particularities, such as their training distribution or the demographics of the annotators used for RLHF.
For example, Santurkar et al. [2023] find that “all the base models share striking similarities–e.g., being most aligned with lower income, moderate, and Protestant or Roman Catholic groups” and “our analysis […] surfaces groups whose opinions are poorly reflected by current LLMs (e.g., 65+ and widowed individuals)”. For the ATP surveys considered, low income, moderate, and Protestant/Catholic are precisely the subgroups with responses closest to uniformly random among the income, political ideology, and religion demographic subgroups; whereas age 65+ and widowed are the subgroups with responses furthest from uniform among the age and marital status subgroups. Additionally, Santurkar et al. [2023] observe that RLHF results in a “substantial shift […] towards more liberal, educated, and wealthy [demographic groups]”. After adjusting for ordering bias, however, the alignment trends of RLHF-tuned models are remarkably similar to those of all other LLMs (Figure 9).
6.2 Emulating the survey responses of human populations
Argyle et al. [2022] propose “silicon sampling”, a methodology to produce “synthetic” survey respondents using LLMs by conditioning on actual survey respondents. They focus a subset of 12 questions from the 2016 American National Election Studies (ANES) survey. For every ANES survey respondent, they construct a corresponding “silicon individual” by querying GPT3 to predict the ANES respondent’s answer to each survey question given the respondent’s answers to all other questions. They find that pairwise correlations between the responses of the silicon individuals are comparable to the pairwise correlations observed in ANES respondents. Their results indicate that, for the 2016 ANES survey, GPT3 can be a fairly calibrated predictor of an individual’s answer to some survey question conditioned on the respondent’s answers to all other survey questions.
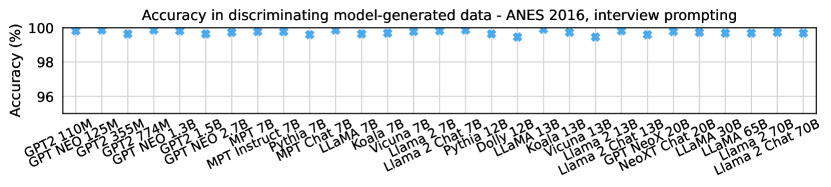
Although Argyle et al. [2022] generate synthetic responses by conditioning on actual human responses, they emphasize that important insights can be gained by emulating the survey responses of human populations using GPT3 “prior to or in the absence of human data”, as otherwise “the usefulness of GPT-3 would be dramatically limited”. In this work we have considered precisely the setting where models’ responses are obtained in the absence of human data.666Conceptually, to generate each synthetic individual, we start with a blank survey questionnaire and prompt the LLM to sequentially fill the entire questionnaire. Whereas we only prompt LLMs with their own responses (i.e., to previous survey questions), Argyle et al. [2022] prompt the model only with actual human responses from the 2016 ANES data. To investigate how our findings transfer to the ANES, we reproduce the experiments of Section 5 using the 2016 ANES survey questionnaire considered by Argyle et al. [2022] and their “interview-style” prompt. We apply the discriminator test, and find that the trained classifiers can discriminate between the model-generated data and the 2016 ANES data with very high accuracy (>97%) (see Appendix E), indicating that models’ responses to ANES are markedly different to the human responses in the ANES data.
Therefore, the fact that LLMs may perform reasonably well at feature imputation tasks (e.g., predicting an individual’s answer to some question given their answers to all other questions) does not imply that LLMs can generate a set of synthetic respondents that resembles the responses obtained by surveying human populations. We therefore suggest caution in using LLMs to emulate the survey responses of human populations, particularly in the absence of human data.
6.3 Conclusion
Our results show that large language models that are able excel at question answering tasks do not necessarily match expectations in eliciting the survey responses of human populations when prompted using multiple-choice survey questions. It remains to be seen whether our findings persist with ever more capable language models. However, in the meantime, we encourage practitioners to be mindful of the potential shortcomings of treating language models’ survey responses as comparable to those of human populations. Further, we hope that the techniques we developed, such as probing for ordering bias, adjusting for such ordering biases by randomizing answer choice ordering, benchmarking LLMs’ responses with respect to the uniform distribution, and the proposed discriminator test, can serve as valuable tools for further investigating and questioning the survey responses of large language models.
References
- Abid et al. [2021] Abubakar Abid, Maheen Farooqi, and James Zou. Persistent anti-muslim bias in large language models. In Proceedings of the 2021 AAAI/ACM Conference on AI, Ethics, and Society, pages 298–306, 2021.
- Aher et al. [2023] Gati V Aher, Rosa I Arriaga, and Adam Tauman Kalai. Using large language models to simulate multiple humans and replicate human subject studies. In International Conference on Machine Learning, pages 337–371. PMLR, 2023.
- Argyle et al. [2022] Lisa P Argyle, Ethan C Busby, Nancy Fulda, Joshua Gubler, Christopher Rytting, and David Wingate. Out of one, many: Using language models to simulate human samples. arXiv preprint arXiv:2209.06899, 2022.
- Biderman et al. [2023] Stella Biderman, Hailey Schoelkopf, Quentin Anthony, Herbie Bradley, Kyle O’Brien, Eric Hallahan, Mohammad Aflah Khan, Shivanshu Purohit, USVSN Sai Prashanth, Edward Raff, Aviya Skowron, Lintang Sutawika, and Oskar van der Wal. Pythia: A suite for analyzing large language models across training and scaling. arxiv prepring arxiv:2304.01373, 2023.
- Black et al. [2021] Sid Black, Leo Gao, Phil Wang, Connor Leahy, and Stella Biderman. GPT-Neo: Large Scale Autoregressive Language Modeling with Mesh-Tensorflow, 2021. URL https://doi.org/10.5281/zenodo.5297715.
- Brand et al. [2023] James Brand, Ayelet Israeli, and Donald Ngwe. Using GPT for Market Research. Harvard Business School Marketing Unit Working Paper No. 23-062, 2023.
- Brown et al. [2020] Tom Brown, Benjamin Mann, Nick Ryder, Melanie Subbiah, Jared D Kaplan, Prafulla Dhariwal, Arvind Neelakantan, Pranav Shyam, Girish Sastry, Amanda Askell, Sandhini Agarwal, Ariel Herbert-Voss, Gretchen Krueger, Tom Henighan, Rewon Child, Aditya Ramesh, Daniel Ziegler, Jeffrey Wu, Clemens Winter, Chris Hesse, Mark Chen, Eric Sigler, Mateusz Litwin, Scott Gray, Benjamin Chess, Jack Clark, Christopher Berner, Sam McCandlish, Alec Radford, Ilya Sutskever, and Dario Amodei. Language models are few-shot learners. In Advances in Neural Information Processing Systems, pages 1877–1901, 2020.
- Chiang et al. [2023] Wei-Lin Chiang, Zhuohan Li, Zi Lin, Ying Sheng, Zhanghao Wu, Hao Zhang, Lianmin Zheng, Siyuan Zhuang, Yonghao Zhuang, Joseph E. Gonzalez, Ion Stoica, and Eric P. Xing. Vicuna: An open-source chatbot impressing gpt-4 with 90%* chatgpt quality, March 2023. URL https://lmsys.org/blog/2023-03-30-vicuna/.
- Databricks [2023] Databricks. Dolly 12b. April 2023. URL https://github.com/databrickslabs/dolly.
- Dillion et al. [2023] Danica Dillion, Niket Tandon, Yuling Gu, and Kurt Gray. Can AI language models replace human participants? Trends in Cognitive Sciences, 2023.
- Ding et al. [2021] Frances Ding, Moritz Hardt, John Miller, and Ludwig Schmidt. Retiring adult: New datasets for fair machine learning. Advances in Neural Information Processing Systems, 2021.
- Durmus et al. [2023] Esin Durmus, Karina Nyugen, Thomas I Liao, Nicholas Schiefer, Amanda Askell, Anton Bakhtin, Carol Chen, Zac Hatfield-Dodds, Danny Hernandez, Nicholas Joseph, et al. Towards measuring the representation of subjective global opinions in language models. arXiv preprint arXiv:2306.16388, 2023.
- Feng et al. [2023] Shangbin Feng, Chan Young Park, Yuhan Liu, and Yulia Tsvetkov. From Pretraining Data to Language Models to Downstream Tasks: Tracking the Trails of Political Biases Leading to Unfair NLP Models. Findings of the Association for Computational Linguistics: ACL 2023, 2023.
- Geng et al. [2023] Xinyang Geng, Arnav Gudibande, Hao Liu, Eric Wallace, Pieter Abbeel, Sergey Levine, and Dawn Song. Koala: A dialogue model for academic research. Blog post, April 2023. URL https://bair.berkeley.edu/blog/2023/04/03/koala/.
- Groves et al. [2009] R.M. Groves, F.J. Fowler, M.P. Couper, J.M. Lepkowski, E. Singer, and R. Tourangeau. Survey Methodology. Wiley, 2009.
- Hartmann et al. [2023] Jochen Hartmann, Jasper Schwenzow, and Maximilian Witte. The political ideology of conversational AI: Converging evidence on ChatGPT’s pro-environmental, left-libertarian orientation. arXiv preprint arXiv:2301.01768, 2023.
- Hendrycks et al. [2021] Dan Hendrycks, Collin Burns, Steven Basart, Andy Zou, Mantas Mazeika, Dawn Song, and Jacob Steinhardt. Measuring massive multitask language understanding. In International Conference on Learning Representations, 2021.
- Horton [2023] John J Horton. Large language models as simulated economic agents: What can we learn from homo silicus? NBER Working Paper, (w31122), 2023.
- Jiang et al. [2022] Hang Jiang, Doug Beeferman, Brandon Roy, and Deb Roy. CommunityLM: Probing Partisan Worldviews from Language Models. In Proceedings of the 29th International Conference on Computational Linguistics, 2022.
- Jiang et al. [2020] Zhengbao Jiang, Frank F Xu, Jun Araki, and Graham Neubig. How can we know what language models know? Transactions of the Association for Computational Linguistics, 8:423–438, 2020.
- Kim and Lee [2023] Junsol Kim and Byungkyu Lee. AI-Augmented Surveys: Leveraging Large Language Models for Opinion Prediction in Nationally Representative Surveys. arXiv preprint arxiv:2305.09620, 2023.
- Kwiatkowski et al. [2019] Tom Kwiatkowski, Jennimaria Palomaki, Olivia Redfield, Michael Collins, Ankur Parikh, Chris Alberti, Danielle Epstein, Illia Polosukhin, Jacob Devlin, Kenton Lee, Kristina Toutanova, Llion Jones, Matthew Kelcey, Ming-Wei Chang, Andrew M. Dai, Jakob Uszkoreit, Quoc Le, and Slav Petrov. Natural questions: A benchmark for question answering research. Transactions of the Association for Computational Linguistics, 7:452–466, 2019.
- Li et al. [2020] Tao Li, Daniel Khashabi, Tushar Khot, Ashish Sabharwal, and Vivek Srikumar. Unqovering stereotyping biases via underspecified questions. In Findings of the Association for Computational Linguistics, pages 3475–3489, 2020.
- Liang et al. [2022] Percy Liang, Rishi Bommasani, Tony Lee, Dimitris Tsipras, Dilara Soylu, Michihiro Yasunaga, Yian Zhang, Deepak Narayanan, Yuhuai Wu, Ananya Kumar, Benjamin Newman, Binhang Yuan, Bobby Yan, Ce Zhang, Christian Cosgrove, Christopher D. Manning, Christopher Ré, Diana Acosta-Navas, Drew A. Hudson, Eric Zelikman, Esin Durmus, Faisal Ladhak, Frieda Rong, Hongyu Ren, Huaxiu Yao, Jue Wang, Keshav Santhanam, Laurel Orr, Lucia Zheng, Mert Yuksekgonul, Mirac Suzgun, Nathan Kim, Neel Guha, Niladri Chatterji, Omar Khattab, Peter Henderson, Qian Huang, Ryan Chi, Sang Michael Xie, Shibani Santurkar, Surya Ganguli, Tatsunori Hashimoto, Thomas Icard, Tianyi Zhang, Vishrav Chaudhary, William Wang, Xuechen Li, Yifan Mai, Yuhui Zhang, and Yuta Koreeda. Holistic evaluation of language models. arXiv preprint arxiv:2211.09110, 2022.
- Lu et al. [2022] Yao Lu, Max Bartolo, Alastair Moore, Sebastian Riedel, and Pontus Stenetorp. Fantastically ordered prompts and where to find them: Overcoming few-shot prompt order sensitivity. In Proceedings of the 60th Annual Meeting of the Association for Computational Linguistics (Volume 1: Long Papers), pages 8086–8098, 2022.
- Mao et al. [2021] Andrew Mao, Naveen Raman, Matthew Shu, Eric Li, Franklin Yang, and Jordan Boyd-Graber. Eliciting bias in question answering models through ambiguity. In Proceedings of the 3rd Workshop on Machine Reading for Question Answering, pages 92–99, 2021.
- Mihaylov et al. [2018] Todor Mihaylov, Peter Clark, Tushar Khot, and Ashish Sabharwal. Can a suit of armor conduct electricity? a new dataset for open book question answering. In Proceedings of the 2018 Conference on Empirical Methods in Natural Language Processing, pages 2381–2391, 2018.
- Mishra et al. [2022] Swaroop Mishra, Daniel Khashabi, Chitta Baral, Yejin Choi, and Hannaneh Hajishirzi. Reframing instructional prompts to gptk’s language. In 60th Annual Meeting of the Association for Computational Linguistics, ACL 2022, pages 589–612. Association for Computational Linguistics (ACL), 2022.
- MosaicML [2023] MosaicML. Introducing MPT-7B: A New Standard for Open-Source, Commercially Usable LLMs, 2023. URL www.mosaicml.com/blog/mpt-7b.
- Motoki et al. [2023] Fabio Motoki, Valdemar Pinho Neto, and Victor Rodrigues. More human than human: Measuring chatgpt political bias. Available at SSRN 4372349, 2023.
- Nelson et al. [2021] Laura K Nelson, Derek Burk, Marcel Knudsen, and Leslie McCall. The future of coding: A comparison of hand-coding and three types of computer-assisted text analysis methods. Sociological Methods & Research, 50(1):202–237, 2021.
- Perez et al. [2022] Ethan Perez, Sam Ringer, Kamilė Lukošiūtė, Karina Nguyen, Edwin Chen, Scott Heiner, Craig Pettit, Catherine Olsson, Sandipan Kundu, Saurav Kadavath, Jack Clark, Samuel R. Bowman, Amanda Askell, Roger Grosse, Danny Hernandez, Deep Ganguli, Evan Hubinger, Nicholas Schiefer, and Jared Kaplan. Discovering language model behaviors with model-written evaluations. arXiv preprint arXiv:2212.09251, 2022.
- Radford et al. [2019] Alec Radford, Jeff Wu, Rewon Child, David Luan, Dario Amodei, and Ilya Sutskever. Language models are unsupervised multitask learners. 2019.
- Rajpurkar et al. [2016] Pranav Rajpurkar, Jian Zhang, Konstantin Lopyrev, and Percy Liang. SQuAD: 100,000+ questions for machine comprehension of text. In Proceedings of the 2016 Conference on Empirical Methods in Natural Language Processing, 2016.
- Roberts et al. [2020] Adam Roberts, Colin Raffel, and Noam Shazeer. How much knowledge can you pack into the parameters of a language model? In Proceedings of the 2020 Conference on Empirical Methods in Natural Language Processing, 2020.
- Robinson and Wingate [2022] Joshua Robinson and David Wingate. Leveraging large language models for multiple choice question answering. In The Eleventh International Conference on Learning Representations, 2022.
- Rutinowski et al. [2023] Jérôme Rutinowski, Sven Franke, Jan Endendyk, Ina Dormuth, and Markus Pauly. The Self-Perception and Political Biases of ChatGPT. arXiv preprint arXiv:2304.07333, 2023.
- Santurkar et al. [2023] Shibani Santurkar, Esin Durmus, Faisal Ladhak, Cinoo Lee, Percy Liang, and Tatsunori Hashimoto. Whose opinions do language models reflect? International Conference on Machine Learning, 2023.
- Shin et al. [2020] Taylor Shin, Yasaman Razeghi, Robert L Logan IV, Eric Wallace, and Sameer Singh. Autoprompt: Eliciting knowledge from language models with automatically generated prompts. In Proceedings of the 2020 Conference on Empirical Methods in Natural Language Processing (EMNLP), pages 4222–4235, 2020.
- Talmor et al. [2019] Alon Talmor, Jonathan Herzig, Nicholas Lourie, and Jonathan Berant. CommonsenseQA: A question answering challenge targeting commonsense knowledge. In Proceedings of the 2019 Conference of the North American Chapter of the Association for Computational Linguistics: Human Language Technologies, pages 4149–4158, 2019.
- Touvron et al. [2023a] Hugo Touvron, Thibaut Lavril, Gautier Izacard, Xavier Martinet, Marie-Anne Lachaux, Timothée Lacroix, Baptiste Rozière, Naman Goyal, Eric Hambro, Faisal Azhar, et al. Llama: Open and efficient foundation language models. arXiv preprint arXiv:2302.13971, 2023a.
- Touvron et al. [2023b] Hugo Touvron, Louis Martin, Kevin Stone, Peter Albert, Amjad Almahairi, Yasmine Babaei, Nikolay Bashlykov, Soumya Batra, Prajjwal Bhargava, Shruti Bhosale, et al. Llama 2: Open foundation and fine-tuned chat models. arXiv preprint arXiv:2307.09288, 2023b.
- Vinyals and Le [2015] Oriol Vinyals and Quoc Le. A neural conversational model. Proceedings of the International Conference on Machine Learning, 2015.
- Zhao et al. [2021] Zihao Zhao, Eric Wallace, Shi Feng, Dan Klein, and Sameer Singh. Calibrate before use: Improving few-shot performance of language models. In International Conference on Machine Learning, pages 12697–12706. PMLR, 2021.
- Ziems et al. [2023] Caleb Ziems, William Held, Omar Shaikh, Jiaao Chen, Zhehao Zhang, and Diyi Yang. Can large language models transform computational social science? arxiv preprint arxiv:2305.03514, 2023.
Appendix A Experimental details
We use the American Community Survey (ACS) Public Use Microdata Sample (PUMS) files made available by the U.S. Census Bureau.777https://www.census.gov/programs-surveys/acs/microdata.html The data itself is governed by the terms of use provided by the Census Bureau.888https://www.census.gov/data/developers/about/terms-of-service.html We download the data directly from the U.S. Census using the Folktables Python package [Ding et al., 2021]. We download the files corresponding to the year 2019.
We downloaded the publicly available language model weights from their respective official HuggingFace repositories. We run the models in an internal cluster. The total number of GPU hours needed to complete all experiments is approximately 1500 (NVIDIA A100). The budget spent querying the OpenAI models was approximately $50.
We open source the code to replicate all experiments.999https://github.com/socialfoundations/surveying-language-models In addition, the repository contains notebooks to visualize the results of our investigations under different prompt ablations.
A.1 Survey questionnaire used
The exact questionnaire used in our experiments can be retrieved from our Github repository. We consider 25 questions from the 2019 ACS questionnaire corresponding to the following variables in the Public Use Microdata Sample: SEX, AGEP, HISP, RAC1P, NATIVITY, CIT, SCH, SCHL, LANX, ENG, HICOV, DEAR, DEYE, MAR, FER, GCL, MIL, WRK, ESR, JWTRNS, WKL, WKWN, WKHP, COW, PINCP. We take all questions as they appear in the ACS, with the exceptions:
-
–
HISP: The ACS contains 5 answer choices corresponding to different Hispanic, Latino, and Spanish origins, and respondents are instructed to write down their origin if their origin is not among the choices provided. We instead provide two choices: “Yes” and “No".
-
–
RAC1P: The ACS contains 15 answer choices, allows for selecting multiple choices, and respondents are instructed to write down their race if not among those in the multiple choice. The PUMS then provides up to 170 race codes (RAC2P and RAC3P). We instead present 9 choices, corresponding to the race codes of the RAC1P varible in the PUMS data dictionary.
Additionally, the variables ESR and COW are not directly associated with any single question in the ACS, but rather aggregate employment information. We formulate them as questions by taking the PUMS data dictionary’s variable and codes descriptions. Lastly, for the questions corresponding to the variables AGE, WKWN, WKHP, and PINCP, respondents are asked to write down an integer number. We convert such questions to multiple-choice via binning.
Appendix B Model responses before and after adjusting for choice ordering bias
The results in this section complement Section 3, and pertain non-instruction-tuned language models. When surveying models without choice order randomization, we observe that the entropy of model responses tends to increase log-linearly with model size, often matching the entropy of the uniform distribution for the larger models. This trend is consistent across survey questions, irrespective of the question’s distribution over responses observed in the U.S. census (Figure 10). After adjusting for choice ordering bias via randomized choice orderings, language models’ survey responses are highly entropic and strongly trend towards the uniform distribution (Figure 11).
Appendix C Ordering bias: further experiments
We conduct additional randomization experiments pertaining to answer choice position and labeling bias, complimenting Section 3.1. We consider the GPT2, GPT Neo, MPT, Pythia, and LLaMA models. The experiments follow a consistent setup:
-
1.
We randomize the both the order in which choices are presented and the label (i.e., letter) assigned to each answer choice. For example, for the "sex" question, the possible combinations are “A. Male B. Female”, “A. Female B. Male”, “B. Male A. Female”, and “B. Female A. Male”.
-
2.
We compute the output distribution over responses for choice position (the probability assigned to the first, second, etc., answer choice presented) and letter assignment (the probability assigned to the answer choice assigned “A”, “B”, etc.).
For each model and survey question, we estimate the expected distribution over responses for both choice position and letter assignment by collecting 3,000 responses (step 2) under different randomizations of choice position and letter assignment (step 1). A model with no position and labeling biases would assign the same probability distribution to answer choices (e.g., “male” and “female”) regardless of position or letter assignment, and therefore the expected distributions over position (e.g., selecting the first choice) and letter assignment (e.g., selecting “A”) would be uniform.
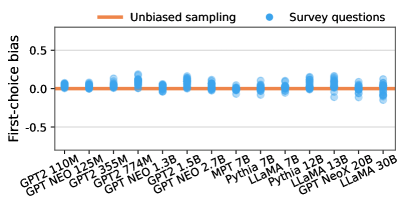
C.1 Disentangling ordering bias into positioning bias and labeling bias
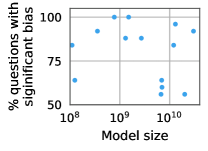
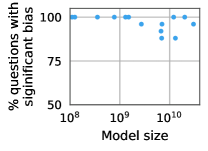
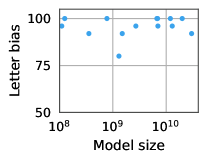
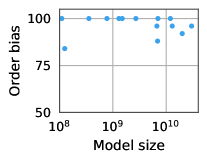
We perform chi-square tests to determine whether language models’ output responses distributions over position and letter assignment significantly deviate from the uniform distribution (i.e., if there exists statistically significant bias in position or letter assignment). Since we collect 3,000 response distributions under randomized choice position and letter assignment, we ensure a high test power ( 0.98) in detecting small effect sizes (0.1) at a significance level of 0.05.
We find that models exhibit significant positioning and letter bias for most survey questions, see Figure 12. We observe that letter bias is more prevalent that positioning bias. While both tend to decrease with model size, order bias decreases more significantly with model size.
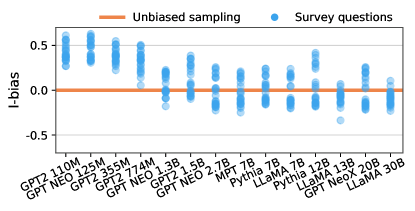
C.2 I-bias
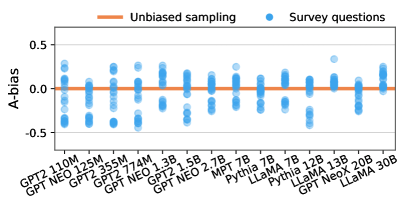
We hypothesize that A-bias is prevalent because the single character “A” is relatively frequent as the starting word of a sentence in written English. We test this hypothesis by replacing the character “B” with “I” when presenting the survey questions, since the character “I” is even more frequent as the starting word of a sentence in written English. We randomize over choice ordering and label assignment as in the previous evaluation. We find that, when presenting both “A” and “I”, small models then exhibit I-bias rather than A-bias (Figure 13), supporting our initial hypothesis.
C.3 Using letters with similar frequency in written English
Motivated by the I-bias experiment, we now examine whether labeling bias can be mitigated by using letters that have similar frequency in written English. Therefore, instead of assigning to choices the labels “A”, “B”, etc. we assign the following labels: “R”, “S”, “N”, “L”, “O”, “T”, “M”, “P”, “W”, “U”, “Y”, “V”. We find that, compared to the “A”, “B”, etc. randomization experiment, the percentage of questions for which models exhibit significant labeling bias somewhat decreases (Figure 15). However, models tend to exhibit substantially more position bias. This indicates that, in the absence of a label that provides a strong signal (e.g., “A” or “I”), models tend to exhibit significantly higher choice-ordering bias, irrespective of model size.
Appendix D Prompt ablations
We reproduce our experiments using different prompts to query the model. The notebooks with all figures can be retrieved from Github.101010https://github.com/socialfoundations/surveying-language-models/blob/main/prompt-ablations Overall, the findings are consistent with the results presented in the paper. In the following we provide an overview over the different ablations performed.
D.1 Individual survey questions
First, we use different styles to prompt individual survey questions. We enumerate the prompt styles as (P1)-(P8).
Additional context.
We first explore whether including additional context signaling that the questions presented are from the American Community Survey, or that they are to be answered by US households. Keeping identical survey questions, we append at the start of the prompt one of the following sentences:
-
(P1)
Bellow is a question from the American Community Survey.
-
(P2)
Answer the following question from the American Community Survey.
-
(P3)
Answer the following question as if you lived at a household in the United States.
Asking questions in the second person.
We change the framing of the questions.
-
(P4)
We modify the survey questionnaire such that questions are formulated in the second person rather than the third person (e.g., “What is your sex?” instead of “What is this person’s sex?”).
Including instructions.
Following the prompt ablation of Santurkar et al. [2023], we append at the start of the prompt one of the following instructions:
-
(P5)
Please read the following multiple-choice question carefully and select ONE of the listed options.
-
(P6)
Please read the multiple-choice question below carefully and select ONE of the listed options. Here is an example of the format:\nQuestion: Question 1\nA. Option 1\nB. Option 2\nC. Option 3\nAnswer: C
Chat-style prompt.
We consider the prompt used by Durmus et al. [2023]:
-
(P7)
Human: {question}\nHere are the options:\n{options}\nAssistant: If had to select one of the options, my answer would be
Interview-style prompt.
We consider the prompt used by Argyle et al. [2022]:
-
(P8)
Interviewer: {question}\n{options}\nMe:
D.2 Sequential generation
We use different prompts to integrate a model’s previous responses when prompting subsequent survey questions. Instead of summarizing previous responses using bullet points as in Section 5, we keep previous questions and answers in-context.
Question answering.
Keeping questions and answers in-context resembles the typical few-shot Q&A setting. For instance, prompting for the third question in the questionnaire corresponds to
Question: {question 1}\n{options 1}\nAnswer:{answer 1}\n
Question: {question 2}\n{options 2}\nAnswer:{answer 2}\n
Question: {question 3}\n{options 3}\nAnswer:
Interview-style prompt.
We consider the prompting style used by Argyle et al. [2022]. For instance, prompting for the third question in the questionnaire corresponds to
Interviewer: {question 1}\n{options 1}\nMe:{answer 1}\n
Interviewer: {question 2}\n{options 2}\nMe:{answer 2}\n
Interviewer: {question 3}\n{options 3}\nMe:
Appendix E Results for ATP, GAS, WVS, and ANES surveys
We reproduce the experiments of Sections 3 and 4 using the ATP, and GAS/WVS used by Santurkar et al. [2023] and Durmus et al. [2023], where questions are presented individually of each other. We additionally reproduce the experiments of Section 5 using the 2016 ANES questionnaire considered by Argyle et al. [2022], where questions are presented in sequence. We obtain similar results to those presented in the paper. The notebooks with all figures can be retrieved from Github.111111 https://github.com/socialfoundations/surveying-language-models/blob/main/survey-ablations
E.1 ATP surveys
We obtain the ATP survey questions and their corresponding human responses from the OpinionsQA repository.121212https://github.com/tatsu-lab/opinions_qa We present all answer choices when querying the models, but exclude the answer choices corresponding to refusals from our analysis similarly to Santurkar et al. [2023]. When comparing the similarity of models’ responses to different demographic subgroups, we use the demographic subgroups and the alignment metric considered by Santurkar et al. [2023]. Note that for such alignment metric, higher values of alignment indicate that models’ responses are more similar to the reference demographic group. We find that all models are more “aligned” with the uniformly random baseline than with any of the demographic subgroups, see Figure 16.
E.2 GAS and WVS surveys
We obtain the ATP survey questions and their corresponding human responses from the GlobalOpinionsQA repository.131313https://huggingface.co/datasets/Anthropic/llm_global_opinions When comparing the similarity of models’ responses to the population-level survey responses of different countries, we use the countries and the similarity metric considered by Durmus et al. [2023]. We find that all models produce survey responses that are more similar to those of the uniformly random baseline than to those of any of the demographic subgroups, see Figure 18. Note that we do not produce a plot equivalent to Figure 5(b), since the transnational surveys only contains the survey responses of specific countries, and thus KL(model || census) is not well-defined.
E.3 ANES survey
We use questionnaire considered by Argyle et al. [2022]. We present questions in the multiple-choice format described in Section 2, using the Interviewer:, Me: prompt style of Argyle et al. [2022]. We keep all previous questions and answers in context when prompting the model to answer subsequent questions (e.g., Interviewer: What is your gender?\n Me: Female\n Interviewer: What race do you consider yourself to be?\n Me:). We retrieve the 2016 ANES data from the official website141414https://electionstudies.org/data-center/2016-time-series-study/, and process it such that it matches in form the questionnaire designed by Argyle et al. [2022]. We find that the trained classifiers can discriminate between the model-generated data and the ANES data with very high accuracy (>99%), see Figure 17.