0 \vgtccategoryResearch \authorfooter Rusheng Pan and Wei Chen are with the State Key Lab of CAD & CG, Zhejiang Unviersity, Hangzhou, Zhejiang 310058, China. E-mail: {panrusheng, chenvis}@zju.edu.cn Helen C. Purchase and Tim Dwyer are with the Department of Human-Centered Computing, Monash Unviersity, Melbourne, Victoria 3168, Australia. E-mail: {helen.purchase, tim.dwyer}@monash.edu
Extending adjacency matrices to 3D with triangles
Abstract
Social networks are the fabric of society and the subject of frequent visual analysis. Closed triads represent triangular relationships between three people in a social network and are significant for understanding inherent interconnections and influence within the network. The most common methods for representing social networks (node-link diagrams and adjacency matrices) are not optimal for understanding triangles. We propose extending the adjacency matrix form to 3D for better visualization of network triads. We design a 3D matrix reordering technique and implement an immersive interactive system to assist in visualizing and analyzing closed triads in social networks. A user study and usage scenarios demonstrate that our method provides substantial added value over node-link diagrams in improving the efficiency and accuracy of manipulating and understanding the social network triads.
keywords:
Social network visualization, immersive analysis, adjacency matrix, network triads![[Uncaptioned image]](/html/2306.07588/assets/x1.png)
Three different tasks in the context of traditional node-link (row A) and our 3D adjacency matrix with triangles (row B). A1 and B1: Compare which cluster is denser (green or blue); A2 and B2: Infer which cluster does the selected node belong to; A3 and B3: Estimate the influence [29] of the selected node.
Introduction
Social networks, such as social media platforms, transaction networks, and cooperative networks, increasingly play a vital role in society. Whilst advances in Artificial Intelligence can provide a wide range of automated tools for analysing social networks as graphs, visualisations of social networks often fail to adequately support users’ comprehension of the data. It is important that the network be presented in a manner that allows users to understand the inherent patterns intuitively and clearly, and to identify connections, clusters, and patterns [50, 1, 47]. Node-link diagrams are the most popular means of depicting social networks, where nodes represent subjects (people) and links represent the dyadic relations between two subjects. However, node-link diagrams of large-scale networks often contain severe visual clutter (e.g., a “hairball” composed of many and dense links), significantly lowering the comprehensibility of the visualisation. Another common visual network representation idiom, the adjacency matrix, eliminates the visual clutter problem. An adjacency matrix is a symmetric square matrix where each row and column corresponds to a node and binary values within cells (where rows and columns interact) indicate presence/absence of the links. The adjacency matrix is very good for clarifying edges in high edge-density graphs with proper row/column reordering, but cannot easily depict some vital sub-structures such as triads (three nodes joined in a triangle). Existing works such as MatLink [23] and NodeTrix [24] optimize the visualization of social networks by augmenting the 2D adjacency matrix interactively, but are weak in handling triangle-related tasks.
The significance of triangles (There are open and closed triads, but that the focus here in on “closed triads"") within a social network lies in their ability to facilitate a deeper comprehension of the interconnections and influence between subjects. visualising the triangles in a social network supports perception of connections and the completion of multiple interpretation tasks related to triangles. First, unlike edges which represent direct connections between two subjects, triangles depict both direct and indirect (via a common friend) relationships between two subjects. Second, the extent of influence of a subject can be accessed by counting the triangles in which it is involved [29, 37]. Finally, triangles aid in identifying the clusters of social networks in different ways, such as triangle-aware measures and triangle-based motifs [22, 41, 55, 18].
Conventional graph representations typically use a two-dimensional (2D) view and rely on flat-screen interactions. Current research provides encouraging evidence that a three-dimensional (3D) visualisation of social networks in am immersive Visual Reality (VR) environment improves users’ confidence in observing and understanding the relationships between the subjects [43] over 2D visualisation. Specifically, the 3D display of social or communication networks brings practical benefits for visual network comparison [51, 42, 2, 28]. Most efforts in visualising graph data in a 3D VR environment focus on extending the node-link diagram with depth information to edges. The problems of overlapping and visual clutter of edges can be alleviated to some degree when edges are separated using the third dimension such that they no longer cross in the same plane. However, the resulting 3D node-link diagram requires rotation interactions to observe the graph with an appropriate view, which reduces the efficiency of exploration and analysis. Moreover, highlighting triangles in a 3D node-link diagram still results in severe visual clutter due to the greater number and increased overlap of triangles when compared to edges. There is not much research on transforming 2D adjacency matrices into 3D space. Gallego et al. [17] visualise the RDF data with a 3D scatter plot of subjects, predicates and objects to provide a intuitive view of the structure and distribution of RDF statements. Bach et al. [3] design MatrixCube to visualise dynamic networks. They represent the dynamic network at each timestamp as a 2D adjacency matrix and stack the matrices in chronological order. Each 3D cell of the Matrix Cube placed at represents an edge between nodes and at timestamp . Their later work named Alignment Cubes [27] extends Matrix Cube to support the interactive exploration of multiple ontology alignments. Our work differs from their 3D adjacency matrix display of RDF data or dynamic graphs since we focus on using adjacency matrices to represent graph triangles within static social networks as well as designing the corresponding interactions. We propose extending 2D adjacency matrices into the dimension such that, for each triangle in the graph composed of node , and , the corresponding binary-valued cell at in the 3D space is set to TRUE.
This work focuses on social networks with high triangle-densities, where visualisation for exploring and understanding both global topology and detailed ego-networks can be challenging:
C1. In general, the number of triangles in a graph is significantly greater than the number of the edges. Consequently, the visual clutter caused by triangles overlapping is much more severe than that of edge crossings. visualising all the triangles clearly in a social network is nearly impossible by using conventional visualisation methods.
C2. From a fine-grained point of view, the patterns of the filtered triangles are complicated. For instance, for each node (or link), all the triangles that contain it would have individual visual patterns. Exploring and analyzing these subgroups of triangles is challenging.
C3. Social networks with high triangle-densities often contain triangle-aware hierarchies [18]. It is critical to visualise the triangles hierarchically and efficiently. Designing appropriate representations and layout methods for hierarchical representation is difficult.
To address these challenges, we propose visualising graph triangles as a 3D adjacency matrix, then implement a 3D matrix reordering algorithm based on triangle density and finally, evaluate the effectiveness of the 3D matrix representation on tasks involving triangle-rich graphs.
The rest of this paper is organized as follows. Section 1 reviews related works from three relevant aspects, and the requirements are analyzed in Section 2. Our approach is elaborated in Section 3, followed by the VR implementation in Section 4. Two usage scenarios are presented in Section 5. A user study has been conducted to evaluate the approach, as reported in Section 6. We discuss the lessons learned, generalization, significance, and limitations in Section 7. Section 8 concludes our work.
1 Related Work
This section presents the relevant studies on visualising social networks based on triangles, the application of VR techniques for graph visualisation, and matrix reordering methods.
1.1 Triangle-based visualisation of Social Networks
In the context of visualising graph triangles in social networks, the focus has mostly been on extracting triangle-based notions like -truss [10] for probing and analyzing the clique-like structures of triangle-rich complex networks. A truss is a cohesive subgraph defined by the number of triangles supporting each edge. Zhang et al. [56] define a triangle -core, which provides an efficient extraction and intuitive visualisation of clique-like structures. A -truss based community model is proposed by Huang et al. [25], which shows structural properties effectively and supports the efficient search of -truss communities. Lan et al. [33] construct a labour employment space network and extract its characteristics using social network analysis. Their results indicate that a triangular mode structure promotes the evolution of the network. Focusing on modeling complex networks, Seshadhri et al. [44] mathematically prove that low-rank representations have difficulty in capturing both connections and clusters of the triangle-rich graphs. Their study shows that most of the low-dimensional graph embedding fail to capture the triangle structures. Our work addresses the problem of visualising triangles in triangle-rich graphs. As a result, we extend the 2D adjacency matrix form (showing the presence of edges) to 3D (showing the presence of triads) so as to provide a clear and intuitive visualisation supporting understanding and analysis of triangle-related tasks.
1.2 3D Graph visualisation in VR
Benefitting from the commodification and advancements of VR in recent years, research on exploring, interacting with, and visualising 3D graphs in VR context has increased in popularity [36, 52, 48, 32, 26, 12, 8, 15, 40, 30]. Erra et al. [16] compare VR systems with traditional mouse-keyboard and joypad configurations, showing that VR enhances user engagement in graph visualisation tasks by providing an immersive and enjoyable experience, even though VR techniques are more difficult to learn than traditional ones. This raises the question as to when it is easier to see structure in a 3D VR representation of graph data when compared with 2D screen layout. The 3D VR technologies support visual comparison tasks in social networks better than 2D ones [51, 28]. The performance of 3D and 2D representation in supporting mental map related tasks are compared by [31]. Their results show that 3D enables more accurate interpretation of the network structures more accurately than 2D, while 2D outperforms 3D on spatial-memory tasks. Joos et al. [28] develop different encodings for 3D node-link diagrams to visualise two networks using a single representation. Their evaluation results indicate a potential for visual comparison of networks in VR. Our work builds on these apparent advantages of immersive network visualisation, demonstrated for visual comparison tasks in social networks, in designing a 3D adjacency matrix representation and a series of interactions for the immersive perception of social networks.
There is much prior work that focuses on exploring immersive representations and interactions for social networks [20, 7, 35, 45, 34]. VRige (Virtual Reality Immersive Graph Explorer) [13] is designed to boost the immersive analysis of social network graph in VR. It provides rich interactions for the visualisation, exploration, and tagging of social networks in 3D. NetImmerse [43] is built to visualise networks in VR, providing overview, zooming, and details on-demand, and NetImmerse has been shown to enable its users to gain accurate insights and to enhance the exploration of the multidimensional data of social networks. In our work, we focus on extracting and exploring graph triangles in social networks in VR for efficient identification and comparison of connections, clusters and patterns.
1.3 Matrix Reordering
Matrix reordering refers to the technique used to optimize the arrangement of rows and columns in a matrix (e.g., an adjacency matrix or correlation matrix) in order to reveal distinct structural patterns. A brute-force enumeration approach traverses at most permutations for rows/columns, which is infeasible for any graph with more than about 10 nodes. Several adjacency matrix reordering algorithms have been proposed for graph visualisation, each using different heuristics, for example, spectral ordering [5, 11] and hierarchical clustering [21, 14, 4]. However, there is no consensus on the most suitable reordering method for all types of graphs [6]. The worth of a reordering algorithm cannot be solely measured by computational efficiency and optimization. An appropriate reordering algorithm for a given graph needs to consider the visual structures inherent in the graph. Chen et al. [9] order the matrix rows by identifying similarities between matrix columns in sparse undirected graphs. Specifically, they compute the dense subgraphs based on edge density to yield the corresponding matrix blocks. Our work tackles the problem of visualising the triangles in triangle-rich social networks. To find a “good” order for a 3D adjacency matrix, we consider both the triangle density distribution and the triangle patterns.
2 Requirements
This work focuses on social networks with undirected, unweighted edges. We identify the following requirements for the visualisation of a graph where the focus is on revealing triangles:
-
R1:
Show all triangles with both coarse and fine granularity.
-
•
R1.1: Showing a compact and clear overview of triangles is essential. It is undesirable for triangles to occlude one another in the restricted visual space, not least because the node and link information would be hidden by the triangles.
-
•
R1.2: Details of each triangle should be provided during the exploration. The precise set of three nodes and links involved in each triangle should be apparent to support in-depth exploration and analysis of the graph.
-
R2:
Maintain the hierarchical distribution of the triangles.
-
•
R2.1: Depicting the triangles needs to consider their hierarchies within the graph. For graphs with high triangle-densities, triangles are distributed in different hierarchies, and a hierarchical layout that takes into account these hierarchies reveal the triangles more readily.
-
•
R2.2: Attaching attributes of nodes or links to triangles will support specific tasks. For instance, the clusters of some social networks are triangle-aware. By encoding the triangles with information about their node clusters, cluster-related tasks will be more efficient and intuitive to perform.
-
R3:
Provide the context of the overall graph on demand.
-
•
R3.1: The node and link information needs to be displayed alongside the triangles to support full understanding of the graph. Displaying only the triangles results in a very abstract visualisation; accompanying node and link information will allow the user to relate the triangles to a concrete representation of the graph.
-
•
R3.2: Extracting subgroups of triangles in situ from the overview is necessary. Users should be allowed to explore triangles that contain the nodes or links of interest. A consistent transition of the interaction when exploring the triangles, nodes and links is essential for maintaining users’ mental map.
3 The 3D Adjacency Matrix
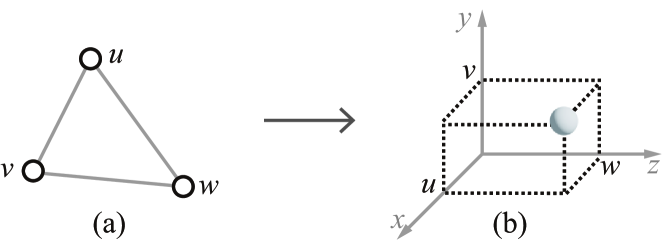
To visualise the triangles in the social networks, we extend the 2D adjacency matrix model (rows and columns) to 3D by adding a third dimension (layer). In a 2D adjacency matrix, the intersection of rows and columns denotes an edge, while in the 3D matrix, the intersection of rows, columns and layers represents a triangle. Like the 2D adjacency matrix, the order of nodes along the axes of the 3D adjacency matrix affects the quality of the visualisation. We keep each axis in the same node order and design a 3D matrix reordering algorithm by hierarchically clustering triangles.
3.1 Representing triangles in a 3D Adjacency Matrix
As for 2D adjacency matrices where the node order in rows and columns are identical, we keep the same node order for layers in the 3D adjacency matrix. The entry in a 3D adjacency matrix (where the row, the column and the layer intersect) represents a graph triangle composed of the node, the node and the node, in a triad. Figure 1 illustrate the transformations.
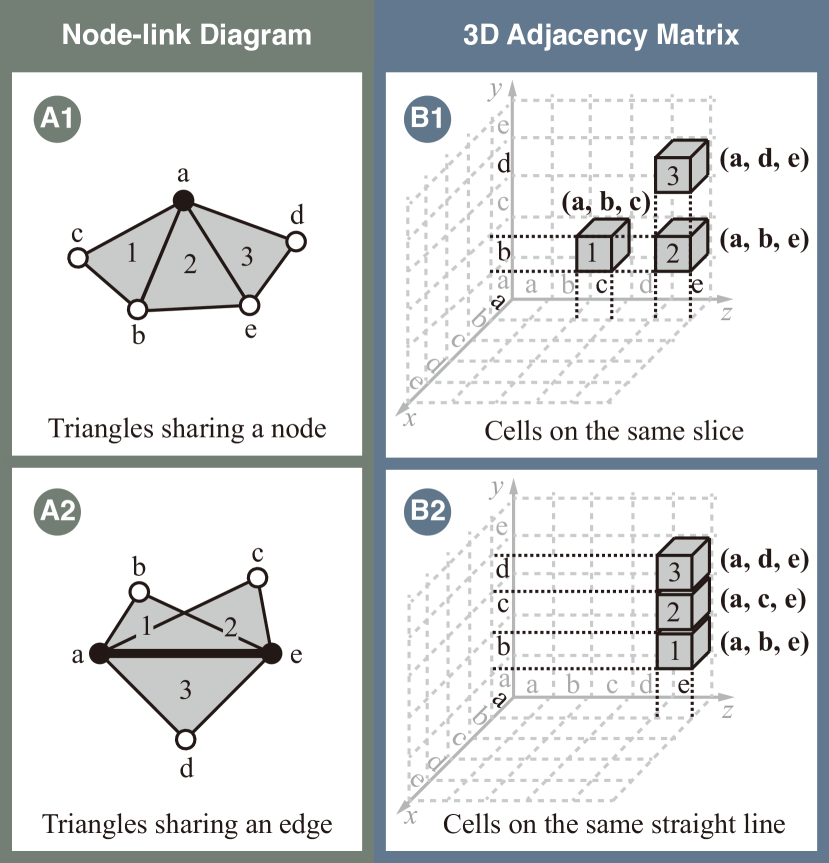
In the 2D adjacency matrix of a undirected graph, each edge is usually represented twice, making the node vectors easily readable both horizontally and vertically [6]; this results in a symmetric matrix. Even though the number of edges doubles in this case, there is no visual overlapping and the topological patterns are easy to identify. In the 3D adjacency matrix, displaying this symmetry would also make it easier to identify the triangles from each of the three axes. As shown in Fig. 2, triangles containing the same node would be placed on the same slice that is parallel to the coordinate plane of the 3D matrix; and triangles containing the same edge would be placed on the same straight line that is parallel to the coordinate axis of the 3D matrix. However, the number of all the symmetric triangles is six () times more than the number of triangles in the graph, and this results in severe visual cluttering and overlapping. We therefore only display the symmetric triangles for nodes that have been selected and do not display all symmetric triangles. The details can be found in Section 4.1.
As a result, each triangle composed of the node, the node and the node () appears only once at the coordinate (unless it is selected, in which case it would also appear at , , , , and ). The 3D adjacency matrix of graph is defined as:
| (1) |
For graphs with nodes cluster information, we define the cluster of triangles like this: if two or more nodes of a triangle share a cluster A, then the triangle belongs to cluster A. Otherwise (three nodes belong to three different clusters), these triangle belongs to cluster “Other”, whose cells are colored in grey.
3.2 Reordering
In the same way that an appropriate node order needs to be found for 2D adjacency matrices so as to reveal inherent patterns, the order of nodes along the axes in the 3D adjacency matrix affects the quality of the triangle visualisation. Our reordering algorithm is based on the principle that triangles within a dense subgraph should be close to one another. To reorder a graph with nodes, we view the 3D matrix as slices. The () slice is a matrix equals , where all the cells represents the triangles containing the node. We cluster the slices by their similarities hierarchically using a strategy based on that used by Chen and Saad [9], although while they reorder the columns by edge density, we use the triangle density [22] to reorder the slices.
To compare the similarities between slices, we first transform the 3D adjacency matrix to a symmetric one :
| (2) |
Then we calculate the similarities between each slice. The similarity matrix is defined as a 2D adjacency matrix with each element at calculated by the cosine similarity between the and slice:
| (3) |
We employ the triangle density of graph G defined in [22], which is:
| (4) |
where is the number of triangles in , and is the number of wedges (a two-hop path) in .
Using the similarities between each pair of slices, we can yield the dense subgraphs recursively based on triangle density, where each subgraph has a triangle density greater than a minimum threshold. We rank these subgraphs in descending order of the number of node and output the indices of the nodes in sequence as the new order. We then reorder the rows, columns and layers using this new ordering. The algorithm details are shown in Algorithm 1.
4 Implementation in VR
We implement our 3D adjacency matrix in VR, thus providing a true 3D visualisation for complete exploration. Although other alternatives like a 3D projection in 2D view is usable, the advantage of our original and novel technique could be limited more or less.
4.1 User Exploration
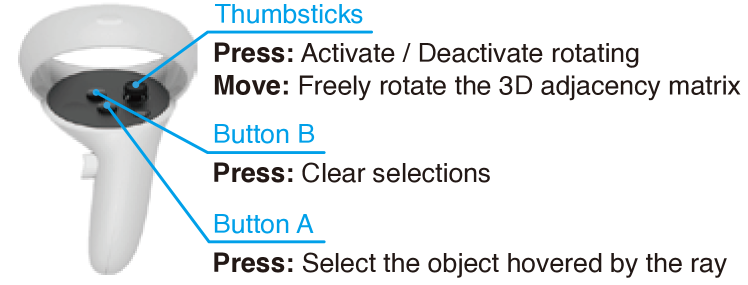
The interactions supported by the controller are illustrated in Fig. 3. To begin with, users are allowed to freely rotate the 3D adjacency matrix by moving the thumbsticks to find an appropriate angle to observe triangle clusters or different triangle patterns during the 3D exploration. Taking advantage of the head tracking facility, users can zoom into (out of) the view by walking closer (further away).
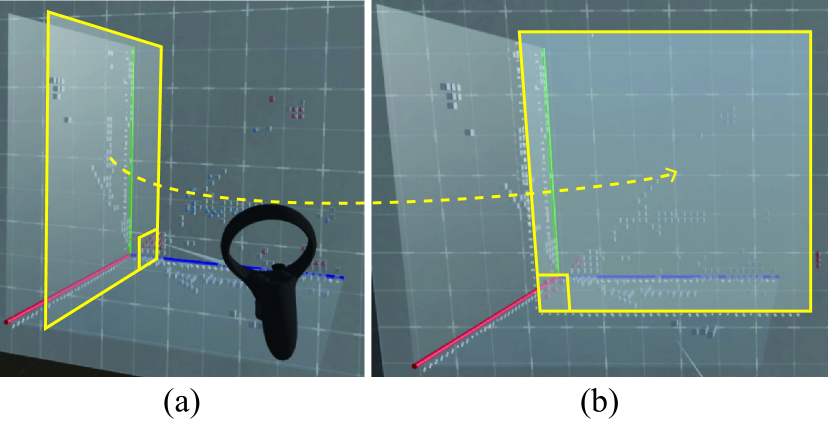
As shown in Fig. 4, the user can select any cell (representing a triangle connecting the nodes , and ) in the 3D adjacency matrix (see Fig. 4 (a)). This action will reveal a slice perpendicular to the axis (the intersection would be (0,0,)); this slice is rotated in front of the user (see Fig. 4 (b)). All the triangles containing the th node are plotted on this 2D adjacency matrix slice.
Finally, showing the node-link diagram alongside the 3D adjacency matrix is important for users to select nodes of interest and observe the corresponding triangles in the 3D adjacency matrix. When users select a node in the node-link diagram, all its adjacent links and the supporting triangles (including the nodes) are highlighted, while the other nodes and links are faded. In addition, the relevant triangles are highlighted in the 3D adjacency matrix, and the adjacent links are highlighted as the projection of cells on the axis planes.
4.2 Implementation
The 3D adjacency matrix and its interactions are developed with Unity 3D. The 3D matrix reordering algorithm and all the interactions are programmed in C#. The layout of the node-link diagram is yielded from the Python networkx library. All the interactions are implemented based on the Meta Quest 2 Headset and controllers to provide an fully immersive and 3D experience for users’ exploration of the 3D matrix.
5 Usage Scenario
We describe two usage scenarios of our 3D adjacency matrix to present to value of graph triangles and the benefits of visualising triangles with the 3D matrix. The first case focuses on identifying various patterns of triangles in a typical social network, and the second one illustrates how our approach enable the effective exploration of complex social networks by clearly visualising triangles. For a more intuitive understanding of these immersive analytics cases, please refer to the video demos attached in the supplemental materials.
5.1 Identify the triangle patterns
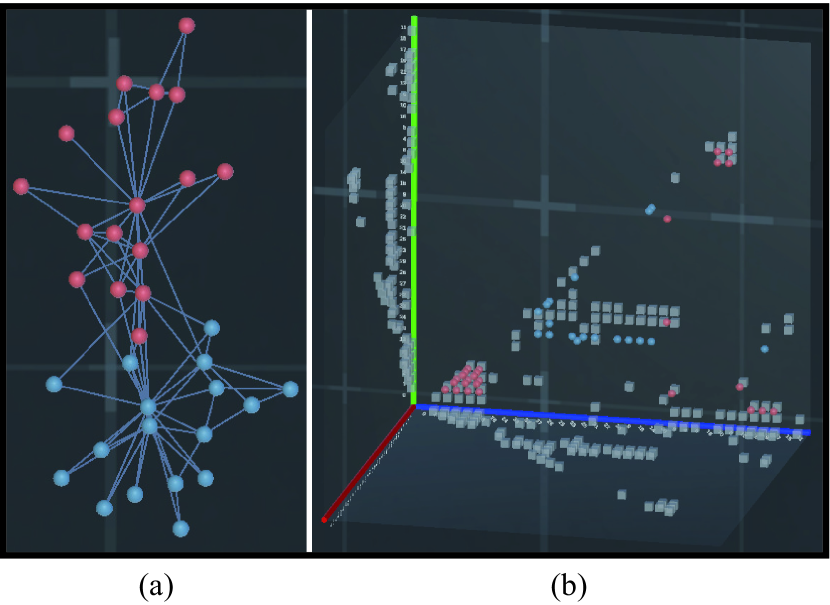
A male novice of social science wants to explore the Karate Club [54] social network, containing 34 nodes, 78 edges, and 45 triangles. This social network is composed of social ties among the members from two university karate clubs (colored in red and blue) collected by Zachary. He is interested in the difference between structures of the two clubs. He first observes the node-link diagram in Fig. 5 (a). Two clusters contain a similar number of nodes and have a similar edge density. It is not that easy to identify the difference between characteristics of the clusters.
When he turns to the 3D adjacency matrix in Fig. 5 (b), the two clusters show obviously different characteristics. The triangles within the red cluster are divided into three parts (most on the left bottom, a few on the right bottom, and a few on the right top). The distribution shows that there are three subgroups within the red cluster. The triangles gathering on the left bottom compose the densest subgroup, which locates in the bottom of the red cluster shown in Fig. 5 (a). For the blue cluster, most of its triangles are placed on a straight line that parallels to the axis (the blue axis). He moves near to zoom in and rotates the 3D matrix to confirm the observation. It means that these triangles share the same edge (or two nodes). To sum up, with the help of our 3D adjacency matrix, he learns that the two clubs are different in their subgroup composition. The red club contains one large and dense subgroup and two small subgroups; while the blue club are basically centered with two central nodes.
5.2 Understanding complex clusters with triangles
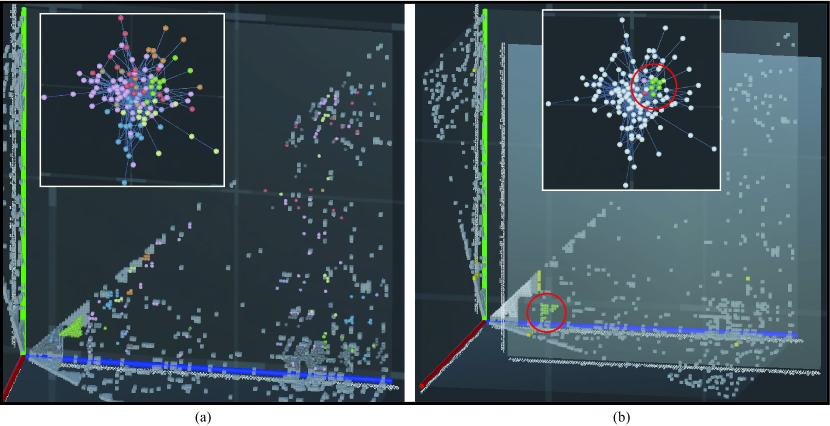
Another female user is analyzing a email social network EuAll Email (125 nodes, 482 edges, and 698 triangles), whose nodes represent members of a European research institution, edges represent communication between institution members, and clusters of nodes indicate the department of each the member. As shown in the node-link diagram of Fig. 6 (a), the clusters look like a “hairball” where the connections and the density of them can hardly be seen clearly. By visualising the triangles of these clusters, she finds that the green cluster are the densest one, with almost all the green triangle cells gathering together. The pink and blue cluster look dense in the node-link diagram but there are only a few triangle cells of them. The cells distributed in multiple different areas indicates many subgroups exist in the pink and blue cluster. She notices that there are many grey triangle cells which are composed of three nodes from different clusters. These frequent email communications between three or more departments represent that the research institution have many interdisciplinary collaboration or projects.
Then she focuses on the estimating the influence of some individual members (e.g., node 98). A spreader node is influential if it is highly connected and its one-hop neighbors are also well connected [29]. It is useful to count triangles supporting the node to identify how many pairs of its neighbours are connected. After she selects the node 98 in the node-link diagram, its one-hop ego network is highlighted (circled in a red border in the node-link diagram of Fig. 6 (b)). However, it is difficult the make out the triangles in the subgraph, because the links are too dense to distinguish. By selecting the slice containing node 98, the slice with all the supporting triangle cells (in the red-border circle at the left bottom of Fig. 6 (b)) rotates to her front. It is much easier for her to estimate the triangles because each cell represents a different triangle. This way, she keeps exploring other nodes and gains an intuitive perception of their strength of influences, which is significant for understanding the communication flow and key spreader nodes of the social network.
6 Evaluation
We conducted a user study to evaluate our novel approach to visualising triangles using a 3D matrix. We anticipate that the 3D adjacency matrix visualisation provides substantial added value over node-link diagrams in improving the efficiency and accuracy of performing triangle-related tasks in social networks. We compare two conditions: the baseline with the node-link diagram with force layout alone (NL), and the node-link diagram along with 3D adjacency matrix (NL+Cube). To measure the added value, we used a within-subjects design, where each participant is required to use NL fist and then NL+Cube. Each condition includes three types of tasks: graph-level, cluster-level, and node-level. A questionnaire collected participants’ demographic information, rating for various aspects of the visualisation, and qualitative comments. Each participant’s task answer and response time were automatically recorded.
| Stage | Dataset | Condition | Task Sequence for Each Group | |||||
|---|---|---|---|---|---|---|---|---|
| G1 | G2 | G3 | G4 | G5 | G6 | |||
| Train | Karate Club #Nodes: 34 , #Edges 78 , #Triangles: 45 | NL | S1 = [T1, T2, T3] | S2 | S3 | S4 | S5 | S6 |
| NL+Cube | S2 = [T2, T1, T3] | S3 | S4 | S5 | S6 | S1 | ||
| Test | American Football #Nodes: 115, #Edges: 613, #Triangles: 810 | NL | S3 = [T2, T3, T1] | S4 | S5 | S6 | S1 | S2 |
| NL+Cube | S4 = [T3, T2, T1] | S5 | S6 | S1 | S2 | S3 | ||
| EuAll Email #Nodes: 125, #Edges: 482, #Triangles: 698 | NL | S5 = [T3, T1, T2] | S6 | S1 | S2 | S3 | S4 | |
| NL+Cube | S6 = [T1, T3, T2] | S1 | S2 | S3 | S4 | S5 | ||
6.1 Participants
We recruited 12 participants (P1-P12, average age of 31 (), 5 females and 7 males) from the laboratory of the local University. They have an average of 4 () years of experience in Visual Analysis. Three of them are experienced research fellows with more than eight years of research experience in Immersive Analysis, and the others are graduate students who study Network visualisation or Human-Computer Interaction. The complexity of the 3D matrix and the novel conceptualisation of how graphs might be visualised meant that it was important that our participants were not visualisation novices.
6.2 Set up
To evaluate the added value of our 3D adjacency matrix over the node-link diagram, we designed a virtual 2D node-link version in the immersive environment as the baseline, where the encoding of and interactions with the node-link diagram are the same as for the 3D adjacency matrix (except for 3D rotation). The reason for embedding the 2D node-link diagram into a 3D world in VR is to ensure the fairness for comparison purposes, especially considering the difference between interaction time. Moreover, we choose the 2D layout of node-link diagram instead of the 3D layout, because the 2D layout is quite more typical and commonly used than the 3D layout.
6.3 Tasks
Our work focuses on visualising graph triangles in triangle-rich social networks. To evaluate the exploration and understanding of the network with both coarse and fine granularity, we consulted domain experts from social science and designed the following three tasks:
T1 (R1.1, R2.1). Graph-level: Given a graph visualisation with ground-truth clustering and two clusters highlighted, which cluster is denser? The task focuses on the graph as a whole and requires an effective perception of the densities of different clusters [49]. A cluster is dense if the nodes within the cluster have many connections to one another, and relatively few connections to nodes outside the cluster. The participant needs to compare the two clusters by exploring the one-hop ego network of each node in the node-link diagram and the distribution of triangles in the 3D adjacency marix, respectively.
T2 (R2.2, R3.1). Cluster-level: Given a graph visualisation with ground-truth clustering, clusters shown in different colours but with the cluster for one node not revealed, which cluster does the node belong to? This task comes from the classical “cocktail problems” [46], which focuses on identifying a dense subgraph that contains the given query node if the query node is densely connected with this dense subgraph. The participant is required to observe the adjacent links and triangles of the query node through its one-hop ego network, and find a dense subgraph containing it. The dense subgraph cluster is identified as the cluster that the query node belongs to.
T3 (R1.2, R3.2). Node-level: Given a graph visualisation with two nodes highlighted, which node is more influential? A node is influential if it is highly connected and its neighbors are also well connected [29]. This task is significant for optimizing the allocation of resources and improving the communication efficiency in social networks [38]. As a result, the task of finding a most influential spreader node is important. Note that each connection between the neighbours forms a triangle containing the spreader node. Thus, the defined influence of a spreader node can be visually perceived by aggregating the count of its adjacency links and the supporting triangles of it in its one-hop ego network. In this task, the participant is asked to select the most influential node by comparing the related links and triangles.
The participants performed these tasks under the two conditions on three different social network datasets. The details of each dataset are described in Section 6.4. All the graph datasets are undirected, unweighted real-world graphs with ground-truth cluster memberships for the nodes. Each node belongs to exactly one cluster. To avoid introducing bias into the responses to the tasks, we anonymize the graph attributes by replacing the name of the dataset, the node labels and the clusters with random indices. That way, the participants could focus on the topological structures of the graphs themselves (rather than their real-world context).
6.4 Procedure
Before the study, we introduced the research problem to the participants, collected their demographic information, and obtain their consent to observe their behaviors during the study. To reduce the performance variation caused by a learning curve (performance-attempt times, typically a logarithmic trend line) [39] during the formal tasks, we first asked the participants to complete the three tasks on a training dataset, a small graph Karate Club [54], as described in Section 5.1. The participants are asked to wear the VR headset and take the controller before training, and are trained under the both conditions. During the training process, we instruct the participants to use the system by demonstrating how to explore the graph to answer the tasks by means of various interactions. The answers to each task would be provided as references during the training. The total number of tasks per participant during the training is 1 dataset 2 conditions 3 task types 6.
After the training stage, each participant performs two rounds of tests. Each test comprises the three tasks on a different dataset first under condition C1 and then under condition C2. The fist test uses the American Football [19] dataset (115 nodes, 613 edges, and 810 triangles), whose nodes represent US college football teams, edges represent the games between two teams, and clusters of nodes indicate which conference the teams belong to. The second one uses the EuAll Email [53] dataset, as described in Section 5.2.
For each dataset, the answers for same task type under different conditions are different. To avoid the learning effect, the sequence of tasks under each condition was randomised for each participant. The six conditions correspond to six sequences of the three tasks, respectively. To ensure the same difficulty, the answers to all the tasks are completely the same for each participant. To avoid the sequential effects of the tasks and the variance of the participants, we adopt a 6 6 Latin Square to allocate the tasks. Following the rule of Latin Square, the 12 participants are divided into six groups. Each group contains 2 participants and takes a column of task sequence in the Latin Square. G1 contains P1 and P7, G2 contains P2 and P8, and so on. The detailed task sequences for the six groups are indicated in Table 1. The participant’s answers and the time taken to respond on on each task was recorded. The total number of responses per participant in the tests is 2 test datasets 2 conditions 3 task types 12.
| Q1 | The representation is easy to understand. |
| Q2 | The representation displays triangles clearly. |
| Q3 | The representation helps me effectively explore triangles. |
| Q4 | The interactions are easy to learn. |
| Q5 | The interactions are easy to use. |
| Q6 | The interactions are useful. |
| Q7 | The visual design is intuitive. |
| Q8 | The visual design is good-looking. |
| Q9 | I am willing to use the design again. |
| Q10 | I am confident in the responses to the tasks. |
After the two rounds of tests were finished, the participants provided subjective ratings using a questionnaire designed to collect feedback on our representations, interactions and the system design. Ten questions (as listed in Table 2) in five-point Likert scales were presented, with opinions denoted by 1 - strongly disagree, 2 - disagree, 3 - neutral, 4 - agree, and 5 - strongly agree, respectively. The user’s behaviors and feedback (including verbal comments) during the procedure are collected and noted by experimenter observation. The duration of the study for each participant was approximately 50 minutes. Each participant was rewarded with a $20 eGift Card on completion of the experiment.
6.5 Results and Analysis
We first quantitatively compare the results of the accuracy and time consumption between NL+Cube and NL, before analysis of the questionnaire, individual feedback and user behavior.
6.5.1 Task Completion Quality
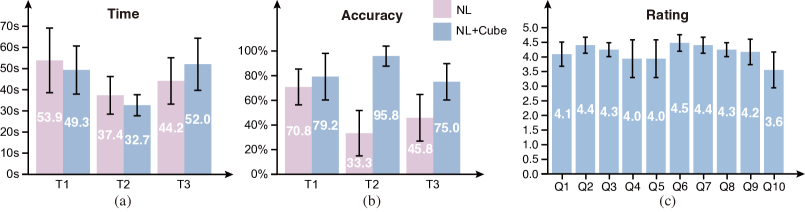
We use the paired samples t-test to analyse the differences in response time and accuracy between the two conditions. The p-values of the results are presented in Table 3. The average performance of the accuracy and time consumption and their 95% confidence intervals are plotted in Fig. 7 (a) and (b).
| P-value | T1 | T2 | T3 |
|---|---|---|---|
| Accuracy | 0.501 | <0.001 | 0.026 |
| Time | 0.645 | 0.377 | 0.361 |
There are no significant differences between the two conditions for response time; we therefore do not need to consider any time-accuracy trade-off, and can focus on the accuracy data.
A highly statistically significant difference of for T2 task accuracy is observed between NL+Cube () and NL (), with the p-value of T2 accuracy equaling 0.000004 (<0.001). The average accuracy of T2 using NL+Cube is 62.5% higher than NL as presented in Fig. 7 (b). Meanwhile, the p-value of T2 response time is 0.377 () indicating no significant difference between NL+Cube () and NL () , although we note that the the NL+Cube condition takes s less on average (see Fig. 7 (a)). These results suggest that the clear representation of triangles in the 3D adjacency matrix and the use of efficient and effective interactions means that users are able to identify the “cocktail problems” (T2) accurately and quickly.
The p-value of T3 accuracy is 0.026 (<0.05), which indicates a statistically significant difference between NL+Cube () and NL (). The average accuracy of T3 using NL+Cube is 29.2% higher than NL (see Fig. 7 (b)). Although the p-value of T3 for response time is 0.361 (), which indicate no significant difference between NL+Cube () and NL (), we note that (as shown in Fig. 7 (a)), the NL+Cube condition takes s longer on average. In T3, users were required to count the triangles and the links of the two spreader nodes to compare their influence. Even though the 3D adjacency matrix makes it easier to observe the distribution and the number of triangles, it takes longer time for users than in NL, where the highlighted triangles are simply too cluttered to count. To sum up, the 3D adjacency matrix significantly improves the accuracy for identifying the details of triangles (T3).
As for T1, the p-values of both accuracy (0.501>0.05) and time (0.645>0.05) show no significant differences between the two conditions. As illustrated in Fig. 7 (a) and (b), the accuracy and response time of T1 using NL+Cube are both greater than in the NL condition, with the accuracy 8.4% higher and response time 4.6s less. This result indicates that the 3D adjacency matrix might help with comparing the densities of different clusters (T1) more accurately and efficiently by providing the density distribution of triangles, but no significant differences are detected.
Overall, the results suggest that the density distribution of triangles (overview) and the context information (detail) are represented clearly in the 3D adjacency matrix, thus improving task the accuracy without efficiency trade off: the time taken to complete the tasks through comparing, identifying and analysing the visualisations at different levels is similar.
6.5.2 Ratings of Questionnaire
Our questionnaire focuses on the use of the NL+Cube condition and covers three aspects: the representation, the interactions and the system design. Our analysis of the quantitative data is supplemented with information from the post-experiment interview and experimenter observations.
Representation (Q1-Q3). All the participants apart from P11 agreed that the representation of graph triangles using a 3D adjacency matrix was easy to understand (Q1, 3 strongly agree and 8 agree). P11 has no prior experience with 2D adjacency matrices and so it was difficult for them to interpret a 3D one. All the participants agreed that the representation displays triangles clearly (Q2, 5 strongly agree and 7 agree) and helps with the exploration and identification of triangles (Q3, 3 strongly agree and 9 agree).
Interactions (Q4-Q6). 10/12 of the participants agreed that the interactions are easy to learn (Q4, 5 strongly agree and 5 agree) and to use (Q5, 5 strongly agree and 5 agree). Participants who disagreed with Q4 gave reasons such as issues relating specifically to the VR environment (P4) or the lack of experience in adjacency matrices (P11). However, P11 agreed Q5 that the interactions were easy to learn once she had learned the representation after the training. All the participants agreed that interactions are useful (Q6, 6 strongly agree and 6 agree).
System design (Q7-Q10). All of the participants agreed that the visual design is intuitive (Q7, 5 strongly agree and 7 agree) and good-looking (Q8, 3 strongly agree and 9 agree). All the participants except for P4 were willing to use the design again (Q9, 4 strongly agree and 7 agree), and P4 explained that this was because they were unused to the VR environment and VR-based interactions. When asked whether they are confident in the responses to the tasks (Q10), 3/4 of the participants agreed (1 strongly agree and 8 agree). The other participants all acknowledged that although they are not entirely confident in the responses with 3D adjacency matrix, they are more confident than when using NL alone.
6.5.3 User Feedback
At the end of the experiment participants were asked to provide written feedback. While some of the comments related to the nature of the immersive environment (e.g. “the VR glass could be lighter” (P7)), several participants recognised how the 3D-matrix facilitates a novel and useful way of looking at graphs; for example “interesting new design and I can see where this additional visualisation (3D matrix) is needed.” (P3) As for all novel visualisation methods, some participants found it slightly difficult to learn at first, but they acknowledged that once they had learned how to “interpret the axes” (P11), they felt more comfortable. Several participants particularly commented on the usefulness of the 3D-matrix for the third task (determining which node is has more influence), reinforcing the fact that this triangle-based representation supports important social network analysis tasks. One participant particularly valued this alternative approach to graph visualisation: “I like the representation, I’ve found it very neat and intuitive. It changes my perspective of network data.” (P12)
6.5.4 User Behaviors
We observed each user and collected their verbal comments and questions during the study. Most participants appeared to relax when they changed from the NL to the NL+Cube condition; we speculate that this was because they felt it would be easier to finish the tasks. As a result, in the NL+Cube condition, they tended to look more at the 3D adjacency matrix for intuitive patterns, and at the node link diagram as a navigation and reference for selecting the nodes involved in the task.
As for the interactions provided in the 3D adjacency matrix, most of the participants used 3D adjacency matrix rotation more often than expanding the slices to quickly identify the triangle patterns for coarse-grained perception. Some of them preferred expanding the slices of their nodes of interest to explore details by analyzing all the triangle containing it. Due to the reason that they focus more on the details, they sometimes lose the focus on the tasks and spend more time than the other participants.
7 Discussion
In this section, we summarize the significance of our contributions, analyze lessons learned from our trials, and reflect on the limitations and potential future work.
7.1 Significance
To the bast of our knowledge, we are the first to propose a 3D Cube to visualise network triangles. The Cube can be viewed as an extension of the 2D adjacency matrix approach. With an extra dimension, each cell in the 3D adjacency matrix represents a triangle instead of an individual edge, as is the case 2D adjacency matrices. This representation shares the advantage of 2D adjacency matrix views, as compared to node-link diagrams where multiple edges can overlap or cross in the same plane, in that cells are strictly non-overlapping. In a 3-way symmetric representation, triangle cells are so dense that no viewing angle can guarantee that all cells can be seen without occlusion; we therefore hide the symmetric representation of triangles. Symmetric triangles, like the symmetric edges of the 2D adjacency matrix, make it easier to show some topological patterns; the number of symmetric triangle cells is six times the number of actual triangles in the graph and so depicting them makes for a very dense representation. By contrast, the number of the symmetric edge cells in 2D adjacency matrices is two times the number of edges. Consequently, if we remove the symmetric triangles and only display triangle cells in a subspace of the 3D cube such that , each graph triangle is represented by exactly one cell and the occlusion of triangles is considerably reduced. However, without displaying symmetric triangles, some triangle patterns within the graph are less easy to identify. For instance, triangles containing the same node are not on the same plane. When we only plot triangle cells in the subspace , the triangles are dispersed on multiple planes. To restore such patterns, we design an interaction of extracting a slice containing a selected node and adding the full set of symmetric triangles associated with that node. Combined with rotation interactions and head tracking, users are able to explore triangles in the 3D adjacency matrix intuitively.
Next, there are various principles which have been applied to compute the reordering of the node rows and columns of 2D adjacency matrices, which may also be transferable to 3D triangle matrices. In a 2D adjacency matrix, each cell represents an edge between the nodes associated with the cell’s row and column. Reordering algorithms order both rows and columns symmetrically so only a single axis needs to be considered. Similarly, we apply the 3D reordering algorithm by focusing on one of the axes (row, column or layer). Each axis is the matrix of a node and represents all the triangles supporting that node. As a result, just as when we reorder a 2D adjacency matrix, we are reordering vectors of edges; in the triangle matrix we are reordering matrices of triangles to find a better order of nodes. Since our work focuses on social networks with triangle-sensitive clusters, we employ the triangle density to reorder the nodes. In the resulting arrangement, connected triangle cells are close to one another supporting cluster-related tasks.
Finally, we evaluated the 3D adjacency matrix (Cube) by comparing it with the 2D node-link diagrams (NL). Our initial investigations revealed that it was extremely difficult to solve complex tasks using the Cube alone; where therefore compared NL versus NL+Cube to assess the extent of added value provided by the Cube, looking for differences in accuracy and efficiency. The interactions and encoding provided for both conditions are the same except that only the Cube supports rotating. This does not introduce any unreasonable bias against the NL condition because there is no need to rotate a 2D node-link diagram. The results show significant differences on two of the three tasks between NL and NL+Cube, where the NL+Cube performs better. The benefits appear to be derived from the clear visualisation of triangles in the 3D adjacency matrix, and the useful and efficient interactions. Although no significant differences are detected between the response time of two conditions. The average time of NL+Cube is less than NL for two of the three.
7.2 Lessons learned
Initially, we drew triangle cells at every possible place in the 3D adjacency matrix. Consequently, each triangle appeared at six different coordinates. Although the patterns of such triangles are easy to interpret, there are too many redundant triangle cells overlapping the important ones especially for triangle-rich graphs, leading to excessive occlusion. Moreover, displaying all the the symmetric triangle cells makes it hard for users to precisely perceive the number of triangles in the graph. As a result, we restrict the space of the 3D matrix to display each graph triangle with only one triangle cell. The optimized result has much less clutter.
Our original implementation contained only the 3D adjacency matrix. Although the triangle cells are easy to interpret, without a node-link diagram, it is difficult to imagine the whole network context of the triangles. The 2D adjacency matrix has a similar restriction, however, as a representation that is more familiar to most people it may be less of a problem. To solve this problem, we combine the familiarity advantage of the node-link diagram with our 3D adjacency matrix view of triangles. Our experiment results indicate that this hybrid approach does provide significant added value in different types of tasks.
7.3 Limitations and Future Work
Our work has three potential limitations that can be addressed in future work. First, in the current implementation, the user needs to use a controller for precise selection of the objects of interest among a mass of other objects. This is effective for most of users, but we acknowledge that replacing the selection interaction from controller ray to direct hand grabbing and gestures would be easier and more intuitive for users to learn and operate. For instance, users could use specific gestures instead of walking around to zoom in and out the 3D matrix to freely explore the visualisation from various scales. In this work, we first propose the representation of 3D adjacency matrix extended from the standard 2D adjacency matrix approach to show triangles, and we focus on exploring and evaluating the effectiveness of this representation and the relevant necessary interactions. We acknowledge that there might be effective 2D alternatives that don’t involve 6DOF navigation in VR. In future work, we would consider designing a greater variety of interactions to improve the user’s experience of triangle cells visualisation and make more attempts on other 2D alternatives including 3D projections. Second, although our method clearly and intuitively visualises triangles themselves and the triangle density of clusters, it does not have the characteristic of force-directed layout of node-link diagrams where the distances between clusters can suggest their similarity or the strength of connections between them. That is, the spatial distance between clusters in the 3D adjacency matrix in no way indicates their similarity. In our practical hybrid approach, we try to alleviate this shortcoming by showing the node-link diagram is alongside the 3D matrix, such that both triangles and distance information of clusters are conveyed in the same scene. In future work, we will consider the requirement to improve our 3D adjacency matrix reordering algorithm. Last but not least, the evolution of triangles (e.g., the dynamic transition between open triads and closed triads) are important and well researched in social science. This work focuses visualising closed triads in static social networks as 3D adjacency matrix cells, which lays the foundation for visualising open triads and the evolution of open and closed ones using the 3D adjacency matrix in future work, for example, using animation, or an adjacent sequence of 3D matrices. Towards a larger space of fields and problems, we expect our work could inspire the broader communities in visualization and VR to explore more extensions from lower dimensions, thus excavating the huge potential of spatial computing.
8 Conclusion
Focusing on visualising triangles in social networks, we identify and summarize the challenges of identifying triangle relationships in large dense social networks. This paper presents a new representation by extending the 2D adjacency matrix to a 3D triangle matrix. A 2D cell which denotes an edge evolves to a 3D cell that represents a triangle. The 3D triangle matrix representation is uncluttered and intuitive for exploring and understanding triangle-rich clusters, triangle patterns and one-hop ego networks in social networks. We implement a VR system to provide immersive interaction with the graph triangles. Two usage scenarios are introduced to illustrate that visualising triangles is important and is useful when understanding and exploring social networks. Three different types of tasks focusing on graph-level, cluster-level and node-level are considered to evaluate the effectiveness of our method. Specifically, we compare a Node-Link diagram alone, and Node-Link+Cube hybrid and find that the Cube adds value over Node-Link alone. In the future, we plan to improve the reordering algorithm to adapt to multiple tasks, support hand gesture recognition to enrich our interactions, and generalize our methods to adapt to the dynamic social networks.
References
- [1] R. Akula and I. Garibay. Viztract: Visualization of complex social networks for easy user perception. Big Data Cogn. Comput., 3(1):17, 2019.
- [2] B. Bach, P. Dragicevic, D. Archambault, C. Hurter, and S. Carpendale. A descriptive framework for temporal data visualizations based on generalized space-time cubes. 36(6):36–61, 2017.
- [3] B. Bach, E. Pietriga, and J. Fekete. Visualizing dynamic networks with matrix cubes. In Proceedings of ACM Conference on Human Factors in Computing Systems, pp. 877–886, 2014.
- [4] Z. Bar-Joseph, D. K. Gifford, and T. S. Jaakkola. Fast optimal leaf ordering for hierarchical clustering. Bioinformatics, 17(suppl_1):S22–S29, 2001.
- [5] S. T. Barnard, A. Pothen, and H. D. Simon. A spectral algorithm for envelope reduction of sparse matrices. Numerical Linear Algebra with Applications, 2(4):317–334, 1995.
- [6] M. Behrisch, B. Bach, N. H. Riche, T. Schreck, and J. Fekete. Matrix reordering methods for table and network visualization. Computer Graphics Forum, 35(3):693–716, 2016.
- [7] S. V. Broucke and N. Deligiannis. Visualization of real-time heterogeneous smart city data using virtual reality. In Proceedings of IEEE International Smart Cities Conference, pp. 685–690, 2019.
- [8] N. Capece, U. Erra, and J. Grippa. Graphvr: A virtual reality tool for the exploration of graphs with htc vive system. In Proceedings of International Conference Information Visualisation, pp. 448–453, 2018.
- [9] J. Chen and Y. Saad. Dense subgraph extraction with application to community detection. IEEE Transactions on Knowledge and Data Engineering, 24(7):1216–1230, 2012.
- [10] J. Cohen. Trusses: Cohesive subgraphs for social network analysis. National security agency technical report, 16(3.1), 2008.
- [11] C. H. Q. Ding and X. He. Linearized cluster assignment via spectral ordering. In Proceedings of International Conference on Machine Learning, p. 30, 2004.
- [12] A. Drogemuller, A. Cunningham, J. Walsh, M. Cordeil, W. Ross, and B. Thomas. Evaluating navigation techniques for 3d graph visualizations in virtual reality. In Proceedings of International Symposium on Big Data Visual and Immersive Analytics, pp. 1–10, 2018.
- [13] A. Drogemuller, A. Cunningham, J. Walsh, W. Ross, and B. H. Thomas. Vrige: exploring social network interactions in immersive virtual environments. In Proceedings of the International Symposium on Big Data Visual Analytics, pp. 1–6, 2017.
- [14] M. B. Eisen, P. T. Spellman, P. O. Brown, and D. Botstein. Cluster analysis and display of genome-wide expression patterns. Proceedings of the National Academy of Sciences, 95(25):14863–14868, 1998.
- [15] U. Erra, D. Malandrino, and L. Pepe. Virtual reality interfaces for interacting with three-dimensional graphs. International Journal of Human–Computer Interaction, 35(1):75–88, 2019.
- [16] U. Erra, D. Malandrino, and L. Pepe. Virtual reality interfaces for interacting with three-dimensional graphs. International Journal of Human-Computer Interaction, 35(1):75–88, 2019.
- [17] M. A. Gallego, J. D. Fernández, M. A. Martínez-Prieto, and P. de la Fuente. Rdf visualization using a three-dimensional adjacency matrix. In Proceedings of the International Semantic Search Workshop, vol. 29, 2011.
- [18] Y. Gao, X. Yu, and H. Zhang. Graph clustering using triangle-aware measures in large networks. Information Science, 584:618–632, 2022.
- [19] M. Girvan and M. E. Newman. Community structure in social and biological networks. Proceedings of the national academy of sciences, 99(12):7821–7826, 2002.
- [20] N. Greffard, F. Picarougne, and P. Kuntz. Immersive dynamic visualization of interactions in a social network. In Proceedings of the Conference of the Gesellschaft für Klassifikation e. V., Karlsruhe, pp. 255–262, 2012.
- [21] G. Gunnar and W. Howard. Two additions to hierarchical cluster analysis. British Journal of Mathematical and Statistical Psychology, 25(2):200–206, 1972.
- [22] R. Gupta, T. Roughgarden, and C. Seshadhri. Decompositions of triangle-dense graphs. SIAM Journal on Computing, 45(2):197–215, 2016.
- [23] N. Henry and J. Fekete. Matlink: Enhanced matrix visualization for analyzing social networks. In INTERACT, pp. 288–302, 2007.
- [24] N. Henry, J. Fekete, and M. J. McGuffin. Nodetrix: a hybrid visualization of social networks. IEEE Trans. Vis. Comput. Graph., 13(6):1302–1309, 2007.
- [25] X. Huang, H. Cheng, L. Qin, W. Tian, and J. X. Yu. Querying k-truss community in large and dynamic graphs. In Proceedings of ACM Special Interest Group on Management of Data, pp. 1311–1322, 2014.
- [26] Y.-J. Huang, T. Fujiwara, Y.-X. Lin, W.-C. Lin, and K.-L. Ma. A gesture system for graph visualization in virtual reality environments. In Proceedings of IEEE Pacific Visualization Symposium, pp. 41–45, 2017.
- [27] V. Ivanova, B. Bach, E. Pietriga, and P. Lambrix. Alignment cubes: Towards interactive visual exploration and evaluation of multiple ontology alignments. In Proceedings of International Semantic Web Conference, pp. 400–417, 2017.
- [28] L. Joos, S. Jaeger-Honz, F. Schreiber, D. A. Keim, and K. Klein. Visual comparison of networks in VR. IEEE Transactions on Visualization and Computer Graphics, 28(11):3651–3661, 2022.
- [29] M. Kitsak, L. K. Gallos, S. Havlin, F. Liljeros, L. Muchnik, H. E. Stanley, and H. A. Makse. Identification of influential spreaders in complex networks. Nature Physics, 6(11):888–893, 2010.
- [30] G. Kortemeyer. Virtual-reality graph visualization based on fruchterman-reingold using unity and steamvr. Information Visualization, 21(2):143–152, 2022.
- [31] J. Kotlarek, O. Kwon, K. Ma, P. Eades, A. Kerren, K. Klein, and F. Schreiber. A study of mental maps in immersive network visualization. In Proceedings of IEEE Pacific Visualization Symposium, pp. 1–10, 2020.
- [32] O.-H. Kwon, C. Muelder, K. Lee, and K.-L. Ma. Spherical layout and rendering methods for immersive graph visualization. In Proceedings of IEEE Pacific Visualization Symposium, pp. 63–67, 2015.
- [33] L. Lu, S. Yin, F. Wen, and Q. Xu. The spatial structure of labour force employment in china’s industries: Measurement and extraction. Economic Analysis and Policy, 77:472–486, 2023.
- [34] A. Mallavarapu, L. Lyons, and S. Uzzo. Exploring the utility of social-network-derived collaborative opportunity temperature readings for informing design and research of large-group immersive learning environments. Journal of learning analytics, 9(1):53–76, 2022.
- [35] L. Nisiotis and L. Alboul. Work-in-progress—converging virtual reality, robots, and social networks to support immersive learning. In Proceedings of the International Conference of the Immersive Learning Research Network, pp. 308–311, 2020.
- [36] G. Parker, G. Franck, and C. Ware. Visualization of large nested graphs in 3d: Navigation and interaction. Journal of Visual Languages & Computing, 9(3):299–317, 1998.
- [37] R. Pastor-Satorras and A. Vespignani. Epidemic spreading in scale-free networks. Physical Review Letters, 86(14):3200–3203, 2001.
- [38] R. Pastor-Satorras and A. Vespignani. Epidemic spreading in scale-free networks. Physical review letters, 86(14):3200, 2001.
- [39] C. Perlich. Learning curves in machine learning. In Encyclopedia of Machine Learning and Data Mining, pp. 708–711. 2017.
- [40] S. Pirch, F. Müller, E. Iofinova, J. Pazmandi, C. V. Hütter, M. Chiettini, C. Sin, K. Boztug, I. Podkosova, H. Kaufmann, et al. The vrnetzer platform enables interactive network analysis in virtual reality. Nature communications, 12(1):2432, 2021.
- [41] M. Rezvani, W. Liang, C. Liu, and J. X. Yu. Efficient detection of overlapping communities using asymmetric triangle cuts. IEEE Transactions on Knowledge and Data Engineering, 30(11):2093–2105, 2018.
- [42] T. Schneider, Y. Tymchuk, R. Salgado, and A. Bergel. Cuboidmatrix: Exploring dynamic structural connections in software components using space-time cube. In Proceedings of IEEE working conference on software visualization, pp. 116–125, 2016.
- [43] K. Schröder, S. Kohl, and B. Ajdadilish. Netimmerse - evaluating user experience in immersive network exploration. In Proceedings of International Conference on Human-Computer Interaction, pp. 391–403, 2022.
- [44] C. Seshadhri, A. Sharma, A. Stolman, and A. Goel. The impossibility of low-rank representations for triangle-rich complex networks. Proceedings of the National Academy of Sciences, 117(11):5631–5637, 2020.
- [45] J. Sorger, A. Arleo, P. Kán, W. Knecht, and M. Waldner. Egocentric network exploration for immersive analytics. 40(7):241–252, 2021.
- [46] M. Sozio and A. Gionis. The community-search problem and how to plan a successful cocktail party. In Proceedings of ACM SIGKDD Conference on Knowledge Discovery and Data Mining, pp. 939–948, 2010.
- [47] S. Tabassum, J. Gama, P. J. Azevedo, M. Cordeiro, C. Martins, and A. Martins. Social network analytics and visualization: Dynamic topic-based influence analysis in evolving micro-blogs. Expert Syst. J. Knowl. Eng., 40(5), 2023.
- [48] B. H. Thomas, M. Marner, R. T. Smith, N. A. M. Elsayed, S. Von Itzstein, K. Klein, M. Adcock, P. Eades, A. Irlitti, J. Zucco, et al. Spatial augmented reality—a tool for 3d data visualization. In Proceedings of IEEE VIS international workshop on 3DVis, pp. 45–50, 2014.
- [49] C. E. Tsourakakis. A novel approach to finding near-cliques: The triangle-densest subgraph problem. CoRR, abs/1405.1477, 2014.
- [50] K. Verspoor, B. Ofoghi, and M. R. Granda. Commviz: Visualization of semantic patterns in large social communication networks. Inf. Vis., 17(1):66–88, 2018.
- [51] C. Ware and P. Mitchell. Visualizing graphs in three dimensions. ACM Transactions on Applied Perception, 5(1):2:1–2:15, 2008.
- [52] Y. Yang, E. S. Wurtele, C. Cruz-Neira, and J. A. Dickerson. Hierarchical visualization of metabolic networks using virtual reality. In Proceedings of ACM international conference on Virtual reality continuum and its applications, pp. 377–381, 2006.
- [53] H. Yin, A. R. Benson, J. Leskovec, and D. F. Gleich. Local higher-order graph clustering. In Proceedings of ACM SIGKDD Conference on Knowledge Discovery and Data Mining, pp. 555–564, 2017.
- [54] W. W. Zachary. An information flow model for conflict and fission in small groups. Journal of Anthropological Research, 33(4):452–473, 1977.
- [55] T. Zhang, L. Sun, and C. Bu. Community detection via a triangle and edge combination conductance partitioning. Journal of Statistical Mechanics: Theory and Experiment, 2020(7):073405, 2020.
- [56] Y. Zhang and S. Parthasarathy. Extracting analyzing and visualizing triangle k-core motifs within networks. In Proceedings of IEEE International Conference on Data Engineering, pp. 1049–1060, 2012.
Appendix A About Appendices
Refer to LABEL:sec:appendices_inst for instructions regarding appendices.
Appendix B Troubleshooting
B.1 ifpdf error
If you receive compilation errors along the lines of Package ifpdf Error: Name clash, \ifpdf is already defined then please add a new line \let\ifpdf\relax right after the \documentclass[journal]{vgtc} call.
Note that your error is due to packages you use that define \ifpdf which is obsolete (the result is that \ifpdf is defined twice); these packages should be changed to use ifpdf package instead.
B.2 pdfendlink error
Occasionally (for some LaTeX distributions) this hyper-linked bibTeX style may lead to compilation errors (pdfendlink ended up in different nesting level ...) if a reference entry is broken across two pages (due to a bug in hyperref).
In this case, make sure you have the latest version of the hyperref package (i.e. update your LaTeX installation/packages) or, alternatively, revert back to \bibliographystyle{abbrv-doi} (at the expense of removing hyperlinks from the bibliography) and try \bibliographystyle{abbrv-doi-hyperref} again after some more editing.