]Stanford University
]Stanford University
]UC San Diego
]Stanford University
]Stanford University
Democratizing LEO Satellite Network Measurement
Abstract.
Low Earth Orbit (LEO) satellite networks are quickly gaining traction with promises of impressively low latency, high bandwidth, and global reach. However, the research community knows relatively little about their operation and performance in practice. The obscurity is largely due to the high barrier of entry for measuring LEO networks, which requires deploying specialized hardware or recruiting large numbers of satellite Internet customers. In this paper, we introduce HitchHiking, a methodology that democratizes global visibility into LEO satellite networks. HitchHiking builds on the observation that Internet-exposed services that use LEO Internet can reveal satellite network architecture and performance, bypassing the need for specialized hardware. We evaluate HitchHiking against ground truth measurements and prior methods, showing that it provides more coverage and accuracy. With HitchHiking, we complete the largest study to date of Starlink network latency, measuring over 2,400 users across 13 countries. We uncover unexpected patterns in latency that surface how LEO routing is more complex than previously understood. Finally, we conclude with recommendations for future research on LEO networks.
1. Introduction
Low Earth Orbit (LEO) satellite networks promise to decrease latency and increase Internet coverage beyond the means of terrestrial Internet. Used by at least 2 million people as of September 2023 (SpaceX, 2023), LEO networks have proven immensely useful in natural disaster areas (nat, 2022), underprivileged schools (und, 2022), war zones (ukr, 2023), and remote research labs (rem, 2023). To improve Internet access for those that rely on LEO networks, researchers have begun to propose improvements to their latency (Bhattacharjee et al., 2023), routing (Bhosale et al., 2023; Wang et al., 2023), and security (Giuliari et al., 2021).
Unfortunately, researchers today face a barrier when understanding how LEO networks operate in practice: to collect real data, one must acquire expensive specialized satellite hardware or recruit volunteers that use the satellite network. Consequently, the community’s study of LEO networks has been limited to a small number of vantage points (Kassem et al., 2022; rip, 2010; Michel et al., 2022a; Ma et al., 2022) and unvalidated theoretical models (Kassing et al., 2020; Giuliari et al., 2021; Bhosale et al., 2023; Wang et al., 2023; Bhattacharjee et al., 2023). If researchers plan to help design and protect LEO networks, it behooves us to lower the barrier to acquiring data, such that we have an accurate understanding of how the worldwide LEO network ecosystem works in practice.
In this paper, we introduce HitchHiking, a methodology to actively measure LEO satellite network characteristics at scale. HitchHiking builds on the key insight that probing publicly exposed devices on LEO satellite networks can reveal characteristics of the underlying satellite network. Crucially, the HitchHiking methodology requires no specialized hardware or painstaking recruitment, lowering the barrier to collect real data from LEO networks worldwide. HitchHiking works in three steps (1) find measurable endpoints that use LEO satellites for Internet connectivity, (2) identify where in the network path LEO satellites are used, and (3) measure (i.e., “hitchhike”) the satellite link.
We use HitchHiking to conduct the largest LEO network measurement to date—measuring the latency of 2.4K LEO satellite customers across 13 countries—of Starlink (sta, 2023b), the largest LEO network. We show that HitchHiking collects nearly identical latency data compared to the ground truth observed by a physical Starlink dish. We then use HitchHiking’s measurement—and validation by Starlink—to surface the three primary ways in which Starlink’s network does not operate as prior work assumed. First, sustained peaks of latency are not due to changes in satellite location. Second, customer latency is bounded by the availability of a nearby Point of Presence (POP). Third, the use of inter-satellite links significantly increases routing path lengths and latency.
Our work illustrates that a diverse set of perspectives are needed to understand the unique routing and latency properties of LEO networks. For researchers interested in studying LEO networks, the HitchHiking methodology we introduce provides accessibility to those desiring experiment flexibility and coverage when collecting real data. To lower the barrier for future LEO research, we are releasing the HitchHiking pipeline for measuring Starlink latency and the data HitchHiking collects under the Apache 2.0 license.
2. Background
Satellite Internet has existed for over 20 years (ani, 2004). However, early Internet-providing satellites were large, expensive, and geostationary (i.e., fixed with respect to a position on the Earth). Geosynchronous equatorial orbit (GEO) satellites orbit over 22,000 miles from earth. While this long distance brings wide coverage, it comes at the expense of latency. Even today, the minimum round trip time (RTT) for a packet to route through a GEO satellite is 480 ms, physically bounded by the speed of light. In response to lower latency requirements—and cheaper satellite technology—a new class of satellite networks emerged: Low Earth Orbit (LEO) satellite networks.
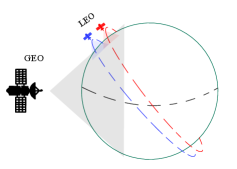
LEO satellite networks are comprised of hundreds to thousands of satellites that orbit 180 to 1,300 miles from Earth. LEO satellites’ closer distance provides significantly lower theoretical latency (10 ms RTT), at the cost of reduced coverage and a non-geostationary orbit (Figure 1). The non-geostationary orbit and closer distance causes LEO satellites to travel at tens of thousands of miles per hour, orbiting the earth every 90 minutes. LEO satellite mobility is unique relative to other mobile networks (e.g., cellular, drones), because distances are longer and velocities are higher. Further, the core infrastructure of the network is constantly in motion, but theoretically predictable.
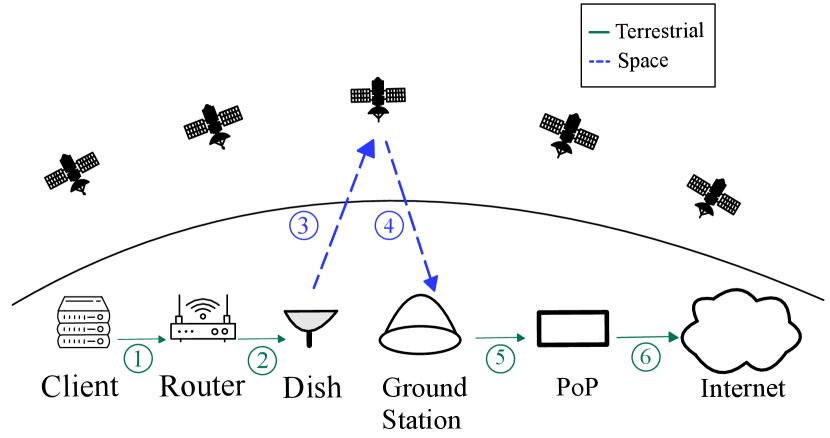
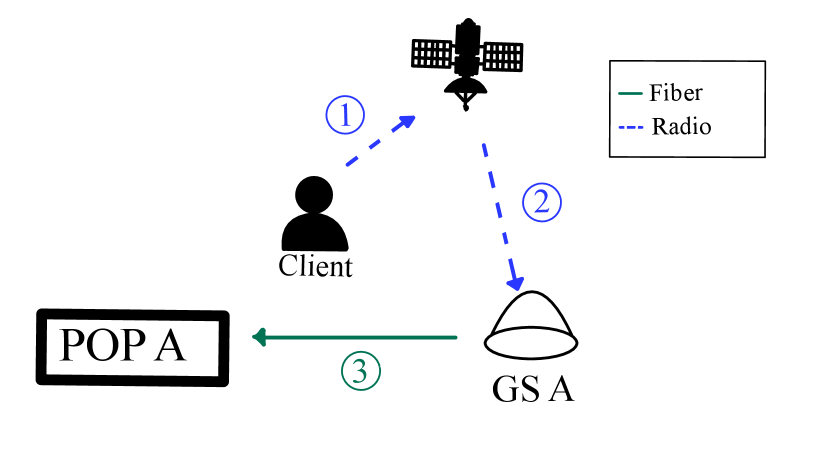
The most basic, and widely deployed (one, 2012; Wang et al., 2021), LEO architecture follow a “bent pipe” routing scheme (Figure 2). Packet routing works as follows:
-
(1)
A client sends a packet to its router
-
(2)
The router forwards the packet to a physical dish
-
(3)
The dish sends the packet via radio to a passing satellite
-
(4)
The satellite relays the packet to a ground station
-
(5)
The ground station forwards the packet to the provider’s Point of Presence (POP), which is often located at an Internet Exchange Point and plays the equivalent role of a home gateway in mobile networks (Mandalari et al., 2018)
-
(6)
The packet is routed from the POP onto the Internet
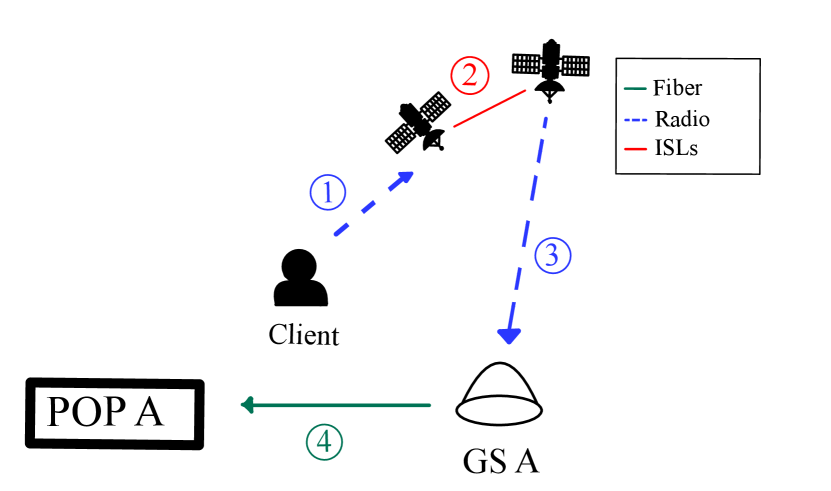
Some newer satellite architectures (sta, 2023b) are equipped with Inter-Satellite Links (ISLs), which allow satellites to relay packets to each other in space until a ground station is in view. ISL deployment provides coverage to clients in extreme remote locations (e.g., in oceans) that are in view of a satellite (e.g., within 600 miles), but not a ground station. ISLs send packets at the speed of light by using lasers in space, thereby surpassing the performance of optical fiber (Chaudhry and Yanikomeroglu, 2022).
As of 2023, Starlink (Satariano et al., 2023) remains the only consumer-targeted LEO satellite network. Starlink operates satellites with and without ISL capabilities (Musk, 2022). Other operational LEO satellites that target businesses include Oneweb (one, 2012), a network that caters towards enterprises that are located near the earth’s poles (e.g., fishing companies in Alaska). Amazon’s Project Kuiper (kui, 2023) and Telesat (tel, 2023) are expected to deploy LEO satellites for consumer-targeted Internet in the future.
3. Related Work
Three primary methods have been introduced for studying LEO satellite networks: (1) buying and deploying one’s own specialized hardware (i.e., a dish) to connect to satellite Internet, capturing real data but providing little coverage; (2) recruiting others with existing hardware, providing greater coverage at the cost of increased labor; or (3) using theoretical models, providing the most coverage but no real data. Unfortunately, these methods face an inherent trade-off between collecting real data, coverage of vantage points, labor, and monetary cost. We detail each method below:
Deploying Physical Hardware. To measure LEO satellite networks, researchers often buy and travel with specialized hardware (i.e., a satellite dish). Michel et al. (Michel et al., 2022a) deploy a satellite dish in Belgium to collect data about a single user’s perceived Starlink latency. Ma et al. (Ma et al., 2022) travel with four dishes around Canada to study Starlink latency across remote locations under different loads. Wang et al. (Wang et al., 2021) deploy a constellation of satellites—Tiansuan Constellation—to act as an open research platform in space.
Relying on physical hardware presents a financial and coverage barrier to researchers: hardware costs between $500 (sta, 2014)–$23K (one, 2023), while monthly subscriptions cost upwards of $100. To achieve world-wide coverage of LEO-accessible locations, one must travel with their hardware. Furthermore, the majority of the world’s population does not reside in a geographic location that qualifies for LEO satellite Internet subscriptions (sta, 2023c).
Recruiting Existing Hardware. To collect data on LEO networks with a wider coverage of users and geographic locations, researchers often recruit existing LEO customers. Kassem et al. (Kassem et al., 2022) build browser extensions and recruit 18 Starlink users world-wide to study browser performance under Starlink connectivity. RIPE Atlas (rip, 2010) has sent hardware (i.e., probes) to over 58 Starlink users across 13 countries, which can be used to run a variety of prescribed measurements.
Recruiting participants and maintaining data collection mechanisms (e.g., building extensions, sending hardware) creates a labor-consuming bottleneck for researchers and produces only limited geographic coverage. Further, relying solely on existing data collecting mechanisms often does not provide the data researchers need. For example, RIPE Atlas measurements can only be conducted at minimum intervals of 60 seconds, which is too coarse to detect significant network fluctuations (Section 6.1.2).
Theoretical Models. Given the difficulties in collecting empirical data, one of the most popular methodologies for studying LEO satellite networks is to use theoretical physics-based models, which simulate LEO Internet performance across location, satellite orbiting pattern, and congestion level. The most popular LEO simulators include Hypatia (Kassing et al., 2020), Starlink.sx (Puchol, 2021), and SatelliteMap.space (sat, 2023a). The flexibility of these tools—and theoretical physics in general—has allowed researchers to simulate how LEO networks are affected by different congestion control algorithms (Kassing et al., 2020), DDoS attacks (Giuliari et al., 2021), route variability (Bhosale et al., 2023; Wang et al., 2023), ISL deployment (Bhattacharjee et al., 2023), etc.
However, the accuracy of most popular simulations (Kassing et al., 2020; Puchol, 2021; sat, 2023a) has never been verified. The most recent LEO simulator published in NSDI 2023, StarryNet (Lai et al., 2023), does not evaluate latency predictions beyond the 90th percentile latency and is 20 times less accurate at predicting 90th percentile latency compared to 70th percentile latency. Notably, our work shows that simulations are non-trivial to configure and do not always accurately model the architecture and the satellite–ground station selection process of the deployed LEO satellite networks (Section 6.1.2).
Measuring Links. We apply a decades-old observation—network characteristics can be remotely measured—to a new domain: LEO satellites. For example, in 1993 and 2006, Traceroute (Malkin, 1993) and Paris-Traceroute (Augustin et al., 2006) showed how routers could illuminate an arbitrary network path. In 1999, Downey et al. introduced PathChar, a methodology for estimating latency and bandwidth between two arbitrary router hops (Downey, 1999). The same year Savage introduced Sting (Savage et al., 1999), a system for calculating packet loss rates across asymmetric routes. Notably, LEO satellite routing introduces a new source of non-deterministic delay (i.e., moving satellites) that existing tools primarily attribute to (stationary) router queuing-delay. Throughout our work, we illustrate the new challenges and implications that LEO satellites surface when measuring network characteristics.
Inter-Satellite Links. Prior work has perceived ISL’s minimal latency as an opportunity to decrease latency and provide more direct routing paths (Bhattacherjee and Singla, 2019; Bhattacherjee et al., 2018; Bhattacherjee et al., 2020), and has assumed Starlink does the same (Kassing et al., 2020; Michel et al., 2022b). Proposed LEO attacks (Giuliari et al., 2021) and routing recommendations (Bhosale et al., 2023; Wang et al., 2023) also assumed ISLs correlate with low latency and direct routing. However, we will show that prior work has overlooked a stark reality: while ISLs likely do minimize user to ground station routing, they significantly increase the length of the routing path. Thus, customers who rely on ISLs may experience some of the highest latency and most indirect routing paths.
4. LEO HitchHiking Overview
In this section, we present an overview of LEO HitchHiking, a general methodology to measure LEO satellite network characteristics at scale. HitchHiking builds on the key insight that probing publicly exposed satellite-routed devices can reveal the underlying satellite network architecture and performance characteristics. In contrast to previously used “inside-out” methodologies (i.e., connecting a measurement instrument to a satellite dish), which require physical access to privileged vantage points, the “outside-in” HitchHiking methodology requires no specialized hardware or painstaking recruitment. HitchHiking can measure wherever satellite clients are already located across the globe.
Broadly, HitchHiking consists of three steps: (1) identify publicly accessible endpoints (e.g., servers, routers) that transit LEO satellites for connectivity; (2) isolate where in the network path LEO satellites are used; and finally (3) craft an experiment to measure a desired characteristic (e.g., latency or availability) of the satellite link. In this section, we describe the general methodology. Then, in Section 5, we describe an implementation of HitchHiking specific to the Starlink LEO network and how it can be used to measure LEO latency.
4.1. Finding Satellite-Routed Endpoints
In the first step, HitchHiking needs to identify publicly reachable endpoints that transit a LEO satellite link and are, ideally, geographically distributed. To that end, HitchHiking must first identify networks (e.g., autonomous systems or IP blocks) that house LEO-routed services. Today, there exists only one commercial LEO network that sells to individual consumers: SpaceX-Starlink. However, within coming years, AWS Kuiper, Telesat and OneWeb, are also expected to deploy consumer-oriented satellite services.
Once a network is identified, HitchHiking must find all Internet-exposed services that are hosted on the network. Example services may include those that a customer wants to maintain remote access to, including customer-exposed router administration portals or web servers. Notably, a service hosted within the address space of a LEO network does not immediately mean it transits a satellite link. For instance, LEO-network backbone equipment that routes traffic between a ground station and a POP, while within the LEO network’s IP address space, does not necessarily traverse a satellite link. Additionally, performance enhancement proxies (PEPs) are common in satellite routing as they decrease latency and increase reliability of networks by relying on proxies (Pavur et al., 2021), caches (Thibaud et al., 2018), or back-up non-LEO networks (pep, 2022). While helpful to customers, PEPs add confounding factors to measuring LEO links. Thus, HitchHiking must filter for services that are likely using just a LEO-satellite for routing.
4.2. Isolating Satellite Links
In the second step, after filtering for end-points that rely on LEO satellites, HitchHiking must identify satellite-based network hops. HitchHiking requires that enough of the routing path be visible to an external scanner, such that enough terrestrial routing artifact can be removed to make meaningful inferences. At a minimum, HitchHiking must (1) identify the hop before a satellite path is taken (i.e., hop 16 from Figure 3), and (2) identify the hop after the satellite path is taken (i.e., hop 18 from Figure 3).
4.3. Conducting An Experiment
In the third step, having identified the satellite links in LEO satellite networks, HitchHiking can then be used to run measurement experiments. Many existing strategies for measuring characteristics of networking links (e.g., (Savage et al., 1999; Downey, 1999)) can be applied.
For example, to measure LEO satellite outages due to a customer’s location or obstruction (e.g., a seagull lands on a dish), a researcher might do the following for all exposed LEO services in the same geographic area: (1) send a ping to the router before the satellite link (“terrestrial-hop” router); (2) send a ping to the customer IP after the satellite link (“exposed-service” router); (3) label potential outages as when exposed-service router pings are dropped, but terrestrial-hop router pings are not dropped, for an extended amount of time; and (4) compare outages with neighboring exposed services, to determine if the outages are network-wide or customer-specific.
As another example, to measure LEO satellite bandwidth, a researcher might use the pathchar (Downey, 1999) approach, where packets of increasing size sent to both the hop before and after the satellite link can be used to estimate the satellite link’s bandwidth without flooding the link.
In this paper, we focus on measuring latency in the Starlink network.
4.4. Ethical Considerations
HitchHiking relies on Internet-exposed services to measure LEO satellite links. For the measurements in this paper, we follow the best practices outlined by Durumeric et al. (Durumeric et al., 2013), including configuring the scanner’s IP to re-direct to an informative page that easily allows end-users to opt out of scans. We received no requests to opt out. We present HitchHiking to Starlink’s engineering team and do not receive any reproach.
HitchHiking is not the first to use the presence of exposed devices to measure Internet behavior. For example, researchers have tracked software patching behavior (Durumeric et al., 2014) and measured the impact of natural disasters (Durumeric et al., 2013) using exposed services. HitchHiking can also use application layer data, such as TLS certificates, to identify owners of a service. HitchHiking’s use of application layer data remains consistent with the ethical standards followed by the community (Izhikevich et al., 2021; Akiwate et al., 2022; Gigis et al., 2021).
However, much like at the onset of Internet-wide scanning, we need to establish guardrails for the use of exposed satellite-based services for performing experiments. For example, LEO satellite links often operate at lower capacity than terrestrial links (Michel et al., 2022b). It is imperative that HitchHiking experiments do not degrade the quality of service for users by, for example, flooding LEO satellite links. We recommend researchers send the minimum number of packets needed to collect statistics about a LEO link, and avoid using tools that overload bandwidth (e.g., iperf (Graham, 2008)).
5. HitchHiking Starlink to Measure Latency
In this section, we present an implemention of HitchHiking to measure the latency of the only commercially available consumer-targeted LEO network: Starlink. Tracking network latency is particularly interesting in the LEO satellite setting, as LEO satellite mobility is expected to induce uniquely predictable and dynamic changes in routing paths (Kassing et al., 2020). We measure latency by continually sending TTL limited pings on hitchhiked LEO links and collecting their round trip time.
We run a daily automated HitchHiking pipeline to measure latency with the following steps:
1. Collect Exposed Services To find measurable LEO-hosted Starlink services, we collect IPv4 and IPv6 exposed services in the Starlink network (AS 14593) using Censys (Durumeric et al., 2015), a public Internet device search engine. We note that researchers could also perform their own scans using tools like ZMap (Durumeric et al., 2013), Masscan (Graham, 2014), LZR (Izhikevich et al., 2021), and GPS (Izhikevich et al., 2022).
2. Filter for Customer Endpoints. To measure only services that likely use a LEO-satellite for routing, we filter for services that belong to customer endpoints. To measure Starlink customer services, we include only IP addresses whose DNS PTR record follow the Starlink customer format: customer.[location].pop.starlinkisp.net. There exist thousands of customer-exposed services in Starlink. For example, on May 10, 2023,111All experiments in this section use data collected on May 10, 2023. we identify a total 4,521 exposed services across 2,051 unique IPs (hosts), 857 unique ports, and 47 application layer protocols in the Starlink network. After filtering for customer endpoints, 1,790 unique IPs remain.
3. Exclude PEPs. We filter for performance enhancement proxies by automatically filtering IPs hosting a TLS certificate that belong to the most popular PEP within the Starlink network: Peplink, a PEP that combines 5G connectivity with Starlink. Filtering for Peplink removes 9% of all services (1,629 IPs remain). We manually analyze other TLS certificates and exposed services and do not find other identifiable PEPs.
4. Geolocate Services. To obtain an approximate geographic location of a Starlink service, we use Starlink’s IP Geolocation feed (sta, 2023d). Additionally, to identify the location of the customer’s assigned POP, we (1) query the PTR record (e.g., customer.atlagax1.pop.starlinkisp.net) associated with each host IP, (2) use the geographic location specified in the domain name (e.g., atlagax) to map the POP to a geographic location (e.g., Atlanta, Georgia) (Reddit, 2021). Often, the geolocation of a customer is not the same as the geolocation of a customer’s POP, since most cities do not have a Starlink POP.
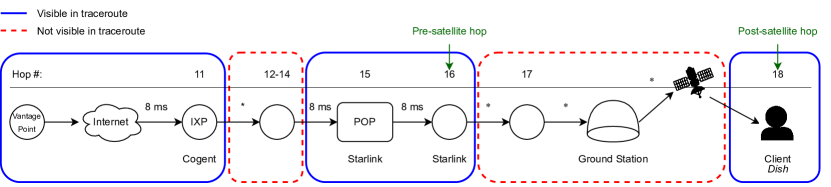
5. Identify Last Visible Pre-Satellite Hop. We measure the satellite link using an “outside-in” perspective. In Figure 3, we show the output of running a traceroute222We experiment with many different traceroute tools in Appendix B. from Stanford to an exposed Starlink service located in San Diego that we control.333To connect to our dish from an external server, we (1) configure the Starlink router to run on “bypass” mode, (2) connect our own router, (3) configure our router to respond to pings, (4) identify the public IP address Starlink has assigned to us, and (5) ping our Starlink IP address (i.e., our router) from the external server.. The outside-in traceroute identifies the second-to-last hop (Hop 16) as the occurring right before the satellite link. Note, the hop immediately before the exposed service (Hop 17) is not visible. In Appendix B.1, we use an internal network perspective to show that there is negligible RTT difference between the routers responsible for Hop 16 and 17.
6. Identify First Visible Post-Satellite Hop. The last responsive hop in the traceroute is typically the first, and only, visible post-satellite hop. Notably, while the link between the last visible pre-satellite hop and the first visible post-satellite hop includes the satellite link, it also includes the terrestrial pathway between the POP and the ground station. In Section 6, we show how our measurement technique filters much of the terrestrial routing outside of Starlink’s network.
7. Measure Path Latency. We measure path latency for 5 minutes sending two ICMP pings every second with the following additional configuration: (1) with a TTL equal to the terrestrial-hop-router-hop number and (2) with a TTL equal to the exposed-service hop number. Notably, only one probe traverses the satellite link during each measurement, thereby minimizing ethical concerns. In Appendix B and Appendix C, we show how sending TTL-specific pings increases coverage by an order of magnitude compared to TCP, UDP, and non-TTL specific pings.
8. Isolate Satellite Link Latency. We subtract the terrestrial-hop router RTT from the exposed-service router RTT, to measure the satellite link and minimize terrestrial artifacts.
9. Filter for Non-LEO Satellite Artifacts. We apply a smoothing filter with a window size of 15 seconds (the time-step with which Starlink dishes stay connected to a satellite, before determining whether to switch connections (sta, 2021)) to our timeseries of collected measurements, to eliminate short-lived artifacts (Section 6.1). Fortuitously, routers (one of the most popular hosts of exposed services) must be physically connected to a satellite dish using Ethernet (sta, 2023e), thereby additionally minimizing potential Wi-Fi artifact. At least one-third of customer-exposed Starlink services belong to a vendor that produces routers and firewall appliances, with the two most poular being Fortinet and Sonicwall.
10. Validating Incomplete Visibility While HitchHiking lowers the barrier for identifying LEO satellite routing in the wild, it does not have complete visibility of all satellite routing. When measuring Starlink, HitchHiking cannot identify exactly what routing occurs between the POP and the client, does not know how many satellites, which satellites, and which ground stations packets are routed through. To understand if the incomplete visibility is still sufficient, in the next section, we validate HitchHiking with physical equipment. Critically, we find that HitchHiking’s lack of visibility is not a limitation of HitchHiking; even Starlink customers with physical equipment have near identical visibility into Starlink’s routing. In spite of this incomplete visibility, in Section 7, we demonstrate how HitchHiking’s global perspective helps build informed inferences that illuminate previously undisclosed routing patterns.
Overall, the HitchHiking pipeline is designed to be quickly adaptable to new users and geographic locations. Since LEO network architecture changes nearly everyday due to new satellite launches (SpaceX, [n. d.]), satellite falls (wsj, 2022), the integration of inter-satelllite lasers (Foust, 2021), and new ground stations (Swinhoe, 2023), adaptability is crucial. The HitchHiking pipeline, which is open sourced under the Apache 2.0 licence, along with the data it collects, can be found at https://github.com/stanford-esrg/LEO˙HitchHiking.
6. Evaluation
In this section, we evaluate the accuracy and coverage of HitchHiking on the Starlink network. First, we show that HitchHiking accurately measures satellite link latency relative to ground truth, capturing 100% of all sustained latency spikes. Second, we compare HitchHiking’s accuracy with the most popular LEO-network simulator and show that HitchHiking is up to 80% more accurate. Third, we demonstrate HitchHiking’s expansive coverage of LEO satellite links, which spans 13 countries and contains 28 times more measurable links than other methods.
6.1. Comparison with Ground Truth
To obtain ground truth about a client’s LEO network latency, we deploy our own residential generation 2.0 Starlink444Starlink is the only commercially available LEO-provider that sells to individuals, and therefore the only network that easily provides ground truth. dish in San Diego. To make our LEO link “hitchhikeable,” we (1) turn on router ping by bypassing the Starlink router with our own Asus RT-N66U router (Starlink generation 2.0 routers do not allow for port forwarding or respond to ICMP probes), and (2) configure our router to advertise the Starlink-provided public IPv6 address.
We also collect Starlink provided metrics from our dish every second, including the reported “POP ping latency,” packet drop, and estimated bandwidth usage. The POP ping latency is the ground truth RTT of a ping from our dish to the assigned POP. The POP ping latency is the most granular provided metric of LEO latency; it includes terrestrial latency to and from the ground station. Starlink metrics do not reveal which ground station or satellite the dish is connected to (nel, 2021). However, we use a novel side-channel in our Starlink dish, the obstruction map, which in real time records the location of a successful satellite connection. We describe in Appendix D our side-channel methodology.
6.1.1. HitchHiking
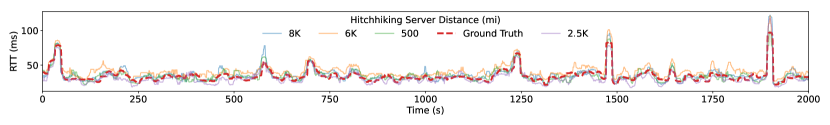
We compare HitchHiking measured latency to ground truth. To evaluate HitchHiking under different distances from San Diego, we run HitchHiking from four geographic locations: Australia, Brazil, California (US), and Virgina (US). Each location is 500–8,000 miles away from our dish. All HitchHiking pipelines run at the same time on May 12, 2023. We note the presence of clear skies and no physical obstructions, and thus minimal interference during our experiment.
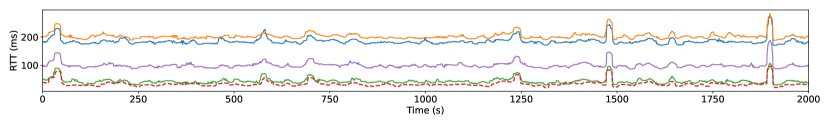
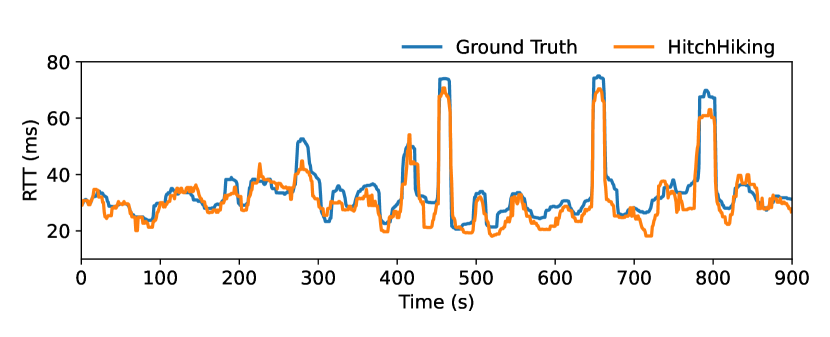
Evaluation. Across all HitchHiking vantage points, HitchHiking captures latency statistics that are close to the ground truth: 96% of reported RTT times are within one standard deviation (10 ms), and 50% of RTT times are within 3 ms of the ground truth (i.e., the dish’s pop ping latency). We illustrate the output of HitchHiking relative to the ground truth in Figure 4(a) and the output of HitchHiking without removing terrestrial artifact—to better depict the captured RTT patterns across HitchHiking locations—in Figure 4(b). HitchHiking captures 100% of all sustained RTT spikes, which we define as latencies over two standard deviations away from the median that last at least 15 seconds (i.e., the Starlink minimum amount of time dishes stay connected to the same satellite (sta, 2021)). We describe the underlying cause for sustained RTT spikes (ISL usage) in Section 7.
HitchHiking observes only one false-positive RTT spikes across our cumulative 10,000 second measurement period. All but one HitchHiking geographic location has a 0% false positive rate for capturing RTT spikes. When HitchHiking is deployed 6,000 miles from our ground-truth dish, it returns one false positive RTT peak near second 1800. We attribute the false positive to a less stable terrestrial-router hop; while other terrestrial-router hops never deviate more than 1 ms from the average, the 6,000 miles terrestrial-router hop jitters up to 10 ms in latency near second 1800. Thus, although terrestrial-router RTT is subtracted from the final hop, jitter can propagate. To decrease the false positive rate of finding sustained latency spikes, in Section 7, we only study endpoints whose second-to-last hop experiences no more than 1 ms deviation of RTT.
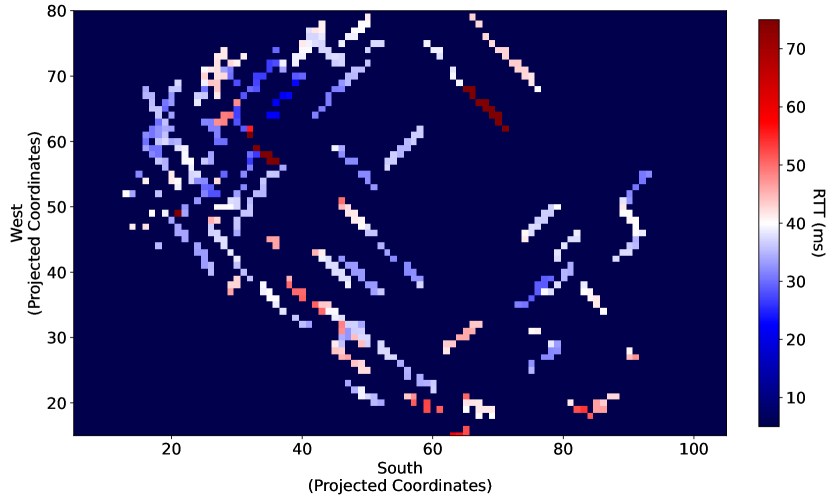
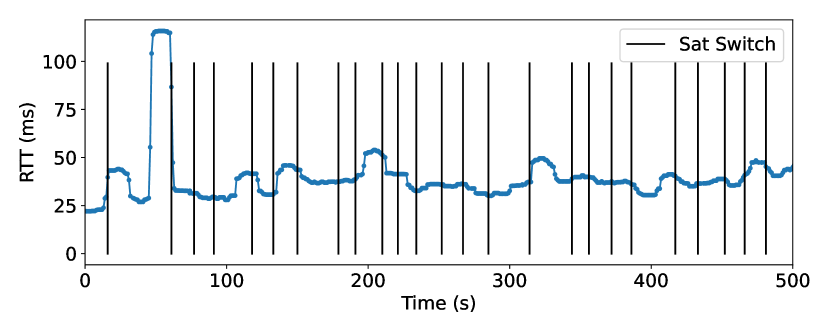
Sustained spikes in RTT are not caused by distant satellite location and not always caused by satellite switches. In Figure 5(a), we present the obstruction map overlayed with the corresponding ground truth RTT. There exists no clear correlation between sustained latency and the satellite locations relative to the dish: sustained anomalous RTTs, colored in red, occur throughout all satellite locations. In Figure 5(b), we vertically mark every satellite change, which we detected when the dish connects to a satellite that is not neighboring the prior connection’s location. Within the first 500 seconds of measurement, the first sustained RTT peak occurs while still connected to the same satellite. Across the entire measurement period, 2/5 sustained RTT spikes occur while still connected to the same satellite. For standard RTT spikes (i.e., spikes over one—but not two—standard deviations above the median), 5% occur while still connected to the same satellites. Thus, satellites switches are not the ultimate cause behind latency spikes.
RTT spikes are also not due to congestion. The ground truth metrics report no packet drop or drop in bandwidth during sustained or standard latency spikes. Furthermore, we find that spikes occur in multiples of 15 second—aligning with Starlink’s reported satellite reconfiguration period (sta, 2021)—further making any cause of latency that is independent of Starlink routing (e.g., brief congestion caused by a nearby user) unlikely. In Section 7, we use HitchHiking’s global perspective, and validation by Starlink, to show that sustained latency spikes are due to routing path changes exacerbated by ISLs. Notably, Starlink shares that routing path changes can happen even if a user remains connected to the same satellite.
6.1.2. LEO Simulations
LEO simulations model real-world LEO networks to help researchers explore scenarios that are impossible to test on real networks. We consider two LEO simulators: (1) the most widely-used, Hypatia (Kassing et al., 2020) and (2) the newest, StarryNet (Lai et al., 2023).
Hypatia is a LEO simulator that takes as input the geographic location of ground stations and satellite constellation parameters (e.g., number of satellites, their altitude, inclination, etc.). Hypatia then returns the predicted RTT packet latency between two ground stations (GS) A and B. We show that HitchHiking is more accurate than Hypatia at estimating LEO latency. Unfortunately, we cannot evaluate against StarryNet because it requires over 2 TB of RAM to simulate Starlink and is not able to run in cloud environments555We inspect the source code and find that StarryNet requires a specific type of local network reconfiguration which Google Cloud cannot successfully execute..
Methodology. To model Starlink latency, we configure Hypatia with the Starlink constellation parameters published by the FCC (sat, 2023b). To model client latency to a POP, we run multiple simulations where GS A is the location of our dish (Section 6.1) and GS B is a GS within the set of all GS that are reachable using one satellite hop from the dish. To account for additional terrestrial latency between the ground station and POP, we add the latency that a packet would incur traveling at 2/3rds the speed of light (i.e., estimated optical fiber latency (Chaudhry and Yanikomeroglu, 2022)) between the ground station and POP.
We use Hypatia’s default satellite selection algorithms: Hypatia connects the client with a satellite that minimizes the RTT between the client and ground station. In Appendix E, we present the results of configuring Hypatia using a theoretical worst case satellite selection algorithm and find that it does not significantly change the quality of Hypatia’s predictions. We compare Hypatia results with our ground truth dish and a HitchHiking deployment located 500 miles away from the dish.
| DNS | POP | # Distinct IPs | |
| Subdomain | Location | Hitch- | RIPE |
| Hiking | Atlas | ||
| sttlwax1 | Seattle, Washington | 243 | 7 |
| atlagax1 | Atlanta, Georgia | 210 | 4 |
| dllstxx1 | Dallas, Texas | 186 | 1 |
| chcoilx1 | Chicago, Illinois | 182 | 6 |
| lsancax1 | Los Angeles, California | 173 | 2 |
| sydyaus1 | Sydney, Australia | 148 | 4 |
| nwyynyx1 | New York City, New York | 144 | 6 |
| frntdeu1 | Frankfurt, Germany | 124 | 13 |
| dnvrcox1 | Denver, Colorado | 87 | 7 |
| lndngbr1 | Heathrow, England | 56 | 6 |
| mdrdesp1 | Madrid, Spain | 20 | 0 |
| sntoch1 | Santiago, Chile | 19 | 1 |
| acklnzl1 | Auckland, New Zealand | 11 | 0 |
| lgosnga1 | Lagos, Nigeria | 6 | 0 |
| bgtacol1 | Bogata, Columbia | 5 | 0 |
| limaper1 | Lima, Peru | 3 | 0 |
| prthaus1 | Perth, Australia | 3 | 1 |
| qrtomex1 | Mexico City, Mexico | 3 | 0 |
| splobra1 | San Paulo, Brazil | 3 | 0 |
| tkyojpn1 | Tokyo, Japan | 3 | 0 |
| Total | 1,629 | 58 | |
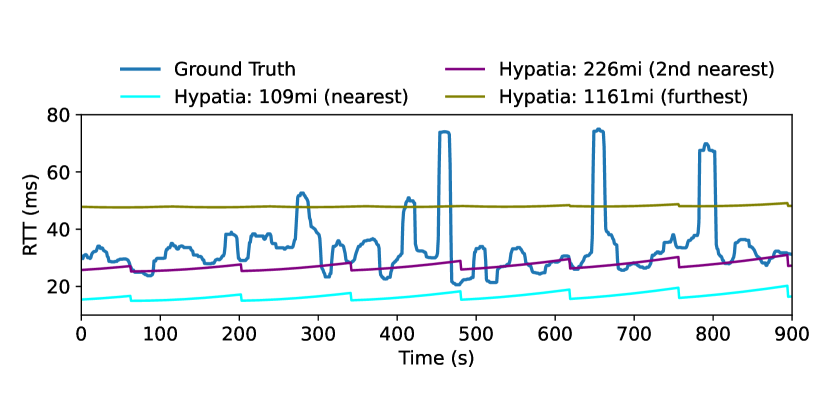
Evaluation. While HitchHiking accurately estimates LEO satellite latency relative to ground truth, Hypatia is difficult to parameterize such that its output matches ground truth. In Figure 6(a), we illustrate the output of Hypatia when using the best-case satellite selection algorithm, and a subset of nearby groundstations (the nearest, second nearest, and furthest). No matter the ground station, Hypatia never predicts that a client experiences sustained RTT spikes, unlike HitchHiking (Figure 6(b)). In Section 7.2, we find that RTT peaks are due to dynamic ISL routing patterns, which Hypatia is unaware of. Notably, configuring Hypatia to use the second nearest ground station produces a latency prediction that on average is only 7.6 ms in error relative to the ground truth. Nevertheless, HitchHiking RTTs are on average 1.8 times more accurate than Hypatia.
Hypatia’s inability to model real-world LEO links is not necessarily a deficiency of Hypatia, but rather a limitation of applying theoretical models to predict latencies about a network that reveals little about its operation. Starlink does not reveal its internal fiber paths between ground stations and POPs, terrestrial routing decisions, satellite selection algorithm, ISL routing, or congestion patterns. In order to approximate latency, the only ground truth information Hypatia has access to is satellite and ground station location.
Nevetheless, Hypatia’s theoretical minimum calculations can help illustrate which ground stations a dish is connected to. Given that 20% of ground truth RTT fall below the second-nearest ground station best-case RTTs, Starlink must be connected to the nearest ground station at least 20% of the time. However, using Hypatia alone, it is unclear whether other increases in RTT latency are due to connecting to a different ground station, or congestion.
6.1.3. RIPE Atlas
RIPE Atlas—one of the most comprehensive community-driven Internet measurement platforms—provides substantially less coverage and granular statistics than HitchHiking. Unfortunately, the nearest RIPE Atlas dish that is assigned our POP is located over 300 miles away (i.e., uses a different set of ground stations). Furthermore, RIPE Atlas limits measurements to occur no more frequently than every 60 seconds, making it difficult to capture sustained RTT spikes that often change every 15 seconds.
6.2. HitchHiking Coverage
HitchHiking provides the most comprehensive coverage of LEO networks today. Fortuitously for HitchHiking, LEO network customers expose services across the world. On May 10, 2023, we use HitchHiking to measure all (publicly exposed) LEO links in the Starlink network. In Table 1, we list the POP locations of Starlink customers that expose services, as well as the POP locations of all RIPE Atlas Starlink Probes. HitchHiking has 28 times more exposed services than RIPE Atlas, whose services use POPs across only five countries. Only seven IPs found by HitchHiking overlap with those of RIPE Atlas. HitchHiking finds exposed Starlink services are assigned to POPs that reside across 20 cities and 13 countries. While a majority (59%) of HitchHiking found services use POPs in the US, there exists a long-tail of other locations including Australia (7%), Germany (6%), and England (3%).
7. Worldwide Latencies in the Wild
We perform the most geographically-diverse data-driven analysis of LEO satellite latency to date. Our global perspective illuminates that real world deployment of a global LEO network is more complex than previously understood. While prior work attributed differences in customer latency to localized effects such as satellite location or congestion, we infer, and validate, that customer latency is correlated with a customer’s distance to POP and unexpected ground station selection. Additionally, our investigation surfaces an overlooked reality by prior work: while ISLs do increase coverage, they significantly increase the distance of the route between the ground station to POP.
We use the HitchHiking methodology (Section 5) to collect Starlink latency data between May 18–June 23, 2023. Additionally, we use HitchHiking to scan the IP addresses of all Starlink RIPE Atlas probes, which provide ground truth about customer location; we mention when RIPE Atlas probes are used in our analysis. We filter the initial 3.5K exposed customer Starlink IPs for jittery pre-satellite hops, leaving 2.4K IPs that host exposed services. The set of services follows a geographic distribution similar to Table 1.
7.1. POP Distance
In this section, we investigate how a customer’s distance to POP correlates with their expected latency. We find that even with Starlink’s vast network topology, remote customers can experience latency increases by over three fold compared to other customers assigned to the same POP.
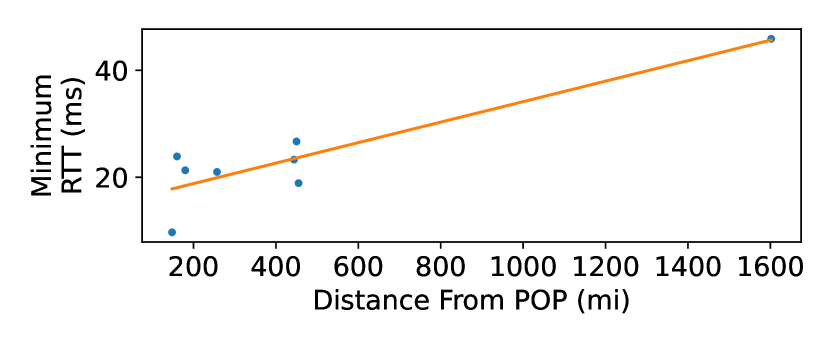
In Figure 7, we plot the HitchHiking-measured latency and distances of the RIPE Atlas probes with their respective POPs. The further a Starlink customer is from their POP, the greater their minimum RTT. In the worst case, a customer from the US Virgin Islands is assigned to their nearest POP, in Atlanta, Georgia, located roughly 1600 miles away. They experience a minimum RTT nearly twice as large compared to customers that are closer to their own POP.
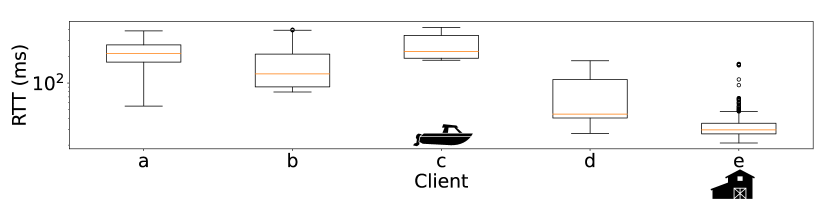
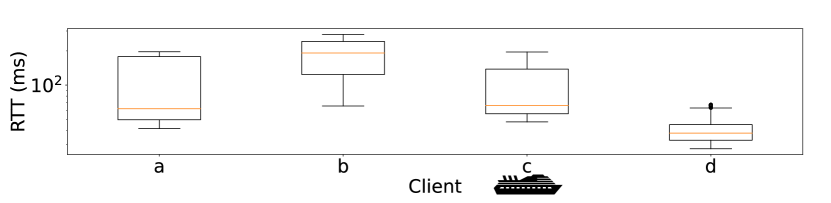
Minimum RTT can be used to approximate customer location when no ground truth is available (i.e., when measuring non-RIPE Atlas exposed services). For example, in Figure 8(a), minimum RTT from data collected on May 18, 2023, indicates that customer e must be located much closer to the Nigerian POP than customer c. Indeed, customer c is on a yacht near Seychelles (they host a TLS certificate registered to the name of a unique sportfisher yacht, which MarineTraffic.com shows to be near Seychelles (sey, 2007)) while customer e is in the Nigerian Palm-Oil farm (i.e., the customer hosts a TLS certificate that fingerprints to a Nigerian Palm-Oil farm). Additionally, in Figure 8(c), we find that customer p, whose minimum RTT is nearly 3 times larger than average minimum RTT, is thousands of miles away from their assigned nearest Seattle POP (customer p’s exposed email server belongs to Vuntut Gwitchin First Nation, a cultural site, which is located thousands of miles away Seattle near the northern border of Canada).
Notably, no matter a customer’s distance to their POP, all of our Starlink traceroutes show that packets are always tunneled to/from the customers assigned POP before traversing the public Internet666Packets are always first routed through the customer’s assigned Starlink POP once they enter the Starlink network. We conduct Section 6.1’s experiment in reverse (contact the geographically distributed servers from our dish), and find that when sending packets from a Starlink dish, packets are always routed through the customers assigned POP before leaving the Starlink network., thereby causing unavoidable latency. Tunneling customers through a home gateway across all connections is not unique to Starlink, but rather also common in mobile networks (Mandalari et al., 2018).
7.2. Routing Changes
Ground Station

Ground Station
We next investigate how routing changes between a client, groundstation, and POP correlate with latency. We find that customers physically located within ground station coverage experience surprising spikes in latency due to sub-optimal routing changes that are exacerbated by ISL technology, which Starlink engineers confirm.
To deduce routing causes of latency, we take advantage of HitchHiking’s ability to measure customer latency nearly anywhere in the world. We study a POP that minimizes the most variables in packet routing: the Nigerian POP. The Nigerian POP has the least number777We rely on public crowd sourcing to collect country-specific SpaceX requests for ground stations (sat, 2023b; fre, 2020; chi, 2020) to map the ground station topology of Starlink’s network. Given Starlink’s large fanbase who enjoy tracking ground station locations (Puchol, 2021; Owens, 2022) we assume that our knowledge is complete. Even if our knowledge was incomplete, sustained latency spikes that increase RTT by nearly an order of magnitude (e.g., second 350 in Figure 10), could not be explained by connecting to nearby ground stations within one hop). of ground stations (2) a negligible distance (80 miles) apart, within a one-hop satellite distance. We study a customer that we confirm is physically near their assigned Nigerian POP: the Palm-Oil customer (customer e from Section 7.1). Notably, without HitchHiking, one would have to solicit volunteers in Nigeria (of which currently there are none in RIPE Atlas) or travel with a dish to Nigeria.
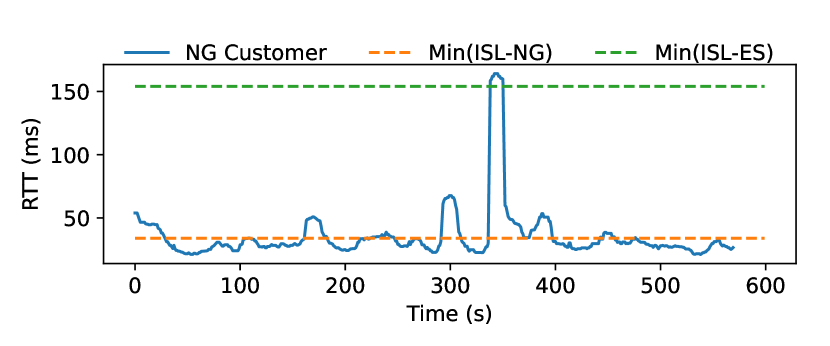
In the simplest case of routing, the Palm-Oil customer will connect to one of the two Nigerian ground stations nearby, using a one satellite “relay” hop (Figure 9(a)). After connecting to any ground station, the packet is always terrestrially routed to the POP, as revealed by Starlink (arc, 2022; ken, 2021)888In Section 5 we confirm that packets are routed terrestrially for as long as possible before reaching the satellite path. In Appendix B, we confirm that no matter the public Internet destination, packets leave their assigned (nearest) pop and continue the route terrestrially.. To deduce how often relay routing occurs, we first plot the customer’s RTT over time in Figure 10 from data collected on May 18, 2023. Second, we plot Hypatia’s calculated minimum RTT when using non-relay routing (i.e., two satellites with ISLs) to the Nigerian ground station (“Min(ISL-NG)”). Over 70% of customer RTTs fall below Min(ISL-NG), indicating that in the majority of cases the customer falls below the theoretical minimum latency of using two satellites to route to the nearest ground station, and therefore must be using single-hop relay routed to the nearest ground station.
However, one-third of the time, the Nigerian customer’s RTTs increase between 2–5 fold the median, indicating that Starlink is likely connecting customers with distant ground stations999We record no packet drop during the RTT increases and know that a sustained latency increase is not ultimately due to a satellite switch (Section 5).. Indeed, Starlink engineers confirm that these sustained latency spikes are due to customers using ISLs, which route through ground stations located anywhere in the world—not necessarily in close geo-proximity101010Starlink shares that routing is determined based on link availability, reliability, and capacity.. Thus, the outlier latency (162 ms) near second 350 in Figure 10 could be the sum of the following footnoted equation111111A Nigerian POP customer symmetrically routed through Spain would experience at least the following latency, where is the speed of light: , which shows that it would take at least 154 ms for a Nigerian POP customer to route through the nearest non-Nigerian ground station, in Lepe, Spain (Figure 9(c)). The Nigerian customer’s terrestrial route from the Spanish ground station would span over 4970 miles, given that all customers traverse from their ground station to their assigned POP terrestrially (Section 7.1). The sustained latency spikes near seconds 175 and 300 in Figure 10 are likely due to ISLs routing back to the Nigerian ground station, as depicted in Figure 9(b). While the sustained peaks are above the theoretical minimum latency, when accounting for potential additional latency due to bad satellite selection121212We compute worst case RTT using the methodology in Appendix 13. (12ms) and an indirect ISL routing path131313Starlink’s first shell contains 22 satellites per orbit, creating a roughly 1243 mi distance between satellites. If using an extra satellite to ISL route through, that would create additional RTT of 2* 1243 mi/speed of light (13 ms). (13 ms), the total RTT is within 5 ms of the second highest sustained peak at second 300.
While it may seem that always routing through a customer’s assigned POP, even when a closer POP is available, is uniquely inefficient, routing through an assigned gateway is a wide-spread practice in IP Packet Exchange Networks (IPX) during international roaming. Mandalari et al (Mandalari et al., 2018) show that in IPXs, significant latency increases occur due to the strict requirement of packets routing through the customer’s home gateway, no matter the packet destination, so that cellular carriers can easily monitor data usage, perform content filtering, etc. While Starlink customers are often stationary, the satellites (and their routing path) are not, causing routing patterns similar to international roaming. Coincidentally, the majority (70%) of Starlink traceroutes leak MultiProtocol Label Switching, a protocol heavily used by IPXs to route between gateways (Mandalari et al., 2018).
We find that customers who must fully rely on ISLs experience latency that is substantially worse than the expected latency of direct ISL routing, which Starlink independently confirms (Reddit, 2023b, a). For example, the Seychelles-yacht customer thousands of miles away from Nigeria (Section 7.1) is surrounded by no ground stations, and therefore must solely rely on ISLs to route to its assigned Nigerian-POP. The Seychelles yacht’s experiences a minimum RTT of 181 ms (6 times worse than Palm-Oil-Farm Customer’s minimum RTT) indicating that it is theoretically improbable that ISLs are using a direct path to reach the ground station nearest to the Nigerian POP (i.e., a direct speed of light path from Seychelles to the Nigerian POP would take an RTT of 40 ms, and no more than 80 ms to account for potential “zig-zag” paths between satellites (Kassing et al., 2020)). Rather, the Seychelles yacht is also likely routed to a further ground station and suffers the additional latency of a terrestrial path back to the customer POP. Making matters worse, the Seychelles yacht is likely frequently re-routed: during 42% of our measurement period, the yacht’s RTT is 150 ms over its minimum RTT.
Sustained latency spikes are widespread and constant; at least 70% of customers experience at least one sustained latency every day during our month-long 5 minute data collection. Starlink engineers share that they are still building their ISL “mesh” and hope to improve edge case performance over time. In the next section, we find other instances of customers who experience impactful latency patterns and study how customer latency changes over time.
7.3. Geographic and Temporal Patterns
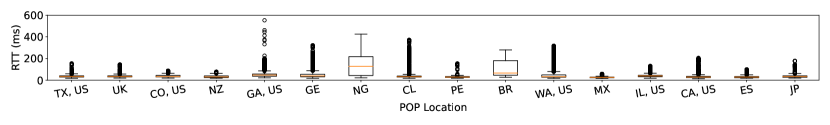
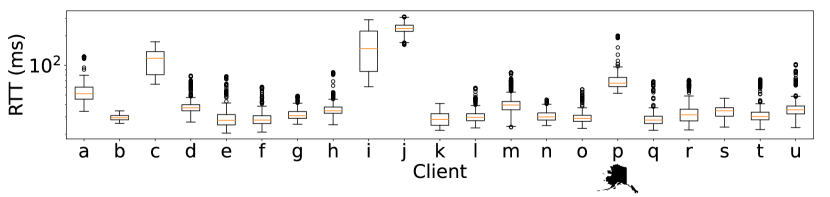
Latencies across POPs significantly vary due to their assigned types of customers (e.g., maritime, stationary) and distances of customers (e.g., extremely remote). We plot the distribution of customer RTTs across all customers and POP locations in Figure 11. Average RTTs vary by over 500%: from 28 ms (Mexico)–149 ms (Nigeria). Standard deviation of RTTs also vary by an order of magnitude: from 4 ms (Mexico)–109 ms (Nigeria). While customers with different RTTs are commonplace across all POPs (Figure 8(a)–Figure 8(c)), we describe how certain geographies are more or less likely to attract unique customer patterns:
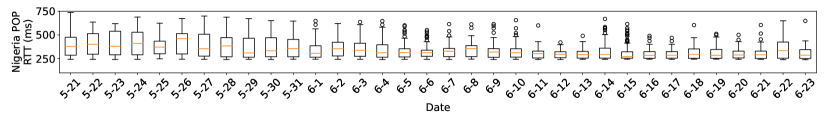
Nigeria. As of October 2023, Nigeria contains the only POP for the entire continent of Africa, which causes African marine traffic (e.g., Seychelles yacht in Figure 8(a)) to be routed through the Nigeria POP. Since marine traffic must rely on ISLs, which correlate with high average RTTs (Section 7.2), it is no surprise that Nigeria customers experience the worst RTTs. Nevertheless, we see Nigeria customer latency decrease overtime. In Figure 12(a), we show that between May–June, 2023 the population of customers that experience outlier behavior shrinks and median latency decreases by 25%, from roughly 400 ms to 300 ms. The downward trend in latency provides encouragement that Starlink is actively changing routing patterns.
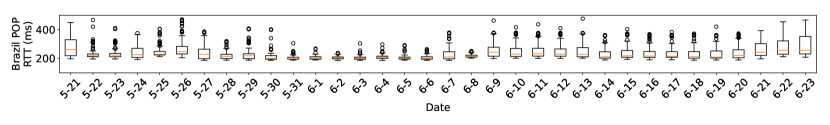
Brazil. Brazil-POP customers experience the second largest average RTT (104 ms) and standard deviation of RTT (27 ms). While Brazil has at least 10 ground stations, its coastal location also attracts marine traffic that relies on ISLs, which correlate with substantially increased latency. For example, customer Oceanica Sub VII (identified using an exposed SNMP firewall name) who is off the coast of Fortaleza Brazil (ves, 2023) at the time of our experiment is 1491 mi away from its POP—a 14 ms RTT if using a direct ISL path—but experiences an average RTT of 96 ms (Figure 8(b)), indicating indirect routing is in use. Consistent with other marine traffic, Oceanica Sub VII continually experiences sustained latency spikes, lasting for 16% of our measurement period. Brazil customers do not see overall latency improvement in the same way as Nigerian customers do (Figure 12(b)).
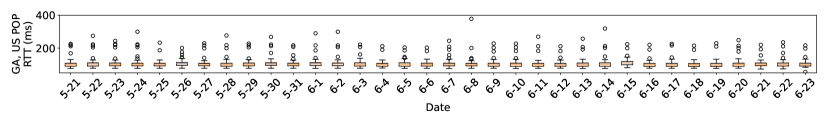
Georgia, USA. Georgia-POP customers experience the highest average (58 ms) and standard deviation (21 ms) of latency across the US. Ground truth location from RIPE atlas probes indicate that on average, a Georgia-POP customer is 1,000 miles away, partly due to customers located in the US Virgin Islands being assigned the Georgia POP. Thus, customers’ often long distance to the Georgia-POP increases the lower bound of the latency that the majority of customers experience. Georgia latency patterns remain relatively stable over time (Figure 12(c)).
Other POPs. Peru, Australia, and New Zealend experience the shortest RTT times, on average under 30 ms. All three locations surrounded by at least six groundstations that are reachable by a single satellite-hop. We do not identify any maritime customers assigned to those POPs.
7.4. Summary
HitchHiking’s global perspective shows how Starlink’s complex network architecture impacts customer latency across many facets. First, we find that depending upon a customer’s distance to their POP, minimum latency grows over three-fold. Second, we detect and validate that routing changes to different ground stations cause sustained latency spikes that increase RTT by near an order of magnitude. Third, reliance on ISLs (e.g., customers on boats) correlates with increases in RTT and sustained latency increases. Notably, the diversity of customers and routing infrastructure causes large variances in RTT across POPs worldwide, underlining the value of the global and diverse perspective provided by HitchHiking.
8. Limitations and Future Work
HitchHiking does not replace existing methodologies, but rather serves as a low-barrier methodology that provides data about LEO links worldwide. We see many possible directions to integrate HitchHiking into future LEO research:
Measuring Other LEO Networks. While Starlink is the only LEO satellite network that sells to individuals, other LEO networks (e.g., AWS Kuiper, Telesat, etc) are expected to provide new services in the coming years. With different networking architectures, including differently-arranged satellite constellations, these networks will likely exhibit both similar and different behaviors to Starlink. HitchHiking can be applied to measure other LEO networks once customers begin to expose services. HitchHiking collected data can illuminate the similarities and differences of LEO network performance across different architectures in practice.
As an example, we use HitchHiking to identify roughly 20 OneWeb measurable-endpoints that belong to business customers located in primarily Northern regions (e.g., Alaska, Canada). We detail our exact OneWeb-specific HitchHiking methodology in Appendix F. Unfortunately, we are not able to validate latency measurements with ground truth (i.e., a OneWeb dish we control) because OneWeb dishes are (1) only available to businesses and (2) prohibitively expensive (e.g., upwards of $23,000 (one, 2023)). We hope future work with access to OneWeb equipment can validate our OneWeb-HitchHiking methodology.
Measuring LEO Networks Over Time. As Starlink continues to add more customers, ground stations, POPs, satellite orbits and routing policies, HitchHiking can be used to compare how the architecture changes network measurements over time. For example, how does adding more users in a single location affect congestion, bandwidth and latency? Do different routing policies fundamentally change customer network quality of experience? We are open sourcing HitchHiking daily-collected data, giving researchers immediate access to answer temporal questions.
Data-Driven Simulations. While simulations allow for a wider flexibility of experiments than measurements, simulation accuracy is constrained by a plethora of unknowns about how real LEO networks operate. Future work should look into (1) training predictive models with HitchHiking collected data to better simulate real-world networking conditions world wide, (2) creating “replay” models with HitchHiking data that can test the performance of new algorithms (e.g., congestion control) using real data from the past.
LEO Network Coverage. While HitchHiking provides over 10 times more coverage of a LEO network than the leading alternative (rip, 2010), HitchHiking does not provide full coverage. For example, while Starlink has an estimated 2 million users (SpaceX, 2023), HitchHiking only measures an estimated 0.1% of all customers. Furthermore, HitchHiking is biased towards measuring customers who host exposed services, which may introduce confounding factors. Future work should investigate if other opportunities exist to measure LEO customers that do not expose services, to further increase coverage and reduce bias.
9. Conclusion
In this work we introduced HitchHiking, a methodology for measuring LEO satellite networks at scale. HitchHiking builds on the observation that Internet exposed services that use LEO-based Internet access can reveal both satellite network architecture and performance, without needing physical hardware. HitchHiking is accurate and provides an order of magnitude more coverage than alternative solutions. Using our new global perspective, we study over 2.4K Starlink customers across farms, boats, and remote regions, to understand user latency.
Our investigation surfaces that contrary to prior assumptions, sustained peaks of latency are not caused by distant satellite location. We highlight that ISL routing patterns create the widest variance of latency. While ISLs were advertised as a low latency solution for more direct routing (Kassing et al., 2020; Musk, 2021), they significantly increase the length of the routing path between the ground station to POP, at the benefit of increasing connectivity (e.g., to ships).
Connectivity at the cost of latency is not unique to Starlink; mobile networks face the same trade-off when providing international roaming under different regulatory bodies (Mandalari et al., 2018). By increasing connectivity through ISL deployment, Starlink customers now occasionally experience RTTs that are inching closer to GEO latency. As LEO networks continue to increase connectivity, we hope the community uses HitchHiking to understand their real-world deployment when continuing to help design and protect the LEO ecosystem.
References
- (1)
- ani (2004) 2004. Anik F2 Launched on Ariane 5. https://www.universetoday.com/9737/anik-f2-launched-on-ariane-5/. (2004). Accessed: 2023-05-21.
- sey (2007) 2007. Ship Alduhail. https://www.marinetraffic.com/en/ais/details/ships/shipid:6126953/mmsi:466391000/imo:0/vessel:ALDUHAIL. (2007). Accessed: 2023-05-20.
- rip (2010) 2010. RIPE Atlas probes. https://atlas.ripe.net/probes/. (2010). Accessed: 2023-05-14.
- one (2012) 2012. Oneweb. https://oneweb.net. (2012). Accessed: 2023-05-14.
- sta (2014) 2014. Starlink internet plans and pricing. https://www.allconnect.com/providers/starlink. (2014). Accessed: 2023-05-14.
- dub (2017) 2017. dublin-traceroute. https://dublin-traceroute.net/. (2017). Accessed on 2023-05-24.
- fre (2020) 2020. Décision n°2020-0884. https://www.arcep.fr/uploads/tx˙gsavis/20-0884.pdf. (2020). Accessed on 2023-05-24.
- chi (2020) 2020. EXTRACTO 20-SP50711. http://legales.elmostrador.cl/c˙avisos/imagenes/EXTRACTO˙02122020.pdf. (2020). Accessed on 2023-05-24.
- ken (2021) 2021. Case No. 2021-00002, Application of Starlink Services. https://psc.ky.gov/pscecf/2021-00002/kerry.ingle%40dinslaw.com/01042021010318/Application_-_Designation_as_ETC.PDF. (2021). Accessed on 2023-05-24.
- sta (2021) 2021. Petition of Starlink Services, LLC For Designation as an Eligible Telecommunications Carrier. https://web.archive.org/web/20220320174537/https://ecfsapi.fcc.gov/file/1020316268311/Starlink%20Services%20LLC%20Application%20for%20ETC%20Designation.pdf. (2021). Accessed: 2023-05-26.
- nel (2021) 2021. Starlink Dishy: getting some deeper status. https://nelsonslog.wordpress.com/2021/06/27/starlink-dishy-getting-some-deeper-status/. (2021). Accessed: 2023-05-20.
- arc (2022) 2022. Arcep. https://www.arcep.fr/uploads/tx˙gspublication/contributions-consult-starlink˙juin2022.zip. (2022). Accessed on 2023-05-24.
- nat (2022) 2022. Musk’s Starlink connects remote Tonga villages still cut off after tsunami. https://www.reuters.com/world/asia-pacific/musks-starlink-connects-remote-tonga-villages-still-cut-off-after-tsunami-2022-02-23/. (2022). Accessed: 2023-05-22.
- pep (2022) 2022. Peplink. https://www.peplink.com/. (2022). Accessed: 2023-01-13.
- wsj (2022) 2022. SpaceX Satellites Tumble Out of Orbit After Geomagnetic Storm. https://www.wsj.com/video/spacex-satellites-tumble-out-of-orbit-after-geomagnetic-storm/713508A3-A1CC-4026-BE54-F651EC0A9B93.html. (2022). Accessed: 2023-05-14.
- und (2022) 2022. SpaceX to provide internet for 19K rural schools in Brazil, monitoring Amazon. https://www.aa.com.tr/en/economy/spacex-to-provide-internet-for-19k-rural-schools-in-brazil-monitoring-amazon/2593473. (2022). Accessed: 2023-05-22.
- pin (2023) 2023. Global Ping Statistics for Lagos. https://wondernetwork.com/pings/Lagos. (2023). Accessed: 2023-10-10.
- one (2023) 2023. Intellian Oneweb Satellite Internet Systems. https://www.asiasatellite.co/Intellian-Oneweb-Satellite-Internet-Systems.htm. (2023). Accessed: 2023-05-14.
- sat (2023a) 2023a. Live Starlink Satellite and Coverage. https://satellitemap.space/. (2023). Accessed: 2023-05-14.
- ves (2023) 2023. OCEANICASUB VII. https://www.vesselfinder.com/vessels/details/9240108. (2023). Accessed: 2023-05-20.
- sta (2023a) 2023a. Order Starlink. https://www.starlink.com/residential/. (2023). Accessed: 2023-05-14.
- kui (2023) 2023. Project Kuiper. https://www.aboutamazon.com/what-we-do/devices-services/project-kuiper. (2023). Accessed: 2023-05-23.
- sat (2023b) 2023b. Satellite Earth Station FCC Filing. https://fcc.report/IBFS/Filing-List/SES. (2023). Accessed: 2023-05-20.
- sta (2023b) 2023b. Starlink. https://www.starlink.com/. (2023). Accessed: 2023-05-14.
- ukr (2023) 2023. Starlink and the Russia-Ukraine War: A Case of Commercial Technology and Public Purpose? https://www.belfercenter.org/publication/starlink-and-russia-ukraine-war-case-commercial-technology-and-public-purpose. (2023). Accessed: 2023-05-20.
- sta (2023c) 2023c. Starlink Coverage Map. https://www.starlink.com/map. (2023). Accessed: 2023-05-14.
- sta (2023d) 2023d. Starlink GEO IP Mapping. https://geoip.starlinkisp.net/feed.csv. (2023). Accessed: 2023-10-09.
- rem (2023) 2023. Starlink Is Now Connecting Remote Antarctic Research Camps to the Internet. https://gizmodo.com/spacex-starlink-internet-connectivity-antarctica-1850018202. (2023). Accessed: 2023-05-22.
- sta (2023e) 2023e. Starlink Specifications. https://www.starlink.com/specifications. (2023). Accessed: 2023-05-14.
- tcp (2023) 2023. tcptraceroute - Linux man page. https://linux.die.net/man/1/tcptraceroute. (2023).
- tel (2023) 2023. Telesat. https://www.telesat.com/. (2023). Accessed: 2023-05-23.
- mtr (2023) 2023. What is My Traceroute (MTR)? https://www.cloudflare.com/learning/network-layer/what-is-mtr/. (2023). Accessed on 2023-05-24.
- Akiwate et al. (2022) Gautam Akiwate, Raffaele Sommese, Mattijs Jonker, Zakir Durumeric, KC Claffy, Geoffrey M Voelker, and Stefan Savage. 2022. Retroactive identification of targeted DNS infrastructure hijacking. In Proceedings of the 22nd ACM Internet Measurement Conference. 14–32.
- Augustin et al. ([n. d.]) Brice Augustin, Xavier Cuvellier, Benjamin Orgogozo, Fabien Viger, Timur Friedman, Matthieu Latapy, Clémence Magnien, and Renata Teixeira. [n. d.]. Avoiding traceroute anomalies with Paris traceroute. In Proceedings of the 6th ACM SIGCOMM conference on Internet measurement.
- Augustin et al. (2006) Brice Augustin, Xavier Cuvellier, Benjamin Orgogozo, Fabien Viger, Timur Friedman, Matthieu Latapy, Clémence Magnien, and Renata Teixeira. 2006. Avoiding traceroute anomalies with Paris traceroute. In Proceedings of the 6th ACM SIGCOMM conference on Internet measurement. 153–158.
- Bhattacharjee et al. (2023) Dhiraj Bhattacharjee, Aizaz U Chaudhry, Halim Yanikomeroglu, Peng Hu, and Guillaume Lamontagne. 2023. Laser Inter-Satellite Link Setup Delay: Quantification, Impact, and Tolerable Value. arXiv preprint arXiv:2301.05285 (2023).
- Bhattacherjee et al. (2018) Debopam Bhattacherjee, Waqar Aqeel, Ilker Nadi Bozkurt, Anthony Aguirre, Balakrishnan Chandrasekaran, P Brighten Godfrey, Gregory Laughlin, Bruce Maggs, and Ankit Singla. 2018. Gearing up for the 21st century space race. In Proceedings of the 17th ACM Workshop on Hot Topics in Networks. 113–119.
- Bhattacherjee et al. (2020) Debopam Bhattacherjee, Simon Kassing, Melissa Licciardello, and Ankit Singla. 2020. In-orbit computing: An outlandish thought experiment?. In Proceedings of the 19th ACM Workshop on Hot Topics in Networks. 197–204.
- Bhattacherjee and Singla (2019) Debopam Bhattacherjee and Ankit Singla. 2019. Network topology design at 27,000 km/hour. In Proceedings of the 15th International Conference on Emerging Networking Experiments And Technologies. 341–354.
- Bhosale et al. (2023) Vaibhav Bhosale, Ahmed Saeed, Ketan Bhardwaj, and Ada Gavrilovska. 2023. A Characterization of Route Variability in LEO Satellite Networks. In Passive and Active Measurement: 24th International Conference, PAM 2023, Virtual Event, March 21–23, 2023, Proceedings. Springer, 313–342.
- Chaudhry and Yanikomeroglu (2022) Aizaz U Chaudhry and Halim Yanikomeroglu. 2022. Optical Wireless Satellite Networks versus Optical Fiber Terrestrial Networks: The Latency Perspective: Invited Chapter. In 30th Biennial Symposium on Communications 2021. Springer, 225–234.
- Downey (1999) Allen B Downey. 1999. Using pathchar to estimate Internet link characteristics. ACM SIGCOMM Computer Communication Review 29, 4 (1999), 241–250.
- Durumeric et al. (2015) Zakir Durumeric, David Adrian, Ariana Mirian, Michael Bailey, and J. Alex Halderman. 2015. A Search Engine Backed by Internet-Wide Scanning. In 22nd ACM Conference on Computer and Communications Security.
- Durumeric et al. (2014) Zakir Durumeric, Frank Li, James Kasten, Johanna Amann, Jethro Beekman, Mathias Payer, Nicolas Weaver, David Adrian, Vern Paxson, Michael Bailey, et al. 2014. The matter of heartbleed. In ACM Internet Measurement Conference.
- Durumeric et al. (2013) Zakir Durumeric, Eric Wustrow, and J Alex Halderman. 2013. ZMap: Fast Internet-wide scanning and its security applications. In USENIX Security Symposium.
- Foust (2021) Jeff Foust. 2021. SpaceX adds laser crosslinks to polar Starlink satellites. https://spacenews.com/spacex-adds-laser-crosslinks-to-polar-starlink-satellites/. (2021). Accessed: 2023-05-26.
- Gigis et al. (2021) Petros Gigis, Matt Calder, Lefteris Manassakis, George Nomikos, Vasileios Kotronis, Xenofontas Dimitropoulos, Ethan Katz-Bassett, and Georgios Smaragdakis. 2021. Seven years in the life of Hypergiants’ off-nets. In Proceedings of the 2021 ACM SIGCOMM 2021 Conference. 516–533.
- Giuliari et al. (2021) Giacomo Giuliari, Tommaso Ciussani, Adrian Perrig, Ankit Singla, and E Zurich. 2021. ICARUS: Attacking low Earth orbit satellite networks.. In USENIX Annual Technical Conference. 317–331.
- Graham (2008) Robert David Graham. 2008. iPerf - The ultimate speed test tool for TCP, UDP and SCTP. https://iperf.fr. (2008). Accessed on 2023-05-24.
- Graham (2014) Robert David Graham. 2014. MASSCAN: Mass IP port scanner. https://github.com/robertdavidgraham/masscan. (2014). Accessed on 2021-12-01.
- Izhikevich et al. (2021) Liz Izhikevich, Renata Teixeira, and Zakir Durumeric. 2021. LZR: Identifying Unexpected Internet Services. In USENIX Security Symposium.
- Izhikevich et al. (2022) Liz Izhikevich, Renata Teixeira, and Zakir Durumeric. 2022. Predicting IPv4 Services Across All Ports. In ACM SIGCOMM Conference.
- Kassem et al. (2022) Mohamed M Kassem, Aravindh Raman, Diego Perino, and Nishanth Sastry. 2022. A browser-side view of starlink connectivity. In Proceedings of the 22nd ACM Internet Measurement Conference. 151–158.
- Kassing et al. (2020) Simon Kassing, Debopam Bhattacherjee, André Baptista Águas, Jens Eirik Saethre, and Ankit Singla. 2020. Exploring the ”Internet from Space” with Hypatia. In Proceedings of the ACM Internet Measurement Conference (IMC ’20). Association for Computing Machinery, New York, NY, USA, 214–229. https://doi.org/10.1145/3419394.3423635
- Lai et al. (2023) Zeqi Lai, Hewu Li, Yangtao Deng, Qian Wu, Jun Liu, Yuanjie Li, Jihao Li, Lixin Liu, Weisen Liu, and Jianping Wu. 2023. StarryNet: Empowering Researchers to Evaluate Futuristic Integrated Space and Terrestrial Networks. In 20th USENIX Symposium on Networked Systems Design and Implementation (NSDI 23). 1309–1324.
- Ma et al. (2022) Sami Ma, Yi Ching Chou, Haoyuan Zhao, Long Chen, Xiaoqiang Ma, and Jiangchuan Liu. 2022. Network Characteristics of LEO Satellite Constellations: A Starlink-Based Measurement from End Users. arXiv preprint arXiv:2212.13697 (2022).
- Malkin (1993) G Malkin. 1993. Traceroute using an IP option. Technical Report.
- Mandalari et al. (2018) Anna Maria Mandalari, Andra Lutu, Ana Custura, Ali Safari Khatouni, Özgü Alay, Marcelo Bagnulo, Vaibhav Bajpai, Anna Brunstrom, Jörg Ott, Marco Mellia, et al. 2018. Experience: Implications of roaming in europe. In Proceedings of the 24th Annual International Conference on Mobile Computing and Networking. 179–189.
- Michel et al. (2022a) François Michel, Martino Trevisan, Danilo Giordano, and Olivier Bonaventure. 2022a. A First Look at Starlink Performance. In Proceedings of the 22nd ACM Internet Measurement Conference (IMC ’22). Association for Computing Machinery, New York, NY, USA, 130–136. https://doi.org/10.1145/3517745.3561416
- Michel et al. (2022b) François Michel, Martino Trevisan, Danilo Giordano, and Olivier Bonaventure. 2022b. A first look at starlink performance. In Proceedings of the 22nd ACM Internet Measurement Conference. 130–136.
- Musk (2021) Elon Musk. 2021. https://twitter.com/elonmusk/status/1415527753185730564. (2021).
- Musk (2022) Elon Musk. 2022. https://x.com/elonmusk/status/1479236333516165121. (2022). Accessed: 2023-10-09.
- Owens (2022) Nathan Owens. 2022. Unoffical Starlink Global Gateways & PoPs. https://www.google.com/maps/d/u/0/viewer?mid=1805q6rlePY4WZd8QMOaNe2BqAgFkYBY. (2022). Accessed: 2023-05-14.
- Pavur et al. (2021) JC Pavur, Martin Strohmeier, Vincent Lenders, and Ivan Martinovic. 2021. QPEP: An actionable approach to secure and performant broadband from geostationary orbit. (2021).
- Puchol (2021) Mike Puchol. 2021. Starlink.sx. starlink.sx. (2021). Accessed: 2023-05-14.
- Reddit (2021) Reddit. 2021. Starlink Internet Infrastructure. (2021). https://www.reddit.com/r/StarlinkEngineering/comments/ofly6k/starlink˙internet˙infrastructure/.
- Reddit (2023a) Reddit. 2023a. r/Starlink - Service in Mozambique is provided only by space lasers. There are no ground stations in the region. https://www.reddit.com/r/Starlink/comments/13zqox3/service˙in˙mozambique˙is˙provided˙only˙by˙space/. (2023). Accessed on 2023-06-18.
- Reddit (2023b) Reddit. 2023b. r/Starlink - Starlink Global Roaming Service. https://www.reddit.com/r/Starlink/comments/114ay1q/starlink˙global˙roaming˙service/. (2023). Accessed on 2023-06-23.
- Satariano et al. (2023) Adam Satariano, Scott Reinhard, Cade Metz, Sheera Frenkel, and Malika Khurana. 2023. Elon Musk’s Unmatched Power in the Stars. https://www.nytimes.com/interactive/2023/07/28/business/starlink.html. (2023). Accessed: 2023-10-09.
- Savage et al. (1999) Stefan Savage et al. 1999. Sting: A TCP-based Network Measurement Tool.. In USENIX symposium on Internet Technologies and Systems, Vol. 2. 7–7.
- SpaceX ([n. d.]) SpaceX. [n. d.]. Launches. https://www.spacex.com/launches/. ([n. d.]). Accessed: 2023-05-26.
- SpaceX (2023) SpaceX. 2023. https://x.com/Starlink/status/1705695980325323023. (2023). Accessed: 2023-10-09.
- Swinhoe (2023) Dan Swinhoe. 2023. Starlink building or expanding more than 20 US ground station sites to operate in E-band. https://www.datacenterdynamics.com/en/news/starlink-building-or-expanding-more-than-20-us-ground-station-sites-to-operate-in-e-band/. (2023). Accessed: 2023-05-26.
- Thibaud et al. (2018) Adrien Thibaud, Julien Fasson, Fabrice Arnal, David Pradas, Emmanuel Dubois, and Emmanuel Chaput. 2018. QoE enhancements on satellite networks through the use of caches. International Journal of Satellite Communications and Networking 36, 6 (2018), 553–565.
- Vanaubel et al. (2019) Yves Vanaubel, Jean-Romain Luttringer, Pascal Mérindol, Jean-Jacques Pansiot, and Benoit Donnet. 2019. TNT, watch me explode: A light in the dark for revealing MPLS tunnels. In 2019 Network Traffic Measurement and Analysis Conference (TMA). IEEE, 65–72.
- Wang et al. (2023) Ruibo Wang, Mustafa A Kishk, and Mohamed-Slim Alouini. 2023. Reliability Analysis of Multi-hop Routing in Multi-tier LEO Satellite Networks. arXiv preprint arXiv:2303.02286 (2023).
- Wang et al. (2021) Shangguang Wang, Qing Li, Mengwei Xu, Xiao Ma, Ao Zhou, and Qibo Sun. 2021. Tiansuan constellation: An open research platform. In 2021 IEEE International Conference on Edge Computing (EDGE). IEEE, 94–101.
Appendix A Ethics
Our work does not involve human subjects and therefore, according to our institution’s IRB policies, does not require IRB approval. Nevertheless, we agree with and support the mission of minimizing harm when measuring LEO links, and thoroughly discuss the measures we take in Section 4.4.
Appendix B Mapping The Starlink Network With Traceroute
To map Starlink, we first experiment with different tools and protocols, to determine which illicit the most network information. We experiment with running ICMP, UDP, and TCP traceroutes across the following tools, which differ in the manner they construct and send packets: dublin-traceroute (dub, 2017), paris-traceroute (Augustin et al., [n. d.]), tcp-traceroute (tcp, 2023), mtr (with the mpls flag) (mtr, 2023), and TNT (Vanaubel et al., 2019). When scanning all Starlink customer endpoints (Section 5) from Stanford, 60.3% are reachable across all tools using ICMP, 17.2% are reachable using UDP, and 24.6% using TCP. The number of routing hops within the Starlink network nearly always (96% of the time) does not change depending upon the tool or protocol used.
After performing all variations of traceroute, we find three noteworthy network characteristics of Starlink: (1) Starlink routes TCP and UDP packets through a changing set of IP addresses before reaching the endpoint, while keeping a consistent routing path for ICMP packets. While 98.3% of tcptraceroutes result in a second-to-last hop set of at least two IP addresses, 100% of ICMP paris-traceroutes result in in a second-to-last hop set of just one IP address. (2) Starlink’s consistent routing path traverses the customer’s POP across 100% of traceroutes, no matter from/to where the server and client are. (3) Starlink uses MPLS routing before reaching the end-host. Consequently, a subset of routing is not visible to any traceroute tool. TNT, a tool used to uncover routing behind MPLS does not find any new networking paths within Starlink. While mtr reveals the last label assigned to a packet at the end of an MPLS tunnel, we do not identify any useful patterns.
B.1. Mapping Starlink’s Routing
To obtain ground truth on Starlink’s internal network operation, we purchase a Starlink generation 2 router and dish (sta, 2023a), and deploy it in San Diego. To identify where internal satellite routing occurs, we conduct egress ICMP paris-traceroutes from our dish to a diverse set of end-points, including at least 3 LEO satellite endpoints (Section 6.2) in every available country, all the geographically-distributed DNS root servers, and geographically distributed AWS servers (described in Section 6). Across all egress traceroutes, once a packet leaves our dish’s local area network (LAN), there is a spike in the round trip time (e.g., 39ms in Table 2). All subsequent Starlink (ASN 14593) hops incur negligibly different round-trip-times, suggesting that the first hop encompasses at least the entire satellite link (i.e., dish to satellite to groundstation). We further validate in Section 6 that the satellite link is within the first hop.
| Hop | Router IP | RTT | Network |
| (ms) | |||
| 1 | 2605:59c8:3049:fa00::1 | 1 | Dish (LAN) |
| 2 | 2605:59c8:3000:f27f::1 | 39 | Starlink |
| 3 | 2620:134:b0fe:251::114 | 38 | Starlink |
| 4 | 2620:134:b0ff::378 | 38 | Starlink |
| 5 | 2620:134:b0ff::368 | 38 | Starlink |
| 6 | 2620:107:4008:d03::1 | 38 | Cogent |
While the first visible non-LAN hop includes the satellite link, it likely also includes the terrestrial pathway between the groundstation and POP. Starlink addresses that are one hop away from a different autonomous system (e.g., hop 5 in Table 2) likely belong to equipment located in Internet Exchange Points (i.e., Starlink PoPs), as they are (1) often (68.2% of the resolvable hostnames) preceded by an IP address a hostname suffix that indicates an IXP presence (e.g., any2ix.coresite.com, ch3.unitedix.net) (2) nearly always (87.6%) experience less than 1ms RTT difference between the preceded router. All Starlink IP addresses between the POP hop and the client incur negligible additional latency, indicating that they are likely not a ground station, which, in our experiment, is built at least 100 miles away from the POP. Thus, with physical equipment and today’s networking tools, Starlink’s satellite link will include terrestrial latencies between the groundstation and POP. We further evaluate the groundstation impact in Section 6.1.2.
Appendix C HitchHiking Implementation Details Continued
We define a ttl ping as an ICMP paris-traceroute with the first hop and max-ttl set to the same hop number. To ping the terrestrial router we set both the first hop and the max-ttl to the terrestrial-hop-router-hop number (i.e., the second-to-last visible hop in the paris-traceroute). To ping the exposed service router we set both the first hop and the max-ttl to the exposed-service-hop-router-hop number (i.e., the last hop in the paris-traceroute). We opt to use ttl pings over regular pings due to the lack of coverage regular pings provide for terrestrial routers. We find that 99.2% of regular pings to terrestrial-hop-router-hops never respond. In contrast, 0% of ttl pings to terrestrial routers resulted in complete packet loss.
To use ttl pings, we rely on the assumption that the terrestrial-hop-router-hop number and the exposed-service-hop-router-hop number and the IP addresses they map to are stable. We validate the assumption by running 100 paris-traceroutes, one second apart, to each exposed service. We find that the vast majority of the exposed-service-hop-router-hop numbers (96.1%) and terrestrial-hop-router-hop numbers (99.9%) are consistent across the ICMP paris-traceroutes to the same exposed service. Additionally, we find that IP addresses for the same hop numbers do not change across ICMP paris-traceroutes.
Appendix D Using a Starlink Dish Obstruction Map To Infer Satellite Location
Starlink’s satellite dish does not directly reveal which satellite it is connected to. However, we notice that Starlink’s obstruction map—a map that highlights where the dish’s visibility is obstructed—records the location of the satellite that is connected to the dish. To infer which satellites the Starlink dish is connected to during our experiment, we first reboot our dish to clear the dish’s cached obstruction map and visually validate that the dish’s obstruction map is clear. We then start our experiment and send the “get_obstruction_map” gRPC command every second to receive the obstruction map every second. After reboot, we notice a 30 second delay before “get_obstruction_map” returns data. Once our experiment is finished, we subtract the obstruction map at time from the obstruction map at time , to illuminate the location of the dish-connected satellite is at time . Visual validation shows that every second the dish connects to a new satellite location that is either near the original one (i.e., the same satellite is connected to the dish) or at a completely different location (i.e., a new satellite is now connected to the dish).
Appendix E Hypatia Worst Case Satellite Selection Predictions
We modify Hypatia’s source code such that, when simulating routing patterns, it chooses the worst-case option for satellite routing (i.e., it connects the client with satellite that maximizes its round trip time to the ground station. We additionally configure Hypatia to reflect the azimuth properties of a Starlink dish. Since a Starlink dish cannot connect to satellites behind itself (sta, 2023e), and points itself at an azimuth of -22 N, we configure Hypatia to choose satellites for the dish that are between an azimuth lower than or greater than . The ground station is not configured with an azimuth cut-off, as their antennas can connect to satellites across all 360 degrees. In Figure 13, we illustrate the worst case predictions between the client and a subset of ground stations. Unfortunately, even worst case predictions do not capture Starlink’s RTT dynamics.
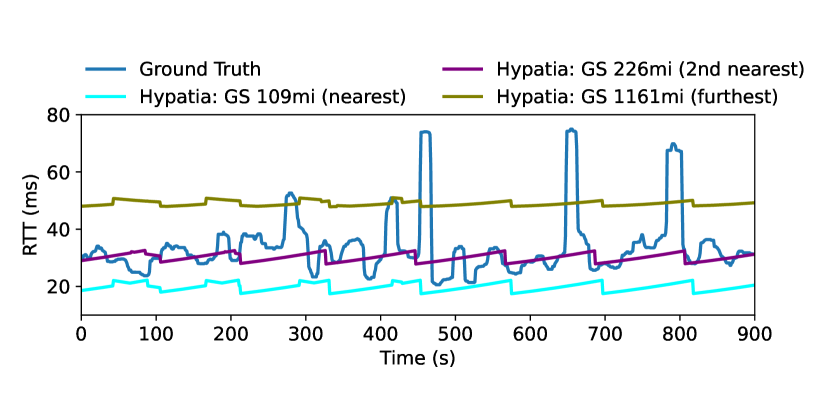
Appendix F Using HitchHiking to Measure OneWeb
OneWeb is a LEO constellation that provides Internet for businesses, rather than individual customers (one, 2012). We apply the HitchHiking methodology to measure OneWeb. However, we are not able to validate latency measurements with ground truth (i.e., a OneWeb dish we control) because OneWeb dishes are (1) only available to businesses and (2) prohibitively expensive (e.g., upwards of $23,000 (one, 2023)).
We outline the OneWeb-specific HitchHiking steps below.
1. Collect Exposed Services. We use Censys to collect all exposed services in the OneWeb network (AS 800).
2. Filter for Customer Endpoints. For OneWeb services, customer IP addresses resolve to business names. Thus, HitchHiking uses a blocklist approach in which it filters for PTR or SOA records that do not contain OneWeb’s domain, nor the domain of any regional Internet registry (i.e., AFRINIC, ARIN, APNIC, LACNIC, or RIPE).
3. Exclude PEPs. We do not identify any PEPs.
4. Geolocate services. To determine the geographic location of OneWeb services, we leverage an observation: OneWeb enterprise customers are listed as the registrant of One Web IP addresses in the whois database. Thus, we use the location of the registrant to determine the likely location of the service. Unlike Starlink, the majority of OneWeb expoesed services are located in Northern regions, including Alaska.
4.Identify satellite-routed path. OneWeb does not publicly reveal internal network operations. Moreover, since OneWeb only caters to enterprise and government clients, we do not have access equipment that can provide an internal network perspective. We conduct Ingress traceroutes to all the OneWeb endpoints from a server in Stanford, and show an example traceroute in Table 3. To measure OneWeb satellite latency, we subtract the second-to-last visible hop from the last hop.
| Hop | Router IP | RTT | Network |
| (ms) | |||
| 3 | 104.255.10.149 | 50 | Astute Hosting |
| 4 | * | ||
| 5 | * | ||
| 6 | Customer IP | 118 | OneWeb |