Getting the Most from Eye-Tracking: User-Interaction Based Reading Region Estimation Dataset and Models
Abstract.
A single digital newsletter usually contains many messages (regions). Users’ reading time spent on, and read level (skip/skim/read-in-detail) of each message is important for platforms to understand their users’ interests, personalize their contents, and make recommendations. Based on accurate but expensive-to-collect eyetracker-recorded data, we built models that predict per-region reading time based on easy-to-collect Javascript browser tracking data.
With eye-tracking, we collected 200k ground-truth datapoints on participants reading news on browsers. Then we trained machine learning and deep learning models to predict message-level reading time based on user interactions like mouse position, scrolling, and clicking. We reached 27% percentage error in reading time estimation with a two-tower neural network based on user interactions only, against the eye-tracking ground truth data, while the heuristic baselines have around 46% percentage error. We also discovered the benefits of replacing per-session models with per-timestamp models, and adding user pattern features. We concluded with suggestions on developing message-level reading estimation techniques based on available data.
1. Introduction
Digital newsletters (such as the one shown in Fig 1) include a variety of different messages within them (Kong et al., 2021c, 2022; Konstan and Kong, 2023). We are interested in estimating whether each user read in detail, skimmed, or skipped each message (read level) to help senders understand their users’ reading interests. Eye-tracking (Gibaldi et al., 2017; Funke et al., 2016; Othman et al., 2020) would provide a good solution, but users lack the hardware (and willingness) to provide that data. Instead, we rely on browser instrumentation to track time, scrolling, mouse clicks, etc. In this paper, we show how collecting a modest set of eye-tracking data and using it to train machine learning models for estimating reading behavior from browser logs can produce a fairly accurate classification of message-level reading behaviors.

Our core research question is how to estimate message-level reading time and read level based on each user’s interactions with browsers. We looked progressively at heuristics, logistic model and deep learning to identify the best estimation model, with following questions:
Q1: Do machine learning models, like the logistic model, perform better than the heuristic baselines?
Q2: Do neural network models perform better than the logistic model?
Q3: Do neural network models adjusted by user patterns perform better than the neural network without adjustment?
Q4: Are there performance differences between the neural network models that take the user / message features as input with those that take baseline predictions as input?
Q5: Are there performance differences between the models which make one estimation per timestamp with the models which make one estimation per reading session? 111We defined a reading session as the duration between a user opens a newsletter and closes it or goes to other irrelevant tabs (which are not hyperlinks in the newsletter).
We evaluated various models’ performance on the users they had not seen in training by cross validation. We reached 27% percentage error in reading time estimation with a two-tower neural network based on user interactions only, against the eye-tracking ground truth data, while the heuristic baselines have around 46% percentage error. We found that neural networks’ prediction error is decreased by 2% when adding user pattern features; the models which make one estimation per second perform better than those which make one estimation per reading session. The proposed approach can enable platforms to make message-level reading estimations without extra devices and thus better personalize their contents. 222The dataset and code are available at https://github.com/ruoyankong/reading_region_prediction_dataset.
2. Related Work
2.1. Reading Estimation Based on Eye-tracking Technology
Eye-tracking technology refers to the applications, devices, and algorithms that use user’s eye movement to catch their attention trace (Lai et al., 2013). It has been widely used in information processing tasks, including reading estimation of advertisement (Rayner and Castelhano, 2008), literature (Augereau et al., 2016), social media (Namara and Laurence, 2019), recommendations (Zhao et al., 2016a), etc.
Remote eye-trackers and mobile eye-trackers are often used in reading behavior estimation. The remote eye-trackers use cameras, pupil center, and cornea reflection to track user’s gaze position (Bohme et al., 2006). Example eye-trackers in this category include Tobii-Pro-TX300, which contains separate eye-tracking units 333https://www.tobii.com/products/discontinued/tobii-pro-tx300, or GazeRecorder, which simply uses Webcam 444https://gazerecorder.com/. The mobile eye-trackers are often head-mounted devices that users need to wear and use a camera on the visual path to record the view, such as Tobii Pro Glasses 555https://www.tobii.com/products/eye-trackers/wearables/tobii-pro-glasses-3.
Though eyetrackers provide relatively accurate data on reading estimation, they either ask users to wear/use specific devices or allow access to their webcams. These accesses are hard to get on a large scale for platforms, most of which only have access to browser interaction data. Therefore there is a need to build message-level reading estimation models based on available browser data.
2.2. Reading Estimation Based on User Interactions
Several studies have been done in estimating reading behaviors (e.g., time, focus area) based on user interactions. Seifert et al. studied which regions of the web pages users focus on when they read Wikipedia and found using single features (mouse position, paragraph position, mouse activity) cannot reach enough accuracy in estimating reading regions (Seifert et al., 2017). Huang et al. and Chen et al. built linear models based on cursor position to estimate user’s gaze coordinates during the web search / browsing (Huang et al., 2012a; Chen et al., 2001). Huang et al. and Liu et al. used cursor position in ranking search results (Huang et al., 2012b; Liu et al., 2015) and found that 60% of the tested queries were benefited by incorporating cursor data or significantly improve clicking prediction accuracy by 5%. Arapakis et al. recorded how users respond to online news and found the distance between mouse cursor and the corresponding news is significantly correlated with user’s interestingness (Arapakis et al., 2014).
However, most of these models did not consider user patterns. For example, the mouse position feature was treated the same for a user who moves mouse frequently versus a user who moves mouse infrequently (Lagun and Agichtein, 2015). Hauger et al.’s work proposes to adjust reading estimations with user behavioral patterns — but only a linear weight model was evaluated on the ground truth (Hauger et al., 2011). In fact, most of these studies focused on learning statistical correlations or only evaluated the proposed model’s performance on groundtruth / heuristics. We therefore found a need to evaluate various features and models’ performance on reading estimation systematically.
3. Methods
We defined “reading estimation” as 1) estimating reading time: how much time a user spends on reading each message per session (e.g., a user reads a message for 5 seconds); 2) classifying read level: whether a user skipped or skimmed a message, or read it in detail. Below, we introduced our data collection process (eye-tracking tests) and how we built features, models, and metrics.
3.1. Eye-tracking Tests
We conducted eye-tracking tests to collect interaction data and ground-truth labels. Participants were recruited through 5 mailing lists of the university employees / in-person contacts of the research team 666This study is determined as non-human subject research by the university’s IRB. We excluded the university’s communication professionals, as they might have processed the test messages. The selected participants were invited to the university’s usability lab.
Each participant then received 8 e-newsletters sampled from a diverse set of senders. The e-newsletters in the pool were selected randomly from the university-wide e-newsletters sent in 2022, containing 3 to 30 messages. During the test, the participants’ gaze positions were tracked by Tobii-TX300. They were asked to read as naturally as possible and read at least 1 message of each e-newsletter in detail. They can move mouse, scroll pages, and click on any hyperlinks. All these interactions were caught by browser Javascript and sent to the backend database (Google Firebase) in real-time. They can spend at most 30 minutes reading these e-newsletters and can leave anytime if they finish reading. The research team labeled the message located at the participants’ gaze positions per second and calculated the reading time of each message as the ground truth.
After each eye-tracking test, we retrained our models to check whether we got improvements in model performance. We stopped recruiting when we did not observe further improvements in the models’ performance (see section 4). We conducted 9 eye-tracking tests finally, which resulted in a 200k dataset (one data point for each message’s reading status per second).
3.2. Features
To consider which interaction features a model solely based on user interactions can use, we identified the data a browser can collect in a reading session. They can be classified into a 2x4 category: temporary/sessional features x pattern / user / message / baseline features.
Temporary features are collected per timestamp (each second for our case, e.g., the mouse position at time t). Sessional features are summaries of a reading session (e.g., the total number of seconds a message is visible on window in a reading session). User features represent user’s status (e.g., mouse position). Message features represent message’s status (e.g., message’s position). Pattern features represent user’s real-time behavioral patterns (e.g., mouse moving frequency until the latest timestamp). Baseline features represent the estimation given by the baselines — the heuristics found to be correlated in the previous literature (Buscher et al., 2010; Seifert et al., 2017; Huang et al., 2012a) (e.g., the share of a message on window). See the github repository for feature definitions.
3.3. Models
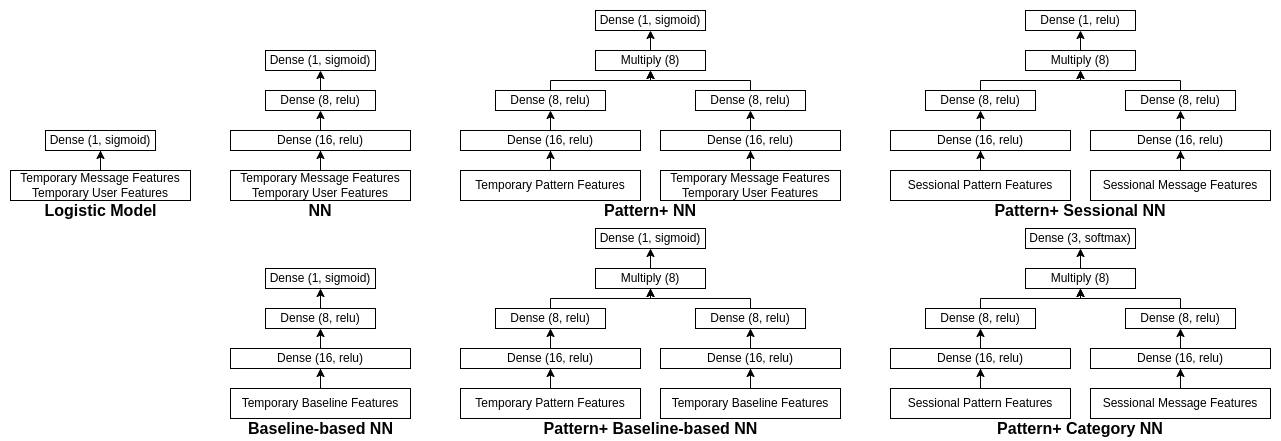
We considered a list of reading estimation models that use the interaction features above (Figure 2).
3.3.1. Per-Timestamp Models
Per-timestamp models estimates the probability of a message being read at each timestamp . We summarize per-timestamp models’ estimations for each message at the end of each reading session to estimate the reading time and read level. Previous work found that message size, message position, and mouse position are usually found to be correlated with reading behavior (Buscher et al., 2010; Seifert et al., 2017; Huang et al., 2012a). Thus we started from 3 baselines: = message ’s current share of window area (baseline 1); is weighted by the reverse of ’s distance to the window center(baseline2); if is closest to user mouse (baseline 3).
Logistic Model: it takes temporary message/user features as inputs, as outputs.
After that, we considered neural networks to learn more complex decision boundaries.
Baseline-based NN: A fully connected neural network which takes temporary baseline features as inputs and as outputs.
Then we tried using pattern features to learn which neurons’ outputs are important.
Pattern+ Baseline-based NN: A two-tower NN that takes baseline features in one tower and pattern features in another, then merges these two towers (multiply), and finally outputs .
We also tried inputting user temporary interaction features directly as below.
Neural Network (NN): A fully connected NN which takes temporary message / user features.
Pattern+ NN: A two-tower NN that takes temporary message/user features in one tower and pattern features in another, then merges these two towers (multiply), and finally outputs .
Read Level: The reading time of a message in a reading session to is defined as . Given message ’s number of words (), its (skip/skim/read-in-detail) for a user is separated by the reading speed 400 words / minute and 200 words / minute. These limits are selected based on the 70% and 80% comprehension levels in (Nocera et al., 2018). And read means a message is either skimmed or read-in-detail by a user.
3.3.2. Per-Session Models
Instead of making one estimation at each timestamp, we can also make one estimation per reading session.
Pattern+ Sessional NN: A two-tower NN that takes sessional message features in one tower and sessional pattern features in another, then merges these two towers (multiply), and finally outputs reading time in a fully-connected ReLu layer.
Pattern+ Category NN: A two-tower NN that takes sessional message features in one tower and sessional pattern features in another, then merges these two towers (multiply), and finally outputs in a fully-connected softmax layer.
3.3.3. Metrics
For per message in per reading session, we measured the error of estimating reading time and the accuracy of classifying read-level category (skip/skim/read-in-detail), see Table 1.
| Metric | Definition | ||||
|---|---|---|---|---|---|
|
|
||||
|
|
||||
|
|
||||
|
e.g., | ||||
|
e.g., |
4. Results
After collecting and labeling the data, we trained the models and compared their performance. We used the Adam optimizer, a batch size of 64, 50 epochs with early stop. We sampled the split of train/validation/test set for 72 rounds — for each round, one participant’s data were used as test set, and the rest participant’s data were split into train set and validation set with a ratio of 7:1 based on reading sessions. The weight of positive samples is set as 20, given that each newsletter contains approximately 20 messages on average, and the user is reading one message at any time.
The average performance of all the proposed models is shown in Table 2, and the pair-wise t-tests’ results between these models are shown in Table 3. Per-timestamp neural network models (Baseline-based NN, Pattern+ Baseline-based NN, NN, Pattern+ NN) have relatively higher overall performance compared to other models. Pattern+ Category NN’s accuracy is only 47%, which might indicate that making one estimation on the read level category per session does not utilize information efficiently.
In short, for the main research question, we can reach approximately 27% percentage error in reading time estimation with models based on user interactions only, compared to the ground truth of using an eyetracker, while the heuristic baselines reach around 43-46% percentage error. Specifically, with Pattern+ NN, which uses user interaction features as input and adjusts their weights with user behavioral patterns, for reading time estimation, we reached 27% in percentage error and 1.7 seconds in absolute error; for read level classification, we reached 79% in read category precision and 68% in read category recall.
| model |
|
|
|
|
|
|
|
|
|
|||||||||||||||||||||||||||
|---|---|---|---|---|---|---|---|---|---|---|---|---|---|---|---|---|---|---|---|---|---|---|---|---|---|---|---|---|---|---|---|---|---|---|---|---|
| Baseline1 | 43% | 2.1s | 83% | 47% | 32% | 39% | 27% | 69% | 50% | |||||||||||||||||||||||||||
| Baseline2 | 45% | 2.5s | 81% | 36% | 24% | 42% | 31% | 67% | 48% | |||||||||||||||||||||||||||
| Baseline3 | 46% | 2.3s | 83% | 49% | 43% | 33% | 40% | 66% | 59% | |||||||||||||||||||||||||||
|
38% | 2.5s | 82% | 45% | 42% | 64% | 51% | 64% | 58% | |||||||||||||||||||||||||||
|
30% | 1.8s | 86% | 59% | 51% | 67% | 65% | 77% | 68% | |||||||||||||||||||||||||||
|
28% | 1.7s | 87% | 63% | 55% | 69% | 64% | 79% | 70% | |||||||||||||||||||||||||||
| NN | 27% | 1.7s | 87% | 65% | 54% | 71% | 63% | 81% | 68% | |||||||||||||||||||||||||||
|
27% | 1.7s | 87% | 64% | 55% | 71% | 62% | 79% | 68% | |||||||||||||||||||||||||||
|
\ | \ | 47% | 22% | 69% | 34% | 3% | 32% | 72% | |||||||||||||||||||||||||||
|
61% | 3.1s | 78% | 36% | 26% | 30% | 10% | 57% | 34% |
We then compared the relative pairs of models’ performance according to questions Q1 to Q5 (see section 1). The comparison results are shown in Table 3. We summarized our answers below.
|
model1 | model2 |
|
|
|
|
|
|
|
|
|
|||||||||||||||||||||||||||||
|---|---|---|---|---|---|---|---|---|---|---|---|---|---|---|---|---|---|---|---|---|---|---|---|---|---|---|---|---|---|---|---|---|---|---|---|---|---|---|---|---|
| Q1 | Baseline1 |
|
|
|
|
|
|
|
|
|
|
|||||||||||||||||||||||||||||
| Baseline2 |
|
|
|
|
|
|
|
|
|
|
||||||||||||||||||||||||||||||
| Baseline3 |
|
|
|
|
|
|
|
|
|
|
||||||||||||||||||||||||||||||
| Baseline1 | NN |
|
|
|
|
|
|
|
|
|
||||||||||||||||||||||||||||||
| Q2 |
|
NN |
|
|
|
|
|
|
|
|
|
|||||||||||||||||||||||||||||
| Q3 | NN |
|
|
|
|
|
|
|
|
|
|
|||||||||||||||||||||||||||||
|
|
|
|
|
|
|
|
|
|
|
||||||||||||||||||||||||||||||
| Q4 |
|
|
|
|
|
|
|
|
|
|
|
|||||||||||||||||||||||||||||
| Q5 |
|
|
|
|
|
|
|
|
|
|
|
|||||||||||||||||||||||||||||
|
|
\ | \ |
|
|
|
|
|
|
|
Q1: Do machine learning models perform better than the heuristic baselines?
Yes, the logistic model and neural network models perform better than the heuristic baselines on most of the numerical and classification metrics. For example, compared to baseline 1 (heuristic estimation based on window share), NN significantly improved per_error from 43% to 27%, read_precision from 69% to 81%, read_recall from 50% to 68%, etc. Though the logistic model does not perform better than baseline1 on abs_error, the NN model performs better than the baselines on all the metrics.
Q2: Do neural network models perform better than the logistic model?
Yes, the neural network model performs better than the logistic model on almost all the numerical and classification metrics (similar performance on detail_precision). For example, compared to the logistic model, NN significantly improves per_error from 38% to 27%, abs_error from 2.5s to 1.7s, accuracy from 82% to 87%, etc.
Q3: Do neural network models adjusted by user patterns perform better than the single-tower neural network models?
Yes for the NN that takes baselines as input but not for the NN that takes message/user features as input. The baseline neural network adjusted by user pattern features further improves the baseline neural network on the absolute error and skim prediction (marginally) significantly: per_error (30% to 28%), skim_recall (51 to 55%). There is no significant performance difference between NN and Pattern+ NN.
Q4: Are there performance differences between the neural network models that take the user / message features as input with those that take baseline features as input?
No, the pattern+ neural network that takes baseline features as input performs similarly to the pattern+ NN that takes user / message features as input.
Q5: Are there performance differences between the models which make one estimation per timestamp with the models which make one estimation per reading session?
Yes, the models that make one estimation for each reading session perform significantly worse than the models that make one estimation each second (see Table 3). For example, Pattern+ Sessional NN’s per_error is 61% compared to Pattern+ NN’s 27%, accuracy is 78% versus Pattern+ NN’s 87%.
Here we reported the trends of our models’ performance during the data collection process. We recruited participants in 4 rounds. After each round, we retrained the models and evaluated their performance with the training/testing process above. Table 4 is the performance trend of the Pattern+ Baseline-based NN model. In these 4 rounds, we see improvements mainly in model per_error (36% to 28%), abs_error (2.1s to 1.7s). We stopped when we did not observe further improvements on per_error and abs_error.
| round |
|
|
|
|
|
|
|
|
|
|
|||||||||||||||||||||||||||||
|---|---|---|---|---|---|---|---|---|---|---|---|---|---|---|---|---|---|---|---|---|---|---|---|---|---|---|---|---|---|---|---|---|---|---|---|---|---|---|---|
| 1 | 2 | 36% | 2.1s | 87% | 55% | 54% | 65% | 65% | 70% | 67% | |||||||||||||||||||||||||||||
| 2 | 5 | 30% | 2.0s | 84% | 61% | 52% | 39% | 38% | 74% | 63% | |||||||||||||||||||||||||||||
| 3 | 7 | 28% | 1.7s | 86% | 67% | 52% | 65% | 67% | 80% | 66% | |||||||||||||||||||||||||||||
| 4 | 9 | 28% | 1.7s | 87% | 63% | 55% | 69% | 64% | 79% | 70% |
5. Discussion
5.1. Per-Timestamp and Per-Session Models.
We found that the models which make one estimation per second (and summarize the estimations at the end of each session) perform significantly better than the models which make one estimation per session. The reason that per-timestamp models outperform per-session models might be that the per-session models fail to utilize a large part of the information that can be collected per timestamp. In the previous work on learning user’s reading interests (either through duration data collected by eye-trackers or interaction data), the estimations are often made per session instead of per timestamp (Arapakis et al., 2014; Augereau et al., 2016; Liu et al., 2015; Li et al., 2017). Therefore we suggested future work on reading estimation tasks to evaluate both the per-timestamp and per-session models. Meanwhile, as per-timestamp models need more computing resources compared to per-session models, future studies can also consider online learning (Lee et al., 2019; Kong et al., 2021a) to balance model performance and complexity.
5.2. Improve accuracy by more features and more data.
We also found that users’ behavioral pattern features helped the Baseline-based neural network to further decrease its error on reading time estimation. This result shows that user contexts could be used in improving reading estimation. Besides user behavioral patterns, other potential contexts to be considered included user’s intent (Kong et al., 2021b) (e.g., search queries (He et al., 2023a, b)), preference (e.g., user’s preference for movie genres (Zhao et al., 2016a, b)), item’s features (e.g., product ratings (Shahriar et al., 2020; Jin et al., 2021), movies tags (Aridor et al., 2022)).
5.3. Limitations and Future Work
We only collected eye-tracking data on 9 users therefore the dataset we collected might not catch enough variance on user patterns. Future work should look at where the value of additional users starts to decay significantly.
6. Conclusion
We studied how to estimate message-level reading time and read level of digital newsletters using user interactions extracted by browser JavaScript (e.g., mouse scroll, click, and hover actions). We applied the accurate but hard-to-scale eye-tracking data to learn the association between user interactions and reading time. We conducted 9 eye-tracking tests and collected 200k per-second participants’ reading (gaze position) and interaction datapoints. The dataset will be public.
We reached a 27% percentage error in reading time estimation with a two-tower neural network based on user interactions only, while the heuristic baselines have around 43% to 46% percentage error. We found that 1) the per-timestamp models perform significantly better than the per-session models; 2) the neural networks’ performance might be further improved by adjusting them with user pattern features. This paper 1) provides examples of generalizing eye-tracking data to build reading estimation approaches that use browser-extracted features only and thus can be applied on a large scale; 2) give insights for future reading estimation studies on designing features / models.
Acknowledgements.
This work was supported by the National Science Foundation under grant CNS-2016397. We thank the University of Minnesota’s Usability Lab’s User Experience Analysts, Nick Rosencrans, and David Rosen, for their assistance with eye-tracking technology.References
- (1)
- Arapakis et al. (2014) Ioannis Arapakis, Mounia Lalmas, and George Valkanas. 2014. Understanding Within-Content Engagement through Pattern Analysis of Mouse Gestures. In Proceedings of the 23rd ACM International Conference on Conference on Information and Knowledge Management (Shanghai, China) (CIKM ’14). Association for Computing Machinery, New York, NY, USA, 1439–1448. https://doi.org/10.1145/2661829.2661909
- Aridor et al. (2022) Guy Aridor, Duarte Gonçalves, Daniel Kluver, Ruoyan Kong, and Joseph Konstan. 2022. The Economics of Recommender Systems: Evidence from a Field Experiment on MovieLens. arXiv preprint arXiv:2211.14219 (2022).
- Augereau et al. (2016) Olivier Augereau, Kai Kunze, Hiroki Fujiyoshi, and Koichi Kise. 2016. Estimation of english skill with a mobile eye tracker. In Proceedings of the 2016 ACM International Joint Conference on Pervasive and Ubiquitous Computing: Adjunct. 1777–1781.
- Bohme et al. (2006) Martin Bohme, André Meyer, Thomas Martinetz, and Erhardt Barth. 2006. Remote eye tracking: State of the art and directions for future development. In Proc. of the 2006 Conference on Communication by Gaze Interaction (COGAIN). 12–17.
- Buscher et al. (2010) Georg Buscher, Ralf Biedert, Daniel Heinesch, and Andreas Dengel. 2010. Eye Tracking Analysis of Preferred Reading Regions on the Screen. In CHI ’10 Extended Abstracts on Human Factors in Computing Systems (Atlanta, Georgia, USA) (CHI EA ’10). Association for Computing Machinery, New York, NY, USA, 3307–3312. https://doi.org/10.1145/1753846.1753976
- Cardillo (2006) G Cardillo. 2006. Holm-Sidak t-test: a routine for multiple t-test comparisons. Disponible en Matlab Central, en la página de la Red Mundial: http://www. mathworks. de/matlabcentral/fileexchange/12786 (Consultado el 22 de Noviembre 2009) (2006).
- Chen et al. (2001) Mon Chu Chen, John R Anderson, and Myeong Ho Sohn. 2001. What can a mouse cursor tell us more? Correlation of eye/mouse movements on web browsing. In CHI’01 extended abstracts on Human factors in computing systems. 281–282.
- Funke et al. (2016) Gregory Funke, Eric Greenlee, Martha Carter, Allen Dukes, Rebecca Brown, and Lauren Menke. 2016. Which eye tracker is right for your research? performance evaluation of several cost variant eye trackers. In Proceedings of the Human Factors and Ergonomics Society annual meeting, Vol. 60. SAGE Publications Sage CA: Los Angeles, CA, 1240–1244.
- Gibaldi et al. (2017) Agostino Gibaldi, Mauricio Vanegas, Peter J Bex, and Guido Maiello. 2017. Evaluation of the Tobii EyeX Eye tracking controller and Matlab toolkit for research. Behavior research methods 49, 3 (2017), 923–946.
- Hauger et al. (2011) David Hauger, Alexandros Paramythis, and Stephan Weibelzahl. 2011. Using browser interaction data to determine page reading behavior. In International conference on user modeling, adaptation, and personalization. Springer, 147–158.
- He et al. (2023a) Yunzhong He, Yuxin Tian, Mengjiao Wang, Feier Chen, Licheng Yu, Maolong Tang, Congcong Chen, Ning Zhang, Bin Kuang, and Arul Prakash. 2023a. Que2Engage: Embedding-based Retrieval for Relevant and Engaging Products at Facebook Marketplace. Proceedings of the ACM Web Conference 2023 (2023).
- He et al. (2023b) Yunzhong He, Cong Zhang, Ruoyan Kong, Chaitanya Kulkarni, Qing Liu, Ashish Gandhe, Amit Nithianandan, and Arul Prakash. 2023b. HierCat: Hierarchical Query Categorization from Weakly Supervised Data at Facebook Marketplace. In Companion Proceedings of the ACM Web Conference 2023. 331–335.
- Huang et al. (2012a) Jeff Huang, Ryen White, and Georg Buscher. 2012a. User see, user point: gaze and cursor alignment in web search. In Proceedings of the SIGCHI conference on human factors in computing systems. 1341–1350.
- Huang et al. (2012b) Jeff Huang, Ryen W White, Georg Buscher, and Kuansan Wang. 2012b. Improving searcher models using mouse cursor activity. In Proceedings of the 35th international ACM SIGIR conference on Research and development in information retrieval. 195–204.
- Jin et al. (2021) Ruoming Jin, Dong Li, Benjamin Mudrak, Jing Gao, and Zhi Liu. 2021. On estimating recommendation evaluation metrics under sampling. In Proceedings of the AAAI Conference on Artificial Intelligence, Vol. 35. 4147–4154.
- Kong et al. (2021a) Ruoyan Kong, Zhanlong Qiu, Yang Liu, and Qi Zhao. 2021a. NimbleLearn: A Scalable and Fast Batch-mode Active Learning Approach. In 2021 International Conference on Data Mining Workshops (ICDMW). IEEE, 350–359.
- Kong et al. (2021b) Ruoyan Kong, Ruobing Wang, and Zitao Shen. 2021b. Virtual Reality System for Invasive Therapy. In 2021 IEEE Conference on Virtual Reality and 3D User Interfaces Abstracts and Workshops (VRW). IEEE, 689–690.
- Kong et al. (2022) Ruoyan Kong, Charles Chuankai Zhang, Ruixuan Sun, Vishnu Chhabra, Tanushsrisai Nadimpalli, and Joseph A Konstan. 2022. Multi-Objective Personalization in Multi-Stakeholder Organizational Bulk E-mail: A Field Experiment. Proceedings of the ACM on Human-Computer Interaction 6, CSCW2 (2022), 1–27.
- Kong et al. (2021c) Ruoyan Kong, Haiyi Zhu, and Joseph A Konstan. 2021c. Learning to Ignore: A Case Study of Organization-Wide Bulk Email Effectiveness. Proceedings of the ACM on Human-Computer Interaction 5, CSCW1 (2021), 1–23.
- Konstan and Kong (2023) Joseph A Konstan and Ruoyan Kong. 2023. The Challenge of Organizational Bulk Email Systems: Models and Empirical Studies. In The Elgar Companion to Information Economics. Edward Elgar Publishing.
- Lagun and Agichtein (2015) Dmitry Lagun and Eugene Agichtein. 2015. Inferring searcher attention by jointly modeling user interactions and content salience. In Proceedings of the 38th International ACM SIGIR Conference on Research and Development in Information Retrieval. 483–492.
- Lai et al. (2013) Meng-Lung Lai, Meng-Jung Tsai, Fang-Ying Yang, Chung-Yuan Hsu, Tzu-Chien Liu, Silvia Wen-Yu Lee, Min-Hsien Lee, Guo-Li Chiou, Jyh-Chong Liang, and Chin-Chung Tsai. 2013. A review of using eye-tracking technology in exploring learning from 2000 to 2012. Educational research review 10 (2013), 90–115.
- Lee et al. (2019) Seulki Lee, Bashima Islam, Yubo Luo, and Shahriar Nirjon. 2019. Intermittent learning: On-device machine learning on intermittently powered system. Proceedings of the ACM on Interactive, Mobile, Wearable and Ubiquitous Technologies 3, 4 (2019), 1–30.
- Li et al. (2017) Yixuan Li, Pingmei Xu, Dmitry Lagun, and Vidhya Navalpakkam. 2017. Towards measuring and inferring user interest from gaze. In Proceedings of the 26th International Conference on World Wide Web Companion. 525–533.
- Liu et al. (2015) Yiqun Liu, Ye Chen, Jinhui Tang, Jiashen Sun, Min Zhang, Shaoping Ma, and Xuan Zhu. 2015. Different Users, Different Opinions: Predicting Search Satisfaction with Mouse Movement Information. In Proceedings of the 38th International ACM SIGIR Conference on Research and Development in Information Retrieval (Santiago, Chile) (SIGIR ’15). Association for Computing Machinery, New York, NY, USA, 493–502. https://doi.org/10.1145/2766462.2767721
- Namara and Laurence (2019) Moses Namara and Curtis John Laurence. 2019. What Do You See? An Eyetracking study of a Tailored Facebook Interface for Improved Privacy Support. In ACM Symposium on Eye Tracking Research & Applications (ETRA)(2019), Vol. 7.
- Nocera et al. (2018) Francesco Di Nocera, Orlando Ricciardi, and James F Juola. 2018. Rapid serial visual presentation: Degradation of inferential reading comprehension as a function of speed. International Journal of Human Factors and Ergonomics 5, 4 (2018), 293–303.
- Othman et al. (2020) Youssef Othman, Mahmoud Khalaf, Ahmed Ragab, Ahmed Salaheldin, Reham Ayman, and Nada Sharaf. 2020. Eye-To-Eye: Towards Visualizing Eye Gaze Data. In 2020 24th International Conference Information Visualisation (IV). IEEE, 729–733.
- Rayner and Castelhano (2008) Keith Rayner and Monica S Castelhano. 2008. Eye movements during reading, scene perception, visual search, and while looking at print advertisements. (2008).
- Seifert et al. (2017) Christin Seifert, Annett Mitschick, Jörg Schlötterer, and Raimund Dachselt. 2017. Focus paragraph detection for online zero-effort queries: Lessons learned from eye-tracking data. In Proceedings of the 2017 Conference on Conference Human Information Interaction and Retrieval. 301–304.
- Shahriar et al. (2020) ABM Fahim Shahriar, Mahedee Zaman Moon, Hasan Mahmud, and Kamrul Hasan. 2020. Online product recommendation system by using eye gaze data. In Proceedings of the International Conference on Computing Advancements. 1–7.
- Zhao et al. (2016b) Hongke Zhao, Qi Liu, Yong Ge, Ruoyan Kong, and Enhong Chen. 2016b. Group preference aggregation: A nash equilibrium approach. In 2016 IEEE 16th International Conference on Data Mining (ICDM). IEEE, 679–688.
- Zhao et al. (2016a) Qian Zhao, Shuo Chang, F Maxwell Harper, and Joseph A Konstan. 2016a. Gaze prediction for recommender systems. In Proceedings of the 10th ACM Conference on Recommender Systems. 131–138.