On More than Two Decades of Celestial Reference Frame VLBI Observations in the Deep South: IVS-CRDS (1995 - 2021)
Abstract
The International VLBI Service for Geodesy & Astrometry (IVS) regularly provides high-quality data to produce Earth Orientation Parameters (EOP), and for the maintenance and realization of the International Terrestrial and Celestial Reference Frames, ITRF and ICRF. The first iteration of the celestial reference frame (CRF) at radio wavelengths, the ICRF1, was adopted by the International Astronomical Union (IAU) in 1997 to replace the FK5 optical frame. Soon after, the IVS began official operations and in 2009 there was a significant increase in data sufficient to warrant a second iteration of the CRF, ICRF2. The most recent ICRF3, was adopted by the IAU in 2018. However, due to the geographic distribution of observing stations being concentrated in the Northern hemisphere, CRFs are generally weaker in the South due to there being fewer Southern Hemisphere observations. To increase the Southern Hemisphere observations, and the density, precision of the sources, a series of deep South observing sessions was initiated in 1995. This initiative in 2004 became the IVS Celestial Reference Frame Deep South (IVS-CRDS) observing program. This paper covers the evolution of the CRDS observing program for the period 1995 to 2021, details the data products and results, and concludes with a summary of upcoming improvements to this ongoing project.
keywords:
VLBI, IVS, GeodesyJoint first authors S. Weston]sweston@aut.ac.nz \alsoaffiliationJoint first authors \alsoaffiliationChalmers University of Technology/Onsala Space Observatory, 439 92 Onsala, Sweden \alsoaffiliationChalmers University of Technology/Onsala Space Observatory, 439 92 Onsala, Sweden
1 Introduction
Very Long Baseline Interferometry (VLBI) is a collaborative and cooperative endeavour involving many individuals and institutions around the world. Part of this cooperation and collaboration, using VLBI observations of extragalactic radio sources to conduct geodesy and astrometry, has been formalised under the umbrella of the International VLBI Service for Geodesy and Astrometry Nothnagel2017 (45), which has organized this cooperation over the past 23 years. The IVS provides products derived from the analysis of VLBI data to the scientific community, of which some of the main products are:
-
1.
Accurate measurements of station positions and velocities which contribute significantly to the realization of the International Terrestrial Reference Frame (itrf2020, 3, ITRF,), in particular to the definition of its scale
-
2.
Accurate measurements of the angular positions of extragalactic radio sources which define and realize the International Celestial Reference Frame (Charlot_2020, 17, ICRF,)
-
3.
The five daily Earth Orientation Parameters (Eubanks1993, 23, EOP,), including Earth rotation parameter and nutation which are provided uniquely, which provides the link between the ICRF and the ITRF
The ICRF is a catalogue of positions of extragalactic radio sources with the highest precision, which are crucial to many applications. For example, the ICRF provides sources that are observed in the geodetic VLBI observations conducted by the IVS to measure the orientation of Earth in space and station motions Hellmers2021 (35), which in turn contributes to the realization of the ITRF and allows studies of the motion of the tectonic plates and the interior of the Earth Carter1993 (14), and measurements of the ionosphere and troposphere which allows for atmospheric studies Heinkelmann2011J (34). High-accuracy celestial reference frames are also crucial for many other applications such as satellite tracking, orbit determination, and deep-space navigation Thornton2000 (55), alignment of the planetary ephemerides Park2021 (46), studies of special and general relativity Fomalont2009 (26) such as Galacto-centric acceleration MacMillan2019 (41), and for phase-referencing observations in astronomy Beasley1995 (9, 51).
The first iteration of the ICRF (Ma1998, 39, ICRF1,) was based on positions of 608 extragalactic radio sources, of these a subset of 212 sources uniformly distributed on the sky were identified as ”defining sources”, and served to define the axes of the reference frame. This iteration used data obtained through VLBI observations at the standard geodetic and astrometric S/X-band (2.3/8.4 GHz) frequencies. The ICRF1 was adopted by the International Astronomical Union (IAU) as the new fundamental CRF in 1997, and replaced IAU’s Fundamental Catalogue FK5 Fricke1988 (27), which was based on optical observations of galactic stars. The IVS began operations in 1999, and coordinated continued S/X-band observations and improvements on the original ICRF. As a result a second iteration, the ICRF2 Fey2015 (24) with 3414 sources of which 295 are defining sources, was adopted by the IAU in 2009 and officially replaced the ICRF1 on 01 January 2010. Since the first release of ICRF, the ongoing observing programs run by the IVS together with other specific independent projects have ensured the continued expansion of the VLBI database, and as such a third iteration, the ICRF3 Charlot_2020 (17) was adopted by the IAU in 2018 (see Resolution B2111See Resolution B2 at https://iau.org/static/resolutions/IAU2018_ResolB2_English.pdf.) and replaced the ICRF2 on 01 January 2019. The ICRF3 is based on nearly 40 years of data and contains S/X positions of 4536 extragalactic sources, including 303 uniformly distributed defining sources. The ICRF3 has a noise floor of 30 µas, with median position uncertainties at S/X-band of about 127 µas in right ascension and 218 µas in declination – more than a factor of three improvement over the ICRF2. In addition, the ICRF3 added two complementary catalogues at K-band (24 GHz) and X/Ka-band (32 GHz), making it the first multi-wavelength frame ever realized. Since ICRF3 there have been many dedicated efforts to further improve the CRF at radio wavelengths, and current CRF solutions (Gordon2022, 30, e.g. sx-usno-220422,) already show a remarkable improvement over the ICRF3 deWitt2022 (21, 30).
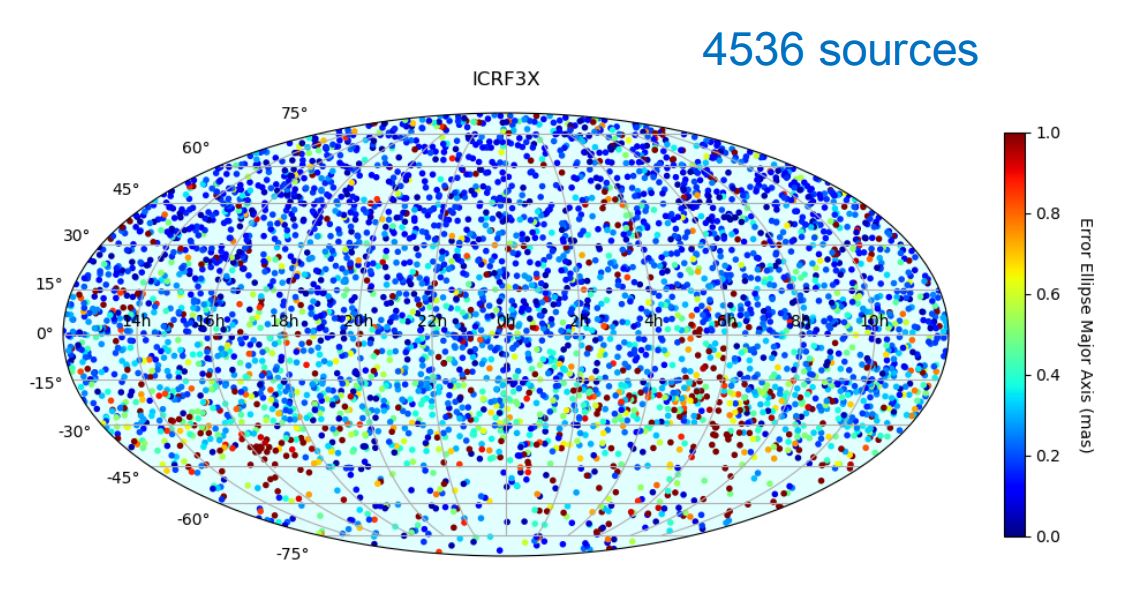
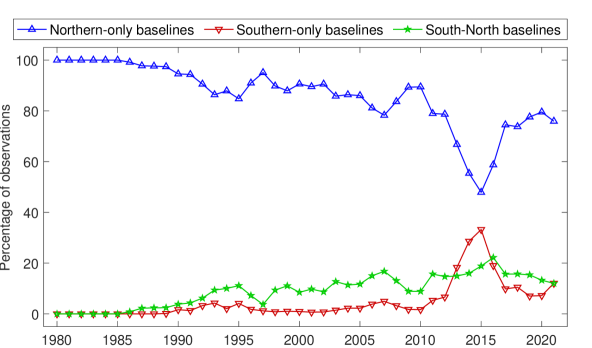
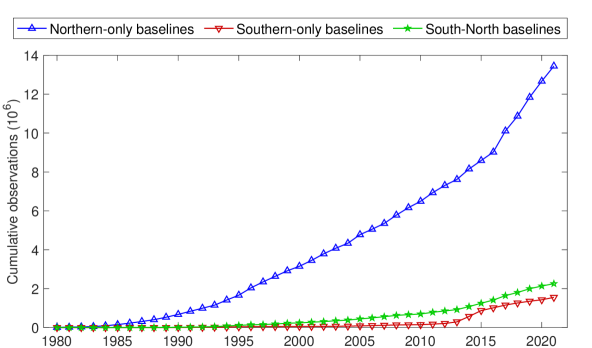
Catalogues of compact radio sources, including the ICRF3, are generally weaker in the South by factors of 2 or more in both density and precision deWitt2022 (21). This is because the stations contributing to geodetic and astrometric VLBI observations have an uneven distribution between the hemispheres, currently 80 of the stations are in the Northern Hemisphere and 20 of the stations are in the Southern Hemisphere. As a result, and despite the significant improvements over its predecessor, the ICRF3 still has deficiencies by factors of 2–3 in the South Charlot2018 (16, 17). In addition, the deficit of long North-South baselines in the ICRF3 contributes to the Declination (Dec) precision being a factor of two or more worse than the Right Ascension (RA) precision. The distribution of the ICRF3 S/X-band sources on a projection of the celestial sphere clearly shows the decrease in the number of sources and the number of observations per source for sources below Dec, and shows that Southern sources have generally less precise positions Charlot_2020 (17) (see Figure 6 reproduced here in Figure 1222https://www.aanda.org/articles/aa/full_html/2020/12/aa38368-20/F6.html). When looking at a world map of all 167 antennas (situated on 126 different sites) that participated in the observations used for ICRF3 (see Figure 1333https://www.aanda.org/articles/aa/full_html/2020/12/aa38368-20/F1.html in Charlot_2020 (17)), the uneven distribution of antennas between the hemispheres is very apparent. Of those 167 antennas, only 14 antennas contributed from the Southern Hemisphere. The plots in Figure 2 show the number of observations for North-only, South-only and North-South baselines for all astrometric and geodetic VLBI observations between April 1980 and June 2021. The plot clearly shows the disparity between the number of Northern and Southern observations, with only 20% of the observations coming from North-South baselines and only 10% from all Southern baselines.
The Southern Hemisphere also suffers from a lack of dedicated imaging campaigns to map and monitor the structure of individual ICRF sources. Many ICRF sources exhibit spatially extended intrinsic structure that may vary with time and frequency. It is well known that source structure can introduce significant errors in the geodetic and astrometric VLBI delay measurements and instabilities in the individual source positions Charlot1990 (15, 28, 58). It is therefore important to map the structures of these sources on a regular basis to assess the astrometric source suitability and to track the source structure variations over time. There have, however, only been a few imaging sessions of ICRF sources in the South Hungwe2011 (36, 49) and dedicated campaigns to map and monitor source structure have proven difficult to obtain. Nevertheless, recent investigations to image source structure from existing astrometric and geodetic observations in the South have shown that dedicated imaging campaigns, as are done in the North, may indeed be possible Basu2016 (8, 6).
Since its inception, the IVS has initiated and coordinated many observing programs intended to provide astrometric observations useful in improving and densifying the CRF. Dedicated Southern Hemisphere astrometric programs proved most successful in providing and maintaining the fundamental Southern Hemisphere reference frame for the ICRF. In particular, the Celestial Reference Frame Deep South (CRF-DS) observing sessions were initiated in 1995 and became the IVS-CRDS observing program in 2004 (henceforth called CRDS). The CRDS program aims to provide astrometric VLBI observations of sources in the deep South for improving and densifying the ICRF, and in recent years it has also contributed to the imaging and monitoring of source structure.
This paper provides the details and evolution of the CRDS observing program for the period June 1995 to December 2021, as well as details on the data products and results. Section 2 provides a timeline overview of the evolution and major developments of the CRDS observing program from the early sessions that started in June 1995 up to December 2021. In Section 3 we discuss the methods employed in detail. This consists of the the participating networks and stations (§ 3.1), source selection (§ 3.2) and scheduling strategies (§ 3.3). Details of the data correlation, analysis and data products are provided in § 3.4. A discussion about the CRDS observing program results to date and remarks are given in Section 4. This consists of the astrometric results (§ 4.1) and imaging results (§ 4.2), and finally an overview of the network performance (§ 4.3). A final discussion of the CRDS program to date and future plans to improve the observing program to further densify and strengthen the Southern CRF are discussed in Section 5.
2 Detailed CRDS Observing Timeline
This section provides an overview of the evolution and major developments of the CRDS observing program from the early sessions that started in June 1995 up to December 2021. Details include the network coverage and participating stations over this period, as well as any improvements and changes in the frequency sequence, data rates, and scheduling strategies.
2.1 From June 1995 (CRF-DS1) to December 2010 (CRDS49)
The CRDS sessions started with two sessions each in 1995 and 1996. The first 9 sessions in this initial period were called CRF-DS1 to CRF-DS9. There was a gap of 7 years until 2003 then some 45 sessions were run between 2003 and 2008 (CRF-DS5 to CRDS49). These early sessions were scheduled by the United States Naval Observatory (USNO). Most were single-baseline sessions between the HartRAO 26-antenna in Hartebeesthoek, South Africa and the Hobart 26-m antenna in Tasmania, Australia, but a few included other stations, such as the Parkes 64-m antenna in New South Wales, Australia and the Deep Space Station 45 (DSS45) in Tidbinbilla, Australia. These early sessions made significant contributions to ICRF2, being almost the only sessions to add new Southern sources. There were no CRDS sessions in 2009 or 2010 because the HartRAO 26-m antenna suffered a major bearing failure and was down for more than two years for repairs.
2.2 From March 2011 (CRDS50) to May 2017 (CRDS88)
In the late 2000s a group of three new 12-m VLBI antennas (Yarragadee 12-m, Katherine 12-m and Hobart 12-m), called the AuScope array Lovell2013 (38), were commissioned by the University of Tasmania in Australia. An identical antenna, the Warkworth 12-m, was also commissioned in Warkworth, New Zealand wark12m (32). Between July 2011 and November 2012 (CRDS52-61), one or two at a time of these 12-m antennas were scheduled in the CRDS sessions. The two sessions before July 2011 (CRD50-51) consisted of single-baseline observations between the HartRAO 26-m and Hobart 26-m antenna. In 2013 all four 12-m antennas were added to the CRDS observing program. Very importantly, this increased the number of regular CRDS stations from 2 to 6, and also allowed a greater cadence of source observing within a 24-hour geodetic or astrometric VLBI session due to the much faster slew speeds of the 12-m antennas. Between January 2013 and May 2017, twenty-six CRDS sessions were observed (CRDS62-CRDS88), of which thirteen had the full six-station network, seven had five stations participating, and six sessions observed with only 4 stations. The CRDS53 and CRDS61 sessions also included the Parkes 64-m antenna, and the CRDS58 session included the Deep Space Station 43 (DSS43) 70-m antenna in Tidbinbilla, Australia. Up to CRDS65 the data recording rate was 128 Mbps, but in July 2013 (CRDS-66) the recording rate was increased to 256 Mbps.
Imaging of sources from CRDS sessions data started in January 2013 (CRDS-63), to analyse source structure and variability, and to update flux catalogues in the South (see § 4.2).
2.3 From July 2017 (CRDS89) to March 2019 (CRD101)
To be fully compliant with the VLBI Global Observing System (Petrachenko2013, 47, VGOS,), the Hobart 12-m antenna was upgraded with a new wide-band cooled receiver (2-14 GHz), and in July 2017 (CRDS-89) it was removed from the CRDS program. Between July 2017 and March 2019 (CRD101), thirteen CRDS sessions were observed of which eleven included all of the remaining five stations. The CRDS94 session also included the HartRAO 15-m antenna. In 2017, a Southern Hemisphere astrometry group, later formalised under the IVS as the Southern VLBI Operations Centre (39thIVSBoardMeeting, 10, 20, SVOC,) was formed, with the aim to improve and densify the S/X-band CRF in the South. This group adopted the following measures over this period to improve the final data products:
-
1.
Increased sensitivity of Southern sessions for detection of weaker sources down to mJy or less.
-
2.
Increased the data rate of Southern sessions by a factor of 8, from 128 Mbps to 1 Gbps
-
3.
Optimized scheduling of Southern sessions to allow for simultaneous astrometric and imaging observations
-
4.
Included mapping and monitoring of source structure in analysis to quantify non-point-like structure
-
5.
Improved precision of Southern source positions by a factor of 2.5
-
6.
Expanded the Southern source list by a factor of 2
-
7.
Improved the sky coverage of Southern sources
-
8.
Improved overlap with higher frequency radio CRFs and Gaia optical CRF
As a result, many improvements were made to the CRDS sessions deWitt2019b (19). From January 2018 (CRDS93), the data recording rate was increased from 256 Mbps to 1 Gbps and the frequency sequence was optimized to avoid radio frequency interference (RFI, see § 3.1) in particular at S-band. In addition the scheduling was improved and the source list was expanded (see § 3.2) with optimisation for both astrometry and imaging (see § 4).
2.4 From May 2019 (CRD102) to July 2021 (CRD113)
In May 2019 (CRD102) the O’Higgins 9-m antenna in Antarctica was added to the CRDS program, and in June 2019 (CRD103), the Katherine 12-m antenna was upgraded for VGOS observations and removed. In February 2020 (CRD105) the Aggo 6-m antenna in Argentina was added to the CRDS network. Between February 2020 (CRD105) and May 2021 (CRDS112), eight CRDS sessions were observed, of which half had five participating stations, and the other half had six stations. In July 2021 (CRD113) the Hobart 26-m antenna was temporarily removed from the CRDS observing program due a bearing failure, and remains out of service at the time of writing this paper. Subsequently, the CRDS113 session was observed with only four stations. The loss of the Hobart 26-m antenna, being one of only two large antennas in the CRDS network (the other being the HartRAO 26-m), has severely impacted the success rate of the CRDS sessions (see § 4).
2.5 From August 2021 (CRD114) to December 2021 (CRD116)
In 2020 the IVS-CRF Committee444https://ivscc.gsfc.nasa.gov/about/com/crfc/index.html was formalised, also incorporating the SVOC, to make recommendations to the IVS Directing Board on observing programs and strategies for the S/X-band CRF Behrend2019 (11, 12). The charter555https://ivscc.gsfc.nasa.gov/about/com/crfc/crfc_charter.pdf for the IVS-CRF Committee was accepted by the IVS Directing Board on 14 October 2020. In 2021 the IVS-CRF Committee made recommendations to add the 25-m Very Long Baseline (VLBA) antennas in Mauna Kea (VLBA-MK) and Saint Croix (VLBA-SC), as well as the 50-m Kunming antenna in China, to the CRDS observing program. In August 2021 (CRD114) the two VLBA antennas were added to the CRDS schedule forming a seven-station network, and in October and December 2021 (CRD115 and CRD116) the 50-m Kunming antenna was also added forming an eight-station network. Unfortunately, the VLBA stations observed with a wrong LO value for S-band channels and the baselines between the VLBA stations and other antennas could not be correlated. Since then, test observations with a revised S-band setup for the VLBA stations were successful, and VLBA-MK and VLBA-SC will be added to future CRDS sessions.
3 Methods
This section details the methods employed in the CRDS program, starting with the setup of the observing network, source selection, scheduling strategies, correlation and finally the analysis undertaken to produce the final data products.
3.1 Observing Networks and Setup
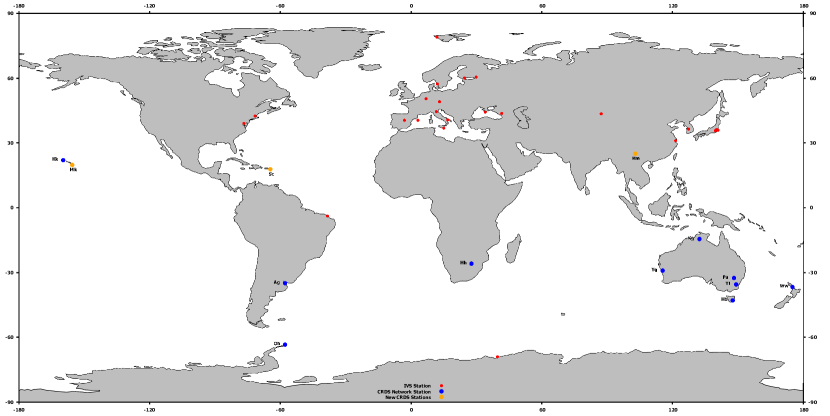
The early CRDS sessions consisted of mostly single-baseline observations between the HartRAO and Hobart 26-m antennas, occasionally including a few other antennas. From 2011 onward, more stations were added to the CRDS sessions and between July 2011 and March 2019 the CRDS program, for the most part, including the following six stations: HartRAO 26-m (Hh), Hobart 26-m (Ho), Hobart 12-m (Hb), Katherine 12-m (Ke), Yarragadee 12-m (Yg), and Warkworth 12-m (Ww), recalling that Hb was removed from the CRDS program in July 2017. Two of these sessions also included the Parkes 64-m antenna (Pa), while the HartRAO 15-m antenna (Ht) and DSS43 Tidbinbilla 70-m antenna (Ti) each participated in a single session. In May 2019 the O’Higgins 9-m antenna (Oh) was added to the CRDS program and in June 2019 Ke was removed. In February 2020 the AGGO 6-m antenna (Ag) was added to the CRDS network. In July 2021 (CRDS113) Ho was temporarily removed from the CRDS observing program due to a bearing failure and in October 2021 the 50-m Kunming antenna (Km) was added. In August 2021 the VLBA-MK (Mk) and VLBA-SC (Sc) antennas were added, but the data from these two antennas could not be correlated with other stations due to a mismatch in the S-band frequency setup. Details of the fourteen IVS VLBI stations that participated in CRDS sessions between July 2011 and December 2021, are listed in Table 1. The full IVS station network is shown in Figure 3, highlighting the stations that participated in the CRDS sessions during this period. Note that all the stations used for CRDS sessions are IVS stations, except for Ti.
| Station | Station | Station Geocentric Coordinate | Solution |
| Code | Name | XYZ (m) | (Epoch) |
| Ag | Aggo 6-m, Observatorio Argentina-Alemán de Geodesia (AGGO), Argentina | 2765116.70 -4449233.81 -3626420.56 | 2020c |
| Hb | Hobart 12-m, University of Tasmania, Australia | -3949990.58 2522421.17 -4311708.24 | 2011b |
| Hh | HartRAO 26-m, Hartebeesthoek, South Africa | 5085442.79 2668263.49 -2768697.04 | GLB1069 |
| Ho | Hobart 26-m, University of Tasmania, Australia | -3950236.74 2522347.56 -4311562.55 | GLB1069 |
| Ht | HartRAO 15-m, Hartebeesthoek, South Africa | 5085490.80 2668161.48 -2768692.62 | 2013 |
| Ke | Katherine 12-m, University of Tasmania, Australia | -4147354.59 4581542.40 -1573303.30 | 2011b |
| Oh | O’Higgins 9-m, ERS/VLBI Station O’Higgins, Antarica | 1525833.48 -2432463.71 -5676174.48 | 2020c |
| Pa | Parkes 64-m, CSIRO, Australia | -4554232.05 2816758.99 -3454035.88 | GLB1069 |
| Ti | 70-m Tidbinbilla (DSS-43), CSIRO, Australia | -4460894.39 2682361.29 -3674747.98 | GLB1069 |
| Ww | Warkworth 12m, AUT University, New Zealand | -5115324.39 477843.30 -3767192.88 | 2011b |
| Yg | Yarragadee 12m, University of Tasmania, Australia | -2388896.06 5043349.97 -3078590.92 | 2011b |
| Mk | Manua Kea VLBA Station, Hawaii, USA | -5464075.28 -2495247.63 2148297.61 | 2020c |
| Sc | St Croix VLBA Station, St Croix, USVI | 2607848.71 -5488069.47 1932739.83 | 2020c |
| Km | Kunming 40m, Yunnan Astronomical Observatory, China | -1281153.12 5640864.43 2682653.37 | 2020c |
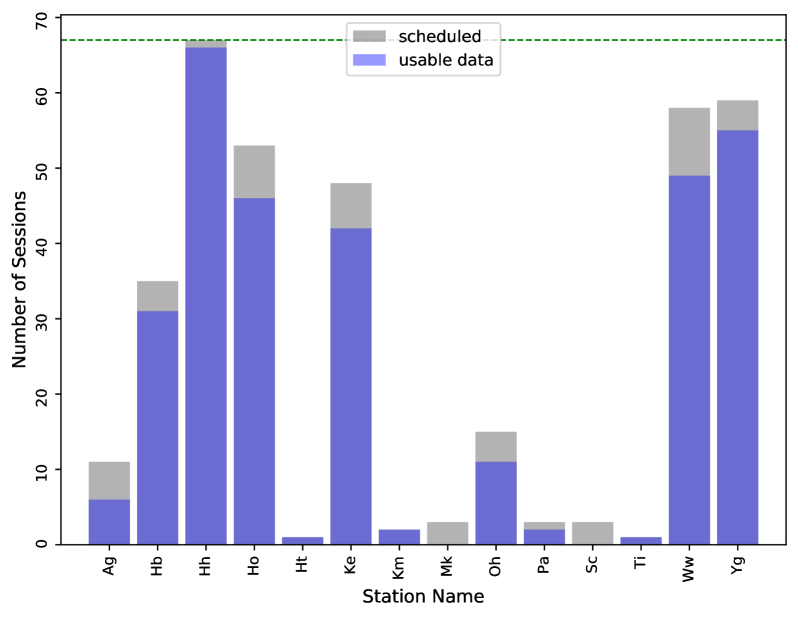
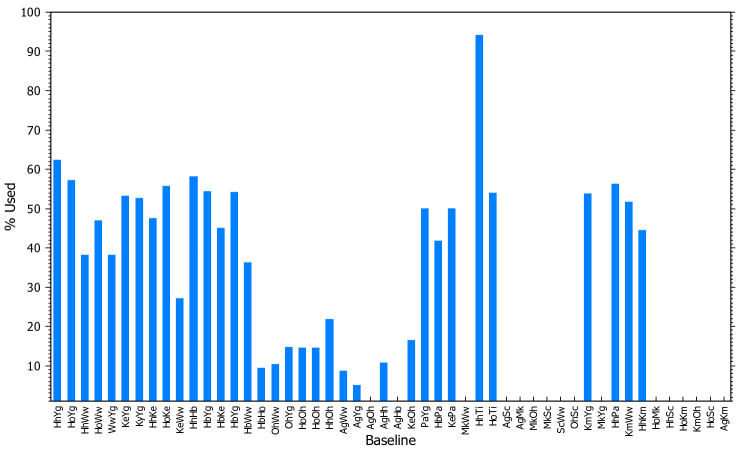
Between the first observations in 1995 and the last session included in this paper (December 2021, CRD116) the CRDS program observed a total of 116 sessions. Between March 2011 and December 2021, 67 CRDS sessions were observed and these were scheduled roughly once every two months – giving six sessions per year, except for 2012 in which seven sessions were scheduled. Each of these sessions was 24-hours in duration and had between 2 and 8 scheduled stations, with an average of 5 stations per session. It is important to note that not all scheduled stations necessarily participated or delivered usable data over the entire 24-hour session, due to various technical issues and outages (see § 4.3). A summary of the number of sessions each station was scheduled in versus the number of sessions it participated in and had usable data for, during the 2011–2021 period, is shown in Figure 4. It can be seen that the faster slewing 12-m antennas (Hb, Ke, Yg and Ww) have taken over the bulk of observing enabling a significant increase in the sources observed within a 24-hour period.
The CRDS sessions are all dual-band (S/X) observations, the S-band is a selection of frequencies from 2.2 - 2.3 GHz and X-band is a selection from 8.2 - 8.9 GHz. Ionosphere corrections are computed from the delay differences between the two bands S and X, these are then applied to the X-band solution for the final data product. Data is recorded in 14 intermediate frequency (IF) bands, consisting of eight X-band (+2 side-bands) and six S-band IFs. Up to May 2013 (CRDS65) the data was recorded with 164 MHz bands at 1-bit, resulting in a data recording rate of 128 Mbps. From July 2013 (CRDS66) the bands were increased to 8 MHz doubling the recording rate to 256 Mbps. In January 2018 (CRDS93) the data recording rate was increased again, from the 256 Mbps (16 8 MHz bands, 1-bit recording) to 1 Gbps (16 16 MHz bands, 2-bit recording) and a total bandwidth of 256 MHz. However, the VLBA antennas can only record a total bandwidth of 128 MHz (4 16 MHz S-band and 16 MHz X-band IF’s). The CRDS frequency sequence was also optimized in January 2018, mainly to avoid RFI. Test observations using different frequency setups were conducted to choose the best. In August 2021 (CRD114) the frequency sequence was updated again, to both accommodate the VLBA antennas and to avoid high side lobes and RFI.
3.2 Source Selection
Between 2011–2017 the sources observed in the CRDS sessions were primarily the 76 ICRF2 defining sources South of Dec. The ICRF2 defining sources were known to be strong ( mJy) and relatively compact. Given the CRDS data rates during this time (128 Mbps and later 256 Mbps) they provided a pool of sufficiently bright sources detectable on even the longest baselines. In addition, there were also 20 ICRF2 non-defining sources that were observed in 2011 (CRDS51-53 and CRDS55). Towards the end of 2017, it was decided to revisit the strategy and review the CRDS program, in particular to expand the CRDS source list. At this point, other IVS programs had also started contributing to Southern observations, which added many more observations of sources in the South. These included for example the AUSTRAL (Plank2017, 50, AUA,) sessions that started in 2011 and the Asia-Oceania VLBI group for Geodesy and Astrometry (McCallum2019, 42, AOV,) sessions which started in 2015. It was therefore decided to use the CRDS program to re-observe all CRF sources South of Dec and to give priority to sources observed in fewer than 10 sessions in order to improve the accuracy of the source positions in both coordinates deWitt2019b (19, 18). Subsequently, in November 2017 (CRDS92) ten additional bright ICRF2 non-defining sources, one of which was also observed in 2011 (CRDS53), were added to the CRDS schedule.
In January 2018 (CRDS93) the CRDS data rate was increased to 1 Gbps giving a factor of two increase in sensitivity. This allowed for weaker sources, down to 350 mJy given an integration time of 6 min, to be included in the schedules. A list of 216 CRF sources South of Dec with 10 observing sessions and with flux densities 350 mJy were added to the CRDS program. This list was revised as updated CRF solutions became available. A few bright K-band and X/Ka-band CRF sources that were not in the S/X-band frame ( 20 sources) were also added to the schedule. The March 2018 (CRDS94) session, by request of the ICRF3 Working Group, was dedicated to observing a list of 31 potential ICRF3 defining sources South of Dec. These 31 sources had only a few observations and no available images, and thus additional observations were required ahead of finalising the ICRF3 catalogue. These observations were repeated for the August and September 2018 (CRDS97 and 98) sessions. From May 2021 (CRD112) onwards, following recommendations from the IVS-CRF committee, only ICRF3 defining sources South of Dec were observed in the CRDS sessions in order to re-assess their suitability as defining sources in preparation for an ICRF-4. The sessions between 2018–2021 (CRDS93–116) added an additional 237 sources to the CRDS program.
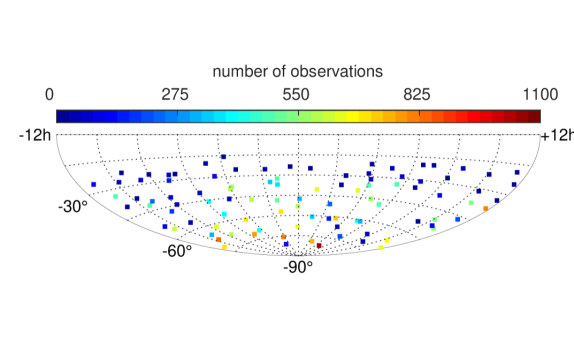
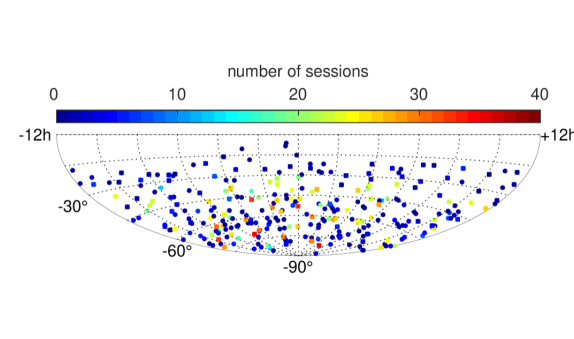
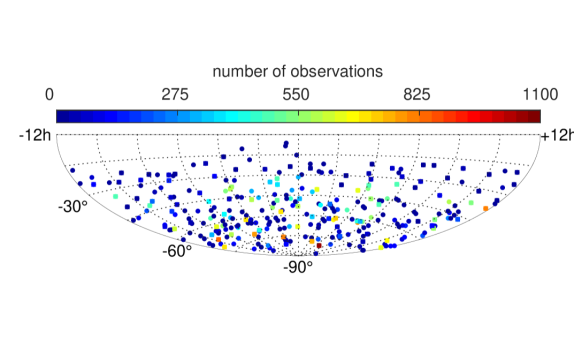
Between March 2011 and December 2021 (CRDS50–116) a total of 342 sources were observed in the CRDS sessions, including 104 of the 114 ICRF3 defining sources South of Dec. From these observations 298 sources (101 ICRF3 defining sources) were successfully detected to give a detection rate of 87 % . Figure 5 shows the distribution of the CRDS sources used as defining sources in ICRF3 on a Mollweide projection of the celestial sphere, using a heat colour scale to show the number of sessions and the number of observations per source with the blue being the lesser and the red being the greater. Figure 6 depicts all the CRDS detected sources on a Mollweide projection of the celestial sphere, again using a heat colour scale to show the number of sessions and the number of observations per source. The number of sessions per source ranges between 1–35, with an average of 8 sessions and 156 observations per source. The complete source list for the 2011–2021 period is provided in A, where ICRF3 defining sources have been identified.
3.3 Scheduling Strategies
Between 2011–2017 the schedules for the CRDS sessions were usually prepared by the USNO with some by NASA Goddard Space Flight Center (GSFC), using the geodetic VLBI scheduling software sked Vandenberg1997 (56). These sessions were all scheduled using a fixed scan length that ranged between 360–600 sec except for CRDS58 which used a scan length of 120 sec, and between 2–7 antennas were scheduled per session. This allowed for an average of 38 sources, 147 scans and 1337 observations to be scheduled per session. The number of scans per source per session ranged between 1–14, with an average of 4 scans per source. Although the minimum number of stations per scan was set to two, which is standard for geodetic and astrometric VLBI type schedules, those sessions with four or more antennas had on average 89% of the scans observed by four or more antennas. This made them more suitable for imaging which requires at least four stations per scan and preferably three or more scans per source.
In January 2018 the CRDS scheduling was optimised to allow for both astrometry and imaging, and from January 2018 (CRDS93) to March 2019 (CRD101) the CRDS schedules were prepared at HartRAO using the astronomical VLBI scheduling program sched Walker2018 (57). The changes that were made to the scheduling approach included the following: (1) using the full network of stations when possible for every scan, with no sub-netting as is used routinely for geodesy schedules; (2) observing at least 3–8 scans per source spread evenly over Hour Angle (HA) range to allow for optimal -coverage for imaging without compromising the astrometric goals of the experiment; (3) including blocks with tropospheric calibrators that are also used as astrometric ties and as calibrators for imaging; and (4) scheduling sessions as part of a campaign rather than individually, to ensure that each source in the list will receive the required amount of observing time. These sessions had between 4–6 antennas and used a fixed scan length that ranged between 180–300 sec for calibrator scans ( 20 ICRF2 defining sources that were added to each session), and 300 sec for target scans ( new sources that were added to each schedule). This allowed for an average of 49 sources, 227 scans and 1962 observations to be scheduled per session. The number of scans per source per session ranged between 1–8, with an average of 4.7 scans per source. The minimum number of stations per scan was set to four or higher, depending on the number of participating antennas.
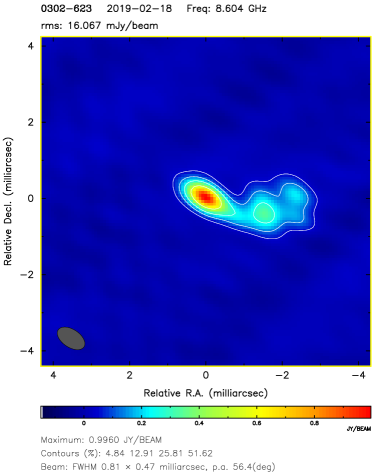
Figure 7 shows the -coverage plots for source 0302-623 and the improvement obtained starting with CRDS63 (Jan 2014) where the source was observed with 4 stations and in 4 scans, CRD100 (Feb 2019) with 5 stations but in only 2 scans and CRD102 (May 2019) where the source was observed with 6 stations and in 6 scans. This improvement in -coverage has resulted in better imaging; important for all sources but far more important for monitoring and selecting ICRF defining sources. An example is 0302-623 which was an ICRF2 defining source, but due to the improved imaging was deselected as an ICRF3 defining source because of the source structure as seen in Figure 12.


From June 2019 (CRD102) the CRDS schedules were prepared at TU Wien using the VieSched++ Schartner2019 (52) geodetic VLBI scheduling software. The VieSched++ software has the capability to produce VLBI astronomical-type schedules by using a source-centric scheduling approach with special constraints for imaging (as listed in the previous section). This was done by defining individual minimum repeat times per source, representing the minimum time between two scans to the same source. The minimum repeat times were calculated based on the time the source was visible by at least four stations and a target number of scans, which was typically between five and eight. The source selection was done iteratively as discussed in Schartner2019 (52). Therefore, the initial source list was divided into a calibrator source group and a target source group. After each session, the initial source list was updated and the observed target sources were removed to have a proper rotation among all sources. Since the participating antennas had quite different characteristics, such as slew speeds and sensitivities, long idle times existed for some stations. To reduce these idle times and increase the Signal to Noise Ratio (SNR), the station observing times per scan were extended in case of available idle time.
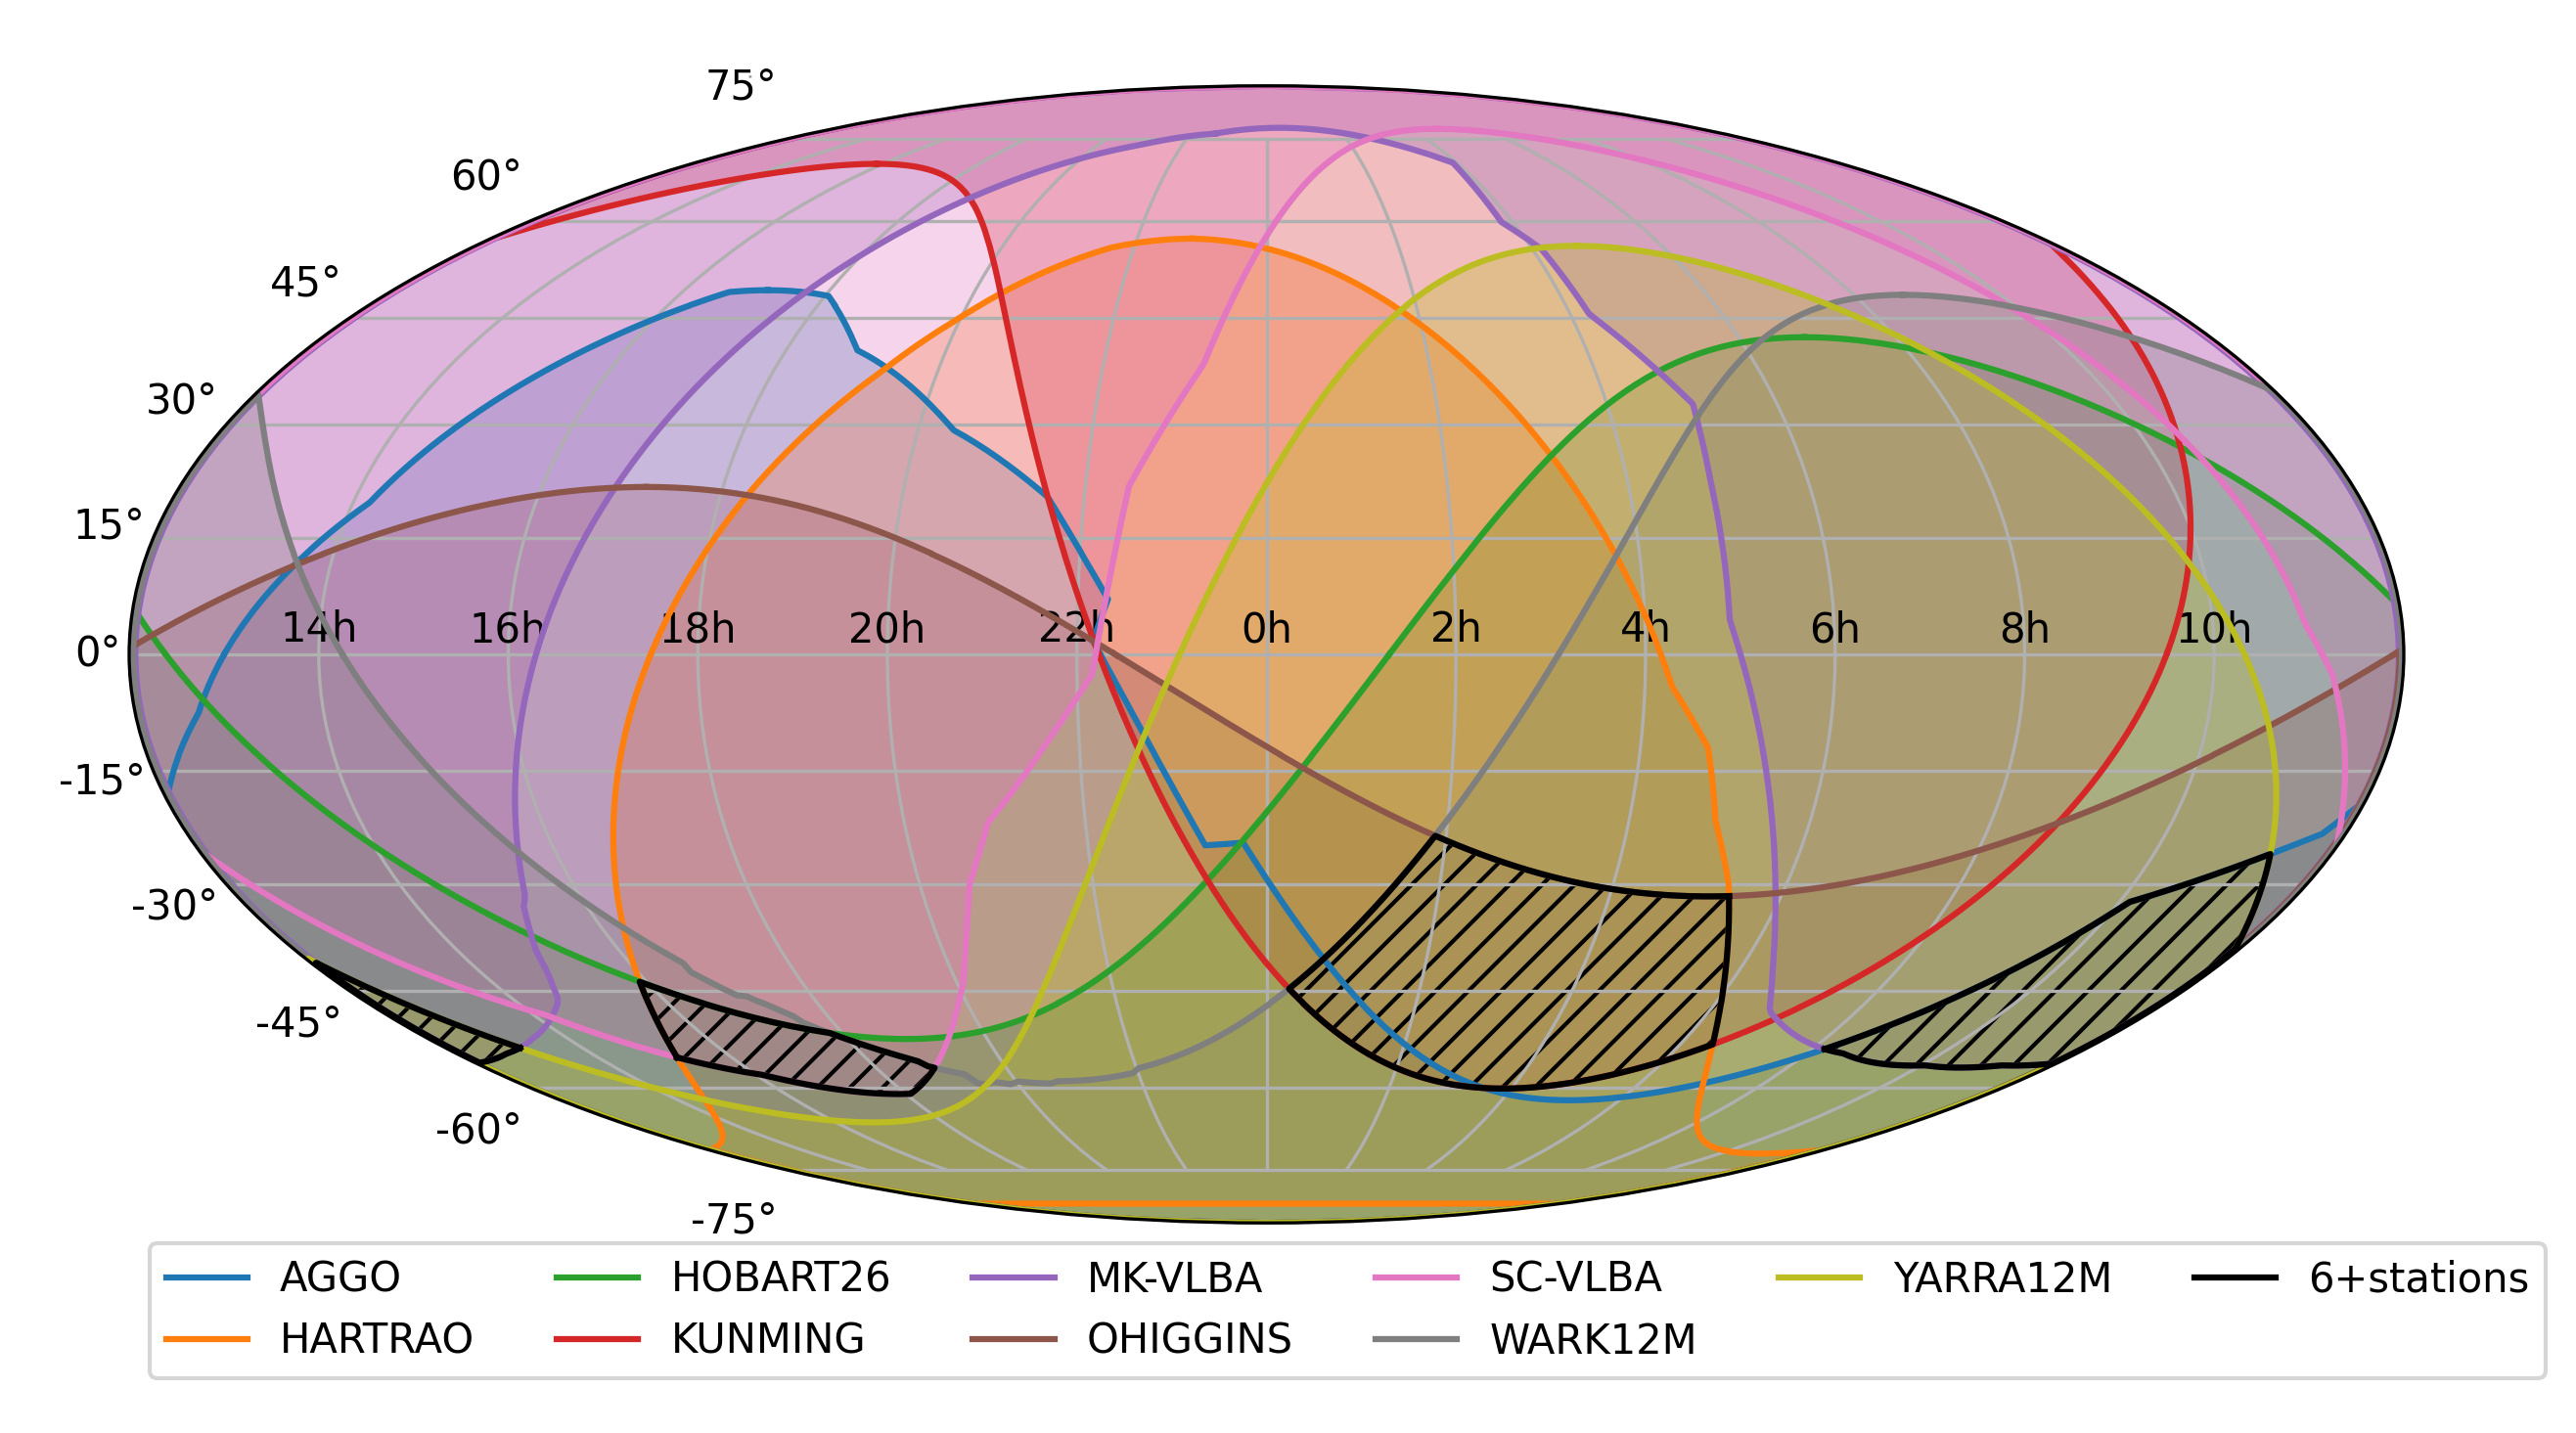
Another significant challenge was the very inhomogeneous and sparse station network. As an example, the commonly visible sky for the October 2021 (CRD115) network is displayed in Figure 8. Areas of the highest interest, e.g. where a source can be observed by six or more stations, are highlighted with a hashed black area. It can be seen that no commonly visible sky exists between Mk and Hh and Sc and Yg, while the commonly visible sky between Km and Ag is also very small. Together, all these requirements pose significant constraints on the scheduling. To find a proper balance between these constraints, the VieSched++ multi-scheduling feature was used to test several different optimization combinations. Out of this pool of possible schedules, the best one was selected and distributed.
Another challenge with the CRDS scheduling is that source flux information is often not available or not reliable. Therefore, the sessions between May 2019 (CRD102) and September 2020 (CRD110) used a fixed integration time of 280 sec per scan. However, due to the high number of non-detections, SNR-based scheduling using the sked-catalogue parameters Vandenberg1997 (56) was used for the May and August 2021 (CRD112 and 113) sessions. Finally, this was changed to a strategy where the sources were divided into three groups based on their brightness and were observed in either 240, 360, or 480 sec scans. On average, the sessions scheduled with VieSched++ (between May 2019, CRDS102 and December 2021, CRDS116) included between 6–8 antennas, which allowed for an average of 36 sources, 201 scans and 2165 observations to be scheduled per session. The number of scans per source per session ranged between 1–10, with an average of 5.7 scans per source. The schedules from the earlier sessions in this period had 95% or more of the scans observed by four or more stations, while CRD114–116, which included Km, Mk and Sc, had only 70% of the scans observed by 4 or more stations.
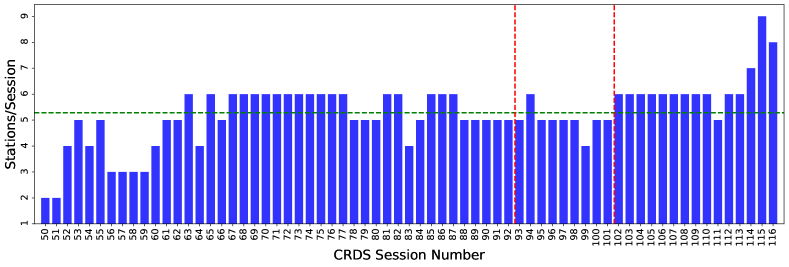
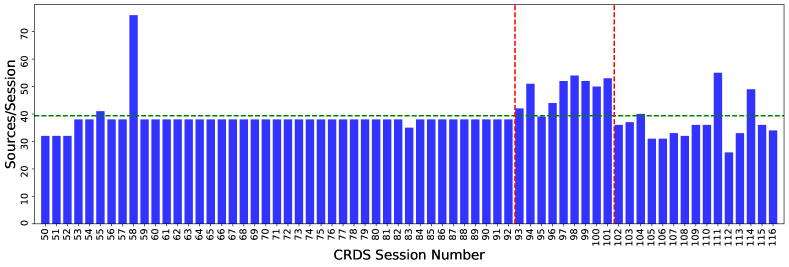
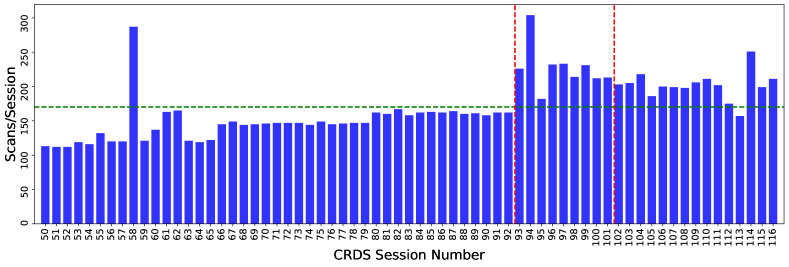
Finally, Figures 9 and 10 show the overall CRDS scheduling statistics for the period 2011–2021. It is clear from these plots that, in general, the number of scheduled sources and scans per session, as well as the average number of scans per source and average number of observations per baseline, all increased from 2018 (CRDS93). However, the number of sources scheduled per session shows a decrease from May 2019 (CRD102), as both the integration time per scan and the number of scans per source were increased, allowing for fewer sources to be scheduled. The increase in the integration times was mainly due to the decrease in the sensitivity of the network at the time, owing to the loss of two of the larger and more sensitive antennas, Ke and Ho, and the addition of the smaller less sensitive antennas, Ag and Oh. The rapid decrease in the number of observations per baseline seen for the last three sessions is a result of the additional scheduling constraints imposed by the three Northern antennas (Km, Mk, and Sc) that were added to the network. It should be noted that the statistics and plots provided in this section purely reports on the numbers obtained from the scheduling and does not reflect the actual number of participating antennas nor the success rate of the observations themselves, which are discussed in § 4.
3.4 Correlation, Analysis and Data Products
The raw antenna data for all stations was usually correlated at the USNO using their VLBI Correlator facility. Prior to October 2014, this was done on the Mark IV hardware correlator. In 2014 USNO transitioned to the DiFX 2011PASP..123..275D (22) software correlator (2010ivs..conf..153F (25); baver2014international (33)). First, the raw data was correlated with the DiFX software package. Visibilities are produced and converted to the Mk4 format for post-processing and the fits format for imaging. When necessary, station clock models are adjusted to reduce single-band delay residuals and the data are re-correlated. The CRDS82, 84, 86, 88, 90, 92, and 93 sessions were correlated with the Shanghai DiFX software correlator Shu2018 (54) that is hosted and operated by the Shanghai Astronomical Observatory (SHAO) of the Chinese Academy of Sciences (CAS).
After correlation with DiFX, fringe fitting was performed with the Haystack Observatory Post-processing Software, hops HOPS2021 (44). In cases where RFI degrades the fringe amplitude for a significant number of scans, the affected channels were removed. Fringes were also inspected to ensure that there was a strong phase calibration signal. Stations such as Ho and Ww had no initial phase calibration and required an artificial one applied with hops. Once significant RFI was removed and all stations have phase calibrations, the data was sent to the IVS Data Centres in the vgosDB format. However, the turnaround of the correlation of the CRDS sessions was severely affected by the arrival time of data from the Oh antenna. Since there is no high-bandwidth data connectivity to Antarctica and the Oh station, data was recorded onto hard disks and these are transported on an irregular basis when supply ships depart. Analysis of all of the CRDS sessions was done at both USNO and GSFC. The analysis begins by computing theoretical delays using the Calc program Charlot_2020 (17) and inserting them into the database. Then meteorological data (surface pressures, temperatures and humidities) and phase cal cable calibration data (if available) is added. Individual sessions were initially analysed with program solve Ma1978 (40) in the interactive mode until the 2018/2019 time frame, and then with SOLVE 2014ivs..conf..253B (13) as it was gradually phased in. The interactive analysis first involves finding and resolving the group delay ambiguities in both X and S bands and creating the ionosphere-free X/S combination. Various parameters are then solved for in a least-squares solution, such as piece-wise continuous clock and residual atmosphere terms at typically 60-minute intervals, tropospheric gradients over the entire session, antenna positions, and occasionally the coordinates of new sources. Three-sigma editing is performed and lastly the database is updated. Further analysis is then done on multiple databases with a global VLBI analysis package, such as calc/solve Ma1978 (40) or various other analysis packages within IVS IVS_Analysis (37). The global solutions can involve dozens or thousands of databases and solve for both global parameters (one value for the entire data span) and arc parameters (separate values for each database). Global parameters usually are the station positions, station velocities and source positions. Arc parameters are usually the piece-wise continuous clock and residual atmosphere terms (typically at 60 or 30 minute intervals), tropospheric gradients (typically at 6 hour intervals), and the five Earth orientation parameters (X and Y polar motion, UT1, and dX and dY nutation). A solve batch solution of the 57 available CRDS sessions from 2011–2021 shows that there were individual baseline observations at 11 sites and that 261 sources were observed in multiple sessions.
The databases created from the correlation and analysis as well as auxiliary data, such as schedule files and station log files, are stored in three primary IVS Data Centres (see the Data Availability Statement).
4 Results and Performance
The primary purpose of the CRDS program is astrometry, in particular to maintain and improve the S/X-band CRF in the Deep South. In recent years there have also been efforts to obtain imaging results from the CRDS sessions in order to assess the astrometric suitability of the CRF sources in the South, in particular those sources for which no images were available. Additionally, the CRDS sessions like all other IVS sessions contribute to the realization of the terrestrial reference frame. They are included in the Quarterly combination of 24-hour IVS sessions666https://ivscc.gsfc.nasa.gov/IVS_AC/ITRF2020/itrf2020_sx_sessionTable_v2021Feb10.txt computed by the BKG/DGFI-TUM Combination Centre which releases the estimated TRF as an official IVS product bachmann2021 (4). They are used for the station coordinate estimation but are not used for EOP determination. The USNO Quarterly solution todate uses CRDS59,69,71 & 91 in their EOP Solution777https://crf.usno.navy.mil/quarterly-vlbi-solution. Furthermore, the current realization of the International Terrestrial Reference Frame ITRF2020 altamimi2022itrf2020 (2), includes all available CRDS sessions at that time, i.e., until CRD105. Details of the astrometric and imaging results obtained from the CRDS sessions are provided in the following sections, § 4.1 and § 4.2. The overall performance of the CRDS sessions is discussed in § 4.3
4.1 Astrometric Results
The early CRDS sessions from June 1995 (CRF-DS1) to December 2010 (CRDS49) made significant contributions to the ICRF2, being almost the only sessions to add new Southern sources. The CRDS sessions between 2011 (CRDS50) and 2017 (CRDS92) primarily observed the 76 ICRF2 defining sources South of Dec, and this long-term monitoring provided precise positions for the ICRF2 defining sources in the deep-South. From 2018 (CRDS93) additional sources were added to the CRDS program, as detailed in § 3.2, in particular CRF sources South of Dec observed in fewer than 10 sessions and the ICRF3 defining sources.
The April 2022 S/X astrometric solution from the USNO (Gordon2022, 30, e.g. sx-usno-220422,) which includes all of the CRDS sessions up to December 2021 (CRD116), shows significant improvement over the ICRF3. However, the number of sources is still more than a factor of 3 less in the far-South () compared to the far-North (), with 269 sources in the far-South and 881 sources in the far-North. While the average number of sessions per source in the far-South is only a factor of 1.8 less than in the far-North, the average number of observations per source is more than a factor of 3 less in the far-South, with an average of 131 observations per source in the far-South and 449 in the far-North. The median formal uncertainties are a factor of 1.2 weaker in in the far-South and a factor of 1.6 weaker in , showing that much work is still needed in the far-South.
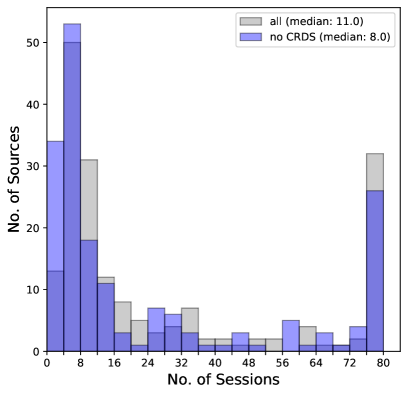
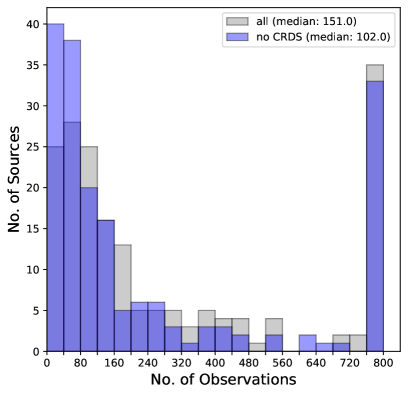
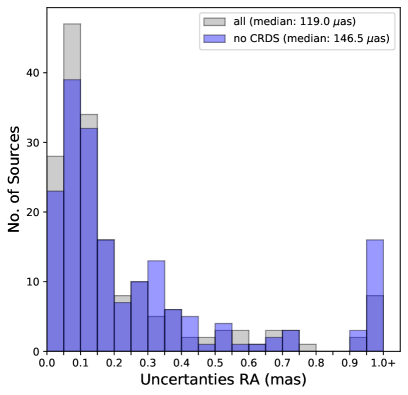
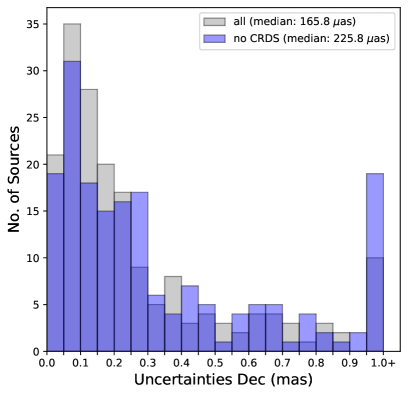
In order to measure the impact of the more recent CRDS observations (January 2018, CRDS93–December 2021,CRD116), we compare the April 2022 S/X astrometric solution (sx-usno-220422) to a solution where we exclude all CRDS sessions from January 2018 (CRDS93) onward. The April 2022 astrometric solution includes 266 sources that were observed and detected in CRDS sessions between 2018 and 2021, but for this comparison, we consider only the 182 of those sources that are in the far-South. Figure 11 shows the number of sessions and number of observations, as well as the and uncertainties from the April 2022 S/X astrometric solution (sx-usno-220422) for each of the 182 sources, with and without the CRDS sessions. The median number of sessions per source increases from 8 to 11, when CRDS sessions are included, and the number of observations increases by a factor of 1.5. The median uncertainties are a factor of 1.2 lower in and 1.4 lower in , when the CRDS sessions are included in the solution. Thus, the CRDS sessions have significantly improved the precision of the 182 sources observed in the far-South since 2018.
4.2 Imaging Results
A campaign to image CRF sources in the deep-South using the CRDS sessions started in January 2013 Basu2016 (8), and the imaging of twelve CRDS sessions (CRDS63, 66, 68, 94, 95, 96, 97, 98, 100, 101, 102, and 103) has been completed to date Basu2018 (7, 6). Imaging of the older sessions, prior to CRDS93, was challenging because of poor sensitivity and poor -coverage, and for this reason only three of these sessions were imaged. CRDS93 was not imaged as it had no usable data for Hh which provides the long baselines, and CRDS99 was not imaged as it had only three participating stations.
The correlated visibility data was calibrated with the NRAO’s Astronomical Imaging Processing System (greisen2003, 31, aips,). The data were first split into single-frequency (S- and X-band) files and each band was then calibrated separately using the standard calibration and editing steps and utilities available in aips. Data for sessions prior to CRDS93 were not available in Flexible Image Transport System (fits) file format for use in aips, and an interface program called mk4in alef2002 (1) was used to import the raw mkiv correlator data into aips and then convert and export it into fits format. This process was carried out at the Bonn correlator. Amplitude calibration, in general, has been a challenge, since system temperature (Tsys) and gain curve information is not readily available for IVS sessions. The Tsys and gain curve information had to be extracted from the respective session log files, and for some stations nominal values had to be used as no Tsys was available. An automated pipeline was used for self-calibration and imaging using the Caltech Difference Mapping software (shepherd1997, 53, difmap,).
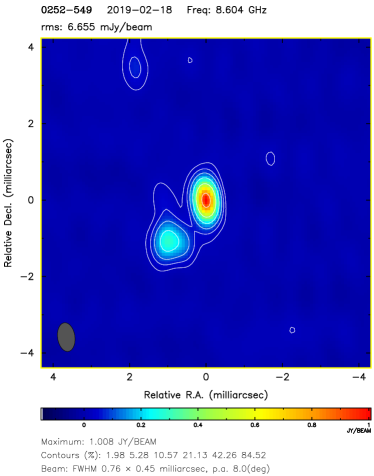
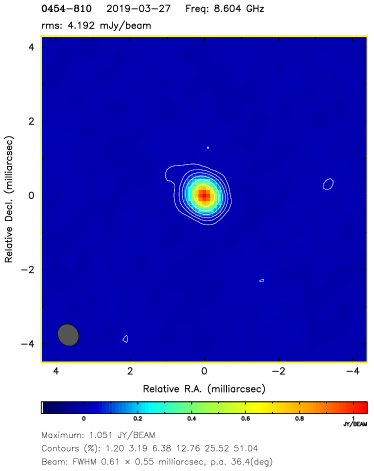
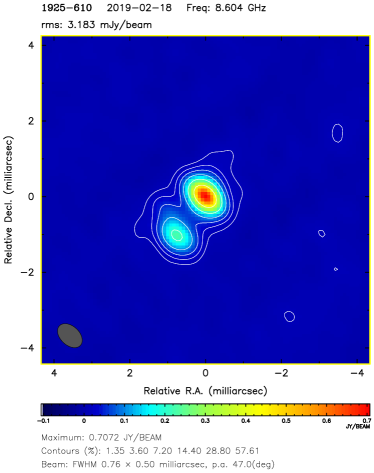
A total of 185 sources were imaged from twelve CRDS sessions between 2013–2019 at both S- and X-band, with some sources imaged at multiple epochs. Table 2 lists the participating stations and the number of sources observed and imaged in each of the twelve sessions. Figure 12 shows images for a representative sample of four sources observed in CRDS sessions between 2018–2019. The source 0252-549 shows a bright second component in the CRDS image in Figure 12. No images of this source are available from the Astrogeo Radio Fundamental Catalogue (Petrov2022, 48, RFC,). Three of the sources, 0302-623, 0454-810 and 1925-610 are ICRF2 defining sources. The source 0302-623 shows bright extended emission in the CRDS image in Figure 12 and was removed as a defining source for the ICRF3. There are no images of this source available in the Astrogeo RFC. The source 0454-810 is an ICRF3 defining source. The CRDS image in Figure 12 as well as images available from the Astrogeo RFC, all show a very compact structure for 0454-810. The source 1925-610 is an ICRF3 defining source and only one image, from 2010, is available from the Astrogeo RFC. The CRDS image in Figure 12 shows a bright second component and the status of 1925-610 as an ICRF3 defining source should be revisited in future.
| Session | Date | Participating | Sources | Sources |
|---|---|---|---|---|
| Name | yyyy-mm-dd | Stations | Observed | Imaged |
| CRDS63 | 2013-01-14 | Hh–Ho–Ke–Yg | 38 | 34 |
| CRDS66 | 2013-07-30 | Hb–Hh–Ho–Ke–Ww | 38 | 13 |
| CRDS68 | 2013-11-27 | Hb–Hh–Ho–Ke–Ww–Yg | 38 | 37 |
| CRDS94 | 2018-03-21 | Hh–Ht–Ke–Ww–Yg | 51 | 26 |
| CRDS95 | 2018-05-07 | Hh–Ho–Ke–Ww–Yg | 39 | 38 |
| CRDS96 | 2018-06-20 | Hh–Ho–Ke–Ww–Yg | 44 | 43 |
| CRDS97 | 2018-08-14 | Hh–Ho–Ke–Ww–Yg | 52 | 52 |
| CRDS98 | 2018-09-26 | Hh–Ho–Ke–Ww–Yg | 54 | 51 |
| CRD100 | 2019-02-18 | Hh–Ho–Ke–Ww–Yg | 50 | 50 |
| CRD101 | 2019-03-27 | Hh–Ke–Ww–Yg | 53 | 45 |
| CRD102 | 2019-05-06 | Hh–Ho–Ke–Oh–Ww–Yg | 36 | 36 |
| CRD103 | 2019-06-25 | Hh–Ho–Oh–Ww–Yg | 37 | 37 |
4.3 Performance
The performance of VLBI relies on a global network of antennas, owned and operated by many diverse organisations. The loss of any one antenna can have a huge knock-on effect by removing multiple baselines, which has a compounded impact on the observations available for analysis. It is important to note that for an array of antennas there will be baselines. Thus for example taking an array of 5 antennas gives 10 baselines, losing one antenna reduces the number of baselines to 6; a 40 % reduction. An antenna or multiples can be lost due to mechanical, electrical or other issues for a whole or part of a 24-hr session.
Even though scans within observations can be correlated, poor performance by one antenna for many reasons will also impact those actually used in the analysis. For example, scheduling an antenna with the wrong system equivalent flux density (SEFD) or a physical issue such as a cooled receiver having a fault and running hot/warm. A warm receiver will greatly reduce the sensitivity of an antenna. The resulting performance will be in some sense equivalent to the station having a cold receiver but observing for (typically) only one-third of the nominal time and therefore recording the equivalent of only one-third of the expected bits. Also, poor pointing can be converted into an equivalent lost sensitivity and then equivalent fraction of lost bits. RFI is becoming much more prevalent and an issue for many stations at S-Band (2-3 GHz), which also causes scans to be excluded by the correlator and be unavailable for the analysis. The per session statistics from the analysis reports ordered by session number are shown in Figure 13 and show the result of some of the above issues (A compilation of the CRDS53-116 session statistics are presented in B). In the figure and the appendix scheduled/correlated/recoverable/used observations are defined thus. Within a 24 hour IVS session multiple observations of sources with different baselines and stations are schedule, these observations are defined as scheduled. Of these observations not all are able to be correlated for various reasons, so the number able to be correlated is less than the number scheduled and is presented here as Correlated. Even though a scheduled observation is able to be correlated it might not be usable for analysis, so we have the number Recoverable. Then number Used are those able to be actually applied for the final analysis and data solution.
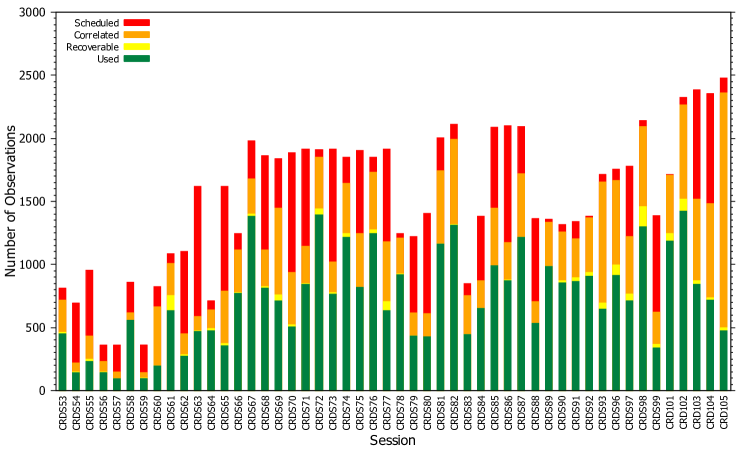
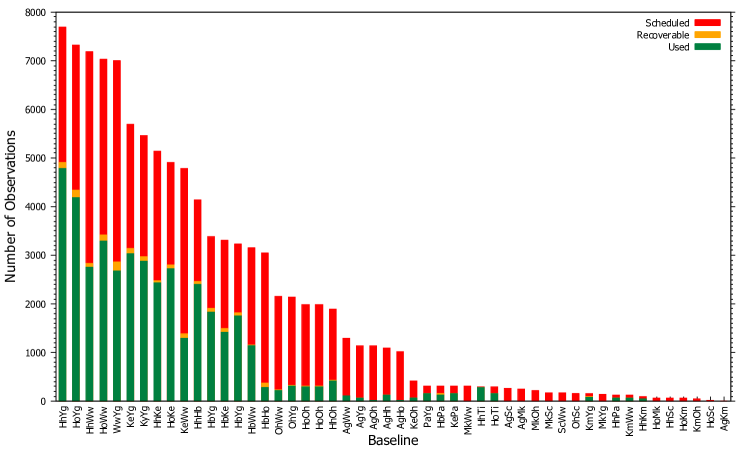
One of the open problems, evident from the session statistics, is that only a small percentage of the observations from the CRDS sessions are actually used for analysis (on average %). However, closer inspection of the analysis reports shows that the main contributor to this high failure rate is the long baseline observations by the smaller antennas. The Ag and Oh antennas are both small dishes with large SEFDs ( Jy) and are mostly tagged-along in the CRDS schedules. Stations that are scheduled in tagged-along mode are not essential as scheduled for the analysis, but can provide additional data that might be useful. This is common practice for new stations or after a major station upgrade or change until the data quality has been assessed and is acceptable to become a fully participating network station. In Figure 14 the actual number of scans scheduled by baseline is shown. In Figure 15 there are the % of scheduled versus used by baseline.
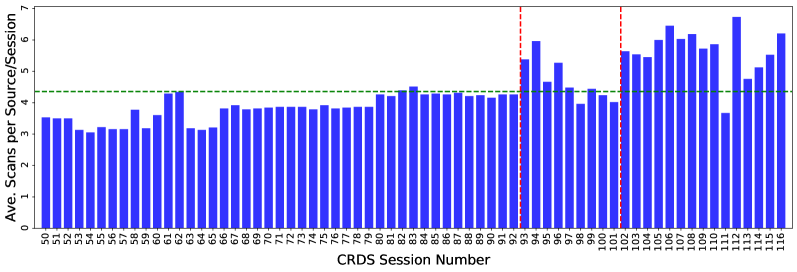
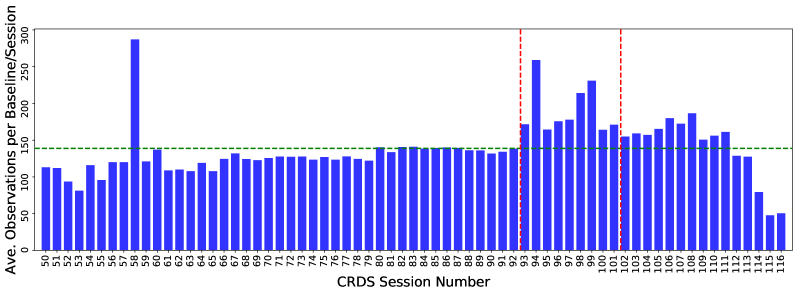
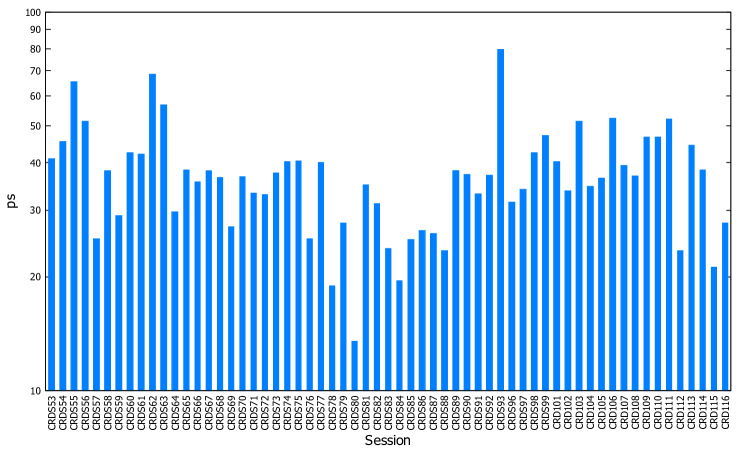
The post-fit residual delay rms values over all observations of the CRDS schedules are presented in Figure 16. We find a median session fit of 37 ps over all the CRDS sessions we have data for; this is comparable with the IVS R1/R4 observations with a median value of 34 ps Plank2017 (50).
5 Discussion and Future Plans
The primary purpose of the CRDS program is to improve the celestial reference frame in the Southern Hemisphere. Since January 2018, various improvements were made to CRDS sessions, e.g., the data rate was increased from 256 Mbps to 1 Gbps, the frequency sequence was optimised to avoid RFI, the scheduling was improved and optimised for both astrometry and imaging, and the source list was expanded. In addition, in 2021, three large antennas Km, Sc, and Mk, were added to the CRDS sessions to increase the number of stations and sensitivity of the existing network. However, the addition of these northern stations will only improve the results for sources down to about Dec and not for sources in the Deep-South. Initially there were scheduling issues for Sc and Mk as the hardware setup was incorrect in the distributed VEX file, causing these stations to be unable to participate in CRD114, 115 and 116. Furthermore, scheduling of these CRDS sessions which include Northern antennas is problematic. In addition, the transitioning of the Australian 12-m telescopes to VGOS broad-band and the temporary removal of the Hobart 26-m telescope in Australia and then the Warkworth 12-m in New Zealand due to repairs, has had a major impact on the CRDS sessions and the CRF in the Deep-South.
For future CRDS observations into the next decade, we hope to increase the data of the CRDS sessions, further improving the sensitivity. For existing stations an increase in the data recording rate from 1 to 2 Gbps is possible. An improvement in sensitivity can be used in two possible ways, one to observe sources for a shorter period and allowing for an increase in the number of sources and/or observations per session; second to add further weaker sources that will improve the coverage and density of sources in the Southern Hemisphere.
We anticipate the repair and return of the Ho and Ww antennas in the near future, and potentially adding additional southern stations to the CRDS network, such as the antennas forming part of the Long Baseline Array (LBA). However, most of the LBA antennas are not currently capable of dual-band S/X observations. Another possibility is adding one of the Tidbinbilla antennas in Australia to the CRDS network. However, the Tidbinbilla antennas are only available for a few hours per 24-hour session. The 34-m Tidbinbilla antennas may be available for longer, while time on the 70-m antenna is difficult to get and the slew rates are slow (0.25 deg/s). On the other hand, the Hb and Ke 12-m VGOS antennas are available for use in mixed-mode observations, and correlation of mixed-mode CRDS sessions needs to be investigated further.
We have also investigated the possibility of adding large sensitive antennas operating in single band (X) mode only, e.g., the 30 m Warkworth antenna in New Zealand. However, the possible shutdown of the Warkworth observatory may result in the loss of both the 12-m and 30-m Warkworth antennas. We are also investigating the possibility of including larger more sensitive stations in South America, The Zapala station is equipped with a 35-m antenna but there are no plans to install a wider S/X band receiver in the near future. There is also a plan to built a 40-m general purpose radio telescope in San Juan (China-Argentina Radio Telescope, CART). As of 2020, the antenna foundation has been completed, but the antenna delivery and installation was postponed due to the COVID-19 pandemic. This antenna, once completed, could be a promising candidate for CRF work.
It is expected that with the addition of new stations, better knowledge of sources such as flux density and source structure from imaging should lead to improved scheduling. As a result of these and other steps, further improvements to the ICRF will be obtained for the Southern Hemisphere in the years ahead.
We wish to acknowledge the International VLBI Service for Geodesy & Astrometry (IVS) for providing the organizational infrastructure that was essential to this work. In addition we would like to recognise the many organisations that under the IVS umbrella provide the Network Stations, Operation Centres, Correlators, Data Centres , Analysts Centres and the Technology Development Centres.
The research was carried out in part at the Jet Propulsion Laboratory, California Institute of Technology, under a contract with the National Aeronautics and Space Administration (80NM0018D0004).
From the 1st July 2023 operation of Warkworth will be transferred from AUT University to Space Operations New Zealand Ltd with new funding from Land Information New Zealand (LINZ).
Data Availability Statement
The final data products from this work are stored in three primary IVS Data Centers hosted at the Paris Observatory Data Center, OPAR barache2021 (5); the Federal Agency for Cartography and Geodesy, Germany Data Center, BKG girdiuk2021 (29); and the GSFC’s Crustal Dynamics Data Information System, CDDIS Michael2021 (43).
The three primary IVS Data Centres mirror each other several times during the day to ensure common consistent holdings. Access is free for users and data can be accessed from the url’s provided in the following list:
-
OPAR using FTP at ftp://ivsopar.obspm.fr
-
BKG using FTP at ftp://ivs.bkg.bund.de/pub/vlbi and HTTP at https://ivs.bkg.bund.de/data_dir/vlbi/
-
GSFC via the Crustal Dynamics Data Information System (CDDIS) at https://cddis.nasa.gov/archive/vlbi/
How to access the data and products is different for each data centre, and users will have to familiarise themselves with the methods and processes to extract the required data.
References
- (1) W. Alef and D.. Graham “The New Bonn Mk IV – AIPS Data Export Path” In Proceedings of the 6th EVN Symposium, 2002, pp. 31
- (2) Z. Altamimi et al. “ITRF2020: main results and key performance indicators” In EGU General Assembly Conference Abstracts, 2022, pp. EGU22–3958
- (3) Z. Altamimi et al. “Preparatory analysis and development for the ITRF2020” In EGU General Assembly 2021, 2021 URL: https://doi.org/10.5194/egusphere-egu21-2056
- (4) Sabine Bachmann et al. “BKG/DGFI-TUM Combination Center2019+2020 Biennial Report” In International VLBI Service for Geodesy and Astrometry 2019+2020 Biennial Report, 2021
- (5) Christophe Barache, Teddy Carlucci, Olivier Becker and Sebastien Lambert “Paris Observatory (OPAR) Data Center” In International VLBI Service for Geodesy and Astrometry 2019+2020 Biennial Report, 2021
- (6) S. Basu, A. de Witt and C. Gattano “Source structure and position stability of celestial reference frame sources in the Deep South” In Proceedings of the 25th Working Meeting of the European VLBI Group for Geodesy, 2021, pp. P7
- (7) S. Basu, A. de Witt, J. Quick and Z. Malkin “Multi-epoch VLBI images to study the ICRF-3 Defining Sources in the Southern Hemisphere” In 14th European VLBI Network Symposium & Users Meeting (EVN 2018), 2018, pp. 135
- (8) S. Basu et al. “How Good is the Deep Southern Sky” In New Horizons with VGOS, 2016, pp. 312–316
- (9) A.. Beasley and J. Conway “VLBI Phase Referencing. Very Long Baseline Interferometry and the VLBA” In Astronomical Society of the Pacific Conference Series” 82, 1995, pp. 327
- (10) Dirk Behrend “39th IVS Directing Board Meeting” In International VLBI Service for Geodesy & Astrometry, 2018
- (11) Dirk Behrend “41st IVS Directing Board Meeting” In International VLBI Service for Geodesy & Astrometry, 2019
- (12) Dirk Behrend “42nd IVS Directing Board Meeting” In International VLBI Service for Geodesy & Astrometry, 2020
- (13) S. Bolotin et al. “The VLBI Data Analysis Software Solve: Development Progress and Plans for the Future” In International VLBI Service for Geodesy and Astrometry 2014 General Meeting Proceedings: ”VGOS: The New VLBI Network, 2014, pp. 253–257
- (14) E.. Carter and D. Robertson “Very-Long-Baseline Interferometry Applied to Geophysics” In Developments in Astrometry and Their Impact on Astrophysics and Geodynamics” 156, 1993, pp. 133–144 DOI: 10.1007/978-94-011-1711-1 27
- (15) P. Charlot “Radio-Source Structure in Astrometric and Geodetic Very Long Baseline Interferometry” In Astronomical Journal 99, 1990, pp. 1309 DOI: 10.1086/115419
- (16) P. Charlot “ICRF3, the new realization of the International Celestial Reference Frame” In 14th European VLBI Network Symposium & Users Meeting (EVN 2018), 2018, pp. 136
- (17) P. Charlot et al. “The third realization of the International Celestial Reference Frame by very long baseline interferometry” In Astronomy & Astrophysics 644, 2020, pp. A159 DOI: 10.1051/0004-6361/202038368
- (18) A. de Witt et al. “Improving the S/X Celestial Reference Frame in the South: A Status Update” In 25th European VLBI Group for Geodesy and Astrometry Working Meeting 25, 2021, pp. 85–89
- (19) Aletha de Witt et al. “Improving the S/X Celestial Reference Frame in the South” In International VLBI Service for Geodesy and Astrometry 2018 General Meeting Proceedings: ”Global Geodesy and the Role of VGOS - Fundamental to Sustainable Development, 2019, pp. 189–193
- (20) Aletha de Witt et al. “The Southern VLBI Operations Centre (SVOC)” In 24th Meeting of the European VLBI Group for Geodesy and Astrometry (EVGA), https://www.oan.es/evga2019/EVGA2019_PDF/O205_EVGA2019_deWitt.pdf, 2019
- (21) P. de Witt, C.. Jacobs and D. Gordon “Overview and Status of the International Celestial Reference Frame as Realized by VLBI” In MDPI (Universe) 8.7, 2022 URL: https://www.mdpi.com/2218-1997/8/7/374
- (22) A.. Deller et al. “DiFX-2: A More Flexible, Efficient, Robust, and Powerful Software Correlator” In Publications of the Astronomical Society of the Pacific 123.901, 2011, pp. 275 DOI: 10.1086/658907
- (23) T.. Eubanks “Variations in the Orientation of the Earth” In Contributions of Space Geodesy to Geodynamics: Earth Dynamics 24, 1993, pp. 1 DOI: 10.1029/GD024p0001
- (24) A.. Fey et al. “THE SECOND REALIZATION OF THE INTERNATIONAL CELESTIAL REFERENCE FRAME BY VERY LONG BASELINE INTERFEROMETRY” In The Astronomical Journal 150.2 American Astronomical Society, 2015, pp. 58 DOI: 10.1088/0004-6256/150/2/58
- (25) Alan Fey et al. “Implementation and Testing of VLBI Software Correlation at USNO” In Sixth International VLBI Service for Geodesy and Astronomy. Proceedings from the 2010 General Meeting, 2010, pp. 153–156
- (26) E. Fomalont, S. Kopeikin, G. Lanyi and J. Benson “Progress in Measurements of the Gravitational Bending of Radio Waves Using the VLBA” In The Astrophysical Journal 699.2, 2009, pp. 1395–1402 DOI: 10.1088/0004-637X/699/2/1395
- (27) W. Fricke et al. “Fifth Fundamental Catalogue (FK5). Part 1. The Basic Fundamental Stars” In Veroeffentlichungen des Astronomischen Rechen-Instituts Heidelberg 32, 1988, pp. 1–106
- (28) C. Gattano, S.. Lambert and K. Le Bail “Extragalactic radio source stability and VLBI celestial reference frame: insights from the Allan standard deviation” In Astronomy & Astrophysics 618, 2018, pp. A80 DOI: 10.1051/0004-6361/201833430
- (29) Anastasiia Girdiuk, Markus Goltz, Gerald Engelhardt and Dieter Ullrich “BKG Data Center” In International VLBI Service for Geodesy and Astrometry 2019+2020 Biennial Report, 2021
- (30) D. Gordon, A. de Witt and C.. Jacobs “Current CRF Status at X/S and K Bands” In in IVS General Meeting, Helsinki, Finland (virtual), in IVS General Meeting, Helsinki, Finland (virtual), 2022
- (31) E.. Greisen “AIPS, the VLA, and the VLBA” In Information Handling in Astronomy - Historical Vistas 285 Dordrecht: Kluwer Academic Publishers, 2003, pp. 109–125 DOI: 10.1007/0-306-48080-8˙7
- (32) Sergei Gulyaev and Tim Natusch “New Zealand 12-m VLBI Station” In International VLBI Service for Geodesy and Astrometry 2009 Annual Report, 2010
- (33) David M. Hall and D. Veillette “Washington Correlator” In International VLBI Service for Geodesy and Astrometry 2014 Annual Report, 2015
- (34) R. Heinkelmann et al. “VLBI-derived troposphere parameters during CONT08” In Journal of Geodesy 85.7, 2011, pp. 377–393 DOI: 10.1007/s00190-011-0459-x
- (35) Hendrik Hellmers et al. “Combined IVS contribution to the ITRF2020” In EGU General Assembly Conference Abstracts, EGU General Assembly Conference Abstracts, 2021, pp. EGU21–10678 DOI: 10.5194/egusphere-egu21-10678
- (36) F. Hungwe et al. “Characterization of long baseline calibrators at 2.3 GHz” In Monthly Notices of the Royal Astronomical Society 418.4, 2011, pp. 2113–2120 DOI: 10.1111/j.1365-2966.2011.19232.x
- (37) IVS “IVS Analysis”, https://ivscc.gsfc.nasa.gov/analysis/index.html, 2021
- (38) J… Lovell et al. “The AuScope geodetic VLBI array” In Journal of Geodesy 87.6, 2013, pp. 527–538 DOI: 10.1007/s00190-013-0626-3
- (39) C. Ma et al. “The International Celestial Reference Frame as Realized by Very Long Baseline Interferometry” In ”The Astronomical Journal” 116.1, 1998, pp. 516–546 DOI: 10.1086/300408
- (40) Chopo Ma “Very Long Baseline Interferometry Applied to Polar Motion, Relativity, and Geodesy.”, 1978
- (41) D.. MacMillan et al. “Galactocentric acceleration in VLBI analysis. Findings of IVS WG8” In Astronomy & Astrophysics 630, 2019, pp. A93 DOI: 10.1051/0004-6361/201935379
- (42) Lucia McCallum, Takahiro Wakasugi and Fengchun Shu “Current Activities and Plans of the AOV - Asia-Oceania VLBI Group” In International VLBI Service for Geodesy and Astrometry 2018 General Meeting Proceedings: ”Global Geodesy and the Role of VGOS - Fundamental to Sustainable Development, 2019, pp. 131–134
- (43) Patrick Michael and Sandra Blevins “CDDIS Data Center Report for 2019-2020” In International VLBI Service for Geodesy and Astrometry 2019+2020 Biennial Report, 2021
- (44) MIT Haystack Observatory “Haystack Observatory Postprocessing System (HOPS)”, https://www.haystack.mit.edu/haystack-observatory-postprocessing-system-hops/, 2021
- (45) A. Nothnagel, T. Artz, D. Behrend and Z. Malkin “International VLBI Service for Geodesy and Astrometry. Delivering high-quality products and embarking on observations of the next generation” In Journal of Geodesy 91.7, 2017, pp. 711–721 DOI: 10.1007/s00190-016-0950-5
- (46) Ryan S. Park, William M. Folkner, James G. Williams and Dale H. Boggs “The JPL Planetary and Lunar Ephemerides DE440 and DE441” In The Astronomical Journal 161.3, 2021, pp. 105 DOI: 10.3847/1538-3881/abd414
- (47) William Petrachenko et al. “The VLBI2010 Global Observing System (VGOS)” In EGU General Assembly Conference Abstracts, EGU General Assembly Conference Abstracts, 2013, pp. EGU2013–12867
- (48) Leonid Petrov “Radio Fundamental Catalog. Astro-geo Center” In Radio Fundamental Catalog. Astro-geo Center, 2022
- (49) Leonid Petrov et al. “The Second LBA Calibrator Survey of southern compact extragalactic radio sources - LCS2” In Monthly Notices of the Royal Astronomical Society 485.1, 2019, pp. 88–101 DOI: 10.1093/mnras/stz242
- (50) L. Plank et al. “The AUSTRAL VLBI observing program” In Journal of Geodesy 91.7, 2017, pp. 803–817 DOI: 10.1007/s00190-016-0949-y
- (51) María J. Rioja and Richard Dodson “Precise radio astrometry and new developments for the next-generation of instruments” In Astronomy & Astrophysicsr 28.1, 2020, pp. 6 DOI: 10.1007/s00159-020-00126-z
- (52) Matthias Schartner and Johannes Böhm “VieSched++: A New VLBI Scheduling Software for Geodesy and Astrometry” In Publications of the Astronomical Society of the Pacific 131.1002, 2019, pp. 084501 DOI: 10.1088/1538-3873/ab1820
- (53) M.. Shepherd “Difmap: an Interactive Program for Synthesis Imaging” In Astronomical Data Analysis Software and Systems VI 125, Astronomical Society of the Pacific Conference Series, 1997, pp. 77 URL: https://ui.adsabs.harvard.edu/abs/1997ASPC..125...77S
- (54) Fengchun Shu et al. “Shanghai VLBI Correlator 2017–2018 Biennial Report” In International VLBI Service for Geodesy & Astrometry, 2018
- (55) C.. Thornton and J.. Border “Radiometric Tracking Techniques for Deep-Space Navigation” In Deep–Space Communications and Navigation Series, Monograph 1, JPL Publication 00-11, Jet Propulsion Laboratory, California Institute of Technology,, 2000
- (56) N.R. Vandenberg “sked’s Catalogs Program Reference Manual”, 1997 NVI, Inc. NASA/Goddard Space Flight Center
- (57) R. Walker “The SCHED User Manual, Version 11.4”, http://www.aoc.nrao.edu/software/sched/index.html, 2018
- (58) M.. Xu et al. “Structure Effects for 3417 Celestial Reference Frame Radio Sources” In The Astrophysical Journal Supplement Series 242.1, 2019, pp. 5 DOI: 10.3847/1538-4365/ab16ea
Appendix A Source list for sessions CRDS50-116
This appendix contains a list of the 298 sources detected in the CRDS sessions between January 2011 and December 2021 (CRDS50–116). The format: column 1 is the IVS source name, columns 2 and 3 are the right ascension and declination coordinates (J2000), column 4 is the number of CRDS sessions that a source was scheduled in and column 5 is the total number of observations of that source in all the scheduled sessions. ICRF-3 defining sources are highlighted in boldface.
| IVS Name | RA | Dec | ||
|---|---|---|---|---|
| (h) (min) (s) | (∘) (’) (”) | |||
| 0008-300 | 0 10 45.18 | -29 45 13.18 | 1 | 2 |
| 0010-401 | 0 12 59.91 | -39 54 26.06 | 2 | 86 |
| 0034-220 | 0 37 14.83 | -21 45 24.71 | 1 | 5 |
| 0035-252 | 0 38 14.74 | -24 59 2.24 | 2 | 16 |
| 0037-593 | 0 40 7.85 | -59 3 52.76 | 3 | 34 |
| 0048-427 | 0 51 9.50 | -42 26 33.29 | 23 | 353 |
| 0100-760 | 1 2 18.66 | -75 46 51.73 | 3 | 55 |
| 0104-275 | 1 6 26.08 | -27 18 11.83 | 1 | 26 |
| 0104-408 | 1 6 45.11 | -40 34 19.96 | 28 | 649 |
| 0107-610 | 1 9 15.48 | -60 49 48.46 | 30 | 355 |
| 0110-668 | 1 12 18.91 | -66 34 45.19 | 3 | 51 |
| 0113-283 | 1 15 23.88 | -28 4 55.22 | 1 | 46 |
| 0116-219 | 1 18 57.26 | -21 41 30.14 | 1 | 11 |
| 0122-514 | 1 24 57.39 | -51 13 16.17 | 3 | 27 |
| 0131-522 | 1 33 5.76 | -52 0 3.95 | 20 | 405 |
| 0142-278 | 1 45 3.39 | -27 33 34.33 | 2 | 48 |
| 0155-549 | 1 56 49.71 | -54 39 48.50 | 1 | 10 |
| 0159-668 | 2 1 7.74 | -66 38 12.67 | 2 | 35 |
| 0202-765 | 2 2 13.69 | -76 20 3.06 | 1 | 3 |
| 0206-625 | 2 8 1.17 | -62 16 35.53 | 1 | 13 |
| 0206-689 | 2 7 50.93 | -68 37 55.16 | 4 | 25 |
| 0208-512 | 2 10 46.20 | -51 1 1.89 | 8 | 237 |
| 0214-522 | 2 16 3.20 | -52 0 12.48 | 1 | 1 |
| 0219-637 | 2 20 54.17 | -63 30 19.39 | 1 | 14 |
| 0227-369 | 2 29 28.45 | -36 43 56.82 | 1 | 2 |
| 0227-542 | 2 29 12.79 | -54 3 24.03 | 1 | 7 |
| 0229-479 | 2 31 11.80 | -47 46 11.58 | 3 | 95 |
| 0230-790 | 2 29 34.95 | -78 47 45.60 | 30 | 751 |
| 0234-301 | 2 36 31.17 | -29 53 55.54 | 2 | 24 |
| 0235-618 | 2 36 53.25 | -61 36 15.18 | 21 | 159 |
| 0241-564 | 2 43 26.53 | -56 12 42.44 | 1 | 1 |
| 0252-549 | 2 53 29.18 | -54 41 51.44 | 5 | 179 |
| 0302-623 | 3 3 50.63 | -62 11 25.55 | 29 | 667 |
| 0308-611 | 3 9 56.10 | -60 58 39.06 | 27 | 727 |
| 0312-770 | 3 11 55.25 | -76 51 50.85 | 7 | 194 |
| 0332-403 | 3 34 13.65 | -40 8 25.40 | 27 | 643 |
| 0334-546 | 3 35 53.92 | -54 30 25.11 | 24 | 486 |
| 0346-279 | 3 48 38.14 | -27 49 13.57 | 3 | 33 |
| 0347-211 | 3 49 57.83 | -21 2 47.74 | 1 | 16 |
| 0355-483 | 3 57 21.92 | -48 12 15.16 | 1 | 17 |
| 0355-669 | 3 55 47.88 | -66 45 33.82 | 6 | 71 |
| 0400-319 | 4 2 21.27 | -31 47 25.95 | 3 | 64 |
| 0402-362 | 4 3 53.75 | -36 5 1.91 | 24 | 480 |
| 0405-385 | 4 6 59.04 | -38 26 28.04 | 21 | 542 |
| 0431-512 | 4 32 21.18 | -51 9 25.19 | 1 | 5 |
| 0432-606 | 4 33 34.11 | -60 30 13.77 | 2 | 29 |
| 0437-454 | 4 39 0.85 | -45 22 22.56 | 23 | 574 |
| 0440-520 | 4 41 58.28 | -51 54 54.17 | 1 | 13 |
| 0441-699 | 4 40 47.76 | -69 52 18.09 | 2 | 72 |
| 0450-743 | 4 48 48.56 | -74 17 31.25 | 1 | 25 |
| 0454-234 | 4 57 3.18 | -23 24 52.02 | 4 | 63 |
| 0454-810 | 4 50 5.44 | -81 1 2.23 | 35 | 1064 |
| 0506-612 | 5 6 43.99 | -61 9 40.99 | 25 | 419 |
| 0507-611 | 5 7 54.67 | -61 4 43.12 | 1 | 15 |
| 0514-459 | 5 15 45.25 | -45 56 43.20 | 1 | 12 |
| 0516-621 | 5 16 44.93 | -62 7 5.39 | 27 | 776 |
| 0517-726 | 5 16 37.72 | -72 37 7.47 | 1 | 40 |
| 0521-262 | 5 23 18.47 | -26 14 9.55 | 1 | 26 |
| 0522-611 | 5 22 34.43 | -61 7 57.13 | 24 | 303 |
| 0523-236 | 5 25 6.51 | -23 38 10.81 | 1 | 44 |
| 0524-460 | 5 25 31.40 | -45 57 54.69 | 13 | 48 |
| 0524-485 | 5 26 16.67 | -48 30 36.79 | 29 | 472 |
| 0530-727 | 5 29 30.04 | -72 45 28.51 | 5 | 193 |
| 0534-340 | 5 36 28.43 | -34 1 11.47 | 23 | 478 |
| 0534-611 | 5 34 35.77 | -61 6 7.07 | 20 | 535 |
| 0537-286 | 5 39 54.28 | -28 39 55.95 | 4 | 75 |
| 0537-441 | 5 38 50.36 | -44 5 8.94 | 21 | 507 |
| 0542-735 | 5 41 50.78 | -73 32 15.35 | 4 | 71 |
| 0549-575 | 5 50 9.58 | -57 32 24.40 | 26 | 567 |
| 0601-706 | 6 1 11.25 | -70 36 8.79 | 3 | 77 |
| 0610-436 | 6 12 28.61 | -43 37 48.38 | 1 | 8 |
| 0621-787 | 6 18 30.16 | -78 43 2.14 | 5 | 170 |
| 0622-441 | 6 23 31.79 | -44 13 2.55 | 1 | 6 |
| 0622-645 | 6 23 7.70 | -64 36 20.72 | 1 | 6 |
| 0624-546 | 6 25 52.23 | -54 38 50.71 | 1 | 22 |
| 0627-199 | 6 29 23.76 | -19 59 19.72 | 2 | 12 |
| 0628-627 | 6 28 57.49 | -62 48 44.74 | 1 | 33 |
| 0628-671 | 6 28 39.61 | -67 12 47.41 | 1 | 8 |
| 0634-584 | 6 35 40.83 | -58 27 10.28 | 1 | 4 |
| 0642-349 | 6 44 25.28 | -34 59 41.95 | 1 | 6 |
| 0646-306 | 6 48 14.10 | -30 44 19.66 | 4 | 69 |
| 0700-197 | 7 2 42.90 | -19 51 22.04 | 1 | 8 |
| 0700-465 | 7 1 34.55 | -46 34 36.63 | 3 | 6 |
| 0738-674 | 7 38 56.50 | -67 35 50.83 | 5 | 61 |
| 0742-562 | 7 43 20.49 | -56 19 32.96 | 5 | 84 |
| 0743-673 | 7 43 31.61 | -67 26 25.55 | 1 | 24 |
| 0744-691 | 7 44 20.39 | -69 19 7.16 | 1 | 18 |
| 0804-267 | 8 6 12.72 | -26 52 33.31 | 5 | 25 |
| 0809-493 | 8 11 8.80 | -49 29 43.51 | 1 | 2 |
| 0820-578 | 8 21 20.53 | -58 0 18.75 | 1 | 6 |
| 0823-500 | 8 25 26.87 | -50 10 38.49 | 1 | 3 |
| 0826-373 | 8 28 4.78 | -37 31 6.28 | 4 | 105 |
| 0834-201 | 8 36 39.22 | -20 16 59.50 | 6 | 52 |
| 0842-754 | 8 41 27.04 | -75 40 27.87 | 1 | 8 |
| 0843-547 | 8 45 2.48 | -54 58 8.54 | 4 | 47 |
| 0848-588 | 8 49 14.88 | -59 5 0.77 | 1 | 4 |
| 0851-577 | 8 52 38.73 | -57 55 29.81 | 2 | 98 |
| 0855-716 | 8 55 11.77 | -71 49 6.46 | 3 | 35 |
| 0858-279 | 9 0 40.04 | -28 8 20.34 | 1 | 11 |
| 0903-573 | 9 4 53.18 | -57 35 5.78 | 4 | 138 |
| 0918-534 | 9 19 44.04 | -53 40 6.45 | 4 | 22 |
| 0920-397 | 9 22 46.42 | -39 59 35.07 | 23 | 584 |
| 0936-853 | 9 30 32.57 | -85 33 59.70 | 4 | 54 |
| 0944-469 | 9 46 51.34 | -47 7 59.23 | 2 | 26 |
| 0956-409 | 9 58 38.30 | -41 10 33.17 | 1 | 19 |
| 0959-443 | 10 1 59.91 | -44 38 0.60 | 1 | 8 |
| 1004-217 | 10 6 46.41 | -21 59 20.41 | 1 | 4 |
| 1004-500 | 10 6 14.01 | -50 18 13.47 | 23 | 534 |
| 1005-739 | 10 6 4.15 | -74 9 44.09 | 1 | 29 |
| 1012-448 | 10 14 50.35 | -45 8 41.15 | 7 | 117 |
| 1016-311 | 10 18 28.75 | -31 23 53.85 | 1 | 5 |
| 1022-665 | 10 23 43.53 | -66 46 48.72 | 25 | 664 |
| 1034-374 | 10 36 53.44 | -37 44 15.07 | 24 | 541 |
| 1036-431 | 10 38 14.70 | -43 25 45.89 | 1 | 14 |
| 1036-529 | 10 38 40.66 | -53 11 43.27 | 5 | 126 |
| 1039-474 | 10 41 44.65 | -47 40 0.07 | 8 | 253 |
| 1041-452 | 10 43 51.42 | -45 30 9.56 | 1 | 8 |
| 1045-188 | 10 48 6.62 | -19 9 35.73 | 1 | 12 |
| 1045-620 | 10 47 42.95 | -62 17 14.63 | 5 | 126 |
| 1048-470 | 10 50 53.40 | -47 19 4.55 | 1 | 9 |
| 1048-526 | 10 50 38.03 | -52 49 48.33 | 2 | 56 |
| 1049-534 | 10 51 9.10 | -53 44 46.54 | 1 | 51 |
| 1059-631 | 11 1 54.38 | -63 25 22.60 | 4 | 69 |
| 1101-536 | 11 3 52.22 | -53 57 0.70 | 26 | 573 |
| 1105-680 | 11 7 12.70 | -68 20 50.73 | 2 | 40 |
| 1109-567 | 11 12 7.27 | -57 3 39.75 | 5 | 56 |
| 1116-462 | 11 18 26.96 | -46 34 15.00 | 6 | 195 |
| 1117-270 | 11 20 16.19 | -27 19 6.37 | 1 | 40 |
| 1124-186 | 11 27 4.39 | -18 57 17.44 | 1 | 9 |
| 1129-580 | 11 31 43.29 | -58 18 53.44 | 8 | 216 |
| 1130-741 | 11 32 19.11 | -74 25 9.02 | 1 | 1 |
| 1133-681 | 11 36 2.10 | -68 27 5.82 | 2 | 80 |
| 1133-739 | 11 36 9.66 | -74 15 45.27 | 2 | 15 |
| 1143-245 | 11 46 8.10 | -24 47 32.90 | 1 | 7 |
| 1143-332 | 11 46 28.45 | -33 28 42.63 | 1 | 4 |
| 1143-696 | 11 45 53.62 | -69 54 1.80 | 26 | 641 |
| 1144-379 | 11 47 1.37 | -38 12 11.02 | 27 | 824 |
| 1148-671 | 11 51 13.43 | -67 28 11.09 | 4 | 136 |
| 1151-348 | 11 54 21.79 | -35 5 29.06 | 1 | 11 |
| 1156-663 | 11 59 18.31 | -66 35 39.43 | 22 | 124 |
| 1206-238 | 12 9 2.45 | -24 6 20.76 | 1 | 17 |
| 1213-172 | 12 15 46.75 | -17 31 45.40 | 1 | 12 |
| 1214-609 | 12 17 5.63 | -61 13 25.43 | 2 | 4 |
| 1215-457 | 12 18 6.25 | -46 0 28.99 | 5 | 20 |
| 1236-684 | 12 39 46.65 | -68 45 30.89 | 2 | 8 |
| 1244-255 | 12 46 46.80 | -25 47 49.29 | 7 | 137 |
| 1245-454 | 12 48 28.50 | -45 59 47.18 | 5 | 110 |
| 1249-673 | 12 52 43.21 | -67 37 38.75 | 1 | 44 |
| 1251-713 | 12 54 59.92 | -71 38 18.44 | 29 | 705 |
| 1256-220 | 12 58 54.48 | -22 19 31.13 | 2 | 56 |
| 1300-554 | 13 3 49.22 | -55 40 31.61 | 1 | 23 |
| 1306-395 | 13 9 48.49 | -39 48 33.09 | 2 | 21 |
| 1307-556 | 13 10 43.36 | -55 52 11.53 | 1 | 9 |
| 1312-533 | 13 15 4.18 | -53 34 35.87 | 5 | 94 |
| 1313-333 | 13 16 7.99 | -33 38 59.17 | 24 | 488 |
| 1323-527 | 13 26 49.23 | -52 56 23.63 | 3 | 115 |
| 1325-558 | 13 29 1.14 | -56 8 2.67 | 25 | 629 |
| 1326-698 | 13 30 11.08 | -70 3 13.08 | 3 | 128 |
| 1334-649 | 13 37 52.45 | -65 9 24.90 | 4 | 25 |
| 1336-260 | 13 39 19.89 | -26 20 30.50 | 1 | 18 |
| 1343-601 | 13 46 49.04 | -60 24 29.36 | 6 | 12 |
| 1349-439 | 13 52 56.53 | -44 12 40.39 | 20 | 210 |
| 1352-632 | 13 55 46.61 | -63 26 42.57 | 6 | 14 |
| 1406-267 | 14 9 50.17 | -26 57 36.98 | 2 | 52 |
| 1412-368 | 14 15 26.02 | -37 5 26.97 | 2 | 8 |
| 1417-782 | 14 23 43.55 | -78 29 34.90 | 5 | 125 |
| 1420-679 | 14 24 55.56 | -68 7 58.09 | 33 | 833 |
| 1420-725 | 14 24 52.24 | -72 41 17.09 | 6 | 119 |
| 1424-418 | 14 27 56.30 | -42 6 19.44 | 23 | 469 |
| 1435-218 | 14 38 9.47 | -22 4 54.75 | 1 | 8 |
| 1448-648 | 14 52 39.68 | -65 2 3.43 | 22 | 309 |
| 1451-400 | 14 54 32.91 | -40 12 32.51 | 23 | 243 |
| 1505-304 | 15 8 52.99 | -30 36 29.43 | 1 | 11 |
| 1505-496 | 15 8 38.94 | -49 53 2.31 | 5 | 117 |
| 1509-564 | 15 12 55.82 | -56 40 30.64 | 1 | 1 |
| 1511-476 | 15 14 40.02 | -47 48 29.86 | 6 | 178 |
| 1511-558 | 15 15 12.67 | -55 59 32.84 | 3 | 43 |
| 1519-273 | 15 22 37.68 | -27 30 10.79 | 6 | 84 |
| 1528-684 | 15 33 34.49 | -68 37 19.65 | 2 | 27 |
| 1530-536 | 15 34 20.66 | -53 51 13.42 | 2 | 19 |
| 1531-352 | 15 34 54.69 | -35 26 23.50 | 1 | 40 |
| 1533-653 | 15 38 11.92 | -65 25 51.20 | 2 | 7 |
| 1540-828 | 15 50 59.14 | -82 58 6.85 | 2 | 62 |
| 1544-638 | 15 48 30.40 | -64 1 34.80 | 3 | 57 |
| 1549-790 | 15 56 58.87 | -79 14 4.28 | 4 | 17 |
| 1554-643 | 15 58 50.28 | -64 32 29.64 | 15 | 92 |
| 1556-245 | 15 59 41.41 | -24 42 38.83 | 2 | 4 |
| 1556-580 | 16 0 12.38 | -58 11 2.97 | 1 | 6 |
| 1600-445 | 16 4 31.02 | -44 41 31.97 | 5 | 77 |
| 1600-489 | 16 3 50.68 | -49 4 5.51 | 1 | 13 |
| 1604-333 | 16 7 34.76 | -33 31 8.91 | 13 | 79 |
| 1606-398 | 16 10 21.88 | -39 58 58.33 | 5 | 61 |
| 1611-710 | 16 16 30.64 | -71 8 31.45 | 18 | 178 |
| 1618-399 | 16 21 59.69 | -40 3 34.49 | 1 | 4 |
| 1619-680 | 16 24 18.44 | -68 9 12.50 | 26 | 596 |
| 1622-253 | 16 25 46.89 | -25 27 38.33 | 1 | 6 |
| 1624-617 | 16 28 54.69 | -61 52 36.40 | 31 | 644 |
| 1633-810 | 16 42 57.35 | -81 8 35.07 | 14 | 125 |
| 1637-771 | 16 44 16.12 | -77 15 48.81 | 1 | 10 |
| 1642-645 | 16 47 37.74 | -64 38 0.27 | 2 | 59 |
| 1646-506 | 16 50 16.63 | -50 44 48.21 | 7 | 68 |
| 1647-296 | 16 50 39.54 | -29 43 46.95 | 5 | 159 |
| 1657-261 | 17 0 53.15 | -26 10 51.73 | 3 | 68 |
| 1657-562 | 17 1 44.86 | -56 21 55.90 | 25 | 495 |
| 1659-621 | 17 3 36.54 | -62 12 40.01 | 27 | 572 |
| 1710-269 | 17 13 31.28 | -26 58 52.53 | 1 | 21 |
| 1717-618 | 17 21 39.02 | -61 54 43.02 | 1 | 3 |
| 1718-259 | 17 21 55.98 | -25 58 40.69 | 1 | 1 |
| 1722-554 | 17 26 49.63 | -55 29 40.46 | 1 | 3 |
| 1722-644 | 17 26 57.83 | -64 27 52.71 | 2 | 8 |
| 1725-795 | 17 33 40.70 | -79 35 55.72 | 19 | 257 |
| 1729-373 | 17 33 15.19 | -37 22 32.40 | 2 | 10 |
| 1732-593 | 17 37 19.67 | -59 21 41.89 | 1 | 6 |
| 1740-517 | 17 44 25.45 | -51 44 43.74 | 5 | 25 |
| 1758-651 | 18 3 23.50 | -65 7 36.76 | 20 | 378 |
| 1759-396 | 18 2 42.68 | -39 40 7.91 | 4 | 106 |
| 1803-642 | 18 7 54.03 | -64 13 50.11 | 4 | 104 |
| 1804-502 | 18 8 13.84 | -50 11 53.61 | 2 | 52 |
| 1806-458 | 18 9 57.87 | -45 52 41.01 | 26 | 390 |
| 1814-637 | 18 19 35.00 | -63 45 48.21 | 1 | 9 |
| 1815-553 | 18 19 45.40 | -55 21 20.75 | 24 | 412 |
| 1824-582 | 18 29 12.40 | -58 13 55.16 | 19 | 319 |
| 1828-733 | 18 34 53.20 | -73 15 14.33 | 3 | 9 |
| 1829-207 | 18 32 11.05 | -20 39 48.20 | 1 | 4 |
| 1830-589 | 18 34 27.47 | -58 56 36.27 | 1 | 8 |
| 1831-711 | 18 37 28.71 | -71 8 43.55 | 35 | 779 |
| 1852-534 | 18 57 0.45 | -53 25 0.38 | 2 | 10 |
| 1908-201 | 19 11 9.65 | -20 6 55.11 | 4 | 42 |
| 1918-634 | 19 23 24.61 | -63 20 45.77 | 1 | 2 |
| 1921-293 | 19 24 51.06 | -29 14 30.12 | 8 | 112 |
| 1925-610 | 19 30 6.16 | -60 56 9.18 | 29 | 704 |
| 1928-698 | 19 33 31.16 | -69 42 58.91 | 6 | 136 |
| 1929-457 | 19 32 44.89 | -45 36 37.93 | 9 | 67 |
| 1933-400 | 19 37 16.22 | -39 58 1.55 | 20 | 541 |
| 1934-638 | 19 39 25.03 | -63 42 45.62 | 2 | 6 |
| 1935-692 | 19 40 25.53 | -69 7 56.97 | 31 | 427 |
| 1936-623 | 19 41 21.77 | -62 11 21.06 | 7 | 193 |
| 1941-554 | 19 45 24.23 | -55 20 48.84 | 1 | 5 |
| 1946-582 | 19 50 37.40 | -58 4 39.75 | 1 | 2 |
| 1950-613 | 19 55 10.77 | -61 15 19.14 | 6 | 66 |
| 1953-325 | 19 56 59.46 | -32 25 46.01 | 1 | 11 |
| 1954-388 | 19 57 59.82 | -38 45 6.36 | 27 | 578 |
| 1959-639 | 20 4 29.48 | -63 47 23.31 | 4 | 95 |
| 2002-375 | 20 5 55.07 | -37 23 41.48 | 24 | 554 |
| 2004-447 | 20 7 55.18 | -44 34 44.28 | 1 | 7 |
| 2008-159 | 20 11 15.71 | -15 46 40.25 | 2 | 23 |
| 2018-453 | 20 22 26.41 | -45 13 29.55 | 2 | 36 |
| 2021-330 | 20 24 35.58 | -32 53 35.91 | 1 | 43 |
| 2030-689 | 20 35 48.88 | -68 46 33.84 | 5 | 147 |
| 2037-253 | 20 40 8.77 | -25 7 46.66 | 3 | 17 |
| 2052-474 | 20 56 16.36 | -47 14 47.63 | 33 | 589 |
| 2102-659 | 21 6 59.72 | -65 47 43.59 | 6 | 44 |
| 2106-413 | 21 9 33.19 | -41 10 20.61 | 18 | 329 |
| 2107-105 | 21 10 0.98 | -10 20 57.32 | 1 | 9 |
| 2109-811 | 21 16 30.85 | -80 53 55.22 | 5 | 132 |
| 2112-556 | 21 16 29.82 | -55 27 20.44 | 1 | 17 |
| 2117-614 | 21 21 4.07 | -61 11 24.62 | 4 | 29 |
| 2117-642 | 21 21 55.02 | -64 4 30.04 | 1 | 1 |
| 2123-463 | 21 26 30.70 | -46 5 47.89 | 21 | 311 |
| 2126-185 | 21 29 21.42 | -18 21 22.79 | 1 | 24 |
| 2140-781 | 21 46 30.07 | -77 55 54.73 | 1 | 25 |
| 2142-758 | 21 47 12.73 | -75 36 13.22 | 30 | 818 |
| 2142-765 | 21 47 53.15 | -76 21 29.22 | 1 | 9 |
| 2146-783 | 21 52 3.15 | -78 7 6.64 | 9 | 139 |
| 2152-699 | 21 57 5.98 | -69 41 23.68 | 1 | 22 |
| 2200-617 | 22 3 59.64 | -61 30 22.01 | 1 | 33 |
| 2204-540 | 22 7 43.73 | -53 46 33.82 | 30 | 557 |
| 2205-636 | 22 8 47.24 | -63 25 47.49 | 1 | 1 |
| 2210-257 | 22 13 2.50 | -25 29 30.08 | 2 | 34 |
| 2215-508 | 22 18 19.02 | -50 38 41.73 | 1 | 13 |
| 2220-351 | 22 23 5.93 | -34 55 47.18 | 23 | 334 |
| 2224-793 | 22 29 18.54 | -79 7 8.52 | 1 | 24 |
| 2225-694 | 22 29 0.18 | -69 10 30.27 | 1 | 27 |
| 2227-445 | 22 30 56.44 | -44 16 29.89 | 3 | 74 |
| 2232-488 | 22 35 13.24 | -48 35 58.79 | 27 | 505 |
| 2236-572 | 22 39 12.08 | -57 1 0.84 | 27 | 695 |
| 2239-631 | 22 43 7.84 | -62 50 57.32 | 1 | 19 |
| 2243-563 | 22 46 16.79 | -56 7 46.01 | 3 | 44 |
| 2244-372 | 22 47 3.92 | -36 57 46.30 | 24 | 380 |
| 2245-328 | 22 48 38.69 | -32 35 52.19 | 22 | 492 |
| 2255-282 | 22 58 5.96 | -27 58 21.26 | 1 | 14 |
| 2300-683 | 23 3 43.56 | -68 7 37.44 | 21 | 316 |
| 2311-452 | 23 14 9.38 | -44 55 49.24 | 1 | 12 |
| 2311-477 | 23 13 51.90 | -47 29 11.73 | 1 | 3 |
| 2318-087 | 23 21 18.25 | -8 27 21.52 | 1 | 6 |
| 2321-065 | 23 23 39.11 | -6 17 59.24 | 1 | 4 |
| 2326-477 | 23 29 17.70 | -47 30 19.11 | 25 | 443 |
| 2331-240 | 23 33 55.24 | -23 43 40.66 | 2 | 14 |
| 2333-415 | 23 36 33.99 | -41 15 21.98 | 24 | 276 |
| 2333-528 | 23 36 12.14 | -52 36 21.95 | 7 | 131 |
| 2344-514 | 23 47 19.86 | -51 10 36.07 | 20 | 279 |
| 2345-500 | 23 47 43.69 | -49 46 27.88 | 1 | 5 |
| 2351-154 | 23 54 30.20 | -15 13 11.21 | 1 | 8 |
| 2353-686 | 23 56 0.68 | -68 20 3.47 | 27 | 648 |
| 2355-534 | 23 57 53.27 | -53 11 13.69 | 33 | 600 |
| 2357-318 | 23 59 35.49 | -31 33 43.82 | 20 | 308 |
Appendix B Session Summary Statistics for CRDS53-116
Table LABEL:tab:session_statistics summarises the data set used for the overview of the CRDS network performance: the first column is the session code, column 2 is the start date of the session, Column 3 is the number of IVS stations scheduled and in brackets the number that actually observed or provided usable data, column 4 is the number of scheduled observations in the session, column 5 is the number of observations that were able to be correlated, column 6 are the number of recoverable observations, column 7 are the number of observations actually used for the analysis and column 8 is the post-fit residuals in picoseconds (ps) for the session.
| Session | Start Date | Stations | Scheduled | Correlated | Recoverable | Obs | Fit |
|---|---|---|---|---|---|---|---|
| YYYY.DOY | Scheduled | Obs | Obs | Obs | Used | ps | |
| CRDS53 | 2011.222 | 5 (5) | 812 | 718 | 462 | 449 | 40.9 |
| CRDS54 | 2011.278 | 4 (3) | 696 | 217 | 149 | 142 | 45.5 |
| CRDS55 | 2011.320 | 5 (4) | 956 | 431 | 249 | 231 | 65.3 |
| CRDS56 | 2012.016 | 3 (3) | 360 | 230 | 148 | 145 | 51.4 |
| CRDS57 | 2012.032 | 3 (3) | 360 | 146 | 93 | 92 | 25.1 |
| CRDS58 | 2012.131 | 3 (3) | 861 | 619 | 559 | 557 | 38.0 |
| CRDS59 | 2012.143 | 3 (3) | 363 | 144 | 98 | 97 | 29.0 |
| CRDS60 | 2012.207 | 4 (3) | 822 | 665 | 197 | 193 | 42.4 |
| CRDS61 | 2012.256 | 5 (5) | 1087 | 1007 | 755 | 635 | 42.1 |
| CRDS62 | 2012.333 | 5 (4) | 1100 | 450 | 282 | 272 | 68.4 |
| CRDS63 | 2013.014 | 6 (4) | 1616 | 587 | 477 | 470 | 56.9 |
| CRDS64 | 2013.084 | 4 (4) | 714 | 639 | 490 | 475 | 29.6 |
| CRDS65 | 2013.128 | 6 (5) | 1616 | 786 | 371 | 353 | 38.3 |
| CRDS66 | 2013.211 | 5 (5) | 1245 | 1115 | 778 | 771 | 35.6 |
| CRDS67 | 2013.245 | 6 (6) | 1978 | 1680 | 1402 | 1382 | 38.0 |
| CRDS68 | 2013.331 | 6 (5) | 1864 | 1116 | 826 | 810 | 36.5 |
| CRDS69 | 2014.043 | 6 (5) | 1840 | 1444 | 756 | 711 | 27.0 |
| CRDS70 | 2014.097 | 6 (4) | 1884 | 936 | 523 | 506 | 36.7 |
| CRDS71 | 2014.177 | 6 (6) | 1915 | 1144 | 849 | 839 | 33.2 |
| CRDS72 | 2014.233 | 6 (6) | 1911 | 1847 | 1438 | 1393 | 32.9 |
| CRDS73 | 2014.279 | 6 (6) | 1914 | 1018 | 774 | 762 | 37.5 |
| CRDS74 | 2014.343 | 6 (6) | 1850 | 1641 | 1243 | 1215 | 40.3 |
| CRDS75 | 2015.027 | 6 (5) | 1905 | 1245 | 821 | 820 | 40.4 |
| CRDS76 | 2015.090 | 6 (6) | 1850 | 1728 | 1272 | 1247 | 25.1 |
| CRDS77 | 2015.139 | 6 (5) | 1917 | 1180 | 704 | 632 | 40.0 |
| CRDS78 | 2015.224 | 5 (5) | 1244 | 1208 | 922 | 921 | 18.8 |
| CRDS79 | 2015.265 | 5 (4) | 1220 | 615 | 431 | 431 | 27.7 |
| CRDS80 | 2015.285 | 5 (4) | 1403 | 610 | 425 | 425 | 13.4 |
| CRDS81 | 2016.027 | 6 (6) | 2003 | 1740 | 1163 | 1161 | 34.9 |
| CRDS82 | 2016.097 | 6 (6) | 2109 | 1992 | 1314 | 1312 | 31.1 |
| CRDS83 | 2016.137 | 4 (4) | 846 | 751 | 442 | 442 | 23.7 |
| CRDS84 | 2016.202 | 5 (4) | 1383 | 870 | 651 | 651 | 19.4 |
| CRDS85 | 2016.271 | 6 (6) | 2089 | 1449 | 989 | 988 | 25.0 |
| CRDS86 | 2016.328 | 6 (5) | 2101 | 1171 | 875 | 872 | 26.4 |
| CRDS87 | 2017.094 | 6 (6) | 2092 | 1719 | 1214 | 1213 | 25.9 |
| CRDS88 | 2017.137 | 5 (4) | 1362 | 707 | 531 | 531 | 23.4 |
| CRDS89 | 2017.207 | 5 (5) | 1360 | 1335 | 984 | 984 | 38.1 |
| CRDS90 | 2017.227 | 5 (5) | 1317 | 1259 | 872 | 852 | 37.2 |
| CRDS91 | 2017.270 | 5 (5) | 1341 | 1203 | 897 | 866 | 33.0 |
| CRDS92 | 2017.327 | 5 (5) | 1384 | 1369 | 937 | 905 | 37.0 |
| CRDS93 | 2018.024 | 5 (5) | 1716 | 1653 | 696 | 644 | 79.8 |
| CRDS96 | 2018.171 | 5 (5) | 1756 | 1667 | 995 | 914 | 31.4 |
| CRDS97 | 2018.226 | 5 (5) | 1779 | 1221 | 767 | 713 | 34.0 |
| CRDS98 | 2018.269 | 5 (5) | 2140 | 2090 | 1458 | 1299 | 42.4 |
| CRDS99 | 2019.015 | 5 (4) | 1386 | 620 | 365 | 340 | 47.2 |
| CRD101 | 2019.086 | 5 (5) | 1711 | 1707 | 1245 | 1186 | 40.3 |
| CRD102 | 2019.126 | 6 (6) | 2322 | 2264 | 1518 | 1422 | 33.6 |
| CRD103 | 2019.176 | 6 (6) | 2386 | 1517 | 874 | 844 | 51.4 |
| CRD104 | 2019.218 | 6 (5) | 2356 | 1482 | 738 | 719 | 34.5 |
| CRD105 | 2020.036 | 6 (6) | 2480 | 2362 | 500 | 477 | 36.4 |
| CRD106 | 2020.126 | 6 (6) | 2698 | 1468 | 550 | 527 | 52.2 |
| CRD107 | 2020.203 | 6 (6) | 2585 | 1063 | 388 | 369 | 39.3 |
| CRD108 | 2020.217 | 6 (6) | 2798 | 1369 | 333 | 303 | 36.9 |
| CRD109 | 2020.331 | 6 (6) | 2259 | 1838 | 464 | 381 | 46.6 |
| CRD110 | 2020.344 | 6 (6) | 2340 | 1592 | 441 | 432 | 46.8 |
| CRD111 | 2021.033 | 5 (5) | 1611 | 1435 | 860 | 838 | 52.1 |
| CRD112 | 2021.124 | 6 (4) | 1929 | 1038 | 923 | 910 | 23.4 |
| CRD113 | 2021.208 | 6 (5) | 1913 | 1038 | 653 | 637 | 44.5 |
| CRD114 | 2021.230 | 7 (4) | 1665 | 404 | 194 | 186 | 38.2 |
| CRD115 | 2021.286 | 9 (5) | 1715 | 394 | 232 | 227 | 21.1 |
| CRD116 | 2021.335 | 8 (4) | 1414 | 564 | 292 | 272 | 27.7 |