Identification of Bubble Nebulae around NGC 55 ULX-1 with MUSE Observations
Abstract
Using the Multi Unit Spectroscopic Explorer (MUSE) instrument on the Very Large Telescope, we identified three bubble nebulae (denoted as A, B, and C) around an ultraluminous X-ray source (ULX) in NGC 55. Bubble A shows a regular elliptical shape surrounding the ULX, with a morphology similar to the canonical ULX bubble around NGC 1313 X-2. It is most likely inflated by the ULX disk wind with a mechanical power close to erg s-1. Bubble B lies 11″ away from the ULX on the sky plane and is not contiguous to Bubble A. It displays a bow shock like morphology, and is likely driven by a collimated dark jet from the ULX with a mechanical power of about erg s-1. If this scenario is correct, we predict that Bubble B should present radio emission with a flux of about Jy at 5 GHz. Bubble C appears within Bubble A, with a velocity and velocity dispersion distinct from the rest of Bubble A. Its nature is unclear and could be part of Bubble A as a result of low local density. The optical counterpart of ULX-1 exhibits a broad H, consistent with emission from a hot disk wind.
1 Introduction
Ultraluminous X-ray sources (ULXs) are X-ray binaries with an apparent luminosity higher than erg s-1. In general, they are thought to be powered by supercritical accretion onto neutron stars or stellar-mass black holes (for reviews see Kaaret et al., 2017; Fabrika et al., 2021; King et al., 2023; Pinto & Walton, 2023). A remarkable feature for supercritical accretion is the presence of massive, ultrafast disk winds, which have been evidenced with X-ray spectroscopy (Pinto et al., 2016, 2017, 2021; Kosec et al., 2018), consistent with predictions from numerical simulations (e.g., Jiang et al., 2014; Sądowski et al., 2014; Kitaki et al., 2021).
Optical observations of ULXs may help place constraints on their compact object mass (Liu et al., 2013; Motch et al., 2014), accretion geometry (Vinokurov et al., 2013; Ambrosi & Zampieri, 2018; Yao & Feng, 2019), history of binary evolution (Madhusudhan et al., 2008; Patruno & Zampieri, 2008; Zhou et al., 2023), and interaction with the environment (e.g., Pakull & Mirioni, 2002), and are thus an important probe to their physical nature. ULXs show optical emission lines reminiscent of luminous blue variables or late nitrogen Wolf-Rayet stars, or the supercritically accreting microquasar SS 433, which are all objects with powerful winds, suggesting that the optical emission lines seen in ULXs originate from a hot disk wind (Fabrika et al., 2015).
If these winds with a high mechanical power are injected into the interstellar medium, shocks will be produced appearing as an optical nebula (Siwek et al., 2017). Indeed, optical bubble nebulae with a size of some 100 pc have been observed around many ULXs (e.g., Pakull & Mirioni, 2002, 2003; Pakull et al., 2006; Pakull & Grisé, 2008; Ramsey et al., 2006; Abolmasov et al., 2007; Abolmasov & Moiseev, 2008; Russell et al., 2011; Cseh et al., 2012; Urquhart et al., 2018; Soria et al., 2021; Gúrpide et al., 2022; Zhou et al., 2022; Guo et al., 2023). They exhibit bright [S ii] and [O i] emission, typical for shock ionization. Based on the [O iii] 5007/H and other line flux ratios, a shock velocity of about 100 km s-1 can be inferred, indicative of supersonic expansion. The emission line luminosity, bubble size, and shock velocity suggest that the wind or jet that drives the bubble has a mechanical power in the range of – erg s-1 and an age typically of Myr. Thus, ULXs are ultraluminous in terms of both radiation and mechanical output. In some cases, photoionization is a non-negligible addition to shock ionization (e.g., Abolmasov et al., 2007; Urquhart et al., 2018; Gúrpide et al., 2022; Zhou et al., 2022) and even the dominant source in powering the emission line nebula (e.g., Pakull & Mirioni, 2002; Kaaret et al., 2004; Pakull & Grisé, 2008; Kaaret & Corbel, 2009). Bubbles with a super-Eddington mechanical power are also found around non-ULXs (e.g., Pakull et al., 2010; Soria et al., 2014), similar to the W50 nebula around the Galactic microquasar SS 433 (Fabrika, 2004).
NGC 55 is an edge-on Magellanic type barred spiral galaxy located in the Sculptor group. ULX-1 is the brightest persistent X-ray source in it with a luminosity typically around a few times erg s-1 (Stobbart et al., 2004; Binder et al., 2015; Pintore et al., 2015; Pinto et al., 2017; Gúrpide et al., 2021; Jithesh, 2022; Barra et al., 2022). NGC 55 ULX-1 displays a soft X-ray spectrum and makes transitions between the soft and supersoft regimes (Pinto et al., 2017; Gúrpide et al., 2021; Barra et al., 2022). Its X-ray lightcurve occasionally exhibits sharp drops and dips (Stobbart et al., 2004; Barra et al., 2022). High-resolution X-ray spectroscopy revealed multiple components of emission and absorption lines at different velocities, indicative of disk winds in a complex dynamical structure (Pinto et al., 2017). These X-ray behaviors argue in favor of the scenario that NGC 55 ULX-1 is viewed at a relatively large inclination angle similar to other soft or supersoft ULXs (Feng et al., 2016; Urquhart & Soria, 2016a).
Despite extensive X-ray studies, optical observations of NGC 55 ULX-1 have been insufficient (e.g. Gladstone et al., 2013). Here in this work, we present optical integral field spectroscopy of NGC 55 ULX-1 and its neighborhood with the Multi Unit Spectroscopic Explorer (MUSE) instrument (Bacon et al., 2010) on the Very Large Telescope (VLT). We discovered bubble nebulae surrounding and near the ULX. The observations, data analysis and results are described in Section 2, and the possible physical nature is discussed in Section 3. To be in line with previous studies, we adopt a distance of 1.78 Mpc to NGC 55 (Karachentsev et al., 2003).
2 Observations and results
NGC 55 ULX-1 was observed with VLT MUSE on the night of May 25th, 2022, at the La Silla Paranal Observatory under the program 109.238W.002. The observation follows the object-sky-object-object-sky-object pattern and contains s on-source exposures and s sky exposures. A 90-degree rotation plus small offset dithering patterns were applied between the on-source exposures. The seeing was about 05 during the observations. The sky transparency conditions were partially cloudy, which had no impact to our target. The instrument mode used was WFM-NOAO-E, covering a wavelength range of 4600–9350 Å.
The data were reduced by the EsoRex pipeline (Weilbacher et al., 2020). For each independent exposure, we used the muse_scibasic recipe to carry out the standard correction of the bias frames, lamp flats, arc lamps, twilight flats, geometry, and illumination exposures. With standard stars taken on the same night, muse_scipost was employed to correct the telluric and flux and subtract the sky using the separate sky exposure. We used muse_exp_align to align each exposure, and muse_exp_combine to generate the final data cube. The field of view of the final data cube is , with the spaxel scale .
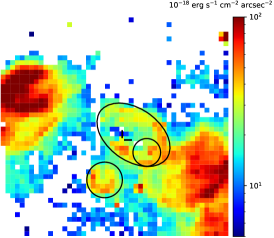
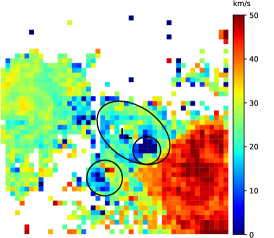
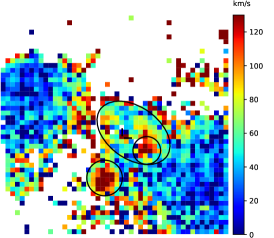
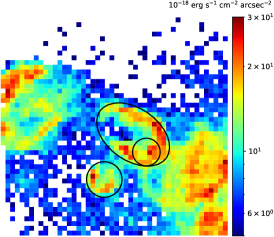
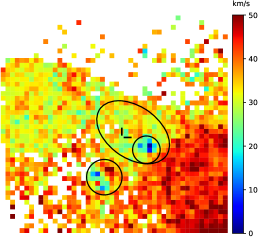
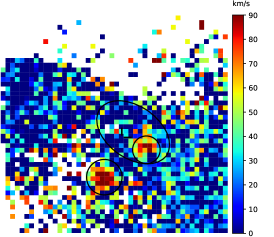
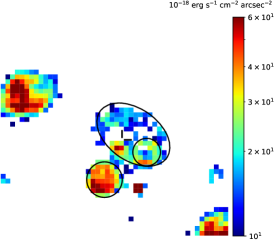
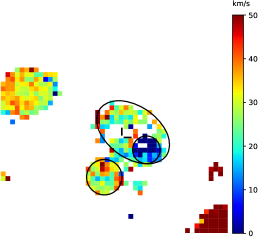
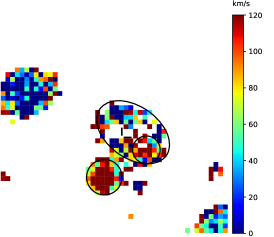
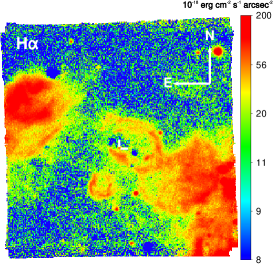
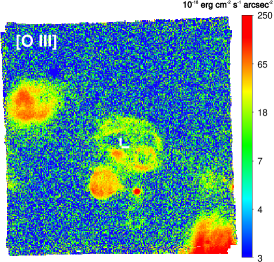
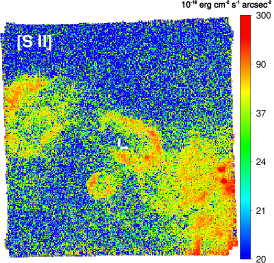
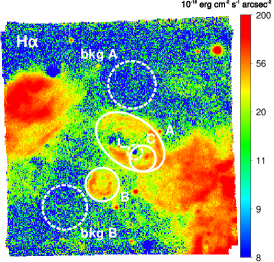
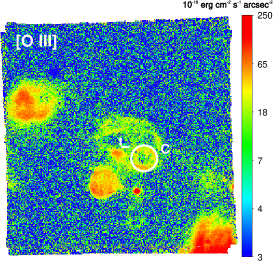
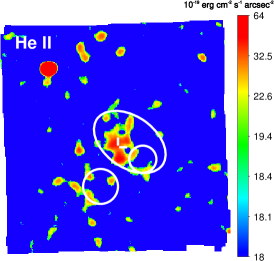
Figure 1 shows the H, [O iii] 5007, [S ii] 6716, and He ii 4686 images with fluxes directly extracted from the spectrum on each pixel. Three bubble nebulae are revealed: (A) an elliptical bubble with an extension of surrounding the ULX, (B) a nearly circular bubble with a diameter of 9″ to the southeast of the ULX, and (C) a possible circular bubble within Bubble A with a diameter of 7″ best visible in [O iii]. They are indicated in Figure 1. Specifically, Bubbles A and B can be outlined with an H brightness higher than erg cm-2 s-1 arcsec-2, and Bubble C isolates with [O iii] 5007 higher than erg cm-2 s-1 arcsec-2. We note that there is a possible star cluster with strong continuum emission and Balmer absorption features in NGC 55 along the line of sight to Bubble A (see Figure 1 in Gladstone et al., 2013). It shows a radial velocity consistent with that of the southwestern star forming region, indicating that it is not physically associated with the bubbles. It is encircled with a dashed region in Figure 1 (within Bubble A and overlapped with Bubble C), and the data in it are discarded in this work. To the west of Bubble B and south of Bubble C, there is a bright, spatially unresolved object shown in H and [O iii] images. It has no obvious counterparts in the Hubble Space Telescope (HST) images, and has narrow (unresolved) line width. It shows a velocity significantly different from that of Bubble B. The luminosities and flux ratios of the emission lines indicate that it may be a planetary nebula in NGC 55 (Frew & Parker, 2010; Parker, 2022; Ritter et al., 2023).
For H, the [S ii] doublet, and the [O iii] doublet, which have the highest signal-to-noise (S/N) ratios, we extracted the line properties over a pixel binning. Each line is fitted with a Gaussian. The continuum is first determined from nearby wavelength intervals without emission lines and then subtracted. The doublet are fitted jointly forcing the same velocity and width. The flux ratio is fixed at 2.98 for [O iii] 4959,5007 (Storey & Zeippen, 2000), but set free for [S ii] 6716, 6731. The maps for line flux, velocity, and velocity dispersion (always in FWHM and with instrument broadening corrected in this work) are shown in Figure 2, 3, and 4, respectively, for H, [S ii], and [O iii]. In this work, the velocity refers to the relative radial motion with respect to the host galaxy (), and a negative velocity means blueshift. On the velocity and velocity dispersion maps, the three bubbles are distinct from the western star forming region, with more blueshift and a higher velocity dispersion, suggesting that they are not physically associated. Bubble C is also distinct from Bubble A in the same way, perhaps justifying an individual identification. It is also possible that Bubble C is a substructure of Bubble A. In the following, we provide the analysis results for both Bubble A (including C) and Bubble A C (without C).
| Line | FWHM | ||
|---|---|---|---|
| ( erg cm-2 s-1) | (km s-1) | (km s-1) | |
| A | |||
| He ii 4686 | |||
| H | |||
| [O iii] 4959 | |||
| [O iii] 5007 | |||
| [N ii] 6548 | |||
| H | |||
| [N ii] 6583 | |||
| [S ii] 6716 | |||
| [S ii] 6731 | |||
| A C | |||
| He ii 4686 | |||
| H | |||
| [O iii] 4959 | |||
| [O iii] 5007 | |||
| [N ii] 6548 | |||
| H | |||
| [N ii] 6583 | |||
| [S ii] 6716 | |||
| [S ii] 6731 | |||
| B | |||
| He ii 4686 | |||
| H | |||
| [O iii] 4959 | |||
| [O iii] 5007 | |||
| [N ii] 6548 | |||
| H | |||
| [N ii] 6583 | |||
| [S ii] 6716 | |||
| [S ii] 6731 | |||
| C | |||
| He ii 4686 | |||
| H | |||
| [O iii] 4959 | |||
| [O iii] 5007 | |||
| [N ii] 6548 | |||
| H | |||
| [N ii] 6583 | |||
| [S ii] 6716 | |||
| [S ii] 6731 | |||
Note. — 90% upper limits are quoted if the parameter cannot be determined.
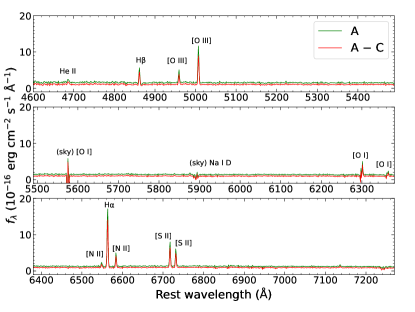
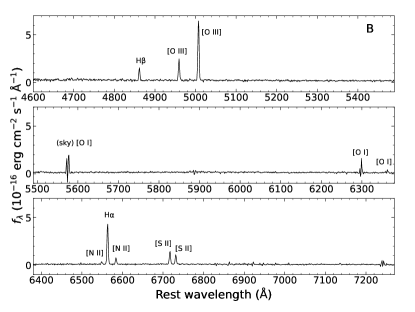
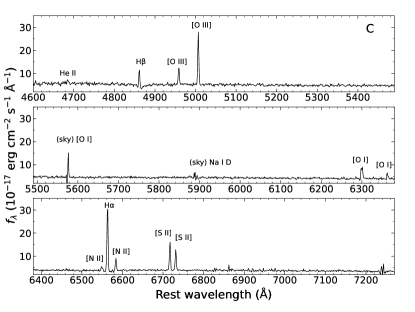
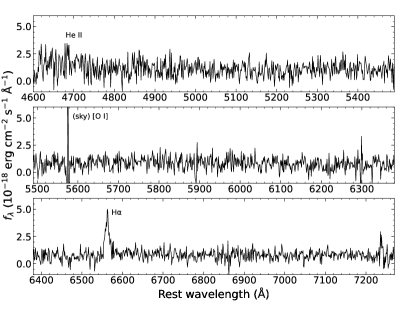
The optical spectra extracted from the bubbles are displayed in Figure 5. Significant emission lines are fitted with Gaussians locally in the same manner as described above, with the flux, velocity, and velocity dispersion listed in Table 1.
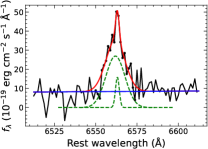
The optical counterpart111In this work, the optical counterpart refers to the optical object with emission originating from the ULX binary system. of NGC 55 ULX-1 has been identified by aligning the Chandra and HST images (Gladstone et al., 2013). Based on the error circle, they found two potential optical counterparts in HST images. Their “source 2” does not display any detectable emission line and is only visible in the continuum image. “Source 1” shows a number of emission lines and in particular a broad H, and we determine it as the optical counterpart to ULX-1. The optical spectrum of the optical counterpart is extracted from a circular region centered on it with a radius of 06, and the background is estimated from a nearby region within Bubble A where the H surface brightness is similar. The spectrum is shown in Figure 6, with a decomposition of H. The H emission line contains a broad component. We thus fit it with two Gaussians on top of a continuum. The continuum was first determined using data in 6475–6500 Å and 6625–6650 Å and subtracted. The two Gaussians are for the narrow and broad components, respectively. For the narrow component, the intrinsic width cannot be well constrained and we thus fixed it at the typical nebular value of 30 km s-1. We tried different background regions where the nebular contribution to the narrow component and continuum may vary, but found that we obtained consistent results for the broad component, which has a FWHM of km s-1 and an equivalent width of about 50 Å. We note that the continuum level is rather low, and highly dependent on how one chooses the background region. Thus, the equivalent width may come with large uncertainties up to a factor of 3.
3 Discussion
In this work, we present VLT MUSE observations of NGC 55 ULX-1 and its local environment. Three bubble nebulae as well as the ULX optical counterpart are identified. The projected extension/diameter is about 180 pc 110 pc for Bubble A, and 80 pc for Bubble B, similar to but slightly smaller than bubbles found around other ULXs (Pakull & Mirioni, 2002, 2003). Based on the measured H/H flux ratio and assuming an intrinsic Balmer decrement H/H = 2.95–2.99 (Allen et al., 2008), the total extinction including the Galactic contribution is derived as = 0.38, 0.34, 0.25, and 0.59, respectively, for Bubbles A, A C, B, and C. We adopt these values in the following analysis and assume a Galactic extinction law (Cardelli et al., 1989) for extinction correction.
| Ratio | A | 300† | 275‡ | A C | 300† | 250‡ | B | 425† | 350‡ | C | 375† | 300‡ |
|---|---|---|---|---|---|---|---|---|---|---|---|---|
| [O iii] 5007/H | 2.64 | 2.20 | 5.60 | 5.59 | 4.05 | 4.11 | ||||||
| [N ii] 6583/H | 0.83 | 0.67 | 0.99 | 0.78 | 0.96 | 0.78 | ||||||
| [S ii]/H | 0.57 | 0.29 | 0.61 | 0.37 | 0.62 | 0.35 |

The velocity dispersion is typically 30 km s-1 for Bubble A or A C, 100 km s-1 for Bubble B, and 70 km s-1 for Bubble C. The relatively high velocity dispersions in particular for Bubbles B and C suggest that they are more likely due to shock-ionization than photoionization. Even for Bubble A, which has the smallest velocity dispersion, its regular elliptical shape (similar to the bubble around NGC 1313 X-2; Pakull & Mirioni, 2002; Zhou et al., 2022) indicates that it is powered by winds from the ULX. In Figure 7, we plot the diagnostic diagram using emission line flux ratios (Baldwin et al., 1981) for the bubbles together with other known ULX nebulae. As one can see, the bubbles around NGC 55 ULX-1 belong to the shock-ionization regime, although such an approach is illustrative and may have a large uncertainty.
The emission line flux ratios for the bubbles are listed in Table 2 and compared with theoretical predictions due to shock-ionization based on MAPPINGS III simulations (Allen et al., 2008). In Table 2, we quoted the tabulated MAPPINGS III results that best match the observed [O iii] 5007/H. Assuming solar abundance, an interstellar medium (ISM) number density cm-3, and a magnetic field G, a shock velocity of 300 km s-1, 300 km s-1, 425 km s-1, and 375 km s-1 can explain the observed [O iii] 5007/H flux ratio seen in Bubbles A, A C, B, and C, respectively. In all the cases, the predicted [S ii]/H can also provide a reasonable fit with observations. We note that the same shock velocities and similar line flux ratios can be derived if one assumes cm-3. The observed [N ii] 6583/H is significantly lower compared with simulations, similar to the situation seen in other ULX bubble nebulae, e.g., NGC 1313 X-1 (Gúrpide et al., 2022) & X-2 (Ripamonti et al., 2011; Zhou et al., 2022) and NGC 5585 X-1 (Soria et al., 2021), suggestive of a lower abundance of nitrogen. The nature of nitrogen deficit is unclear. If we assume a subsolar abundance in MAPPINGS III to match the observed [N ii] 6583/H, the [S ii]/H ratio cannot be reconciled. If we assume cm-3, the best-fit shock velocities are reduced to 275 km s-1, 250 km s-1, 350 km s-1, and 300 km s-1, respectively, for Bubbles A, A C, B, and C. The predicted line flux ratios in these cases are also listed in Table 2. As one can see, with cm-3, the [S ii]/H is moderately underestimated, and an overestimation of [N ii] 6583/H still exists with a reduced tension.
For a pressure driven bubble, the bubble radius (), shock velocity (), and age () are related as (Weaver et al., 1977)
| (1) | ||||
| (2) | ||||
| (3) |
where is the total jet/wind mechanical power and is the pre-shock ISM density. The ISM number density can be inferred from the H surface brightness and the shock velocity as (Dopita & Sutherland, 1996)
| (4) |
where can be found from the H luminosity as . Assuming solar abundance with neutral gas, we have the average atomic weight (Asplund et al., 2009) and , where is the proton mass. Plugging in the observed H luminosity, bubble size, and the inferred shock velocity from MAPPINGS III simulations, we obtained the wind power and age in Table 3, with two sets of shock velocities derived with and 0.01 cm-3, respectively. The density derived from Eq. (4) is relatively low, in the range of 0.01–0.04 cm-3, more consistent with the cm-3 assumption. As discussed above, to fit the observed [O iii] 5007/H and [S ii]/H simultaneously, a relatively high density of 0.1–1 cm-3 is needed. To solve this problem, a dedicated modeling of the nebulae with both shock-ionization and photoionization is perhaps needed. The current data suggest that the true density should be not far away from the range of 0.1–1 cm-3.
In Bubbles A (or A C) and C, the He ii 4686 emission is found to be much broader than other lines. In Figure 1, the He ii 4686 shows a distribution concentrated toward the ULX position. The image also suggests that the He ii flux measured in Bubble C is in fact “leaked” from Bubble A. This suggests that the broad He ii may have reflected a new component of gas in the shock heated low-density bubble interior (Weaver et al., 1977; Siwek et al., 2017) to a high temperature and ionization state. We note that photoionization usually produces a narrow line width for high ionization species, e.g., as one can see in the nebula around M51 ULX-1 (Urquhart et al., 2018). Thus, the broad He ii emission is not due to photoionization.
| Bubble | |||||
|---|---|---|---|---|---|
| ( erg s-1) | (pc) | (Myr) | (km s-1) | (cm-3) | |
| derived assuming cm-3 | |||||
| A | |||||
| A C | 0.17 | 300 | |||
| B | 39 | 0.05 | 425 | ||
| C | 30 | 0.05 | 375 | ||
| derived assuming cm-3 | |||||
| A | |||||
| A C | 0.20 | 250 | |||
| B | 39 | 0.06 | 350 | ||
| C | 30 | 0.06 | 300 | ||
Bubble A is in good analogy to the bubble nebula surrounding NGC 1313 X-2 (Pakull & Mirioni, 2002, 2003; Zampieri et al., 2004; Mucciarelli et al., 2005; Pakull et al., 2006; Ramsey et al., 2006; Ripamonti et al., 2011; Zhou et al., 2022). The mechanical power needed to power it is close to the X-ray luminosity, both on the order of erg s-1. This nebula or all the surrounding nebulae seem to have the least mechanical power among ULX bubbles, consistent with the fact that its X-ray luminosity is just above the ULX threshold. The closest case would be NGC 51 ULX-1, which has a mechanical power and X-ray luminosity both around erg s-1 (Urquhart & Soria, 2016b; Urquhart et al., 2018). However, as the observed X-ray flux may be beamed toward our line of sight or heavily obscured by the thick disk or wind, we do not expect a tight correlation between them, e.g., the X-ray luminosities of SS 433 and NGC 7793 S26 are far less than the mechanical powers of their surrounding nebulae.
Bubble B projects 11″ (or at least 95 pc) to the ULX on the sky plane, and is apparently not contiguous to Bubble A. Its morphology is reminiscent of a bow shock, with emission enhanced toward the edge away from the ULX direction, see the H and [O iii] images in Figure 1. Therefore, we argue that Bubble B is plausibly inflated by a collimated jet launched from the ULX, similar to the nebula around NGC 7793 S26 (Pakull et al., 2010; Soria et al., 2010), Cygnus X-1 (Gallo et al., 2005), SS 433/W50 (Fabrika, 2004), or radio lobes from active galactic nuclei.
If this is the case, we predict that there should be detectable radio emission around Bubble B. Assuming synchrotron emission under the minimum-energy approximation, the radio specific flux is roughly scaled with the jet power, age, and medium density as (Soria et al., 2010)
| (5) |
Taking mJy, erg s-1, Myr, cm-3, and a distance of 3.9 Mpc for NGC 7793 S26 (Pakull et al., 2010; Soria et al., 2010), we estimate a total radio flux of roughly 1–3 Jy at 5 GHz for Bubble B. We may also make a direct comparison with the radio nebula W50 around SS 433, where the jets have a similar power of erg s-1 as in our case. W50 has a flux density of 34 Jy at 4.75 GHz (Downes et al., 1986), and would appear to be about 200-300 Jy if it is located at a distance of 1.78 Mpc instead of 5 kpc (Fabrika, 2004). Therefore, the radio emission in Bubble B is estimated to have a specific flux density of about Jy.
The nature of Bubble C is unclear. If Bubble B is inflated by a collimated jet, it would be difficult to explain Bubble C as a result of another jet, and vice versa. There is no peculiarity around the Bubble C region in HST broad band images. We cannot rule out that Bubble C is simply a part of Bubble A. The broad line width seen in it could be a consequence of low density in this region.
A transient X-ray source T2 with a peak luminosity of erg s-1 appears on the sky plane near the ULX (Jithesh & Wang, 2016). The angular separation is about 90″, corresponding to a projected distance of 780 pc, from T2 to the bubbles. This is much longer than any known jet powered nebulae such as those around Cygnus X-1 (5 pc; Gallo et al., 2005), SS 433 (100 pc; Fabrika, 2004), and NGC 7793 S26 (150 pc; Pakull et al., 2010). Thus, it is unlikely that there is a physical connection between T2 and the bubbles.
The H emission in the spectrum of the ULX optical counterpart contains a broad component with a FWHM of about 600 km s-1 and an equivalent width of roughly 50Å, similar to the H line seen in many other ULXs (Fabrika et al., 2015). The He ii 4686 line is barely seen in the spectrum; the low S/N does not allow us to characterize its properties. One possible origin of the emission lines could be the hot wind as suggested by Fabrika et al. (2015). In that case, He ii arises from a location closer to the central compact object in an accelerating wind and should have a velocity dispersion smaller than H. We examined the spectrum and found that a He ii line width of km s-1 is consistent with the low S/N data.
We note that the above analysis and discussions mainly count on the emission line intensity and flux ratios. Useful information encoded in the velocity dispersion and morphology has not been fully utilized. For a complete understanding of these bubble nebulae, future 3D numerical simulations are needed.
References
- Abolmasov et al. (2007) Abolmasov, P., Fabrika, S., Sholukhova, O., & Afanasiev, V. 2007, Astrophysical Bulletin, 62, 36, doi: 10.1134/S199034130701004X
- Abolmasov & Moiseev (2008) Abolmasov, P., & Moiseev, A. V. 2008, Rev. Mexicana Astron. Astrofis., 44, 301, doi: 10.48550/arXiv.0806.4527
- Allen et al. (2008) Allen, M. G., Groves, B. A., Dopita, M. A., Sutherland, R. S., & Kewley, L. J. 2008, ApJS, 178, 20, doi: 10.1086/589652
- Ambrosi & Zampieri (2018) Ambrosi, E., & Zampieri, L. 2018, MNRAS, 480, 4918, doi: 10.1093/mnras/sty2213
- Asplund et al. (2009) Asplund, M., Grevesse, N., Sauval, A. J., & Scott, P. 2009, ARA&A, 47, 481, doi: 10.1146/annurev.astro.46.060407.145222
- Bacon et al. (2010) Bacon, R., Accardo, M., Adjali, L., et al. 2010, in Society of Photo-Optical Instrumentation Engineers (SPIE) Conference Series, Vol. 7735, Ground-based and Airborne Instrumentation for Astronomy III, ed. I. S. McLean, S. K. Ramsay, & H. Takami, 773508, doi: 10.1117/12.856027
- Baldwin et al. (1981) Baldwin, J. A., Phillips, M. M., & Terlevich, R. 1981, PASP, 93, 5, doi: 10.1086/130766
- Barra et al. (2022) Barra, F., Pinto, C., Walton, D. J., et al. 2022, MNRAS, 516, 3972, doi: 10.1093/mnras/stac2453
- Binder et al. (2015) Binder, B., Williams, B. F., Eracleous, M., et al. 2015, AJ, 150, 94, doi: 10.1088/0004-6256/150/3/94
- Cardelli et al. (1989) Cardelli, J. A., Clayton, G. C., & Mathis, J. S. 1989, ApJ, 345, 245, doi: 10.1086/167900
- Cseh et al. (2012) Cseh, D., Corbel, S., Kaaret, P., et al. 2012, ApJ, 749, 17, doi: 10.1088/0004-637X/749/1/17
- Dopita & Sutherland (1996) Dopita, M. A., & Sutherland, R. S. 1996, ApJS, 102, 161, doi: 10.1086/192255
- Downes et al. (1986) Downes, A. J. B., Pauls, T., & Salter, C. J. 1986, MNRAS, 218, 393, doi: 10.1093/mnras/218.3.393
- Fabrika (2004) Fabrika, S. 2004, Astrophys. Space Phys. Res., 12, 1, doi: 10.48550/arXiv.astro-ph/0603390
- Fabrika et al. (2015) Fabrika, S., Ueda, Y., Vinokurov, A., Sholukhova, O., & Shidatsu, M. 2015, Nature Physics, 11, 551, doi: 10.1038/nphys3348
- Fabrika et al. (2021) Fabrika, S. N., Atapin, K. E., Vinokurov, A. S., & Sholukhova, O. N. 2021, Astrophysical Bulletin, 76, 6, doi: 10.1134/S1990341321010077
- Feng et al. (2016) Feng, H., Tao, L., Kaaret, P., & Grisé, F. 2016, ApJ, 831, 117, doi: 10.3847/0004-637X/831/2/117
- Frew & Parker (2010) Frew, D. J., & Parker, Q. A. 2010, PASA, 27, 129, doi: 10.1071/AS09040
- Gallo et al. (2005) Gallo, E., Fender, R., Kaiser, C., et al. 2005, Nature, 436, 819, doi: 10.1038/nature03879
- Gladstone et al. (2013) Gladstone, J. C., Copperwheat, C., Heinke, C. O., et al. 2013, ApJS, 206, 14, doi: 10.1088/0067-0049/206/2/14
- Guo et al. (2023) Guo, J., Wu, J., Feng, H., et al. 2023, ApJ, 946, 72, doi: 10.3847/1538-4357/acaddd
- Gúrpide et al. (2021) Gúrpide, A., Godet, O., Koliopanos, F., Webb, N., & Olive, J. F. 2021, A&A, 649, A104, doi: 10.1051/0004-6361/202039572
- Gúrpide et al. (2022) Gúrpide, A., Parra, M., Godet, O., Contini, T., & Olive, J. F. 2022, A&A, 666, A100, doi: 10.1051/0004-6361/202142229
- Jiang et al. (2014) Jiang, Y.-F., Stone, J. M., & Davis, S. W. 2014, ApJ, 796, 106, doi: 10.1088/0004-637X/796/2/106
- Jithesh (2022) Jithesh, V. 2022, MNRAS, 509, 5166, doi: 10.1093/mnras/stab3307
- Jithesh & Wang (2016) Jithesh, V., & Wang, Z. 2016, ApJ, 821, 24, doi: 10.3847/0004-637X/821/1/24
- Kaaret & Corbel (2009) Kaaret, P., & Corbel, S. 2009, ApJ, 697, 950, doi: 10.1088/0004-637X/697/1/950
- Kaaret et al. (2017) Kaaret, P., Feng, H., & Roberts, T. P. 2017, ARA&A, 55, 303, doi: 10.1146/annurev-astro-091916-055259
- Kaaret et al. (2004) Kaaret, P., Ward, M. J., & Zezas, A. 2004, MNRAS, 351, L83, doi: 10.1111/j.1365-2966.2004.08020.x
- Karachentsev et al. (2003) Karachentsev, I. D., Grebel, E. K., Sharina, M. E., et al. 2003, A&A, 404, 93, doi: 10.1051/0004-6361:20030170
- Kewley et al. (2001) Kewley, L. J., Dopita, M. A., Sutherland, R. S., Heisler, C. A., & Trevena, J. 2001, ApJ, 556, 121, doi: 10.1086/321545
- King et al. (2023) King, A., Lasota, J.-P., & Middleton, M. 2023, New A Rev., 96, 101672, doi: 10.1016/j.newar.2022.101672
- Kitaki et al. (2021) Kitaki, T., Mineshige, S., Ohsuga, K., & Kawashima, T. 2021, PASJ, 73, 450, doi: 10.1093/pasj/psab011
- Kosec et al. (2018) Kosec, P., Pinto, C., Walton, D. J., et al. 2018, MNRAS, 479, 3978, doi: 10.1093/mnras/sty1626
- Lehmann et al. (2005) Lehmann, I., Becker, T., Fabrika, S., et al. 2005, A&A, 431, 847, doi: 10.1051/0004-6361:20035827
- Liu et al. (2013) Liu, J.-F., Bregman, J. N., Bai, Y., Justham, S., & Crowther, P. 2013, Nature, 503, 500, doi: 10.1038/nature12762
- Madhusudhan et al. (2008) Madhusudhan, N., Rappaport, S., Podsiadlowski, P., & Nelson, L. 2008, ApJ, 688, 1235, doi: 10.1086/592237
- Motch et al. (2014) Motch, C., Pakull, M. W., Soria, R., Grisé, F., & Pietrzyński, G. 2014, Nature, 514, 198, doi: 10.1038/nature13730
- Mucciarelli et al. (2005) Mucciarelli, P., Zampieri, L., Falomo, R., Turolla, R., & Treves, A. 2005, ApJ, 633, L101, doi: 10.1086/498448
- Pakull & Grisé (2008) Pakull, M. W., & Grisé, F. 2008, in American Institute of Physics Conference Series, Vol. 1010, A Population Explosion: The Nature & Evolution of X-ray Binaries in Diverse Environments, ed. R. M. Bandyopadhyay, S. Wachter, D. Gelino, & C. R. Gelino, 303–307, doi: 10.1063/1.2945062
- Pakull et al. (2006) Pakull, M. W., Grisé, F., & Motch, C. 2006, in Populations of High Energy Sources in Galaxies, ed. E. J. A. Meurs & G. Fabbiano, Vol. 230, 293–297, doi: 10.1017/S1743921306008489
- Pakull & Mirioni (2002) Pakull, M. W., & Mirioni, L. 2002, arXiv e-prints, astro, doi: 10.48550/arXiv.astro-ph/0202488
- Pakull & Mirioni (2003) Pakull, M. W., & Mirioni, L. 2003, in Revista Mexicana de Astronomia y Astrofisica Conference Series, Vol. 15, Revista Mexicana de Astronomia y Astrofisica Conference Series, ed. J. Arthur & W. J. Henney, 197–199
- Pakull et al. (2010) Pakull, M. W., Soria, R., & Motch, C. 2010, Nature, 466, 209, doi: 10.1038/nature09168
- Parker (2022) Parker, Q. A. 2022, Frontiers in Astronomy and Space Sciences, 9, 895287, doi: 10.3389/fspas.2022.895287
- Patruno & Zampieri (2008) Patruno, A., & Zampieri, L. 2008, MNRAS, 386, 543, doi: 10.1111/j.1365-2966.2008.13063.x
- Pinto et al. (2016) Pinto, C., Middleton, M. J., & Fabian, A. C. 2016, Nature, 533, 64, doi: 10.1038/nature17417
- Pinto & Walton (2023) Pinto, C., & Walton, D. J. 2023, arXiv e-prints, arXiv:2302.00006, doi: 10.48550/arXiv.2302.00006
- Pinto et al. (2017) Pinto, C., Alston, W., Soria, R., et al. 2017, MNRAS, 468, 2865, doi: 10.1093/mnras/stx641
- Pinto et al. (2021) Pinto, C., Soria, R., Walton, D. J., et al. 2021, MNRAS, 505, 5058, doi: 10.1093/mnras/stab1648
- Pintore et al. (2015) Pintore, F., Esposito, P., Zampieri, L., Motta, S., & Wolter, A. 2015, MNRAS, 448, 1153, doi: 10.1093/mnras/stv028
- Ramsey et al. (2006) Ramsey, C. J., Williams, R. M., Gruendl, R. A., et al. 2006, ApJ, 641, 241, doi: 10.1086/499070
- Ripamonti et al. (2011) Ripamonti, E., Mapelli, M., Zampieri, L., & Colpi, M. 2011, Astronomische Nachrichten, 332, 418, doi: 10.1002/asna.201011512
- Ritter et al. (2023) Ritter, A., Parker, Q. A., Sabin, L., et al. 2023, MNRAS, 520, 773, doi: 10.1093/mnras/stac2896
- Roberts et al. (2003) Roberts, T. P., Goad, M. R., Ward, M. J., & Warwick, R. S. 2003, MNRAS, 342, 709, doi: 10.1046/j.1365-8711.2003.06593.x
- Russell et al. (2011) Russell, D. M., Yang, Y. J., Gladstone, J. C., Wiersema, K., & Roberts, T. P. 2011, Astronomische Nachrichten, 332, 371, doi: 10.1002/asna.201011502
- Siwek et al. (2017) Siwek, M., Sądowski, A., Narayan, R., Roberts, T. P., & Soria, R. 2017, MNRAS, 470, 361, doi: 10.1093/mnras/stx1185
- Sądowski et al. (2014) Sądowski, A., Narayan, R., McKinney, J. C., & Tchekhovskoy, A. 2014, MNRAS, 439, 503, doi: 10.1093/mnras/stt2479
- Soria et al. (2014) Soria, R., Long, K. S., Blair, W. P., et al. 2014, Science, 343, 1330, doi: 10.1126/science.1248759
- Soria et al. (2010) Soria, R., Pakull, M. W., Broderick, J. W., Corbel, S., & Motch, C. 2010, MNRAS, 409, 541, doi: 10.1111/j.1365-2966.2010.17360.x
- Soria et al. (2021) Soria, R., Pakull, M. W., Motch, C., et al. 2021, MNRAS, 501, 1644, doi: 10.1093/mnras/staa3784
- Stobbart et al. (2004) Stobbart, A. M., Roberts, T. P., & Warwick, R. S. 2004, MNRAS, 351, 1063, doi: 10.1111/j.1365-2966.2004.07848.x
- Storey & Zeippen (2000) Storey, P. J., & Zeippen, C. J. 2000, MNRAS, 312, 813, doi: 10.1046/j.1365-8711.2000.03184.x
- Urquhart & Soria (2016a) Urquhart, R., & Soria, R. 2016a, MNRAS, 456, 1859, doi: 10.1093/mnras/stv2293
- Urquhart & Soria (2016b) —. 2016b, ApJ, 831, 56, doi: 10.3847/0004-637X/831/1/56
- Urquhart et al. (2018) Urquhart, R., Soria, R., Johnston, H. M., et al. 2018, MNRAS, 475, 3561, doi: 10.1093/mnras/sty014
- Vinokurov et al. (2013) Vinokurov, A., Fabrika, S., & Atapin, K. 2013, Astrophysical Bulletin, 68, 139, doi: 10.1134/S1990341313020028
- Weaver et al. (1977) Weaver, R., McCray, R., Castor, J., Shapiro, P., & Moore, R. 1977, ApJ, 218, 377, doi: 10.1086/155692
- Weilbacher et al. (2020) Weilbacher, P. M., Palsa, R., Streicher, O., et al. 2020, A&A, 641, A28, doi: 10.1051/0004-6361/202037855
- Yao & Feng (2019) Yao, Y., & Feng, H. 2019, ApJ, 884, L3, doi: 10.3847/2041-8213/ab44c7
- Zampieri et al. (2004) Zampieri, L., Mucciarelli, P., Falomo, R., et al. 2004, ApJ, 603, 523, doi: 10.1086/381541
- Zhou et al. (2022) Zhou, C., Bian, F., Feng, H., & Huang, J. 2022, ApJ, 935, 38, doi: 10.3847/1538-4357/ac815f
- Zhou et al. (2023) Zhou, C., Feng, H., & Bian, F. 2023, ApJ, 947, 52, doi: 10.3847/1538-4357/acc5eb