ORGan: Observation-Guided Radiology Report Generation via Tree Reasoning
Abstract
This paper explores the task of radiology report generation, which aims at generating free-text descriptions for a set of radiographs. One significant challenge of this task is how to correctly maintain the consistency between the images and the lengthy report. Previous research explored solving this issue through planning-based methods, which generate reports only based on high-level plans. However, these plans usually only contain the major observations from the radiographs (e.g., lung opacity), lacking much necessary information, such as the observation characteristics and preliminary clinical diagnoses. To address this problem, the system should also take the image information into account together with the textual plan and perform stronger reasoning during the generation process. In this paper, we propose an Observation-guided radiology Report Generation framework (ORGan). It first produces an observation plan and then feeds both the plan and radiographs for report generation, where an observation graph and a tree reasoning mechanism are adopted to precisely enrich the plan information by capturing the multi-formats of each observation. Experimental results demonstrate that our framework outperforms previous state-of-the-art methods regarding text quality and clinical efficacy.111Our code is available at https://github.com/wjhou/ORGan.
1 Introduction
Radiology reports, which contain the textual description for a set of radiographs, are critical in the process of medical diagnosis and treatment. Nevertheless, the interpretation of radiographs is very time-consuming, even for experienced radiologists (5-10 minutes per image). Due to its large potential to alleviate the strain on the healthcare workforce, automated radiology report generation Anderson et al. (2018); Rennie et al. (2017) has attracted increasing research attention.
One significant challenge of this task is how to correctly maintain the consistency between the image and the lengthy textual report. Many previous works proposed to solve this through planning-based generation by first concluding the major observations identified in the radiographs before the word-level realization Jing et al. (2018); You et al. (2021); Nooralahzadeh et al. (2021); Nishino et al. (2022). Despite their progress, these methods still struggle to maintain the cross-modal consistency between radiographs and reports. A significant problem within these methods is that, in the stage of word-level generation, the semantic information of observations and radiographs is not fully utilized. They either generate the report only based on the high-level textual plan (i.e., major observations) or ignore the status of an observation (i.e., positive, negative, and uncertain), which is far from adequate. The observations contained in the high-level plan are extremely concise (e.g., lung opacity), while the final report needs to include more detailed information, such as the characteristics of the observation (e.g., a subtle but new lung opacity) and requires preliminary diagnosis inference based on the observation (e.g., lung infection must be suspected). In order to identify those detailed descriptions and clinical inferences about the observations, we need to further consider the image information together with the textual plan, and stronger reasoning must be adopted during the generation process.
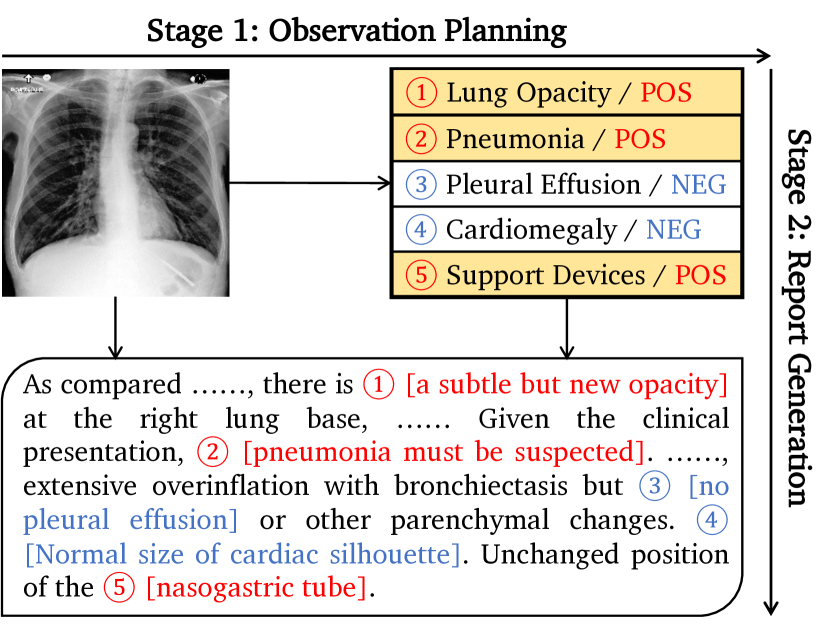
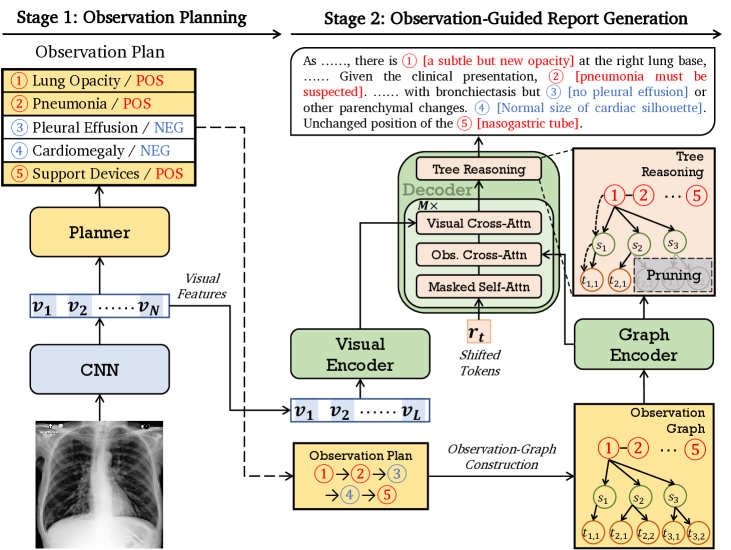
In this paper, we propose ORGan, an Observation-guided radiology Report Generation framework. Our framework mainly involves two stages, i.e., the observation planning and the report generation stages, as depicted in Figure 1. In the first stage, our framework produces the observation plan based on the given images, which includes the major findings from the radiographs and their statuses (i.e., positive, negative, and uncertain). In the second stage, we feed both images and the observation plan into a Transformer model to generate the report. Here, a tree reasoning mechanism is devised to enrich the concise observation plan precisely. Specifically, we construct a three-level observation graph, with the high-level observations as the first level, the observation-aware n-grams as the second level, and the specific tokens as the third level. These observation-aware n-grams capture different common descriptions of the observations and serve as the component of observation mentions. Then, we use the tree reasoning mechanism to capture observation-aware information by dynamically aggregating nodes in the graph.
In conclusion, our main contributions can be summarized as follows:
-
•
We propose an Observation-guided radiology Report Generation framework (ORGan) that can maintain the clinical consistency between radiographs and generated free-text reports.
-
•
To achieve better observation realization, we construct a three-level observation graph containing observations, n-grams, and tokens based on the training corpus. Then, we perform tree reasoning over the graph to dynamically select observation-relevant information.
-
•
We conduct extensive experiments on two publicly available benchmarks, and experimental results demonstrate the effectiveness of our model. We also conduct a detailed case analysis to illustrate the benefits of incorporating observation-related information.
2 Methodology
2.1 Overview of the Proposed Framework
Given an image , the probability of a report is denoted as . Our framework decomposes into two stages, where the first stage is observation planning, and the second stage is report generation. Specifically, observations of an image are firstly produced, modeled as . Then, the report is generated based on the observation plan and the image, modeled as . Finally, our framework maximizes the following probability:
2.2 Observation Plan Extraction and Graph Construction
Observation Plan Extraction. There are two available tools for extracting observation labels from reports, which are CheXpert Irvin et al. (2019) and CheXbert Smit et al. (2020). We use CheXbert222https://github.com/stanfordmlgroup/CheXbert instead of CheXpert because the former achieved better performance. To extract the observation plan of a given report, we first adopt the CheXbert to obtain the observation labels within 14 categories as indicated in Irvin et al. (2019). More details about the distribution of observation can be found in Appendix A.1. The label (or status) of each category belongs to Present, Absent, and Uncertain, except the No Finding category, which only belongs to Present and Absent. To simplify the observation plan and emphasize the abnormalities presented in a report, we regard Present and Uncertain as Positive and Absent as Negative. Then, observations are divided into a positive collection and a negative collection , and each category with its corresponding label is then converted to its unique observation or , resulting in 28 observations. For example, as indicated in Figure 1, the report presents Lung Opacity while Cardiomegaly is absent in it. These categories are converted to two observations: Lung Opacity/POS and Cardiomegaly/NEG. Then, we locate each observation by matching mentions in the report and order them according to their positions. These mentions are either provided by Irvin et al. (2019)333https://github.com/stanfordmlgroup/chexpert-labeler or extracted from the training corpus (i.e., n-grams), as will be illustrated in the following part. Finally, we can obtain the image’s observation plan .
Tree-Structured Observation Graph Construction. Since observations are high-level concepts that are implicitly related to tokens in reports, it could be difficult for a model to realize these concepts in detailed reports without more comprehensive modeling. Thus, we propose to construct an observation graph by extracting observation-related n-grams as the connections between observations and tokens for better observation realization. Specifically, it involves two steps to construct such a graph: (1) n-grams extraction, where and (2) <observation, n-gram> association. Following previous research Diao et al. (2021); Su et al. (2021b), we adopt the pointwise mutual information (PMI) Church and Hanks (1990) to fulfill these two steps, where a higher PMI score implies two units with higher co-occurrence:
For the first step, we extract n-gram units based on the training reports. Given two adjacent units and of a text sequence, a high PMI score indicates that they are good collection pairs to form a candidate n-gram , while a low PMI score indicates that these two units should be separated. For the second step, given a predefined observation set , we extract the observation-related n-gram units with , where is the -th observation, is the -th n-gram, and is the frequency that an n-gram appears in a report with observation in the training set. Then, we can obtain a set of observation-related n-grams , where , and tokens in n-grams form the token collection . Note that we remove all the stopwords in , using the vocabulary provided by NLTK444https://www.nltk.org/. Finally, for each observation, we extract the top-K n-grams as the candidates to construct the graph, which contains three types of nodes . We list part of the n-grams in Appendix A.2. After extracting relevant information from the training reports, we construct an observation graph by introducing three types of edges :
-
•
: This undirected edge connects two adjacent observations in an observation plan (i.e., <, >).
-
•
: This directed edge connects an observation and an n-gram (i.e., <, >).
-
•
: This directed edge connects an n-gram with its tokens (i.e., <, >).
2.3 Visual Features Extraction
Given an image , a CNN and an MLP layer are first adopted to extract visual features :
where is the -th visual feature.
2.4 Stage 1: Observation Planning
The output of observation planning is an observation sequence, which is the high-level summarization of the radiology report, as shown on the left side of Figure 2. While examining a radiograph, a radiologist must report positive observations. However, only part of the negative observations will be reported by the radiologist, depending on the overall conditions of the radiograph (e.g., co-occurrence of observations or the limited length of a report). Thus, it is difficult to plan without considering the observation dependencies (i.e., label dependencies). Here, we regard the planning problem as a generation task and use a Transformer encoder-decoder for observation planning:
where is the -th visual hidden representation, is the visual encoder, is the observation decoder, is the decoder hidden representation, is the weight matrix, and is the bias vector. Then the planning loss is formulated as:
By increasing , the planner gives more attention to abnormalities. Note that the plugged is applied to positive observations and No Finding/NEG instead of No Finding/POS.
2.5 Stage 2: Observation-Guided Report Generation
Observation Graph Encoding. We use a Transformer encoder to encode the observation graph constructed according to Section 2.2. To be specific, given the observation graph with nodes and edges , we first construct the adjacency matrix based on . Then, and are fed into the Transformer for encoding. Now serves as the self-attention mask in the Transformer, which only allows nodes in the graph to attend to connected neighbors and itself. To incorporate the node type information, we add a type embedding for each node representation:
where Embed is the embedding function, and represents node embeddings. For observation nodes, denotes positional embeddings, and for n-gram and token nodes, represents type embeddings. , , and are encoded representations of observations, n-grams, and tokens, respectively.
Vision-Graph Alignment. As an observation graph may contain irrelevant information, it is necessary to align the graph with the visual features. Specifically, we jointly encode visual features and token-level node representations so that the node representations can fully interact with the visual features, and we prevent the visual features from attending the node representations by introducing a self-attention mask M:
where are the visual representation and the aligned token-level node representations, respectively.
Observation Graph Pruning. After aligning visual features and the observation graph, we prune the graph by filtering out irrelevant nodes. The probability of keeping a node is denoted as:
where is the learnable weight and is the bias. We can optimize the pruning process with the following loss:
where is the weight to tackle the class imbalance issue, and is the label indicating whether a token appears in the referential report. Finally, we prune the observation graph by masking out token-level nodes with and masked token-level node representations denote as .
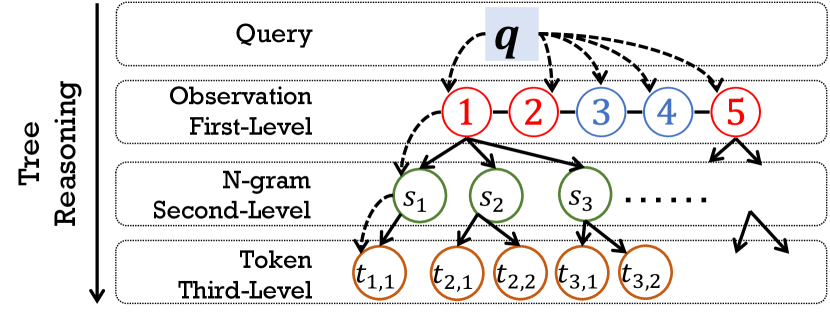
Tree Reasoning over Observation Graph. We devise a tree reasoning (TrR) mechanism to aggregate observation-relevant information from the graph dynamically. The overall process is shown in Figure 3, where we aggregate node information from the observation level (i.e., first level) to the n-gram level (i.e., second level), then to the token level (i.e., third level). To be specific, given a query and node representations at -th level , the tree reasoning path is , and the overall process, is formulated as below:
where MHA and LayerNorm are the multi-head self-attention, and layer normalization modules Vaswani et al. (2017), respectively. , , and are weight metrics for query, key, and value vector, respectively. Finally, we can obtain the multi-level information , containing observation, n-gram, and token information.
Report Generation with Tree Reasoning. As shown in the right side of Figure 2, an observation-guided Transformer decoder is devised to incorporate the graph information, including (i) multiple observation-guided decoder blocks (i.e., Decoderg), which aims to align observations with the visual representations, and (ii) a tree-reasoning block (i.e., TrRg), which aims to aggregate observation-relevant information. For Decoderg, we insert an observation-related cross-attention module before a visually-aware cross-attention module. By doing this, the model can correctly focus on regions closely related to a specific observation. Given the visual representations , the node representations , and the hidden representation of the prefix , the -th decoding step is formulated as:
where Self-Attn is the self-attention module, Cross-Attn is the cross-attention module, are self-attended hidden state, observation-related hidden state, visually-aware hidden state of Decoderg, respectively. is the self-attended hidden state of TrRg, is the weight matrix, and is the bias vector. We omit other modules (i.e., Layer Normalization and Feed-Forward Network) in the standard Transformer for simplicity. Note that we extend the observation plan to an observation graph , so the probability of conditions on instead of . Then, we optimize the generation process using the negative log-likelihood loss:
Finally, the loss function of the generator is .
| Dataset | Model | NLG Metrics | CE Metrics | |||||||
| B-1 | B-2 | B-3 | B-4 | MTR | R-L | P | R | F1 | ||
| IU X-ray | R2Gen | - | - | - | - | |||||
| CA | - | - | - | |||||||
| CMCL | - | - | - | |||||||
| PPKED | - | - | - | - | ||||||
| R2GenCMN | - | - | - | |||||||
| Tr | - | - | - | |||||||
| AlignTransfomer | - | - | - | - | ||||||
| KnowMat | - | - | - | - | ||||||
| CMM-RL | - | - | - | |||||||
| CMCA | - | - | - | |||||||
| ORGan (Ours) | - | - | - | |||||||
| MIMIC -CXR | R2Gen | |||||||||
| CA | - | - | - | |||||||
| CMCL | - | - | - | |||||||
| PPKED | - | - | - | |||||||
| R2GenCMN | ||||||||||
| Tr | ||||||||||
| AlignTransfomer | - | - | - | - | ||||||
| KnowMat | - | |||||||||
| CMM-RL | ||||||||||
| CMCA | ||||||||||
| ORGan (Ours) | ||||||||||
3 Experiments
3.1 Datasets
Following previous research Chen et al. (2020, 2021), we use two publicly available benchmarks to evaluate our method, which are IU X-ray555https://openi.nlm.nih.gov/ Demner-Fushman et al. (2016) and MIMIC-CXR666https://physionet.org/content/MIMIC-cxr-jpg/2.0.0/ Johnson et al. (2019). Both datasets have been automatically de-identified, and we use the same preprocessing setup of Chen et al. (2020).
-
•
IU X-ray is collected by Indiana University, containing 3,955 reports with two X-ray images per report resulting in 7,470 images in total. We split the dataset into train/validation/test sets with a ratio of 7:1:2, which is the same data split as in Chen et al. (2020).
-
•
MIMIC-CXR consists of 377,110 chest X-ray images and 227,827 reports from 63,478 patients. We adopt the standard train/validation/test splits.
3.2 Evaluation Metrics and Baselines
We adopt natural language generation metrics (NLG Metrics) and clinical efficacy (CE Metrics) to evaluate the models. BLEU Papineni et al. (2002), METEOR Banerjee and Lavie (2005), and ROUGE Lin (2004) are selected as NLG Metrics, and we use the MS-COCO caption evaluation tool777https://github.com/tylin/coco-caption to compute the results. For CE Metrics, we adopt CheXpert Irvin et al. (2019) for MIMIC-CXR dataset to label the generated reports compared with disease labels of the references.
To evaluate the performance of ORGan, we compare it with the following 10 state-of-the-art (SOTA) baselines: R2Gen Chen et al. (2020), CA Liu et al. (2021c), CMCL Liu et al. (2021a), PPKED Liu et al. (2021b), R2GenCMN Chen et al. (2021), AlignTransformer You et al. (2021), KnowMat Yang et al. (2021), Tr Nooralahzadeh et al. (2021), CMM-RL Qin and Song (2022), and CMCA Song et al. (2022).
| Dataset | Model | NLG Metrics | CE Metrics | |||||||
| B-1 | B-2 | B-3 | B-4 | MTR | R-L | P | R | F1 | ||
| IU X-ray | ORGan | - | - | - | ||||||
| ORGan w/o Plan | - | - | - | |||||||
| ORGan w/o Graph | - | - | - | |||||||
| ORGan w/o TrR | - | - | - | |||||||
| MIMIC -CXR | ORGan | |||||||||
| ORGan w/o Plan | ||||||||||
| ORGan w/o Graph | ||||||||||
| ORGan w/o TrR | ||||||||||
3.3 Implementation Details
We adopt the ResNet-101 He et al. (2015) pretrained on ImageNet Deng et al. (2009) as the visual extractor. For IU X-ray, we further fine-tune ResNet-101 on CheXpert Irvin et al. (2019). The layer number of all the encoders and decoders is set to 3 except for Graph Encoder, where the layer number is set to 2. The input dimension and the feed-forward network dimension of a Transformer block are set to 512, and each block contains 8 attention heads. The beam size for decoding is set to 4, and the maximum decoding step is set to 64/104 for IU X-ray and MIMIC-CXR, respectively.
We use AdamW Loshchilov and Hutter (2019) as the optimizer and set the initial learning rate for the visual extractor as 5e-5 and 1e-4 for the rest of the parameters, with a linear schedule decreasing from the initial learning rate to 0. is set to 0.5, the dropout rate is set to 0.1, and the batch size is set to 32. For IU X-ray, we train the planner/generator for 15/15 epochs, and is set to 2. For MIMIC-CXR, the training epoch of the planner/generator is set to 3/5, and is set to 5. We select the best checkpoints of the planner based on micro F1 of all observations and select the generator based on the BLEU-4 on the validation set. Our model has 65.9M parameters, and the implementations are based on HuggingFace’s Transformers Wolf et al. (2020). We conduct all the experiments on an NVIDIA-3090 GTX GPU with mixed precision. The NLTK package version is 3.6.2.
4 Results
4.1 NLG Results
Table 1 shows the experimental results. ORGan outperforms most of the baselines (except CMCA on IU X-ray) and achieves state-of-the-art performance. Specifically, our model achieves BLEU-4 on the IU X-xray dataset, which is the second-best result, and BLEU-4 on the MIMIC-CXR dataset, leading to a increment of compared to the best baseline (i.e., CMCA). In terms of METEOR, ORGan achieves competitive performance on both datasets. In addition, our model increases R-L by on the MIMIC-CXR dataset compared to the best baseline and achieves the second-best result on the IU X-ray dataset. This indicates that by introducing the guidance of observations, ORGan can generate more coherent text than baselines. However, we notice that on the IU X-ray dataset, there is still a performance gap between our model and the best baseline (i.e., CMCA). The reason may be that the overall data size of this dataset is small ( 2,000 samples for training). It is difficult to train a good planner using a small training set, especially with cross-modal data. As we can see from Table 3, the planner only achieves Macro-F1 on the IU X-ray dataset, which is relatively low compared to the performance of the planner on the MIMIC-CXR dataset. Thus, accumulation errors unavoidably propagate to the generator, which leads to lower performance.
| Dataset | Micro-F1 | Macro-F1 | B-2 |
| IU X-ray | |||
| MIMIC-CXR | |||
| Dataset | K | B-2/4 | MTR | R-L |
| IU X-ray | / | |||
| / | ||||
| / | ||||
| MIMIC -CXR | / | |||
| / | ||||
| / | ||||
4.2 Clinical Efficacy Results
The clinical efficacy results are listed on the right side of Table 1. On the MIMIC-CXR dataset, our model outperforms previous SOTA results. Specifically, our model achieves F1, increasing by compared to the best baseline. In addition, precision and recall are achieved by ORGan, which are competitive results. This indicates that our model can successfully maintain the clinical consistency between the images and the reports.
4.3 Ablation Results
To examine the effect of the observation plan and the TrR mechanism, we perform ablation tests, and the ablation results are listed in Table 2. There are three variants: (1) ORGan w/o Plan, which does not consider observation information, (2) ORGan w/o Graph, which only considers observations but not the observation graph, (3) ORGan w/o TrR, which select information without using the TrR mechanism. Compared to the full model, the performance of ORGan w/o Plan drops significantly on both datasets. This indicates that observation information plays a vital role in generating reports. For ORGan w/o Graph, the performance on NLG metrics decreases significantly, but the performance of clinical efficacy remains nearly the same as the full model. This is reasonable because the observation graph is designed to enrich the observation plan to achieve better word-level realization. On the performance of ORGan w/o TrR, a similar result of ORGan w/o Graph is observed. This indicates that TrR can enrich the plan information, and stronger reasoning can help generate high-quality reports.
We also conduct experiments on the impact of the number (K) of selected n-grams, as shown in Table 4. There is a performance gain when increasing K from to and to on both datasets. On the IU X-ray dataset, B-2 increases by and and B-4 rises by and . A similar trend is also observed on the MIMIC-CXR dataset.
4.4 Qualitative Analysis
We conduct a case study and analyze some error cases on the MIMIC-CXR dataset to provide more insights.
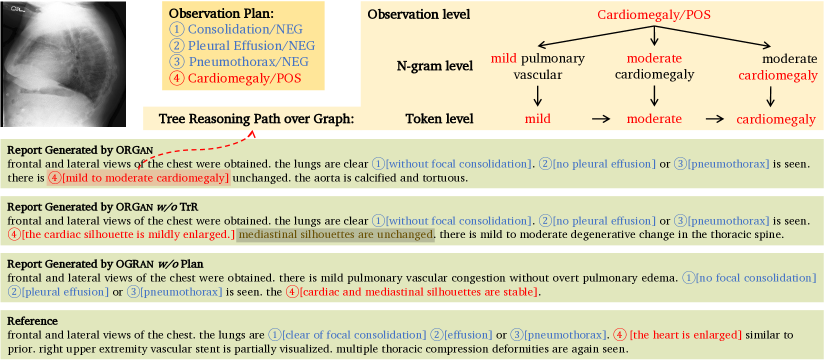
Case Study. We conduct a case study to show how the observation and the tree reasoning mechanism guide the report generation process, as shown in Figure 4. We show the generated reports of ORGan, ORGan w/o TrR, and ORGan w/o Plan, respectively. All three models successfully generate the first three negative observations and the last positive observation. However, variant w/o plan generates "mild pulmonary vascular congestion without overt pulmonary edema" which is not consistent with the radiograph. In terms of the output of variant w/o TrR, "mediastinal silhouettes are unchanged" is closely related to observation Enlarged Cardiomediastinum instead of Cardiomegaly. Only ORGan can generate the Cardiomegaly/POS presented in the observation plan with a TrR path. This indicates that observations play a vital role in maintaining clinical consistency. In addition, most of the tokens in the observation mention mild to moderate cardiomegaly can be found in the observation graph, which demonstrates that the graph can provide useful information in word-level realization.
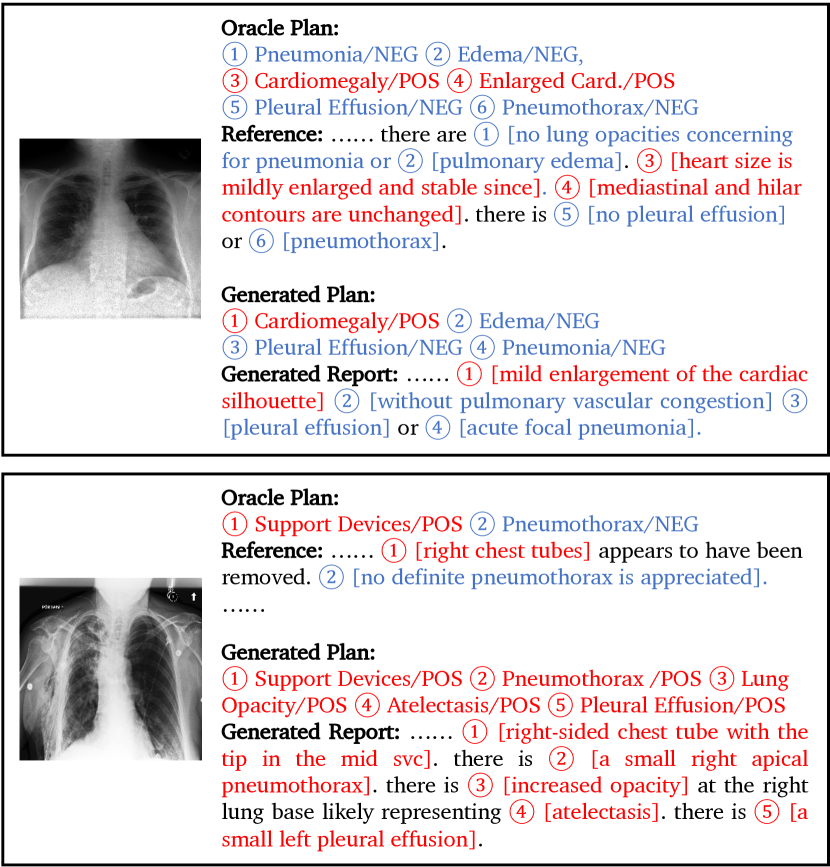
Error Analysis. We depicte error cases generated by ORGan in Figure 5. The major error is caused by introducing incorrect observation plans. Specifically, the generated plan of the upper case omits one positive observation (i.e., Enlarged Cardiomediastinum/POS), resulting in false negative observations in its corresponding generated report. Another error is false positive observations appearing in the generated reports (e.g., the bottom case). Thus, how to improve the performance of the planner is a potential future work to enhance clinical accuracy.
5 Related Work
5.1 Image Captioning and Medical Report Generation
Image Captioning Vinyals et al. (2015); Rennie et al. (2017); Lu et al. (2017); Anderson et al. (2018) has long been an attractive research topic, and there has been a surging interest in developing medical AI applications. Medical Report Generation Jing et al. (2018); Li et al. (2018) is one of these applications. Chen et al. (2020) proposed a memory-driven Transformer model to generate radiology reports. Chen et al. (2021) further proposed a cross-modal memory network to facilitate report generation. Qin and Song (2022) proposed to utilize reinforcement learning Williams (1992) to align the cross-modal information between the image and the corresponding report. In addition to these methods, Liu et al. (2021c) proposed the Contrastive Attention model comparing the given image with normal images to distill information. Yang et al. (2021) proposed to introduce general and specific knowledge extracted from RadGraph Jain et al. (2021) in report generation. Liu et al. (2021a) proposed a competence-based multimodal curriculum learning to guide the learning process. Liu et al. (2021b) proposed to explore and distill posterior and prior knowledge for report generation.
Several research works focus on improving the clinical accuracy of the generated reports. Liu et al. (2019) proposed a clinically coherent reward for clinically accurate reinforcement learning to improve clinical accuracy. Lovelace and Mortazavi (2020) proposed to use CheXpert Irvin et al. (2019) as a source of clinical information to generate clinically coherent reports. Miura et al. (2021) proposed to use entity matching score as a reward to encourage the model to generate factually complete and consistent radiology reports. Nishino et al. (2022) proposed a planning-based method and regarded the report generation task as the data-to-text generation task.
5.2 Planning in Text Generation
Another line of research closely related to our work is planning in text generation, which has been applied to multiple tasks (e.g., Data-to-Text Generation, Summarization, and Story Generation). Hua and Wang (2020) propose a global planning and iterative refinement model for long text generation. Kang and Hovy (2020) propose a self-supervised planning framework for paragraph completion. Hu et al. (2022) propose a dynamic planning model for long-form text generation to tackle the issue of incoherence outputs. Moryossef et al. (2019) proposed a neural data-to-text generation by separating planning from realization. Su et al. (2021a) proposed a controlled data-to-text generation framework by planning the order of content in a table.
6 Conclusion
In this paper, we propose ORGan, an observation-guided radiology report generation framework, which first produces an observation plan and then generates the corresponding report based on the radiograph and the plan. To achieve better observation realization, we construct a three-level observation graph containing observations, observation-aware n-grams, and tokens, and we propose a tree reasoning mechanism to capture observation-related information by dynamically aggregating nodes in the graph. Experimental results demonstrate the effectiveness of our proposed framework in terms of maintaining the clinical consistency between radiographs and generated reports.
Limitations
There are several limitations to our framework. Specifically, since observations are introduced as guiding information, our framework requires observation extraction tools to label the training set in advance. Then, the nodes contained in the observation graph are mined from the training data. As a result, the mined n-grams could be biased when the overall size of the training set is small. In addition, our framework is a pipeline, and the report generation performance highly relies on the performance of observation planning. Thus, errors could accumulate through the pipeline, especially for small datasets. Finally, our framework is designed for radiology report generation targeting Chest X-ray images. However, there are other types of medical images (e.g., Fundus Fluorescein Angiography images) that our framework needs to examine.
Ethics Statement
The IU X-rayDemner-Fushman et al. (2016) and MIMIC-CXR Johnson et al. (2019) datasets have been automatically de-identified to protect patient privacy. The proposed system is intended to generate radiology reports automatically, alleviating the workload of radiologists. However, we notice that the proposed system can generate false positive observations and inaccurate diagnoses due to systematic biases. If the system, as deployed, would learn from further user input (i.e., patients’ radiographs), there are risks of personal information leakage while interacting with the system. This might be mitigated by using anonymous technology to protect privacy. Thus, we urge users to cautiously examine the ethical implications of the generated output in real-world applications.
Acknolwedgments
This work was supported in part by General Program of National Natural Science Foundation of China (Grant No. 82272086, 62076212), Guangdong Provincial Department of Education (Grant No. 2020ZDZX3043), Shenzhen Natural Science Fund (JCYJ20200109140820699 and the Stable Support Plan Program 20200925174052004), and the Research Grants Council of Hong Kong (15207920, 15207821, 15207122).
References
- Anderson et al. (2018) Peter Anderson, Xiaodong He, Chris Buehler, Damien Teney, Mark Johnson, Stephen Gould, and Lei Zhang. 2018. Bottom-up and top-down attention for image captioning and visual question answering. In 2018 IEEE Conference on Computer Vision and Pattern Recognition, CVPR 2018, Salt Lake City, UT, USA, June 18-22, 2018, pages 6077–6086. Computer Vision Foundation / IEEE Computer Society.
- Banerjee and Lavie (2005) Satanjeev Banerjee and Alon Lavie. 2005. METEOR: An automatic metric for MT evaluation with improved correlation with human judgments. In Proceedings of the ACL Workshop on Intrinsic and Extrinsic Evaluation Measures for Machine Translation and/or Summarization, pages 65–72, Ann Arbor, Michigan. Association for Computational Linguistics.
- Chen et al. (2021) Zhihong Chen, Yaling Shen, Yan Song, and Xiang Wan. 2021. Cross-modal memory networks for radiology report generation. In Proceedings of the 59th Annual Meeting of the Association for Computational Linguistics and the 11th International Joint Conference on Natural Language Processing, ACL/IJCNLP 2021, (Volume 1: Long Papers), Virtual Event, August 1-6, 2021, pages 5904–5914. Association for Computational Linguistics.
- Chen et al. (2020) Zhihong Chen, Yan Song, Tsung-Hui Chang, and Xiang Wan. 2020. Generating radiology reports via memory-driven transformer. In Proceedings of the 2020 Conference on Empirical Methods in Natural Language Processing.
- Church and Hanks (1990) Kenneth Ward Church and Patrick Hanks. 1990. Word association norms, mutual information, and lexicography. Computational Linguistics, 16(1):22–29.
- Demner-Fushman et al. (2016) Dina Demner-Fushman, Marc D Kohli, Marc B Rosenman, Sonya E Shooshan, Laritza Rodriguez, Sameer Antani, George R Thoma, and Clement J McDonald. 2016. Preparing a collection of radiology examinations for distribution and retrieval. Journal of the American Medical Informatics Association, 23(2):304–310.
- Deng et al. (2009) Jia Deng, Wei Dong, Richard Socher, Li-Jia Li, Kai Li, and Li Fei-Fei. 2009. Imagenet: A large-scale hierarchical image database. In 2009 IEEE Conference on Computer Vision and Pattern Recognition, pages 248–255.
- Diao et al. (2021) Shizhe Diao, Ruijia Xu, Hongjin Su, Yilei Jiang, Yan Song, and Tong Zhang. 2021. Taming pre-trained language models with n-gram representations for low-resource domain adaptation. In Proceedings of the 59th Annual Meeting of the Association for Computational Linguistics and the 11th International Joint Conference on Natural Language Processing (Volume 1: Long Papers), pages 3336–3349, Online. Association for Computational Linguistics.
- He et al. (2015) Kaiming He, Xiangyu Zhang, Shaoqing Ren, and Jian Sun. 2015. Deep residual learning for image recognition. arXiv preprint arXiv:1512.03385.
- Hu et al. (2022) Zhe Hu, Hou Pong Chan, Jiachen Liu, Xinyan Xiao, Hua Wu, and Lifu Huang. 2022. PLANET: Dynamic content planning in autoregressive transformers for long-form text generation. In Proceedings of the 60th Annual Meeting of the Association for Computational Linguistics (Volume 1: Long Papers), pages 2288–2305, Dublin, Ireland. Association for Computational Linguistics.
- Hua and Wang (2020) Xinyu Hua and Lu Wang. 2020. PAIR: Planning and iterative refinement in pre-trained transformers for long text generation. In Proceedings of the 2020 Conference on Empirical Methods in Natural Language Processing (EMNLP), pages 781–793, Online. Association for Computational Linguistics.
- Irvin et al. (2019) Jeremy Irvin, Pranav Rajpurkar, Michael Ko, Yifan Yu, Silviana Ciurea-Ilcus, Chris Chute, Henrik Marklund, Behzad Haghgoo, Robyn L. Ball, Katie S. Shpanskaya, Jayne Seekins, David A. Mong, Safwan S. Halabi, Jesse K. Sandberg, Ricky Jones, David B. Larson, Curtis P. Langlotz, Bhavik N. Patel, Matthew P. Lungren, and Andrew Y. Ng. 2019. Chexpert: A large chest radiograph dataset with uncertainty labels and expert comparison. In The Thirty-Third AAAI Conference on Artificial Intelligence, AAAI 2019, The Thirty-First Innovative Applications of Artificial Intelligence Conference, IAAI 2019, The Ninth AAAI Symposium on Educational Advances in Artificial Intelligence, EAAI 2019, Honolulu, Hawaii, USA, January 27 - February 1, 2019, pages 590–597. AAAI Press.
- Jain et al. (2021) Saahil Jain, Ashwin Agrawal, Adriel Saporta, Steven Q. H. Truong, Du Nguyen Duong, Tan Bui, Pierre Chambon, Yuhao Zhang, Matthew P. Lungren, Andrew Y. Ng, Curtis P. Langlotz, and Pranav Rajpurkar. 2021. Radgraph: Extracting clinical entities and relations from radiology reports. CoRR, abs/2106.14463.
- Jing et al. (2018) Baoyu Jing, Pengtao Xie, and Eric P. Xing. 2018. On the automatic generation of medical imaging reports. In Proceedings of the 56th Annual Meeting of the Association for Computational Linguistics, ACL 2018, Melbourne, Australia, July 15-20, 2018, Volume 1: Long Papers, pages 2577–2586. Association for Computational Linguistics.
- Johnson et al. (2019) Alistair EW Johnson, Tom J Pollard, Nathaniel R Greenbaum, Matthew P Lungren, Chih-ying Deng, Yifan Peng, Zhiyong Lu, Roger G Mark, Seth J Berkowitz, and Steven Horng. 2019. Mimic-cxr-jpg, a large publicly available database of labeled chest radiographs. arXiv preprint arXiv:1901.07042.
- Kang and Hovy (2020) Dongyeop Kang and Eduard Hovy. 2020. Plan ahead: Self-supervised text planning for paragraph completion task. In Proceedings of the 2020 Conference on Empirical Methods in Natural Language Processing (EMNLP), pages 6533–6543, Online. Association for Computational Linguistics.
- Li et al. (2018) Yuan Li, Xiaodan Liang, Zhiting Hu, and Eric P. Xing. 2018. Hybrid retrieval-generation reinforced agent for medical image report generation. In Advances in Neural Information Processing Systems 31: Annual Conference on Neural Information Processing Systems 2018, NeurIPS 2018, December 3-8, 2018, Montréal, Canada, pages 1537–1547.
- Lin (2004) Chin-Yew Lin. 2004. ROUGE: A package for automatic evaluation of summaries. In Text Summarization Branches Out, pages 74–81, Barcelona, Spain. Association for Computational Linguistics.
- Liu et al. (2021a) Fenglin Liu, Shen Ge, and Xian Wu. 2021a. Competence-based multimodal curriculum learning for medical report generation. In Proceedings of the 59th Annual Meeting of the Association for Computational Linguistics and the 11th International Joint Conference on Natural Language Processing, ACL/IJCNLP 2021, (Volume 1: Long Papers), Virtual Event, August 1-6, 2021, pages 3001–3012. Association for Computational Linguistics.
- Liu et al. (2021b) Fenglin Liu, Xian Wu, Shen Ge, Wei Fan, and Yuexian Zou. 2021b. Exploring and distilling posterior and prior knowledge for radiology report generation. In IEEE Conference on Computer Vision and Pattern Recognition, CVPR 2021, virtual, June 19-25, 2021, pages 13753–13762. Computer Vision Foundation / IEEE.
- Liu et al. (2021c) Fenglin Liu, Changchang Yin, Xian Wu, Shen Ge, Ping Zhang, and Xu Sun. 2021c. Contrastive attention for automatic chest x-ray report generation. In Findings of the Association for Computational Linguistics: ACL/IJCNLP 2021, Online Event, August 1-6, 2021, volume ACL/IJCNLP 2021 of Findings of ACL, pages 269–280. Association for Computational Linguistics.
- Liu et al. (2019) Guanxiong Liu, Tzu-Ming Harry Hsu, Matthew B. A. McDermott, Willie Boag, Wei-Hung Weng, Peter Szolovits, and Marzyeh Ghassemi. 2019. Clinically accurate chest x-ray report generation. CoRR, abs/1904.02633.
- Loshchilov and Hutter (2019) Ilya Loshchilov and Frank Hutter. 2019. Decoupled weight decay regularization. In 7th International Conference on Learning Representations, ICLR 2019, New Orleans, LA, USA, May 6-9, 2019. OpenReview.net.
- Lovelace and Mortazavi (2020) Justin Lovelace and Bobak Mortazavi. 2020. Learning to generate clinically coherent chest X-ray reports. In Findings of the Association for Computational Linguistics: EMNLP 2020, pages 1235–1243, Online. Association for Computational Linguistics.
- Lu et al. (2017) Jiasen Lu, Caiming Xiong, Devi Parikh, and Richard Socher. 2017. Knowing when to look: Adaptive attention via a visual sentinel for image captioning. In 2017 IEEE Conference on Computer Vision and Pattern Recognition, CVPR 2017, Honolulu, HI, USA, July 21-26, 2017, pages 3242–3250. IEEE Computer Society.
- Miura et al. (2021) Yasuhide Miura, Yuhao Zhang, Emily Tsai, Curtis Langlotz, and Dan Jurafsky. 2021. Improving factual completeness and consistency of image-to-text radiology report generation. In Proceedings of the 2021 Conference of the North American Chapter of the Association for Computational Linguistics: Human Language Technologies, pages 5288–5304, Online. Association for Computational Linguistics.
- Moryossef et al. (2019) Amit Moryossef, Yoav Goldberg, and Ido Dagan. 2019. Step-by-step: Separating planning from realization in neural data-to-text generation. In Proceedings of the 2019 Conference of the North American Chapter of the Association for Computational Linguistics: Human Language Technologies, Volume 1 (Long and Short Papers), pages 2267–2277, Minneapolis, Minnesota. Association for Computational Linguistics.
- Nishino et al. (2022) Toru Nishino, Yasuhide Miura, Tomoki Taniguchi, Tomoko Ohkuma, Yuki Suzuki, Shoji Kido, and Noriyuki Tomiyama. 2022. Factual accuracy is not enough: Planning consistent description order for radiology report generation. In Proceedings of the 2022 Conference on Empirical Methods in Natural Language Processing, Online. Association for Computational Linguistics.
- Nooralahzadeh et al. (2021) Farhad Nooralahzadeh, Nicolas Perez Gonzalez, Thomas Frauenfelder, Koji Fujimoto, and Michael Krauthammer. 2021. Progressive transformer-based generation of radiology reports. In Findings of the Association for Computational Linguistics: EMNLP 2021, pages 2824–2832, Punta Cana, Dominican Republic. Association for Computational Linguistics.
- Papineni et al. (2002) Kishore Papineni, Salim Roukos, Todd Ward, and Wei-Jing Zhu. 2002. Bleu: a method for automatic evaluation of machine translation. In Proceedings of the 40th Annual Meeting of the Association for Computational Linguistics, pages 311–318, Philadelphia, Pennsylvania, USA. Association for Computational Linguistics.
- Qin and Song (2022) Han Qin and Yan Song. 2022. Reinforced cross-modal alignment for radiology report generation. In Findings of the Association for Computational Linguistics: ACL 2022, Dublin, Ireland, May 22-27, 2022, pages 448–458. Association for Computational Linguistics.
- Rennie et al. (2017) Steven J. Rennie, Etienne Marcheret, Youssef Mroueh, Jerret Ross, and Vaibhava Goel. 2017. Self-critical sequence training for image captioning. In 2017 IEEE Conference on Computer Vision and Pattern Recognition, CVPR 2017, Honolulu, HI, USA, July 21-26, 2017, pages 1179–1195. IEEE Computer Society.
- Smit et al. (2020) Akshay Smit, Saahil Jain, Pranav Rajpurkar, Anuj Pareek, Andrew Ng, and Matthew Lungren. 2020. Combining automatic labelers and expert annotations for accurate radiology report labeling using BERT. In Proceedings of the 2020 Conference on Empirical Methods in Natural Language Processing (EMNLP), pages 1500–1519, Online. Association for Computational Linguistics.
- Song et al. (2022) Xiao Song, Xiaodan Zhang, Junzhong Ji, Ying Liu, and Pengxu Wei. 2022. Cross-modal contrastive attention model for medical report generation. In Proceedings of the 29th International Conference on Computational Linguistics, pages 2388–2397, Gyeongju, Republic of Korea. International Committee on Computational Linguistics.
- Su et al. (2021a) Yixuan Su, David Vandyke, Sihui Wang, Yimai Fang, and Nigel Collier. 2021a. Plan-then-generate: Controlled data-to-text generation via planning. In Findings of the Association for Computational Linguistics: EMNLP 2021, pages 895–909, Punta Cana, Dominican Republic. Association for Computational Linguistics.
- Su et al. (2021b) Yixuan Su, Yan Wang, Deng Cai, Simon Baker, Anna Korhonen, and Nigel Collier. 2021b. Prototype-to-style: Dialogue generation with style-aware editing on retrieval memory. IEEE/ACM Transactions on Audio, Speech, and Language Processing, 29:2152–2161.
- Vaswani et al. (2017) Ashish Vaswani, Noam Shazeer, Niki Parmar, Jakob Uszkoreit, Llion Jones, Aidan N. Gomez, Łukasz Kaiser, and Illia Polosukhin. 2017. Attention is all you need. In Proceedings of the 31st International Conference on Neural Information Processing Systems, NIPS’17, page 6000–6010, Red Hook, NY, USA. Curran Associates Inc.
- Vinyals et al. (2015) Oriol Vinyals, Alexander Toshev, Samy Bengio, and Dumitru Erhan. 2015. Show and tell: A neural image caption generator. In CVPR, pages 3156–3164. IEEE Computer Society.
- Williams (1992) Ronald J. Williams. 1992. Simple statistical gradient-following algorithms for connectionist reinforcement learning. Mach. Learn., 8(3–4):229–256.
- Wolf et al. (2020) Thomas Wolf, Lysandre Debut, Victor Sanh, Julien Chaumond, Clement Delangue, Anthony Moi, Pierric Cistac, Tim Rault, Remi Louf, Morgan Funtowicz, Joe Davison, Sam Shleifer, Patrick von Platen, Clara Ma, Yacine Jernite, Julien Plu, Canwen Xu, Teven Le Scao, Sylvain Gugger, Mariama Drame, Quentin Lhoest, and Alexander Rush. 2020. Transformers: State-of-the-art natural language processing. In Proceedings of the 2020 Conference on Empirical Methods in Natural Language Processing: System Demonstrations, pages 38–45, Online. Association for Computational Linguistics.
- Yang et al. (2021) Shuxin Yang, Xian Wu, Shen Ge, Shaohua Kevin Zhou, and Li Xiao. 2021. Knowledge matters: Radiology report generation with general and specific knowledge. CoRR, abs/2112.15009.
- You et al. (2021) Di You, Fenglin Liu, Shen Ge, Xiaoxia Xie, Jing Zhang, and Xian Wu. 2021. Aligntransformer: Hierarchical alignment of visual regions and disease tags for medical report generation. In Medical Image Computing and Computer Assisted Intervention - MICCAI 2021 - 24th International Conference, Strasbourg, France, September 27 - October 1, 2021, Proceedings, Part III, volume 12903 of Lecture Notes in Computer Science, pages 72–82. Springer.
Appendix A Appendices
A.1 Observation Statistics
There are 14 categories of observations: No Finding, Enlarged Cardiomediastinum, Cardiomegaly, Lung Lesion, Lung Opacity, Edema, Consolidation, Pneumonia, Atelectasis, Pneumothorax, Pleural Effusion, Pleural Other, Fracture, and Support Devices. Table 5 lists the observation distributions annotated by CheXbertSmit et al. (2020) in the train/valid/test split of two benchmarks.
| #Observation | IU X-ray | MIMIC-CXR |
| No Finding/POS | 744/108/318 | 64,677/514/229 |
| No Finding/NEG | 1,325/188/272 | 206,133/1,616/3,629 |
| Cardiomegaly/POS | 244/38/61 | 70,561/514/1,602 |
| Cardiomegaly/NEG | 1,375/198/386 | 85,448/714/801 |
| Pleural Effusion/POS | 60/13/15 | 56,972/477/1,379 |
| Pleural Effusion/NEG | 1,559/230/452 | 170,989/1,310/1,763 |
| Pneumothorax/POS | 9/2/5 | 8,707/62/106 |
| Pneumothorax/NEG | 1,528/231/449 | 190,356/1,495/2,338 |
| Enlarged Card./POS | 159/29/28 | 49,806/413/1,140 |
| Enlarged Card./NEG | 1,200/161/384 | 129,360/1,006/868 |
| Consolidation/POS | 17/1/3 | 14,449/119/384 |
| Consolidation/NEG | 763/117/210 | 97,197/788/964 |
| Lung Opacity/POS | 295/35/57 | 67,714/497/1,448 |
| Lung Opacity/NEG | 331/49/82 | 8,157/73/125 |
| Fracture/POS | 84/6/15 | 11,070/59/232 |
| Fracture/NEG | 137/22/50 | 9,632/72/53 |
| Lung Lesion/POS | 85/14/17 | 11,717/123/300 |
| Lung Lesion/NEG | 92/10/30 | 1,972/21/11 |
| Edema/POS | 28/2/7 | 33,034/257/899 |
| Edema/NEG | 119/17/31 | 51,639/409/669 |
| Atelectasis/POS | 143/15/37 | 68,273/515/1,210 |
| Atelectasis/NEG | 3/0/0 | 563/5/9 |
| Support Devices/POS | 89/20/16 | 60,455/450/1,358 |
| Support Devices/NEG | 1/0/0 | 1,081/7/11 |
| Pneumonia/POS | 20/2/1 | 23,945/184/503 |
| Pneumonia/NEG | 68/9/25 | 21,976/165/411 |
| Pleural Other/POS | 32/4/7 | 7,296/70/184 |
| Pleural Other/NEG | 0/0/0 | 63/0/0 |
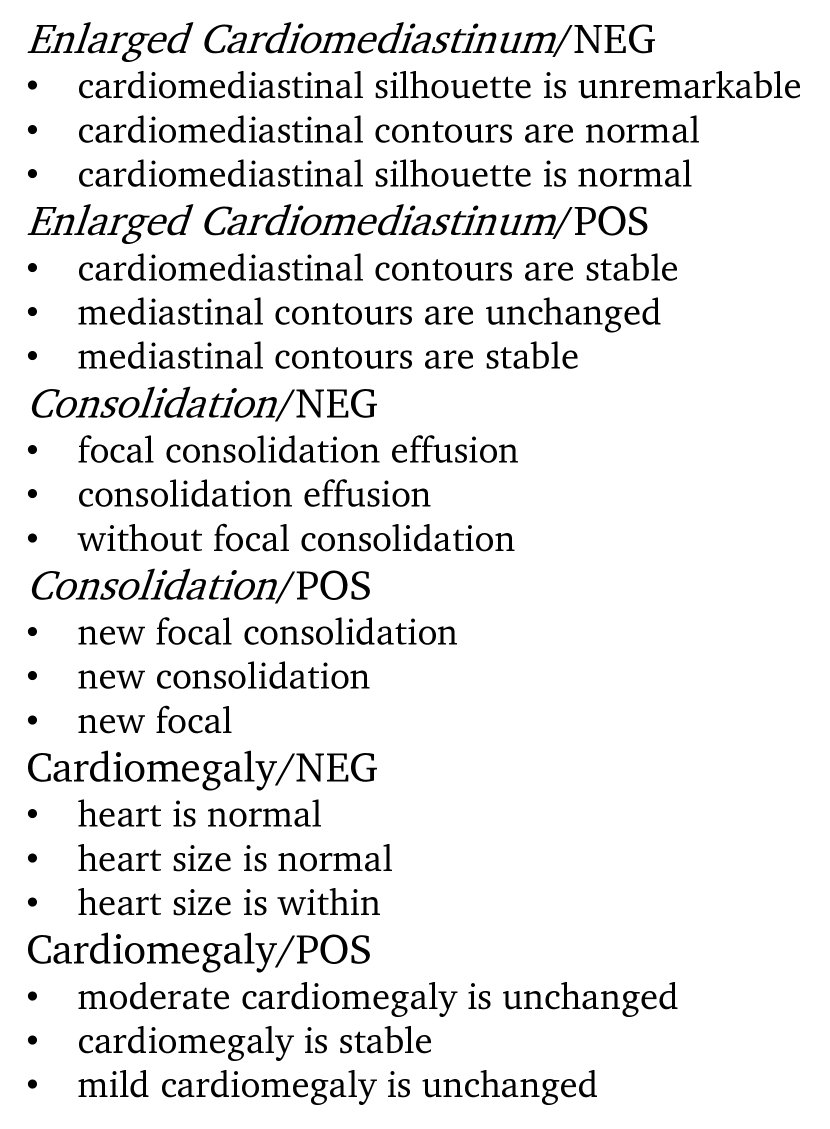
A.2 Observation-aware N-grams
Here are some of the observation-aware n-grams we use in our experiments, as shown in Figure 6. These categories are Enlarged Cardiomediastinum, Consolidation, and Cardiomegaly.