Reconstruction of Cosmic Black Hole Growth and Mass Distribution from Quasar Luminosity Functions at
Abstract
The evolution of the quasar luminosity function (QLF) is fundamental to understanding the cosmic evolution of black holes (BHs) through their accretion phases. In the era of the James Webb Space Telescope (JWST), Euclid, and Nancy Grace Roman Space Telescope, their unprecedented detection sensitivity and wide survey area can unveil the low-luminosity quasar and low-mass BH population, and provide new insights into quasar host galaxies. We present a theoretical model describing BH growth from initial seeding at to , incorporating the duration of accretion episodes, the distribution of Eddington ratios, and the mass dependency of BH accretion rates. By constraining the model parameters with the observed QLFs at across a wide UV luminosity range (), we find that the high-redshift BH population grows rapidly at , and decelerates the pace in subsequent epochs. Toward lower redshifts (), mass-dependent accretion inhibits the growth of high-mass BHs with , leading to mass saturation at . We predict the BH mass function down to for both unobscured and obscured quasar populations at , offering a benchmark for future observational tests. Our model accounts for the presence of both bright and faint quasars at , including those discovered by JWST. Furthermore, our findings suggest two distinct pathways for the early assembly of the BH-galaxy mass correlation: the population with a BH-to-stellar mass ratio near the local value of maintains a proximity to the relation through its evolution via moderate growth, while the population that begins to grow above the local relation accretes mass rapidly and becomes as overmassive as by .
1 Introduction
The quasar luminosity function (QLF) at high redshifts encodes key information on the radiative properties of black hole (BH) growth fed by accretion. Our current understanding of unobscured quasars at significantly benefits from wide-field surveys such as the Sloan Digital Sky Survey (SDSS; Jiang et al., 2016; Wu & Shen, 2022), the Pan-Starrs 1 (Bañados et al., 2016, 2023), and the Dark Energy Spectroscopic Instrument (Yang et al., 2023). Among these efforts, the Hyper Suprime-Cam Subaru Strategic Program (HSC-SSP; Aihara et al. 2018) has the unique advantage in finding high- low-luminosity quasars. In combination with the SDSS, the HSC-SSP has constrained QLF down to the faint end ( mag in absolute UV magnitude), thanks to the deep sensitivity of the 8.2m Subaru telescope and its wide ( deg2) coverage (Akiyama et al. 2018 for , Niida et al. 2020 for , Matsuoka et al. 2018 for , and Matsuoka et al. 2023 for ). These studies have provided the constraints on the quasar contribution to the cosmic X-ray and infrared background (e.g., Hauser & Dwek, 2001; Shen et al., 2020), and suggest that the ionizing photon budget from those quasars is not sufficient to complete cosmic reionization due to a rapid decay of the quasar abundance at (see Wang et al. 2019 and Schindler et al. 2023, but also an alternative interpretation by Fontanot et al. 2023).
The James Webb Space Telescope (JWST) has been revolutionizing our understanding of the nature of early proto-galaxies and their co-evolution with massive BHs in the nuclei. The unprecedented sensitivity of JWST has not only allowed for the detection of ultra high-redshift galaxies at (e.g., Adams et al., 2022; Castellano et al., 2022; Donnan et al., 2022; Finkelstein et al., 2022; Harikane et al., 2022a; Naidu et al., 2022; Fujimoto et al., 2023; Arrabal Haro et al., 2023; Harikane et al., 2023a), but also enabled the discovery of low-luminosity active galactic nuclei (AGNs) at , which were hidden in the pre-JWST era. Spectroscopic follow-up observations have provided estimates of the nuclear BH masses for these sources, including the discovery of the least-massive known BH with at the end of cosmic reionization (Onoue et al., 2023; Kocevski et al., 2023) and the most distant quasar at (Larson et al., 2023). Maiolino et al. (2023) recently reported the NIRSpec observation of GN-z11, an exceptionally luminous galaxy at , revealing the high ionization [Ne iv] 2423 transition and semi-forbidden nebular lines tracing clouds of broad-line regions of an AGN. The Mg ii-based virial BH mass is estimated as . The findings of low-luminosity AGNs and low-mass BHs put constraints on the mass distribution for seeds of high- quasars and the early stage of BH-galaxy co-evolution (e.g., Inayoshi et al., 2020; Volonteri et al., 2021). Intriguingly, the number density of broad-line faint AGNs detected by JWST is higher than extrapolation of the QLF constructed by HSC-SSP (Harikane et al., 2023b), and is comparable to the X-ray selected AGNs. The elusive abundance indicates a large population of faint AGNs buried in their host galaxies.
On the other hand, the shape and evolution of the BH mass function (BHMF) remain inadequately constrained, particularly at high redshifts of , where observation data have been focused on the high-mass end of (Vestergaard et al., 2008; Willott et al., 2010; Kelly & Shen, 2013; Wu et al., 2022). This limitation arises from the fact that dedicated spectroscopic observations for a large sample are required to measure the virial BH masses through Balmer lines or metal lines such as Mg ii and C iv, thereby making the construction of the BHMF observationally expensive. Additionally, correction for incompleteness in the BHMF at low mass ends is even more challenging than that for the QLF at faint ends, as the BH mass does not directly correlate with the source brightness. Nevertheless, extensive efforts have been made to identify BHs with masses of at from the ground (e.g., Kim et al., 2018; Onoue et al., 2019) and recently by the JWST (Kocevski et al., 2023; Harikane et al., 2023b). He et al. (in prep.) reconstruct the BHMF based on their HSC-SSP sample, pushing the mass boundary down to . The cosmic evolution of the QLF and BHMF provides the key to the origin of SMBHs and their growth mechanisms, in comparison to theoretical models of the low-mass end of the BHMF (Ricarte & Natarajan, 2018; Kim & Im, 2021; Li et al., 2022; Ni et al., 2022; Trinca et al., 2022). Furthermore, the ongoing JWST observations have pushed the mass boundary even down to – at , potentially uncovering even fainter and more representative quasars (e.g., Larson et al., 2023; Maiolino et al., 2023).
In this paper, we propose a theoretical model of BH growth to describe the cosmic evolution of the QLFs and BHMFs at . Building upon the method introduced in Li et al. (2022), we employ Markov Chain Monte Carlo (MCMC) fitting to optimize the model parameters that characterize the BH growth via mass accretion. Therefore, we anchor our BH growth model developed in Li et al. (2022) with the observed QLF to trace the cosmological growth of SMBHs during this epoch. We also discuss the cosmic evolution of BH mass density by integrating the BHMF both for unobscured and obscured quasar populations, and compare our findings with X-ray observations and cosmological simulation results. Moreover, using the best-fit parameters for BH growth, the model accounts for the presence of massive BHs at and more typical BHs at discovered by JWST, allowing us to probe their origin and seeding time. Our results shed light on the early assembly of the BH-to-galaxy mass correlation and provide insights into the evolution of both undermassive and overmassive BH populations relative to the empirical mass correlation observed in the local universe.
This paper is organized as follows. In Section 2, we describe the procedure to constrain the BH growth model by the observed QLFs. In Section 3, we present the fitting result of the QLF and show the predicted shape of the BHMF at in the mass range of , as well as the redshift dependence of the cosmic BH mass density. In Section 4, we illustrate the evolutionary tracks of individual BHs based on the best-fit growth model, and discuss the mass assembly of high- bright and faint quasars and the establishment of their BH-to-stellar mass ratio. Finally, we summarize our findings in Section 5. Throughout this paper, we adopt the cosmological parameters from Planck Collaboration et al. (2016), i.e., , and . All magnitudes quoted in this work are in the AB system.
2 Method
2.1 Evolution of the BHMF associated with BH growth
The QLF and BHMF at high redshifts are determined by the growth process of BH progenitors. Following Li et al. (2022), we characterize the growth of each BH by a minimal number of free parameters, giving the accretion rate by
| (1) |
where is the luminosity-based Eddington ratio, and is the Eddington accretion rate with a radiative efficiency of (Shakura & Sunyaev, 1973), which is consistent with the value obtained from the Soltan argument (e.g., Soltan, 1982; Yu & Tremaine, 2002). To model a non-exponential growth manner, we introduce a functional form:
| (2) |
where is adopted (e.g., Ueda et al., 2014). The functional form of is motivated by studies on the mass dependence of the radiative efficiency for AGNs at (e.g., Cao & Li, 2008; Li et al., 2012). With a positive value of , the BH growth at the high mass end is suppressed, while the growth speed for less massive BHs is accelerated. In the limit of , where is nearly independent of , the model in Eq. (1) reduces to an exponential growth with an -folding timescale of Myr.
Quasar activity is thought to take place episodically with accretion bursts triggered by gas inflows to the galactic nuclei and subsequent gas consumption (Di Matteo et al., 2005; Hopkins et al., 2005; Hopkins & Quataert, 2010). This intermittent manner of individual quasar luminosity evolution is directly reflected in the diversity seen in the Eddington ratio distribution function (ERDF) of observed quasars. In this work, we assume the ERDF to be characterized with a Schechter function
| (3) |
where and are considered to be free parameters in the following analysis. For low- AGNs, the ERDF can be described well with a Schechter-like function over (Schulze et al., 2015), which offers an advantage over a lognormal distribution function by allowing for a high abundance of low- populations, if any. The normalization of the function is adjusted so that the integral over equals one. We adopt the minimum Eddington ratio, , from simulations of quasar luminosities that exhibit a mild decrease towards within Myr after peak activity (Novak et al., 2011). However, we note that our choice of is tentative and thus the fraction of inactive BHs remains uncertain. We examine the case with (the best-fit value at ), where the total abundance is dominated by lower- populations. For instance, with a lower minimum Eddington ratio of , the inactive BH population defined as occupies of the total number; namely the abundance of active BHs we consider is reduced by a factor of , compared to our base case with .
The frequency of mass accretion bursts for individual BHs is calculated by introducing a time duration of , during which a single value of is assigned to an accreting BH following the ERDF of Eq. (3). In this way, we give a different growth speed of a BH in every period with a duration of , enabling us to capture the nature of accretion bursts. This phenomenological method also avoids numerous uncertainties in modeling of the galaxy assembly, gas feeding, and BH feedback processes in the quasar progenitor halos.
The time evolution of the BH mass distribution is calculated by taking account of the growth of existing BHs via mass accretion. For a given mass distribution function at , we give its evolution at as
| (4) |
where is the Eddington ratio required for a BH with to grow up to in , and is calculated implicitly from Eq. (1). We note that the time integration described in Eq. (4) does not take account of the contribution from newly-born BHs and BH coalescence associated with galaxy mergers in the time interval from to 4 (see more discussion in Li et al. 2022).
Based on the BHMF calculation, we generate the QLF by the convolution with the quasar ERDF given by Eq. (3). We adopt the obscuration fraction fitted by Ueda et al. (2014) based on X-ray observations up to . A conversion between the hard X-ray (2 - 10 keV) and bolometric luminosity is used following Duras et al. (2020). We thus calculate the rest-frame ultraviolet (UV) absolute magnitude as
| (5) |
where the bolometric luminosity measures the accretion power of the quasar. The unobscured QLF is calculated by
| (6) |
where the values of and are calculated analytically from Eq. (5).
2.2 Observational data and fitting analysis
We adopt the BHMF at obtained from Li et al. (2022) as the initial conditions. This semi-analytical model is calibrated based on the observed QLF and BHMF of quasar populations (Willott et al., 2010; Matsuoka et al., 2018), in a range of BH mass () and absolute UV magnitude (), respectively. The model optimizes the four parameters that govern the growth of BHs from their seeding epochs () using a Markov Chain Monte Carlo (MCMC) fitting procedure. The fitted parameters are Myr, , , and . The exact values of those parameters depend on the fraction of seed BHs () that have subsequent growth to participate in the assembly of SMBHs and end up in quasar host galaxies by . Assuming a lower value of , a higher average speed of BH growth (primarily due to a larger value of ) is required to fit the QLF data, resulting in a flatter slope of the BHMF at as shown in Figure 6 of Li et al. (2022). The flattening effect is not seen in the observable range of the QLF and BHMF at , but it causes a significant difference from the faint end of the QLFs at lower redshifts. Therefore, we adopt in this work instead of , in which case a slightly better goodness of fit is achieved (Li et al., 2022). After exploration of the parameter ranges, we set a uniform prior for and . For the two parameters characterizing the ERDF, the prior distribution functions for and assumed in Li et al. (2022) are adopted for all the periods from BH seeding to . As a caveat, we note that the exact value of is highly uncertain and unconstrained in the current observations, but affects the shape of the faint end of the QLFs () and low-mass end of the BHMFs (). This issue is left for future investigation.
| Redshift | (Myr) | |||
|---|---|---|---|---|
| 151 () | () | 0.42 () | () | |
| 195 () | () | 0.50 () | () | |
| 20.1 () | () | 0.89 () | 0.12 () | |
| 142 () | () | 0.53 () | () |
Note. — The best-fit parameters optimized by MCMC sampling for the three redshift ranges. The 16%, 50%, and 84% quantiles in the cumulative distribution are shown in the parentheses. The result for the case where only the QLF data at and are taken into account for the parameter fitting.
The observed QLF is taken from Akiyama et al. (2018) at and Niida et al. (2020) at over a wide range of UV magnitude at (based on SDSS DR7) and (HSC-Wide). The magnitude bins and the error sizes are adopted according to those studies. Both the and QLF datasets with small statistical errors allow us to constrain our BH growth model in a sufficient level. We limit the range of UV magnitude to in the fitting, to avoid the potential bias of these observations caused by their quasar selection strategy (e.g., point source against extended source). It is worth noting that the redshifts for the quasar samples used in constructing the binned QLFs are not perfectly aligned with the integer values ( 6, 5, and 4). These quasars are drawn from a large sample with mean redshifts of 6.1 (Matsuoka et al., 2018), 4.9 (Niida et al., 2020), and 3.9 (Akiyama et al., 2018), respectively. The completeness function for quasar selection is dependent on both redshift and luminosity. Therefore, the correction of the redshift differences of the sub-sample in each luminosity bin (corresponding to an error of time with Myr) may introduce potential systematic errors. On the other hand, our fitting results based on the mean redshifts show minor discrepancies from those using the integer redshifts, both locating within the statistical errors of the binned QLF. Therefore, we do not consider the redshift dispersion in the binned QLFs and fit the QLF models at the integer redshifts.
In our analysis, we fit the BH growth parameters separately for two time periods: from down to (for a time duration of Myr), and from to (for Myr), respectively. This treatment allows us to minimize the offsets between our modeled QLF and the observational data at the two redshift snapshots. The best-fit parameters for BH growth in each time period converge to different values, reflecting the different BH growth patterns during the two periods. Alternatively, we attempt to constrain the BH growth model only with the QLF data. With the best-fit parameters (see Table 1), we generate the BH population evolution and produce the QLF model at in order to make a comparison with the observation. In this case, the theoretical QLF at becomes significantly less abundant in the luminous magnitude range () compared to observational data with errors. This result indicates the growth for quasars at is more rapid than the average speed between and 4, i.e., a uniform growth pattern cannot account for the growth characterized by the two snapshots of the observed QLF. Therefore, we choose to fit the observational data for the two growth periods independently and interpret the varying trend of best-fit parameter sets. In this study, we employ a parameter ensemble after stabilization of the MCMC calculation and evaluate the standard deviation of the results as the 1 scatter of the modeled QLF and BHMF curves. We account for the omission of the burn-in length, which results in a narrower 1 scatter for the new calculations at and 4 compared to those at . Despite this, our overall analysis remains unaffected as we primarily focus on the results derived from the best-fit parameter sets.
In the framework of our model, the parameter plays a crucial role in shaping the QLF and BHMF by regulating the average pace of BH growth via recurring samplings of the Eddington ratio . With a smaller value of , the Eddington ratio varies more frequently, and thus the average growth rate (i.e., the Eddington ratio) is closer to the peak value of the ERDF that depends on and . On the other hand, a larger value of allows BHs to experience substantial, more prolonged growth with a high at a non-negligible likelihood. This mechanism leads to a modulation of the BHMF and QLF, making the slopes at the high mass and bright end steeper (shallower) for smaller (larger) values of . The detailed role of the episodic accretion prescription and its influence on the result are further explored in the Appendix of Li et al. (2022).
3 Result
In Table 1, we summarize the best-fit parameter sets that reproduce the observed QLFs at . For each parameter, we show the peak value of the one-dimensional posterior distribution, as well as the 16%, 50%, and 84% quantiles in the cumulative distribution in the parentheses. As shown in the best-fit results, the power-law slope of the intrinsic Schechter-like ERDF evolves from at to at and at , and the characteristic Eddington ratio decreases toward lower redshifts. The tendency appears to be consistent with that seen in the observed ERDF between and (see He et al. in prep). The typical duration of quasar activity is required to be longer toward lower redshifts; Myr at . This result suggests that, in the redshift interval of , accreting BHs change their growth speeds (and thus their Eddington ratios) at a frequency of three or more times. Our phenomenological model also indicates a larger value of at , which induces substantial suppression of mass growth for heavier SMBHs with . The deceleration and deviation from the exponential growth manner possibly lead to the downsizing or anti-hierarchical evolution of massive BH populations (see more discussion in Ueda et al. 2014 and He et al. in prep).
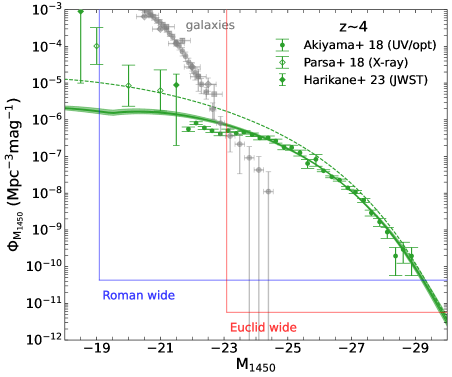
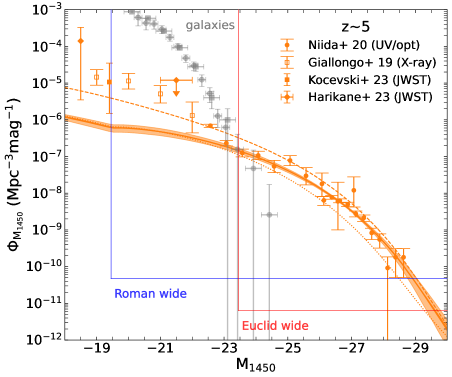
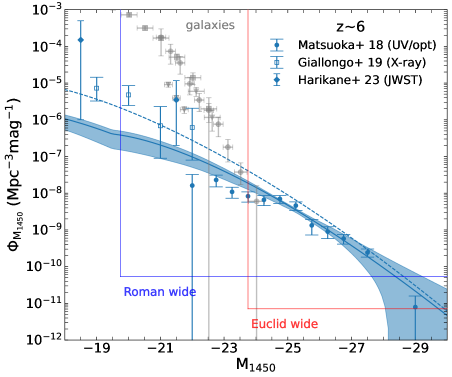
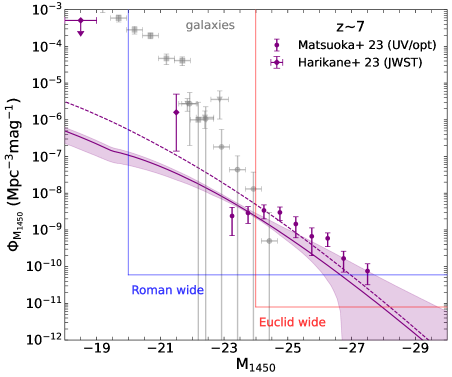
In Figure 1, we show the theoretical model of the unobscured (solid) and intrinsic (unobscured + obscured; dashed) QLFs at , , , and , as well as the standard deviation calculated from random parameter sampling in the Markov chain. For comparison, we present the observational data for rest-UV selected unobscured quasars taken from Akiyama et al. (2018), Niida et al. (2020), Matsuoka et al. (2018), and Matsuoka et al. (2023), and X-ray selected quasars from Parsa et al. (2018) and Giallongo et al. (2019), respectively. The theoretical QLFs at and are calculated in this work and those at and are taken from Li et al. (2022). We also present the QLF model at calibrated only by the and observed QLF data (dotted). The result shows a relatively large offset from the binned QLF data. We overlay the expected depths and survey volumes of Euclid (Laureijs et al., 2011; Euclid Collaboration et al., 2019) and the Nancy Grace Roman Space Telescope (RST; Akeson et al., 2019) in each panel, assuming their wide-area survey layers for hunting high- quasars. The depths correspond to apparent magnitude mag and 27 mag for Euclid and RST, respectively. The detection limits of Euclid and RST allow for marginal detection of one quasar up to redshifts of and , respectively (see Table 4 in Li et al. 2022 and discussion in Fan et al. 2022).
Overall, our best-fit model for the unobscured QLFs agrees with the constraints from the rest-UV based QLFs at , while the model shows a moderate discrepancy from the observational data at the fainter end. On the other hand, the intrinsic (unobscured + obscured) QLF model is broadly consistent with the abundance of the X-ray selected faint quasars (), which is substantially higher than those expected from extrapolation of the rest-UV based QLF to the faint end. A recent study by Harikane et al. (2023b) reported the discovery of 10 AGNs at redshifts – 7 with JWST, emphasizing the potential of JWST in uncovering faint, broad-line AGNs (see also Onoue et al. 2023; Kocevski et al. 2023; Übler et al. 2023; Larson et al. 2023). Their results provide constraints on the abundance of such faint quasars, with values ranging in Mpc-3 mag-1 at , based on the total UV luminosity including both the host galaxy and AGN components. Despite the differences in methodology, this new constraint of broad-line AGNs is comparable with the faint end of X-ray based QLFs within the statistical errors. These findings not only advance our understanding of the quasar population, but also set the stage for more comprehensive studies and future breakthroughs in the field.
In Figure 2, we present the theoretical BHMFs at – 11 for the unobscured (solid) and total (dashed) BH population. We also overlay the observed BHMF for unobscured populations at (He et al. in prep), (Wu et al., 2022), and (Schulze et al., 2015), where the virial BH mass is estimated with the C iv and Mg ii-based single epoch method (Vestergaard & Peterson, 2006; Shen et al., 2011; Kelly & Shen, 2013). We note that the systematic error of the observed BHMF due to the uncertainty from the virial mass estimate is not evaluated here but has been discussed extensively in the literature (e.g., Kelly & Shen, 2013; Coatman et al., 2017). While these observational results show a considerable scatter, particularly after correcting for the incompleteness in low-mass samples, our predicted BHMF shape (solid curve with error at each redshift) remains generally consistent with the observed BHMF at and 4 in the high mass end. This consistency holds despite the fact that we do not use these data for parameter fitting111The total BHMF at in our model is calibrated with that constructed by Willott et al. (2010).. As a caveat, our model takes into account BH populations formed in relatively biased regions of the universe with mass variance of , neglecting contributions from substantially low-mass BH populations and their mass growth. Therefore, the predicted BHMF provides a lower bound of the BH abundance at low mass regimes of – , which will be probed by space-based gravitational-wave detectors such as the Laser Interferometer Space Antenna (LISA; Amaro-Seoane et al. 2023), Tian-Qin (Luo et al., 2016; Mei et al., 2021), and Taiji (Ruan et al., 2018, 2020).
The BHMF evolves preferentially at the high mass end with between redshifts of and 5. This rapid growth of high-mass BHs is associated with the QLF evolution at , corresponding to the Eddington luminosity for BHs with . Toward a lower redshift at , the growth of such massive BHs is stunted, resulting in a saturation of BHMF at . The unobscured BH abundance at reaches at , nearly of the BH abundance with the same mass range at lower redshifts of (Schulze et al., 2015). We note that those growing BHs are witnessed by JWST in this redshift range, enabling us to probe the growth pattern of the abundant and low-mass BH population (see Figure 4 and Section 4).
At all the redshifts, the abundance of obscured AGNs tends to dominate over unobscured ones at . In addition to X-ray selected obscured AGNs, a recent study by Yang et al. (2023) infers a hidden population of AGNs from spectral decomposition in the mid-infrared band using the Mid-Infrared Instrument (MIRI) onboard JWST. They present a larger obscured fraction for AGNs at than that based on current X-ray observations. Therefore, alternative methods, such as deep X-ray and mid-infrared observations, are crucial for constraining the total BH population during the epoch of cosmic reionization (e.g., Ueda et al., 2014; Vito et al., 2018; Gilli et al., 2022).
In Figure 3, we present the evolution of the cumulative BH mass density within a comoving volume, which is derived by integrating the total BHMF shown in Figure 2
| (7) |
We consider three mass ranges: (blue)222The population includes BHs that participate in the assembly of SMBHs, but do not consider dormant seed BHs, which occupy of the total seeds formed in our calculation (i.e., )., (orange), and (green). At extremely high redshifts (), the total BH mass density is constituted by the low-mass population with . As the universe approaches the end of cosmic reionization (), BHs with begin to account for the majority of the total BH mass density, resulting in the anti-hierarchical evolution of massive BHs. At , the growth pace of the heaviest BHs with masses exceeding begins to decelerate, and the total cumulative density reaches by . This value corresponds to more than of the total BH mass density observed in the present-day universe, (e.g., Marconi et al., 2004; Shankar et al., 2009; Vika et al., 2009). The overall trends for the massive BH populations with at are in good agreement with those obtained from the cosmological simulations in Ni et al. (2022) (dotted curves).
The unresolved fraction of the cosmic X-ray background at places constraints on the global BH accretion history (Salvaterra et al., 2012; Treister et al., 2013). Upper limits on the density of accreted mass (grey arrows) prevent an overproduction of massive BHs and their seeds at the cosmic dawn. At , our model can be cross-referenced with the accumulated BH mass density inferred from the abundance of X-ray selected AGNs with (dotted-dashed; Ueda et al., 2014)333 Ueda et al. (2014) calculated the density of mass accreted onto BHs assuming a radiative efficiency of . This is half of our fiducial value of , increasing the mass density by a factor of two. Therefore, we have rescaled their results by a factor of 0.5 for comparison to our study.. Even though our result shows values approximately two-thirds of those derived from X-ray results, this discrepancy could be attributed to incomplete sampling of BHs in our model. In particular, we have taken into account the contributions of BHs from relatively biased regions of the universe with mass variance of , but overlooked migration of less massive seed BH populations originating in more typical regions, where galaxies form in parent halos with at .
In our exploration of the early evolution of low-mass BHs, our model presents a mass density at that is consistent with the observations of GN-z11, as inferred from its cosmic volume density and BH mass, (star symbol), considering the uncertainty in its mass and abundance measurement (Maiolino et al., 2023; Oesch et al., 2016). Intriguingly, even sophisticated cosmological simulations fail to attain this value, which likely points to their insufficient treatments of BH seeding (dotted curves; Ni et al., 2022). This highlights the importance of our approach that connects BH seeding with subsequent growth and the unique insights into the understanding of BH evolution, particularly in these early epochs of the universe.

4 Discussion
4.1 Individual BH growth
We explore the individual evolutionary tracks of BHs starting from their seeding epochs with intermittent accretion rates that are modeled to reproduce the observed QLFs at (see Figure 1). We generate a sample of BHs following their formation times and mass distribution at birth as described in Li et al. (2021, 2022). Adopting the best-fit parameters for each redshift range (see Table. 1), we assign a single value of the Eddington ratio generated from the Schechter-like ERDF with and in each time interval of . With these parameters, we grow the individual BHs until and study their statistical properties.
Figure 4 presents the mass growth tracks between and for a randomly-selected subset of 100 BHs out of the samples (grey curves). We here employ color-coding to represent three distinct BH populations: (i) those reaching by , (ii) those with at , and (iii) those have grown to at . For classes (i) and (iii), we highlight all tracks that meet the conditions among the whole samples, while for class (ii), we only present 40 curves out of an approximate total of 40,000 for illustrative purposes. The color of each curve represents the bolometric luminosity for the accreting BH associated with its growth. Additionally, we overlay the data points of high- quasars previously known and recently reported by JWST observations (Mortlock et al., 2011; Wu et al., 2015; Bañados et al., 2018; Onoue et al., 2019; Yang et al., 2020; Wang et al., 2021; Wu et al., 2022; Kocevski et al., 2023; Übler et al., 2023; Harikane et al., 2023b; Larson et al., 2023; Maiolino et al., 2023).
In our sample of objects, six BHs are identified as bright quasars hosting massive BHs with at (class i). During an actively growing phase, the bolometric luminosity rises and reaches levels comparable to the brightest quasars observed by SDSS and HSC (filled circles representing data taken from Wu et al. 2022 and Onoue et al. 2019). The growth trajectory of the most massive BH explains the existence of J0313-1806 at (Wang et al., 2021), J1120+0641 at (Mortlock et al., 2011), and J0100+2802 at (Wu et al., 2015), while that of the second-most massive BHs accounts for J1342+0928 at (Bañados et al., 2018). Furthermore, the very distant quasar reported at by JWST/CEERS programs (CEERS-1019; Larson et al., 2023) and GN-z11 at by JWST/JADES programs (Maiolino et al., 2023) can be attributed to the BH population that ends up in typical bright quasars hosting at . Recent theoretical studies provide a formation model of those BHs in CEERS-1019 and GN-z11 based on heavy seed BHs with – as shown in Figure 9 of Li et al. 2022 (see also an alternative model presented in Schneider et al. 2023).
A larger population of the BHs follow moderate growth tracks, where their masses lie in the range of at (class ii). These low-luminosity AGNs with are more representative of the normal BH population rather than the ultra-rare and luminous quasars discussed above. The successful spectroscopic identification of low-luminosity broad-line AGNs at – 7 opens up a new parameter space for high-redshift AGN studies, thanks to the unprecedented infrared sensitivity of JWST. Here, we overlay the spectroscopically-confirmed AGNs with JWST (Kocevski et al., 2023; Übler et al., 2023; Harikane et al., 2023b). This population can be explained by seed BHs with – at , originating from massive stellar remnants formed in moderately-biased regions of the high- universe (e.g., Valiante et al., 2018; Lupi et al., 2021; Li et al., 2021; Sassano et al., 2021; Toyouchi et al., 2023).

Moreover, the BH growth model successfully reproduces the presence of the heaviest BHs, which have at (class iii). These ultra-massive BHs originate from two distinct sources. The first origin is the brightest quasars, where the BHs have already achieved significant mass by (class i). The second origin comprises rapidly accreting BHs, which have – at . In the latter scenario, a small fraction of those normal BH populations at undergo substantial mass accretion. This high growth rate persists for longer periods at owing to the redshift dependence of the typical active duration , which increases at lower redshifts. At , the active duration is Myr, which is comparable to the cosmic time elapsed between the redshift interval ( Myr). Thus, a minor population of BHs experience significant mass accretion through super-Eddington phases at rates with . This type of transient super-Eddington accretion is expected to take place in high- massive galaxies (e.g., Inayoshi et al., 2022b), and the nature of radiatively inefficient accretion due to photon trapping (Abramowicz et al., 1988; Watarai et al., 2000) might account for high- quasars with small proximity zones that indicate short lifetimes yr (Eilers et al., 2021).
As we shift toward lower redshifts, the growth of such a rare BH population is suppressed and thus their mass saturates at – . Intriguingly, this outcome aligns with observations showing that the largest SMBHs have a mass of , nearly independent of redshift from the local () to the early () universe (Inayoshi & Haiman, 2016; King, 2016). Various physical processes would contribute to this outcome, including accretion disk instability (e.g., Pringle, 1991; Yu et al., 2005), and strong feedback mechanisms through outflows and jets counteracting the inflow motion (e.g., Blandford & Begelman, 1999; Ho, 2002; Ichikawa & Inayoshi, 2017).
4.2 Connection between BH and galaxy growth
The assembly of the mass correlation between BHs in high- quasars and their host galaxies is crucial for understanding the establishment of their local relationship (e.g., Kormendy & Ho, 2013), despite its origin remaining one of the longest-standing unsolved puzzles in astrophysics (e.g., Murray et al., 2005; Silk, 2013; Cen, 2015; Ni et al., 2022; Inayoshi et al., 2022b; Habouzit et al., 2022). Direct measurements of the stellar mass of high- quasar hosts can be challenging without observations of rest-frame optical light. In certain cases, the gas dynamical mass derived from [C ii] 158 serves as a proxy of the stellar mass. The measured BH-to-stellar mass ratio for luminous quasars significantly exceeds the local relation (e.g., Wang et al., 2013; Venemans et al., 2017; Neeleman et al., 2021). In contrast, for low-luminosity quasars, the ratio aligns more closely or even falls below the local relation (Izumi et al., 2019, 2021). In Figure 5, the BH mass is presented against the gas dynamical mass for those AGN samples at (black circle, the data compiled by Izumi et al. 2021).
Recent JWST observations have provided new insights into the evolution of the BH-to-stellar mass correlation through the discovery of low-luminosity AGNs in the high- universe and detection of stellar optical light in the rest frame (e.g., Onoue et al., 2023; Ding et al., 2022). Spectroscopic follow-up observations have confirmed 12 broad-line AGNs, allowing for the measurement of their BH masses using the H(H)-based single epoch method: CEERS 1670 at (Kocevski et al., 2023), GS 3073 at (Übler et al., 2023), CEERS 1019 at (Larson et al., 2023), and several additional sources at (Harikane et al., 2023b). In addition, GN-z11, an extraordinarily luminous galaxy at , has been reported to host an AGN, as evidenced by the detection of the high ionization [Ne iv] 2423 transition and semi-forbidden nebular lines tracing the clouds of the broad-line regions (Maiolino et al., 2023). The stellar mass of these AGN host galaxies can be estimated through AGN-host image decomposition, spectral fitting, or a combination of the two (Kocevski et al., 2023; Übler et al., 2023; Larson et al., 2023; Harikane et al., 2023b). As illustrated in Figure 5, the resulting BH-to-stellar mass ratio (star symbols) is systematically higher than that found in AGN-host galaxies at (grey circles; Reines & Volonteri, 2015), but it is more consistent with the relation observed in local elliptical galaxies (solid black line; Kormendy & Ho, 2013).
In the following discussion, we examine the evolutionary track of the BH-to-stellar mass ratio from seeding time to the observed epoch by selecting several AGNs with measured BH and stellar masses. We utilize individual growth tracks of our BH samples shown in Figure 4 to analyze the BH mass assembly, identifying the masses of the BH and its parent halo at the seeding redshift (for more details, see Li et al. 2021). Although the stellar mass assembly history of these BH hosts remains uncertain with current observations, the stellar mass can be approximated to follow that of the parent dark matter halo as , where is the baryon fraction and is the star formation efficiency from gas into stars, for which we adopt a constant value without depending on the redshift and halo properties. This approximation is broadly consistent with cosmological simulations that trace the assembly of quasar host galaxies at high redshifts (e.g., Valentini et al., 2021; Zhu et al., 2022)444 The star formation efficiency is expected to be as low as in dark-matter halos with (McCaffrey et al., 2023), whose virial temperature is below the atomic cooling threshold of at redshifts of interest. In contrast, the efficiency increases to in more massive halos, as expected for bright galaxies detected with JWST (e.g., Inayoshi et al., 2022a; Boylan-Kolchin, 2023; Ferrara et al., 2023; Mason et al., 2023; Shen et al., 2023).. However, in comparison with empirical relations suggested by Behroozi et al. (2019) (see their Figure 9), our treatment would give an overestimate of the stellar mass at higher redshifts and lower halo masses. To take account of this uncertainty, we therefore examine three cases with , , and , and demonstrate that the choice of does not affect our discussion for the BH-to-stellar mass ratio. The parent halo mass growth of a host galaxy follows a functional form of (Wechsler et al., 2002; Neistein & Dekel, 2008; Fakhouri et al., 2010), resulting in a halo-mass growth rate of . This rate is based on the extended Press-Schechter formalism and consistent with fitting the individual halo growth in cosmological -body simulations (Dekel et al., 2013).
We select six observed AGNs with measured BH and stellar masses, including the most distant AGN (Larson et al., 2023), two quasars with notably overmassive BHs (Übler et al., 2023; Wu et al., 2015), and three quasars chosen from the ten reported in Harikane et al. (2023b): GLASS 150029, CEERS 00397, and CEERS 00717, all with moderate BH-to-stellar mass ratios. By considering the observed redshift and stellar mass, we calibrate the galaxy assembly parameter to bridge the initial and final stellar mass for each object (for more details, see Inayoshi et al. 2022b).
Figure 5 presents the evolution tracks of the BHs and galaxies for the six selected AGNs, for each of which three values of the star formation efficiencies are considered, 0.05, 0.1 (solid curve), and 0.2. We incorporate the individual evolution pathways of the selected AGNs at , drawing from tracks corresponding to those with similar BH masses at the observed redshift of each AGN (see Figure 4). The population exhibiting a BH-to-stellar mass ratio near the local relation (4 objects; Larson et al., 2023; Harikane et al., 2023b) follows tracks that originate with small BH masses at and subsequently approach the local relation. This implies that these BHs undergo moderate growth and maintain a relatively close proximity to the local relation throughout their evolution (e.g., Habouzit et al. 2022; J. Li et al. 2022).
In contrast, the remaining two objects follow distinct evolutionary trajectories. The BH in GS 3073 (Übler et al., 2023) starts near the local relation and becomes overmassive by the observed epoch due to rapid mass accretion. The most massive BH at , found in J0100+2802 (Wu et al., 2015), has an evolutionary track that reaches the local relation at but then surpasses it by increasing the BH mass rapidly. To understand the subsequent evolution of the distant BH at (Larson et al., 2023), which might be a luminous quasar at , we extrapolate the BH and stellar masses and predict their future evolution. We select two evolutionary tracks from Figure 4 that are closest to the BH of CEERS-1019 (note that the BH with in GN-z11 recetly reported by Maiolino et al. 2023 is also located close to the two tracks). By adopting these BH growth tracks and extrapolating the stellar masses to , we find that this BH could either grow to be overmassive or maintain the BH-to-stellar mass ratio consistent with the local value as indicated by the two dashed curves (Agarwal et al., 2013; Natarajan et al., 2017; Inayoshi et al., 2022b; Hu et al., 2022; Scoggins et al., 2023).
5 Summary
In this paper, we expand upon the BH growth model developed in Li et al. (2022), linking the QLF at with those at lower redshifts ( – ). This growth model captures the episodic nature of BH accretion and incorporates parameters that characterize the duration of mass accretion, the Eddington ratio distribution function, and the mass dependency of BH accretion rates. Based on the previous work by Li et al. (2022), where the early assembly of seed and massive BHs is constrained in comparison with the observed QLF (Matsuoka et al., 2018) and BHMF (Willott et al., 2010) at , we further extend the evolution of those BH populations down to and , and calibrate the growth model utilizing the QLF at each epoch (Niida et al., 2020; Akiyama et al., 2018) across a wide UV magnitude range ().
Our best-fit parameters at each redshift interval vary substantially from those obtained at , reflecting the different growth speeds and frequencies of accretion bursts in these stages. The rapid growth of massive BHs begins to decelerate at and is further stunted at . This trend is indicated by both the characteristic Eddington ratio and the mass-dependent growth parameter suppressing the growth of high-mass BHs. We observe a saturation of BH mass growth at at , consistent with the apparent maximum mass of observed SMBHs. We present the unobscured and total (unobscured + obscured) BHMF at according to our best-fit BH growth model. While our prediction overestimates the BH abundance at the lower mass range, it broadly agrees with current observational results in the high-mass end of the BHMF (see He et al. in prep), offering a benchmark for future observational tests and comparison of the bulk shape of the BHMF at , particularly their low-mass ends. Moreover, we discuss the cosmic evolution of BH mass density by integrating the total BHMF, and find the result consistent with both X-ray observations at (Ueda et al., 2014) and the value inferred from recent observations of GN-z11 at (Maiolino et al., 2023).
We construct evolutionary pathways for a large sample of BHs that grow from their initial seeding at to , based on our best-fit model parameters. Our episodic BH growth model predicts both faint and bright phases for individual BHs throughout their evolution. This model successfully accounts for the observed quasar population at high redshifts, including the low-luminosity AGNs recently detected in JWST observations (Onoue et al., 2023; Kocevski et al., 2023; Übler et al., 2023; Harikane et al., 2023b; Larson et al., 2023; Maiolino et al., 2023).
We further explore the early evolution of the BH-galaxy mass correlation, assuming that the stellar mass growth follows that of the parent dark matter halo with a constant star formation efficiency. Our results suggest two assembly pathways: (1) populations with a BH-to-stellar mass ratio near or below the local relation exhibit moderate BH growth before their observed epoch and remain close to the local relation, and (2) overmassive populations, in contrast, start with a mass ratio near the local relation and become overmassive through rapid BH accretion at later epochs.
References
- Abramowicz et al. (1988) Abramowicz, M. A., Czerny, B., Lasota, J. P., & Szuszkiewicz, E. 1988, ApJ, 332, 646, doi: 10.1086/166683
- Adams et al. (2022) Adams, N. J., Conselice, C. J., Ferreira, L., et al. 2022, arXiv e-prints, arXiv:2207.11217. https://arxiv.org/abs/2207.11217
- Agarwal et al. (2013) Agarwal, B., Davis, A. J., Khochfar, S., Natarajan, P., & Dunlop, J. S. 2013, MNRAS, 432, 3438, doi: 10.1093/mnras/stt696
- Aihara et al. (2018) Aihara, H., Arimoto, N., Armstrong, R., et al. 2018, PASJ, 70, S4, doi: 10.1093/pasj/psx066
- Akeson et al. (2019) Akeson, R., Armus, L., Bachelet, E., et al. 2019, arXiv e-prints, arXiv:1902.05569. https://arxiv.org/abs/1902.05569
- Akiyama et al. (2018) Akiyama, M., He, W., Ikeda, H., et al. 2018, PASJ, 70, S34, doi: 10.1093/pasj/psx091
- Amaro-Seoane et al. (2023) Amaro-Seoane, P., Andrews, J., Arca Sedda, M., et al. 2023, Living Reviews in Relativity, 26, 2, doi: 10.1007/s41114-022-00041-y
- Arrabal Haro et al. (2023) Arrabal Haro, P., Dickinson, M., Finkelstein, S. L., et al. 2023, arXiv e-prints, arXiv:2303.15431, doi: 10.48550/arXiv.2303.15431
- Bañados et al. (2016) Bañados, E., Venemans, B. P., Decarli, R., et al. 2016, ApJS, 227, 11, doi: 10.3847/0067-0049/227/1/11
- Bañados et al. (2018) Bañados, E., Venemans, B. P., Mazzucchelli, C., et al. 2018, Nature, 553, 473, doi: 10.1038/nature25180
- Bañados et al. (2023) Bañados, E., Schindler, J.-T., Venemans, B. P., et al. 2023, ApJS, 265, 29, doi: 10.3847/1538-4365/acb3c7
- Behroozi et al. (2019) Behroozi, P., Wechsler, R. H., Hearin, A. P., & Conroy, C. 2019, MNRAS, 488, 3143, doi: 10.1093/mnras/stz1182
- Blandford & Begelman (1999) Blandford, R. D., & Begelman, M. C. 1999, MNRAS, 303, L1, doi: 10.1046/j.1365-8711.1999.02358.x
- Bouwens et al. (2021) Bouwens, R. J., Oesch, P. A., Stefanon, M., et al. 2021, AJ, 162, 47, doi: 10.3847/1538-3881/abf83e
- Bowler et al. (2017) Bowler, R. A. A., Dunlop, J. S., McLure, R. J., & McLeod, D. J. 2017, MNRAS, 466, 3612, doi: 10.1093/mnras/stw3296
- Bowler et al. (2015) Bowler, R. A. A., Dunlop, J. S., McLure, R. J., et al. 2015, MNRAS, 452, 1817, doi: 10.1093/mnras/stv1403
- Boylan-Kolchin (2023) Boylan-Kolchin, M. 2023, Nature Astronomy, doi: 10.1038/s41550-023-01937-7
- Cao & Li (2008) Cao, X., & Li, F. 2008, MNRAS, 390, 561, doi: 10.1111/j.1365-2966.2008.13800.x
- Castellano et al. (2022) Castellano, M., Fontana, A., Treu, T., et al. 2022, arXiv e-prints, arXiv:2207.09436. https://arxiv.org/abs/2207.09436
- Cen (2015) Cen, R. 2015, ApJ, 805, L9, doi: 10.1088/2041-8205/805/1/L9
- Coatman et al. (2017) Coatman, L., Hewett, P. C., Banerji, M., et al. 2017, MNRAS, 465, 2120, doi: 10.1093/mnras/stw2797
- Dekel et al. (2013) Dekel, A., Zolotov, A., Tweed, D., et al. 2013, MNRAS, 435, 999, doi: 10.1093/mnras/stt1338
- Di Matteo et al. (2005) Di Matteo, T., Springel, V., & Hernquist, L. 2005, Nature, 433, 604, doi: 10.1038/nature03335
- Ding et al. (2022) Ding, X., Onoue, M., Silverman, J. D., et al. 2022, arXiv e-prints, arXiv:2211.14329, doi: 10.48550/arXiv.2211.14329
- Donnan et al. (2022) Donnan, C. T., McLeod, D. J., Dunlop, J. S., et al. 2022, arXiv e-prints, arXiv:2207.12356. https://arxiv.org/abs/2207.12356
- Duras et al. (2020) Duras, F., Bongiorno, A., Ricci, F., et al. 2020, A&A, 636, A73, doi: 10.1051/0004-6361/201936817
- Eilers et al. (2021) Eilers, A.-C., Hennawi, J. F., Davies, F. B., & Simcoe, R. A. 2021, ApJ, 917, 38, doi: 10.3847/1538-4357/ac0a76
- Euclid Collaboration et al. (2019) Euclid Collaboration, Barnett, R., Warren, S. J., et al. 2019, A&A, 631, A85, doi: 10.1051/0004-6361/201936427
- Fakhouri et al. (2010) Fakhouri, O., Ma, C.-P., & Boylan-Kolchin, M. 2010, MNRAS, 406, 2267, doi: 10.1111/j.1365-2966.2010.16859.x
- Fan et al. (2022) Fan, X., Banados, E., & Simcoe, R. A. 2022, arXiv e-prints, arXiv:2212.06907, doi: 10.48550/arXiv.2212.06907
- Ferrara et al. (2023) Ferrara, A., Pallottini, A., & Dayal, P. 2023, MNRAS, 522, 3986, doi: 10.1093/mnras/stad1095
- Finkelstein et al. (2015) Finkelstein, S. L., Ryan, Russell E., J., Papovich, C., et al. 2015, ApJ, 810, 71, doi: 10.1088/0004-637X/810/1/71
- Finkelstein et al. (2022) Finkelstein, S. L., Bagley, M. B., Arrabal Haro, P., et al. 2022, arXiv e-prints, arXiv:2207.12474. https://arxiv.org/abs/2207.12474
- Fontanot et al. (2023) Fontanot, F., Cristiani, S., Grazian, A., et al. 2023, MNRAS, 520, 740, doi: 10.1093/mnras/stad189
- Fujimoto et al. (2023) Fujimoto, S., Arrabal Haro, P., Dickinson, M., et al. 2023, arXiv e-prints, arXiv:2301.09482, doi: 10.48550/arXiv.2301.09482
- Giallongo et al. (2019) Giallongo, E., Grazian, A., Fiore, F., et al. 2019, ApJ, 884, 19, doi: 10.3847/1538-4357/ab39e1
- Gilli et al. (2022) Gilli, R., Norman, C., Calura, F., et al. 2022, A&A, 666, A17, doi: 10.1051/0004-6361/202243708
- Habouzit et al. (2022) Habouzit, M., Onoue, M., Bañados, E., et al. 2022, MNRAS, doi: 10.1093/mnras/stac225
- Harikane et al. (2023a) Harikane, Y., Nakajima, K., Ouchi, M., et al. 2023a, arXiv e-prints, arXiv:2304.06658, doi: 10.48550/arXiv.2304.06658
- Harikane et al. (2022a) Harikane, Y., Ouchi, M., Oguri, M., et al. 2022a, arXiv e-prints, arXiv:2208.01612. https://arxiv.org/abs/2208.01612
- Harikane et al. (2022b) Harikane, Y., Ono, Y., Ouchi, M., et al. 2022b, ApJS, 259, 20, doi: 10.3847/1538-4365/ac3dfc
- Harikane et al. (2023b) Harikane, Y., Zhang, Y., Nakajima, K., et al. 2023b, arXiv e-prints, arXiv:2303.11946, doi: 10.48550/arXiv.2303.11946
- Hauser & Dwek (2001) Hauser, M. G., & Dwek, E. 2001, ARA&A, 39, 249, doi: 10.1146/annurev.astro.39.1.249
- Ho (2002) Ho, L. C. 2002, ApJ, 564, 120, doi: 10.1086/324399
- Hopkins et al. (2005) Hopkins, P. F., Hernquist, L., Cox, T. J., et al. 2005, ApJ, 630, 705, doi: 10.1086/432438
- Hopkins & Quataert (2010) Hopkins, P. F., & Quataert, E. 2010, MNRAS, 407, 1529, doi: 10.1111/j.1365-2966.2010.17064.x
- Hu et al. (2022) Hu, H., Inayoshi, K., Haiman, Z., et al. 2022, ApJ, 935, 140, doi: 10.3847/1538-4357/ac7daa
- Ichikawa & Inayoshi (2017) Ichikawa, K., & Inayoshi, K. 2017, ApJ, 840, L9, doi: 10.3847/2041-8213/aa6e4b
- Inayoshi & Haiman (2016) Inayoshi, K., & Haiman, Z. 2016, ApJ, 828, 110, doi: 10.3847/0004-637X/828/2/110
- Inayoshi et al. (2022a) Inayoshi, K., Harikane, Y., Inoue, A. K., Li, W., & Ho, L. C. 2022a, ApJ, 938, L10, doi: 10.3847/2041-8213/ac9310
- Inayoshi et al. (2022b) Inayoshi, K., Nakatani, R., Toyouchi, D., et al. 2022b, ApJ, 927, 237, doi: 10.3847/1538-4357/ac4751
- Inayoshi et al. (2020) Inayoshi, K., Visbal, E., & Haiman, Z. 2020, ARA&A, 58, 27, doi: 10.1146/annurev-astro-120419-014455
- Izumi et al. (2019) Izumi, T., Onoue, M., Matsuoka, Y., et al. 2019, PASJ, 71, 111, doi: 10.1093/pasj/psz096
- Izumi et al. (2021) Izumi, T., Matsuoka, Y., Fujimoto, S., et al. 2021, ApJ, 914, 36, doi: 10.3847/1538-4357/abf6dc
- J. Li et al. (2022) J. Li, J., Silverman, J. D., Izumi, T., et al. 2022, ApJ, 931, L11, doi: 10.3847/2041-8213/ac6de8
- Jiang et al. (2016) Jiang, L., McGreer, I. D., Fan, X., et al. 2016, ApJ, 833, 222, doi: 10.3847/1538-4357/833/2/222
- Kelly & Shen (2013) Kelly, B. C., & Shen, Y. 2013, ApJ, 764, 45, doi: 10.1088/0004-637X/764/1/45
- Kim et al. (2018) Kim, J.-G., Kim, W.-T., & Ostriker, E. C. 2018, ApJ, 859, 68, doi: 10.3847/1538-4357/aabe27
- Kim & Im (2021) Kim, Y., & Im, M. 2021, ApJ, 910, L11, doi: 10.3847/2041-8213/abed58
- King (2016) King, A. 2016, MNRAS, 456, L109, doi: 10.1093/mnrasl/slv186
- Kocevski et al. (2023) Kocevski, D. D., Onoue, M., Inayoshi, K., et al. 2023, arXiv e-prints, arXiv:2302.00012. https://arxiv.org/abs/2302.00012
- Kormendy & Ho (2013) Kormendy, J., & Ho, L. C. 2013, ARA&A, 51, 511, doi: 10.1146/annurev-astro-082708-101811
- Larson et al. (2023) Larson, R. L., Finkelstein, S. L., Kocevski, D. D., et al. 2023, arXiv e-prints, arXiv:2303.08918, doi: 10.48550/arXiv.2303.08918
- Laureijs et al. (2011) Laureijs, R., Amiaux, J., Arduini, S., et al. 2011, arXiv e-prints, arXiv:1110.3193. https://arxiv.org/abs/1110.3193
- Li et al. (2022) Li, W., Inayoshi, K., Onoue, M., & Toyouchi, D. 2022, arXiv e-prints, arXiv:2210.02308. https://arxiv.org/abs/2210.02308
- Li et al. (2021) Li, W., Inayoshi, K., & Qiu, Y. 2021, ApJ, 917, 60, doi: 10.3847/1538-4357/ac0adc
- Li et al. (2012) Li, Y.-R., Wang, J.-M., & Ho, L. C. 2012, ApJ, 749, 187, doi: 10.1088/0004-637X/749/2/187
- Luo et al. (2016) Luo, J., Chen, L.-S., Duan, H.-Z., et al. 2016, Classical and Quantum Gravity, 33, 035010, doi: 10.1088/0264-9381/33/3/035010
- Lupi et al. (2021) Lupi, A., Haiman, Z., & Volonteri, M. 2021, MNRAS, 503, 5046, doi: 10.1093/mnras/stab692
- Maiolino et al. (2023) Maiolino, R., Scholtz, J., Witstok, J., et al. 2023, arXiv e-prints, arXiv:2305.12492, doi: 10.48550/arXiv.2305.12492
- Marconi et al. (2004) Marconi, A., Risaliti, G., Gilli, R., et al. 2004, MNRAS, 351, 169, doi: 10.1111/j.1365-2966.2004.07765.x
- Mason et al. (2023) Mason, C. A., Trenti, M., & Treu, T. 2023, MNRAS, 521, 497, doi: 10.1093/mnras/stad035
- Matsuoka et al. (2018) Matsuoka, Y., Strauss, M. A., Kashikawa, N., et al. 2018, ApJ, 869, 150, doi: 10.3847/1538-4357/aaee7a
- Matsuoka et al. (2023) Matsuoka, Y., Onoue, M., Iwasawa, K., et al. 2023, arXiv e-prints, arXiv:2305.11225, doi: 10.48550/arXiv.2305.11225
- McCaffrey et al. (2023) McCaffrey, J., Hardin, S., Wise, J., & Regan, J. 2023, arXiv e-prints, arXiv:2304.13755, doi: 10.48550/arXiv.2304.13755
- Mei et al. (2021) Mei, J., Bai, Y.-Z., Bao, J., et al. 2021, Progress of Theoretical and Experimental Physics, 2021, 05A107, doi: 10.1093/ptep/ptaa114
- Mortlock et al. (2011) Mortlock, D. J., Warren, S. J., Venemans, B. P., et al. 2011, Nature, 474, 616, doi: 10.1038/nature10159
- Murray et al. (2005) Murray, N., Quataert, E., & Thompson, T. A. 2005, ApJ, 618, 569, doi: 10.1086/426067
- Naidu et al. (2022) Naidu, R. P., Oesch, P. A., van Dokkum, P., et al. 2022, arXiv e-prints, arXiv:2207.09434. https://arxiv.org/abs/2207.09434
- Natarajan et al. (2017) Natarajan, P., Pacucci, F., Ferrara, A., et al. 2017, ApJ, 838, 117, doi: 10.3847/1538-4357/aa6330
- Neeleman et al. (2021) Neeleman, M., Novak, M., Venemans, B. P., et al. 2021, ApJ, 911, 141, doi: 10.3847/1538-4357/abe70f
- Neistein & Dekel (2008) Neistein, E., & Dekel, A. 2008, MNRAS, 383, 615, doi: 10.1111/j.1365-2966.2007.12570.x
- Ni et al. (2022) Ni, Y., Di Matteo, T., Bird, S., et al. 2022, MNRAS, 513, 670, doi: 10.1093/mnras/stac351
- Niida et al. (2020) Niida, M., Nagao, T., Ikeda, H., et al. 2020, ApJ, 904, 89, doi: 10.3847/1538-4357/abbe11
- Novak et al. (2011) Novak, G. S., Ostriker, J. P., & Ciotti, L. 2011, ApJ, 737, 26, doi: 10.1088/0004-637X/737/1/26
- Oesch et al. (2016) Oesch, P. A., Brammer, G., van Dokkum, P. G., et al. 2016, ApJ, 819, 129, doi: 10.3847/0004-637X/819/2/129
- Onoue et al. (2019) Onoue, M., Kashikawa, N., Matsuoka, Y., et al. 2019, ApJ, 880, 77, doi: 10.3847/1538-4357/ab29e9
- Onoue et al. (2023) Onoue, M., Inayoshi, K., Ding, X., et al. 2023, ApJ, 942, L17, doi: 10.3847/2041-8213/aca9d3
- Parsa et al. (2018) Parsa, S., Dunlop, J. S., & McLure, R. J. 2018, MNRAS, 474, 2904, doi: 10.1093/mnras/stx2887
- Planck Collaboration et al. (2016) Planck Collaboration, Ade, P. A. R., Aghanim, N., et al. 2016, A&A, 594, A13, doi: 10.1051/0004-6361/201525830
- Pringle (1991) Pringle, J. E. 1991, MNRAS, 248, 754, doi: 10.1093/mnras/248.4.754
- Reines & Volonteri (2015) Reines, A. E., & Volonteri, M. 2015, ApJ, 813, 82, doi: 10.1088/0004-637X/813/2/82
- Ricarte & Natarajan (2018) Ricarte, A., & Natarajan, P. 2018, MNRAS, 481, 3278, doi: 10.1093/mnras/sty2448
- Ruan et al. (2018) Ruan, W.-H., Guo, Z.-K., Cai, R.-G., & Zhang, Y.-Z. 2018, arXiv e-prints, arXiv:1807.09495, doi: 10.48550/arXiv.1807.09495
- Ruan et al. (2020) Ruan, W.-H., Liu, C., Guo, Z.-K., Wu, Y.-L., & Cai, R.-G. 2020, Nature Astronomy, 4, 108, doi: 10.1038/s41550-019-1008-4
- Salvaterra et al. (2012) Salvaterra, R., Haardt, F., Volonteri, M., & Moretti, A. 2012, A&A, 545, L6, doi: 10.1051/0004-6361/201219965
- Sassano et al. (2021) Sassano, F., Schneider, R., Valiante, R., et al. 2021, MNRAS, 506, 613, doi: 10.1093/mnras/stab1737
- Schindler et al. (2023) Schindler, J.-T., Bañados, E., Connor, T., et al. 2023, ApJ, 943, 67, doi: 10.3847/1538-4357/aca7ca
- Schneider et al. (2023) Schneider, R., Valiante, R., Trinca, A., Graziani, L., & Volonteri, M. 2023, arXiv e-prints, arXiv:2305.12504, doi: 10.48550/arXiv.2305.12504
- Schulze et al. (2015) Schulze, A., Bongiorno, A., Gavignaud, I., et al. 2015, MNRAS, 447, 2085, doi: 10.1093/mnras/stu2549
- Scoggins et al. (2023) Scoggins, M. T., Haiman, Z., & Wise, J. H. 2023, MNRAS, 519, 2155, doi: 10.1093/mnras/stac3715
- Shakura & Sunyaev (1973) Shakura, N. I., & Sunyaev, R. A. 1973, A&A, 24, 337
- Shankar et al. (2009) Shankar, F., Weinberg, D. H., & Miralda-Escudé, J. 2009, ApJ, 690, 20, doi: 10.1088/0004-637X/690/1/20
- Shen et al. (2020) Shen, X., Hopkins, P. F., Faucher-Giguère, C.-A., et al. 2020, MNRAS, 495, 3252, doi: 10.1093/mnras/staa1381
- Shen et al. (2023) Shen, X., Vogelsberger, M., Boylan-Kolchin, M., Tacchella, S., & Kannan, R. 2023, arXiv e-prints, arXiv:2305.05679, doi: 10.48550/arXiv.2305.05679
- Shen et al. (2011) Shen, Y., Richards, G. T., Strauss, M. A., et al. 2011, ApJS, 194, 45, doi: 10.1088/0067-0049/194/2/45
- Silk (2013) Silk, J. 2013, ApJ, 772, 112, doi: 10.1088/0004-637X/772/2/112
- Soltan (1982) Soltan, A. 1982, MNRAS, 200, 115
- Toyouchi et al. (2023) Toyouchi, D., Inayoshi, K., Li, W., Haiman, Z., & Kuiper, R. 2023, MNRAS, 518, 1601, doi: 10.1093/mnras/stac3191
- Treister et al. (2013) Treister, E., Schawinski, K., Volonteri, M., & Natarajan, P. 2013, ApJ, 778, 130, doi: 10.1088/0004-637X/778/2/130
- Trinca et al. (2022) Trinca, A., Schneider, R., Valiante, R., et al. 2022, MNRAS, 511, 616, doi: 10.1093/mnras/stac062
- Übler et al. (2023) Übler, H., Maiolino, R., Curtis-Lake, E., et al. 2023, arXiv e-prints, arXiv:2302.06647, doi: 10.48550/arXiv.2302.06647
- Ueda et al. (2014) Ueda, Y., Akiyama, M., Hasinger, G., Miyaji, T., & Watson, M. G. 2014, ApJ, 786, 104, doi: 10.1088/0004-637X/786/2/104
- Valentini et al. (2021) Valentini, M., Gallerani, S., & Ferrara, A. 2021, MNRAS, 507, 1, doi: 10.1093/mnras/stab1992
- Valiante et al. (2018) Valiante, R., Schneider, R., Zappacosta, L., et al. 2018, MNRAS, 476, 407, doi: 10.1093/mnras/sty213
- Venemans et al. (2017) Venemans, B. P., Walter, F., Decarli, R., et al. 2017, ApJ, 845, 154, doi: 10.3847/1538-4357/aa81cb
- Vestergaard et al. (2008) Vestergaard, M., Fan, X., Tremonti, C. A., Osmer, P. S., & Richards, G. T. 2008, ApJ, 674, L1, doi: 10.1086/528981
- Vestergaard & Peterson (2006) Vestergaard, M., & Peterson, B. M. 2006, ApJ, 641, 689, doi: 10.1086/500572
- Vika et al. (2009) Vika, M., Driver, S. P., Graham, A. W., & Liske, J. 2009, MNRAS, 400, 1451, doi: 10.1111/j.1365-2966.2009.15544.x
- Vito et al. (2018) Vito, F., Brandt, W. N., Yang, G., et al. 2018, MNRAS, 473, 2378, doi: 10.1093/mnras/stx2486
- Volonteri et al. (2021) Volonteri, M., Habouzit, M., & Colpi, M. 2021, Nature Reviews Physics, 3, 732, doi: 10.1038/s42254-021-00364-9
- Wang et al. (2019) Wang, F., Wang, R., Fan, X., et al. 2019, ApJ, 880, 2, doi: 10.3847/1538-4357/ab2717
- Wang et al. (2021) Wang, F., Yang, J., Fan, X., et al. 2021, ApJ, 907, L1, doi: 10.3847/2041-8213/abd8c6
- Wang et al. (2013) Wang, R., Wagg, J., Carilli, C. L., et al. 2013, ApJ, 773, 44, doi: 10.1088/0004-637X/773/1/44
- Watarai et al. (2000) Watarai, K.-y., Fukue, J., Takeuchi, M., & Mineshige, S. 2000, PASJ, 52, 133, doi: 10.1093/pasj/52.1.133
- Wechsler et al. (2002) Wechsler, R. H., Bullock, J. S., Primack, J. R., Kravtsov, A. V., & Dekel, A. 2002, ApJ, 568, 52, doi: 10.1086/338765
- Willott et al. (2010) Willott, C. J., Delorme, P., Reylé, C., et al. 2010, AJ, 139, 906, doi: 10.1088/0004-6256/139/3/906
- Wu et al. (2022) Wu, J., Shen, Y., Jiang, L., et al. 2022, MNRAS, 517, 2659, doi: 10.1093/mnras/stac2833
- Wu & Shen (2022) Wu, Q., & Shen, Y. 2022, ApJS, 263, 42, doi: 10.3847/1538-4365/ac9ead
- Wu et al. (2015) Wu, X.-B., Wang, F., Fan, X., et al. 2015, Nature, 518, 512, doi: 10.1038/nature14241
- Yang et al. (2020) Yang, J., Wang, F., Fan, X., et al. 2020, ApJ, 897, L14, doi: 10.3847/2041-8213/ab9c26
- Yang et al. (2023) Yang, J., Fan, X., Gupta, A., et al. 2023, arXiv e-prints, arXiv:2302.01777, doi: 10.48550/arXiv.2302.01777
- Yu et al. (2005) Yu, Q., Lu, Y., & Kauffmann, G. 2005, ApJ, 634, 901, doi: 10.1086/433166
- Yu & Tremaine (2002) Yu, Q., & Tremaine, S. 2002, MNRAS, 335, 965, doi: 10.1046/j.1365-8711.2002.05532.x
- Zhu et al. (2022) Zhu, Q., Li, Y., Li, Y., et al. 2022, MNRAS, 514, 5583, doi: 10.1093/mnras/stac1556