\ul
Problematic Advertising and its Disparate Exposure on Facebook
Abstract
Targeted advertising remains an important part of the free web browsing experience, where advertisers’ targeting and personalization algorithms together find the most relevant audience for millions of ads every day. However, given the wide use of advertising, this also enables using ads as a vehicle for problematic content, such as scams or clickbait. Recent work that explores people’s sentiments toward online ads, and the impacts of these ads on people’s online experiences, has found evidence that online ads can indeed be problematic. Further, there is the potential for personalization to aid the delivery of such ads, even when the advertiser targets with low specificity. In this paper, we study Facebook—one of the internet’s largest ad platforms—and investigate key gaps in our understanding of problematic online advertising: (a) What categories of ads do people find problematic? (b) Are there disparities in the distribution of problematic ads to viewers? and if so, (c) Who is responsible—advertisers or advertising platforms? To answer these questions, we empirically measure a diverse sample of user experiences with Facebook ads via a 3-month longitudinal panel. We categorize over 32,000 ads collected from this panel (); and survey participants’ sentiments toward their own ads to identify four categories of problematic ads. Statistically modeling the distribution of problematic ads across demographics, we find that older people and minority groups are especially likely to be shown such ads. Further, given that 22% of problematic ads had no specific targeting from advertisers, we infer that ad delivery algorithms (advertising platforms themselves) played a significant role in the biased distribution of these ads.
1 Introduction
Targeted advertising fuels a sizable part of the web’s economy today [21]. Behind the ads shown on digital platforms are complex marketplaces where advertisers compete for user attention, and advertising platforms such as Google, Facebook, and Twitter—capitalizing on user data—act as intermediaries. To identify the right audience for each ad, these platforms provide detailed targeting options to advertisers, as well as sophisticated personalization algorithms designed to find the most “relevant” audience. As a result, the ads that constitute a user’s everyday experience are determined by a confluence of factors: what time the user is browsing, which advertisers were trying to target them, and what content the platform’s personalization algorithm considers relevant to them. Further, due to the scale of these marketplaces, users run into ads on a vast variety of topics—ranging from neutral product ads, to opportunity ads for jobs and scholarships, and even to problematic clickbait ads and scams.
Given the wide variance in ads a user may potentially receive, it is important to consider whether some users’ overall ad experience might be worse than others. Prior work has illustrated the impact of harmful media [77, 87, 86, 13, 85, 66, 9], has theorized about the ways in which digital ads may harm users [51, 60, 69, 90, 63, 73, 34], and has asked users themselves to express why they find certain ads problematic [92]. However, a complete understanding on the online ad experiences of individual users, along with a breakdown of the kinds of ads different users find problematic, remains elusive.
In this paper, we build on prior work to systematically identify which categories of ads people perceive as problematic, evaluate if there are skews in the delivery of problematic categories of ads, and determine the roles of advertisers and personalization algorithms in the distribution of problematic ads. Thus, we aim to answer the following research questions:
-
RQ1:
What categories of ads are perceived as problematic?
-
RQ2:
Are there skews in the distribution of problematic ads?
-
RQ3:
Who is responsible for any observed skews?
To do so, we recruit a panel of paid participants, who we select across a variety of demographic categories. We longitudinally observe participants’ Facebook ad experiences over a period of three months, collecting the ads they receive, and the revealed targeting information for each ad. We choose Facebook as our platform of study because it is one of the largest and most data-rich personalized advertising platforms. We use a combination of (1) logged data and (2) quantitative surveys to measure our participants’ ad experiences. First, we instrument our participants’ web browsers to collect all Facebook ads they are shown in their desktop browsers, alongside the detailed targeting information Facebook provides for these ads. Second, using a combination of inductive qualitative coding, and deductive analysis of computational and social science research, as well as existing platform policies, we develop a codebook of ad categories, covering a variety of potentially problematic ad types. Using human raters, we then classify over 32,000 ads shown to our participants using this codebook. With this coded data, we regularly survey our participants to assess which types of ads—within the set of ads that they are shown by Facebook and which we annotated—they find problematic and why.
Using the collected data, we first examine the content that participants dislike (RQ1). We identify four categories of ads that participants find problematic (i.e., are disliked more than ads of any other category): deceptive ads, content that is prohibited by Facebook itself, clickbait, and ads considered sensitive by platform or government policy (e.g., ads for weight loss, gambling or alcohol).
We then statistically model the distribution of problematic ads across our panel (RQ2). Our results show that problematic content makes up a relatively small fraction of all ads our users see on Facebook—a median of 10%—but a subset of our panel is exposed to problematic ads over three times more often than the median participant. Looking at which participants tend to receive more problematic ads, we find that participants who are older are more likely to see deceptive and clickbait ads, and those who are Black are also more likely to see clickbait ads. Men are additionally more likely to see financial ads, a complex category that is (i) considered sensitive by U.S. regulation and Facebook policy, as it may include offers for exploitative financial products, (ii) disliked by participants more than neutral ads, but (iii) which also may include beneficial financial products.
Finally, we investigate the extent to which the advertisers and the platform personalization algorithms are responsible for these biases (RQ3).We find that certain categories of ads (e.g., opportunity ads and ads for sensitive topics) tend to be much more narrowly targeted than neutral ads, suggesting that advertisers carefully choose which users are eligible to see these ads. On the other hand, we identify a subset of ads that are not targeted at all (i.e., the advertisers make all adult U.S. users eligible to see the ad), and find that demographic skews still persist for ads across different problematic categories. Together, our results shed light on users’ overall ad experiences on a major platform, and illuminate disparities in those experiences caused by a combination of advertiser choices and platform algorithms.
2 Background and Related Work
Below, we provide background on targeted advertising, and discuss prior work on measuring skews in ad delivery, as well as users’ experiences with problematic digital advertising.
2.1 Online Advertising
Online advertising, and in particular, targeted advertising, supports much of the modern Internet’s business model. Targeting ads to particular users can be an effective way to show content to the most relevant audiences. However, the data used in targeting is privacy-sensitive (e.g., [84, 43, 53, 71]) and the targeting process can lead to discrimination (e.g., [81, 47]).
Platforms such as Facebook and Twitter rely on inferring user’s interests, and providing advertisers with an interface for these interests, to enable precise targeting of ads. In addition to interests and behaviors, they also enable targeting by demographics (e.g., age or gender); personally-identifiable information (e.g., users’ email addresses), often called “custom” audiences [25]; and even “lookalike” audiences that are able to expand a list of uploaded contacts by finding other users who have similar characteristics [26]. The delivery of targeted online ads can be broken into two phases [6]: ad targeting and ad delivery. In ad targeting, the advertiser uses the targeting features described above to define an eligible audience, and specifies the ad’s budget and optimization goal. In ad delivery, the platform must decide which users in the eligible audience are actually shown the ad (the actual audience). Historically, platforms used different auction mechanisms to make this selection [19], but today, platforms use sophisticated algorithms that try to subsidize ads that have high “relevance” to specific users [27].
Prior work has found that discriminatory digital advertising can result due to discriminatory targeting by advertisers [79, 45] and discriminatory delivery by platforms, even when the advertiser might not have intended it [6, 7, 72]. The latter can be the result of relevance algorithms significantly skewing the the actual audience such that this audience is very different from the eligible audience an advertiser intended to reach. As a result, Facebook in particular has implemented novel systems in response to legislative pressure [57] to minimize variance between eligible and actual audiences, in an effort to ensure fairer delivery of particular ads.
2.2 Problematic Media
Communication and psychology literature have long explored how traditional mass media (e.g., print, TV, radio) expose consumers to problematic content. Social science theories such as cultivation theory (how exposure to content may influence people’s thoughts and behaviors [67]) and agenda-setting theory (how content can be used to shape and filter a consumers’ reality [75]) posit ways in which harmful media can produce negative outcomes for consumers. Empirical observations under these frameworks include how violent media teaches violent behaviors (e.g., [77]); how bigoted media reinforces prejudice (e.g., [86, 13]); and how exposure to idealized body images can lead to body image issues (e.g., [85, 66, 9]). The ability to target mass media advertisements to specific audiences, however, is limited.
Online ads are another form of potentially problematic media. Investigating the potential for advertising to expose users to problematic content is particularly important, since ad platforms often self-regulate, and set their own policies to define which advertising content they do or do not allow on their sites [55, 38]. These policies are often updated at the platform’s discretion, or in response to the changing landscape of problematic content [11]. To enforce these policies on all types of content, platforms use a combination of automatic and manual approaches [42]. But despite policies and detection tools that aim to limit problematic content, ads that users find problematic still have a significant presence on popular sites [91] due to both policy inadequacies [61, 52] and technical challenges [74]. We investigate how the presence of ads, which are increasingly highly targeted to individual characteristics, may be problematic [58].
2.3 User Experiences with Problematic Ads
Users of online platforms have been shown to dislike ads in general [92, 37], with some employing tools like ad blockers to browse the web without the obstruction of ads [80]. Recent work has investigated why users dislike online ads; Zeng et al. develop a taxonomy on what users think are the worst qualities of ads [92], finding that people are particularly likely to dislike ads described as “deceptive," “clickbait,", “ugly," and “politicized." People struggle to identify deceptive ads [88], which can lead to harmful outcomes like software attacks [60, 89]. Those who suffer from certain mental health disorders or trauma may also experience negative psychological and physical consequences from ads that target these conditions [34].
Our contributions. We build on prior qualitative work by Zeng et al. [92], and use their taxonomy to assess people’s sentiments toward their own ads. We further use these sentiments, combined with rigorous coding, to identify novel categories of ads perceived, more specifically, as problematic. We also extend prior quantitative work, such as Ali et al. [6], and measure ad delivery’s role in creating disparities in exposure to problematic advertising. We further show ad delivery biases are not limited to ads created by researchers [6], and extend to real problematic ads on the platform. To our knowledge, ours is the first study to look at targeting and personalization of problematic ads to actual users.
3 Methodology
Below, we describe our methods for recruiting a diverse and demographically balanced panel and for collecting the desktop ads our participants are shown by Facebook.
3.1 Panel Recruitment
We recruited our panel of Facebook users from two sources: by listing tasks on Prolific, an online crowd-work and survey platform, and by advertising on Facebook.
Participants were screened via a short survey.111Prolific participants were compensated with a base pay of $8.04 per hour for completing the screening survey while those recruited via Facebook advertisements were not compensated for the screening survey as there is no mechanism to do so. Demographics which we initially struggled to recruit were offered marginally more compensation. The survey took a median of 6 minutes and 9 seconds to complete. Our criteria to be eligible for the study were that participants must (1) have an active Facebook account that (2) they use for at least 10 minutes per day (3) on a desktop or laptop computer (4) via either the Google Chrome or Mozilla Firefox browsers (5) without using ad blockers or tools for anonymous browsing (e.g., Tor). Additionally, we went to significant lengths to recruit a diverse panel across select demographic variables: race and ethnicity (white; Black; Hispanic; Asian), gender (men; women), age (younger than Generation X [18]; Generation X or older) and educational attainment (below a bachelor’s degree; bachelor’s degree and above). We sought to balance our panel among all combinations of our chosen demographic variables (e.g., representation for Generation X Hispanic women with high educational attainment) but we struggled with recruitment and retention of some demographics, partly due to the distribution of users who participate in online studies or use the platforms we recruited on [68, 82, 65]. We made a continuous effort to balance our sample by accepting participants on a rolling basis and not screening in those with demographics we were saturated with. Table 1 shows the ultimate demographic breakdown of our participants.
Unfortunately, while all participants were screened based on their Facebook usage, not all users contributed a significant number of ads during the 3 month study period. Of the 184 participants originally enrolled in the study, 132 were active participants, which we define as those who contributed at least 30 ads (on average 10 per month) over the course of the three months of their participation in the study.
| Variable | Value | Recruited | Active | Census | ||
| n | % | n | % | % | ||
| Gender | Female | 96 | 52.17 | 71 | 53.79 | 50.5 |
| Male | 86 | 46.74 | 59 | 44.70 | 49.5 | |
| Non-binary | 2 | 1.09 | 2 | 1.52 | – | |
| Age | Younger than Gen-X | 134 | 72.83 | 88 | 66.67 | 33.6 |
| Gen-X and older | 50 | 27.17 | 44 | 33.33 | 47.8 | |
| Race / Ethnicity | White | 105 | 57.07 | 82 | 62.12 | 75.8 |
| Latino/Hispanic | 21 | 11.41 | 16 | 12.12 | 18.9 | |
| Black | 53 | 28.80 | 32 | 24.24 | 13.6 | |
| Asian | 21 | 11.41 | 16 | 12.12 | 6.1 | |
| Other | 3 | 1.63 | 3 | 2.27 | – | |
| Education | Below Bachelor’s | 72 | 39.13 | 51 | 38.64 | 58.5 |
| Bachelor’s or above | 112 | 60.87 | 81 | 61.36 | 32.9 | |
| Total | 184 | 132 | ||||
3.2 Data Collection
Logged Data. Our study collected the ads that were shown to our participants on their Facebook news feeds while using Facebook on a desktop computer over a 3 month period. In order to collect our participants’ ads, we used a browser extension, based on the NYU Ad Observer project [29, 1]. We modified Ad Observer to include unique participant IDs along with the ads reported to our server, and we introduced an additional “Surveys” tab that serves participants monthly surveys to collect their sentiments for their individual ads. Across all of our recruited participants, we collected 165,556 impressions to 88,509 unique ads. Repeat impressions of ads are relatively sparse in our data—a median of twice per ad per participant—and only 5.33% of our ads are shown more than 3 times to a participant.
Targeting Data. We also collected ad targeting information provided by Facebook through its “Why am I seeing this?" API [32], which reveals information about how the advertiser selected their target audience [8]. While prior work has shown that Facebook’s targeting explanations can be incomplete, and include only one targeting criteria in each ad explanation [8], we find empirically that the system has changed since. We also observe differences between the summarized targeting data which is shown on the user interface, and what is reported through the API. Our data includes several instances of multiple targeting criteria—62.7% of ads in our data with interest targeting include more than one interest.
Survey Data. Every month, we prepared a survey that assesses participant sentiments toward the ads they saw on Facebook during the prior month. Specifically, for each ad that we showed to a user in the survey, we asked them: “Which of the following, if any, describe your reasons for disliking this ad?" and present the following non-mutually exclusive answer choices:
-
•
It is irrelevant to me, or does not contain interesting information.
-
•
I do not like the design of the ad.
-
•
It contains clickbait, sensationalized, or shocking content.
-
•
I do not trust this ad, it seems like a scam.
-
•
I dislike the advertiser.
-
•
I dislike the type of product being advertised.
-
•
I find the content uncomfortable, offensive, or repulsive.
-
•
I dislike the political nature of the ad.
-
•
I find the ad pushy or it causes me to feel anxious.
-
•
I cannot tell what is being advertised.
-
•
I do not dislike this ad.
We then ask: “Which of the following, if any, describe your reasons for liking this ad?" and present the following non-mutually exclusive answer choices:
-
•
The content is engaging, clever or amusing.
-
•
It is well designed or eye-catching.
-
•
I am interested in what is being advertised.
-
•
It is clear what product the ad is selling.
-
•
I trust the ad, it looks authentic or trustworthy.
-
•
I trust the advertiser.
-
•
It is useful, interesting, or informative.
-
•
It clearly looks like an ad and can be filtered out.
-
•
I do not like this ad.
Answer choices for these questions are drawn from Zeng et al.’s taxonomy of reasons for users’ like or dislike of ads [92], with the exception of one item. In a small pilot version of this survey, in which we allowed participants to also provide free-text answers of their reasons for liking and disliking Facebook ads with 300 respondents, we identified an additional reason for liking an ad, “This ad is filterable”, so we included it to capture a broader spectrum of reasons users like ads.
We survey participants about at most 5 ads from each of our seven ad categories (Section 4). We limit the monthly surveys to up to 35 ads each so that it did not become prohibitively long (more than 20 minutes) for participants to complete.
Study Deployment. We began data collection in November 2021, with participants recruited on a rolling basis. Each participant was a part of our study for three months. The final participant completed the study in September 2022. We compensated our participants by paying them up to $60: $5 when they signed up, $15 for each month they kept the plugin installed and completed the monthly sentiment survey, and upon completing all three months of the study, they were rewarded with a $10 bonus payment. Those participants who dropped out of our study were compensated using the scheme above based on how long they did participate. Since we deployed surveys directly through our extension, we were not able to assess average time of completion, but pilot tests of the survey averaged a completion time of about 15 minutes.
3.3 Analysis
Here, we describe the quantitative methods we employ to analyze survey responses, logged ad observations, and ad targeting data. We limit all our analyses to the 32,587 ads that we annotated (see Section 4), and to our list of active participants (Table 1).
RQ1. For survey responses, we use Chi-squared () tests for equality of proportions to compare rates of ad dislike. We also report Cohen’s as the effect size of the Chi-squared tests to characterize the scale of differences. As a general guideline, is considered a small effect, 0.3 is a medium effect, and 0.5 and above is considered a large effect [15]. We examine the association between the reasons for dislike mentioned in the surveys and the ad type through mixed-effects logistic regression models. To control for variance in participants’ individual preferences, we include a random effect term for each participant. In line with statistical best practice [36], we do not correct our regression models as each model represents a purely complementary comparison (e.g., contains a distinct dependent variable).
RQ2. To understand disparities in the distribution of ad types, we treat number of ad types observed for each participant as a frequency distribution. To quantify inequality in this distribution, we compute skewness [3], a measure of asymmetry for a probability distribution, computed via its third standardized moment. A positive skew implies a distribution with a long right tail, while a negative skew means the left tail is longer. We also compute the Gini coefficient [2] to measure inequalities across participants. To understand inequities between demographic groups, we use linear regression models to model the fraction of each ad category in participants’ ad diet, as a function of their demographics.
RQ3. To disentangle ad delivery’s influence from ad targeting in our observations, we use the advertising interface to obtain audience size estimates for each ad. Concretely, we query Facebook’s advertising API for monthly “reach” estimates for the targeting specifications of every ad in our dataset. Note that these estimates are not accessible for ads that use Custom Audiences (CAs), such as phone number uploads or cookie re-targeting; those are only known to the owners of these CAs. We use linear regressions similar to RQ2 to identify differences between demographic groups that appear due to the platform’s ad delivery practices.
3.4 Ethics
Given the sensitivity of the data we were collecting, we took care to follow best practices, maximizing beneficence while minimizing harm to our participating users and Facebook itself. First, our research project was approved by our institution’s Institutional Review Board (IRB). Second, we collected the minimal data on our participating users necessary to conduct the study; we only collected personally-identifiable information where necessary to facilitate payments, and we used unique, random identifiers for all survey responses and ads collected. Third, we controlled access to the uploaded pseudonymous data to just the research team, and we do not plan on making this data generally available to protect the privacy of our users. Finally, we minimized the harm to advertisers and Facebook itself by not causing any ad impressions that would not have otherwise occurred; the only additional requests to Facebook were to fetch the targeting specifications, and to later retrieve audience sizes of these specifications.
While Facebook prohibits collection of data using automated means in its terms of service (ToS), we argue that the public benefits of our work outweigh the risks posed to Facebook. Further, violating ToS by scraping content that is otherwise available through non-automated means is not considered a violation of the U.S. Computer Fraud and Abuse Act [4]. Platforms, however, reserve the right to ban users who scrape or have done so in the past.
4 Categorizing ads
In order to evaluate whether there are inequities in participants’ exposure to problematic ads, we first evaluate which of our collected ads are problematic. To do so, we develop a codebook to categorize the ads our participants see, and then use that codebook to annotate a significant subset of their ads.
4.1 Creating the codebook
We use a combination of inductive qualitative coding [83, 14], and deductive analysis [10] of prior work and platform policies to develop a robust categorization of participant ads.
To create our initial inductive categorization of Facebook ads, we conducted pilot data collection with 7 participants, collecting their ads with our browser extension between June and July 2021. We then cross-referenced our initial codebook with platform and governmental policies and empirical research to develop our final ad categories. Our categorization particularly focuses on capturing problematic ads, though we also make sure our codebook captures content that users might find unproblematic, such as products, events, or local businesses. Below, we define our categories, describe how we reason about them, and provide examples from our dataset.
Deceptive: Fraudulent offers, potential scams, false or misleading claims, predatory business practices. Examples: Guaranteed monthly income, sign-up flows for personal information (“clickfunnels”), non-descript offers with requests for direct messages.
Deceptive advertising and its breadth is notoriously hard to capture (see, e.g., a review of definitions [33] and a diversity of FTC reports on the subject [16]). Therefore we define this code broadly, to be able to capture multiple forms of deceptive and scam content. We categorize financial and personal information scams, fraudulent offers, and a diverse array of misleading content as Deceptive. Many aspects that we cover in this definition are covered by Facebook’s policies for unacceptable business practices [23], unrealistic outcomes [24], and broadly under the platform’s deceptive content policy [28]. Prior work has documented deceptive ads in contexts such as malicious web advertising [51], social engineering attacks [60], and distributing malware [69, 90].
Clickbait: Ads that omit information to entice users, are unclear about the advertised product, or contain sensational, loud, or dense content. Examples: Provocative news headlines, celebrity gossip, incomplete offers (“Click to find out”).
Prior work has documented how clickbait ads are attention grabbing by being unclear, and do not live up to users’ expectations [92, 64]. It has also been found to waste users’ time [73], contain provocative content [63], and act as a vehicle for misinformation [63, 35, 93]. Facebook’s policies also recognize the misleading and annoying nature of clickbait, and they enforce policies to reduce exposure to such content [56, 31].
Potentially Prohibited: Ads that may not be allowed on the platform according to Facebook’s prohibited content policies. Examples: Tobacco, drugs, unsafe dietary supplements, multi-level marketing, weapons.
Facebook’s policies prohibit several types of ads [28], including but not limited to ads for tobacco, adult content, body parts, payday loans, and multi-level marketing. Ads that pose a security threat to users, such as spyware or malware, non-functional landing pages, and efforts circumventing review systems, are also prohibited [55]. Even with an extensive policy, Facebook’s ability to accurately detect content and enforce policies is limited (see, e.g., prior work documenting challenges in detection and enforcement of political advertising policies [20, 49]). We therefore code for ads whose content match any of Facebook’s prohibitive policies. We note that only Facebook can enforce these policies – therefore we refer to our annotations as potentially prohibited.
Sensitive: Ads that fall under Facebook’s content-specific restrictions policy [28]: such content isn’t prohibited but, given its sensitive nature, it must comply with additional guidelines, including written permissions and certifications. Examples – Sensitive: Financial: Credit cards, loans, mortgage financing. Examples – Sensitive: Other: Weight loss programs, online mental health prescription services, online slot machines.
Facebook subjects ads for sensitive topics to additional scrutiny on their content and targeting practices [28]. For example, ads for weight loss programs can only be targeted to people at least 18 years or older, financial advertisers must provide authorization by regulatory authorities, and online pharmacies require an additional certification [22]. Within Sensitive ads, we find an increased prevalence (more than two-thirds) for Financial ads, so we break this code into two sub-codes — Sensitive: Financial and Sensitive: Other.
In addition to platform policies, sensitive ads closely relate to prior work on content that targets user’s vulnerabilities [34, 62] — such content may be benign to some users but may foster negative thoughts or behaviors for others [58, 40]. Gak et al. [34], for instance, found that among people with a history of unhealthy body stigmatization, dieting, or eating disorders, being targeted with weight-loss-related ads had negative emotional and physical outcomes.
Opportunity: Ads that present any employment, housing, or educational opportunity to users. Examples: Degree programs, jobs or gig-work, fellowships, scholarships.
We coded for ads that displayed opportunities for users, such as a job or gig, higher education, or apartments and homes for sale. Facebook’s own policies prohibit discrimination in targeting of opportunities, or advertising fraudulent or misleading opportunities [30]. Further, cases of discrimination in the delivery of online opportunity ads [17, 45, 6] led us to code these ads to examine their distribution among our participants.
Healthcare: Ads that contain products, services or messages related to healthcare, fitness, mental and physical wellness. Examples: Medical devices, gym equipment, public health announcements, fitness programs, health insurance.
We find a wide array of healthcare-related ads that are broader than the content covered by Facebook’s content-specific restrictions (Sensitive), and we use a separate code to capture such content. These ads are diverse in nature, ranging from helpful to possibly problematic.
Political: Ads that contain any overt references to political subject matters. Examples: Political campaign ads, petitions for political causes.
While we initially coded for political ads, we exclude them from our analysis. We consider ads for political content to be outside of our scope for this study due to challenges in measuring user perceptions of political ads [78]; further, problematic content [93], delivery [7] and policy [49] surrounding political ads are well-addressed in recent prior work.
Neutral: Every-day products, services or apolitical news. Examples: Sales, product deals, local events. Further, ads not classified as any of the other categories are considered neutral.
The prevalence of each category in our annotated data is shown in Table 2. Figure A2 also shows concrete examples of each category. We leave a small fraction of ads (122, 0.41%) in our dataset uncategorized because they do not fit into our codebook, but are also not benign; often, these are potentially deceptive offers which we are unable to verify. Since some of our participants are recruited from Facebook, we observe an increased prevalence of research-study-related ads (2558, 7.85%). We use an auxiliary code “Study” to annotate all such ads, and remove them from all subsequent analyses.
In our annotation, we allowed for double-coding when an ad fell into two or more categories (e.g., an unclear ad for “5 Steps My Clients Use to Overcome Anxiety” falls into both Healthcare and Clickbait). However, we do not allow multiple codes when an ad is categorized as Neutral.
| Code | Count | % |
| Neutral | 20,596 | 68.52 |
| Healthcare | 3564 | 11.86 |
| Opportunity | 2267 | 7.54 |
| Sensitive: Financial | 1429 | 4.75 |
| Sensitive: Other | 631 | 2.10 |
| Clickbait | 1182 | 3.93 |
| Deceptive | 542 | 1.80 |
| Potentially Prohibited | 253 | 0.84 |
| Political | 263 | 0.87 |
4.2 Coding ads
Across all of our recruited participants, we collected 165,556 impressions to 88,509 unique ads. Out of these, 83,507 (94.3%) ads and 156,213 (94.3%) impressions were contributed by the participants ultimately deemed active (and considered in the remainder of the study). Due to the high volume of ads, we annotated a random subset of up to 200 ads per participant per month. Since we repeated this sampling strategy every month for each participant, we avoid introducing time- or participant-related sampling biases to the subset of our data we annotated. Through this sampling process, we were able to annotate 32,587 out of our collected 88,509 ads, or 36.8% of them.
The authors annotated the first two months of data. For the remaining months, we hired two students from our institute as external annotators. We choose to hire annotators locally instead of crowd-workers to be able to train them to use our codebook properly and communicate in case of errors. The annotators were shown the ad’s text and a screenshot of the ad (e.g. Figure A2) during annotation tasks.
Since our annotation task consists of multiple labels and we consider agreement for more than two annotators, we use Krippendorf’s Alpha with the Jaccard set distance function to evaluate agreement between annotators. External annotators were first trained to use the codebook on a pilot task using the authors’ gold standard annotations. Subsequently, every month, we picked a 5% subset of the month’s ads to overlap across both annotators and the first author. If agreement on this common subset was low ( 0.70), we went over discrepancies and re-calibrated our use of the codebook. We repeated this exercise each month to ensure annotation quality remained high. The final agreement on our annotated data, , is considered ‘substantial’ [48].
We specifically avoided using machine learning to avoid mis-labeling points in our data. Deceptive content, in particular, requires a level of investigation that would not be possible with automation. To investigate whether an ad is indeed deceptive, annotators are asked to visit the advertised web page, look at the advertiser’s Facebook page, and inspect reviews on Facebook and Better Business Bureau.
Post-processing. Finally, while we annotate multiple codes per ad for a richly described dataset, we post-process our coding to translate into one code per ad. We do this for easier interpretation of the following results (Section 5), particularly in regression analyses. In line with the severity of restrictions in Facebook’s policies [28], we translate sets of codes to a single code in the following precedence order:
Potentially Prohibited Deceptive Clickbait Sensitive Opportunity Healthcare Neutral.
5 Results
We now summarize our study’s results. Section 5.1 identifies which categories of ads participants find problematic (RQ1). Section 5.2 investigates the distribution of problematic ads (RQ2). Section 5.3 examines the reasons for the discovered discrepancies (RQ3).
5.1 What do participants find problematic?
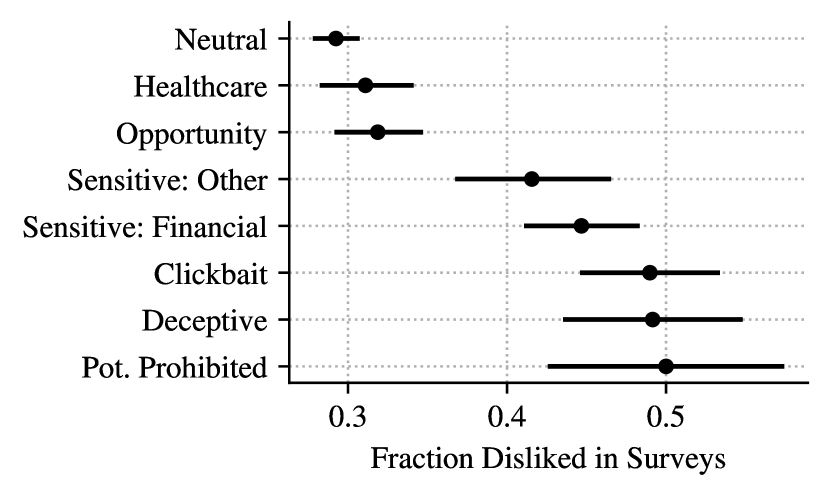
To evaluate whether our participants found certain ad categories problematic, we first examine general dislike: whether participants dislike a higher fraction of particular ads. We then evaluate reasons for disliking: whether participants have different reasons for disliking each category in our codebook. Specifically, to evaluate general dislike, we use proportion tests to evaluate differences in the proportion of ads in each category that participants marked as “I do not like this ad” in the second question of our survey (Section 3.2).
Figure 1 shows the fraction of responses, for each category, that were disliked by participants. Across our surveys, participants reported disliking nearly half of the ads we had classified as Clickbait (48.98%), Deceptive (49.16%), and Potentially Prohibited (50%). Participants reported disliking 43.58% of the ads we coded as Sensitive, while Neutral, Healthcare and Opportunity ads were disliked less: 29.24%, 31.09%, and 31.87%, respectively.
| Dislike Reason | Odds Ratio [95% CI] | |||||||
| Pot. Prohibited | Deceptive | Clickbait | Sensitive: Financial | Sensitive: Other | Problematic | Opportunity | Healthcare | |
| intercept | 0.03∗∗∗ [0.02, 0.06] | 0.036∗∗∗ [0.02, 0.07] | 0.103∗∗∗ [0.07, 0.16] | 0.16∗∗∗ [0.11, 0.24] | 0.052∗∗∗ [0.03, 0.09] | 0.403∗∗∗ [0.29, 0.55] | 0.236∗∗∗ [0.17, 0.32] | 0.231∗∗∗ [0.17, 0.32] |
| advertiser | 0.438 [0.16, 1.21] | 0.701 [0.36, 1.37] | 0.937 [0.55, 1.6] | 0.679 [0.4, 1.14] | 2.101∗∗ [1.22, 3.63] | 0.99 [0.71, 1.39] | 1.437 [0.95, 2.17] | 1.098 [0.69, 1.76] |
| clickbait | 0.657 [0.27, 1.58] | 2.465∗∗ [1.37, 4.43] | 1.983∗∗ [1.26, 3.13] | 0.93 [0.58, 1.5] | 1.265 [0.69, 2.32] | 1.472∗ [1.07, 2.03] | 1.124 [0.74, 1.7] | 0.721 [0.44, 1.18] |
| design | 0.734 [0.36, 1.49] | 1.098 [0.58, 2.08] | 0.935 [0.58, 1.5] | 0.743 [0.48, 1.15] | 1.168 [0.67, 2.05] | 0.884 [0.65, 1.2] | 1.175 [0.81, 1.71] | 1.091 [0.73, 1.62] |
| irrelevant | 1.677 [0.99, 2.85] | 1.071 [0.68, 1.69] | 1.043 [0.74, 1.48] | 1.574∗∗ [1.15, 2.16] | 1.327 [0.87, 2.02] | 1.34∗ [1.07, 1.68] | 1.406∗ [1.05, 1.87] | 1.23 [0.91, 1.67] |
| politicized | 2.754 [0.91, 8.37] | 1.759 [0.61, 5.04] | 1.359 [0.59, 3.16] | 0.78 [0.3, 2.02] | 0.15 [0.02, 1.27] | 1.128 [0.62, 2.05] | 0.818 [0.38, 1.75] | 1.797 [0.85, 3.78] |
| product | 0.832 [0.41, 1.7] | 0.954 [0.56, 1.64] | 1.078 [0.68, 1.7] | 0.997 [0.66, 1.52] | 1.734∗ [1.05, 2.88] | 1.048 [0.78, 1.4] | 0.987 [0.67, 1.45] | 0.705 [0.45, 1.09] |
| pushy | 0.747 [0.28, 1.97] | 1.209 [0.6, 2.45] | 0.682 [0.37, 1.26] | 1.367 [0.83, 2.26] | 0.499 [0.22, 1.16] | 1.008 [0.7, 1.46] | 0.572∗ [0.34, 0.95] | 1.505 [0.96, 2.36] |
| scam | 1.749 [0.98, 3.12] | 1.972∗∗ [1.21, 3.21] | 1.473∗ [1.01, 2.14] | 1.45∗ [1.03, 2.05] | 2.078∗∗ [1.34, 3.21] | 1.643∗∗∗ [1.28, 2.1] | 1.314 [0.96, 1.8] | 0.894 [0.63, 1.28] |
| unclear | 1.891∗ [1.02, 3.5] | 0.566 [0.29, 1.12] | 1.387 [0.91, 2.11] | 1.109 [0.75, 1.64] | 0.798 [0.46, 1.38] | 1.137 [0.86, 1.51] | 0.55∗∗ [0.37, 0.81] | 0.592∗ [0.39, 0.9] |
| uncomfortable | 1.603 [0.59, 4.39] | 0.798 [0.33, 1.95] | 1.382 [0.71, 2.69] | 0.491 [0.22, 1.12] | 0.642 [0.23, 1.82] | 0.915 [0.56, 1.48] | 1.274 [0.72, 2.26] | 0.631 [0.3, 1.33] |
| 1152 | 1213 | 1308 | 1386 | 1227 | 2018 | 1408 | 1359 | |
These differences across ad categories are significant (, omnibus ; ). In a series of pair-wise proportion tests comparing each of our coded categories with Neutral, with Benjamini & Hochberg correction [12], we observe that Potentially Prohibited, Deceptive, Clickbait, and both types of Sensitive ads (Financial and Other) are all disliked significantly more than Neutral ads (, ; ). Opportunity (, ; ) and Healthcare (, ; ) ads, on the other hand, are not significantly more or less disliked than Neutral ads. To identify whether any of the ad categories are disliked more than each other (rather than just more than Neutral) we conduct an additional series of pair-wise corrected tests, comparing differences between sequential ad categories (e.g., comparing Potentially Prohibited, the most disliked category, with Deceptive, the next most disliked). This testing finds only one significant difference, between Sensitive: Other and Opportunity (, ; ). In combination, our statistical results suggest that Clickbait, Deceptive, Potentially Prohibited, and Sensitive ads form an equivalence class of potentially problematic ads.
To understand why participants dislike these ad categories, we investigate the specific reasons they reported for disliking in the first survey question. Table 3 shows the odds ratios (exponentiated regression coefficients) of eight mixed-effects logistic regression models, with a random intercept for the participant. The odds ratios (O.R.) give the relative odds that an ad category was described with a certain dislike reason in survey responses, compared to the same dislike reason for our baseline (Neutral). For each ad category (column), an O.R. of 1 means a given dislike reason (row) is not used to describe the ad category more often than Neutral. Values greater than 1 correspond to increased odds of participants describing that ad category with the given reason, while values less than 1 indicate lower odds.
We first observe in Table 3 that participants are significantly more likely to describe the combined most highly disliked ad categories (“Problematic” column) as irrelevant (O.R. = 1.34, ), clickbait (O.R. = 1.47, ) and scam (O.R. = 1.64, ). Looking at the disliked categories individually, we find that Deceptive, Clickbait and Sensitive ads are also significantly more likely to be described as scams (all O.R. 1.45, ). The odds of Sensitive: Other ads, in particular, being described as scams are more than twice the odds of Neutral ads being described as scams (O.R. = 2.08, ). Also for these ads, participants’ odds of disliking the advertiser (O.R. = 2.10, ) or product (O.R. = 1.73, ) are significantly higher. Further, respondents find Potentially Prohibited ads to be unclear in their description (O.R. = 1.89, ). Finally, our results find evidence that participants recognize the clickbait nature of the ads we categorize as Clickbait (O.R. = 1.98, ), as well as those we categorize as more broadly Deceptive (O.R. = 2.46, ), the latter of which are likely to use attention-grabbing content to lure people to click [44, 70].
Comparatively, the odds of Opportunity and Healthcare ads being described by participants as unclear are lower than the odds of a Neutral (all O.R. 0.55, ). We also note that Opportunity ads, despite having higher odds of being described as irrelevant (O.R. = 1.4, ), have lower odds of being described as pushy than Neutral ads.
Overall, we find differences in both rates of dislike, and reasons for disliking across our defined ad categories. Potentially Prohibited, Deceptive, Clickbait, and Sensitive ads are found to be disliked at a higher rate than other categories, and for more severe reasons beyond irrelevance: participants recognize their clickbait-y and scammy nature; dislike the sensitive products they advertise and the advertisers selling those products; and find them unclear, potentially due to advertisers evading platform prohibitions. As such, for the remainder of this paper we refer to the collection of these four ad categories as Problematic.
5.2 How are Problematic ads distributed?
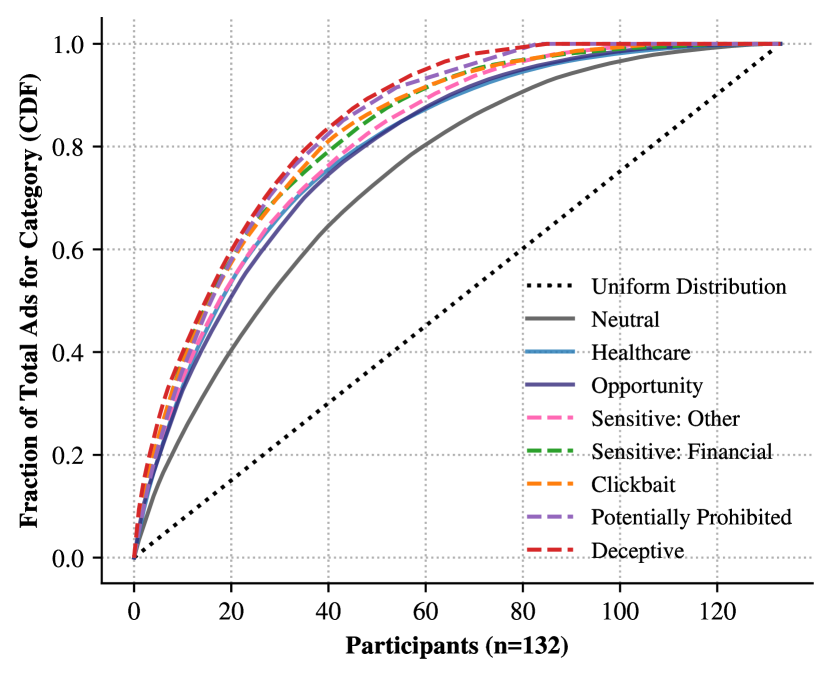
To understand how each ad category is distributed over our panel, we investigate the skew in its distribution over our participants: Figure 2 shows a cumulative distribution function (CDF) for all ads in each category. We also employ the Gini coefficient to precisely quantify this inequality. While highly recurrent impressions of ads are relatively sparse in our data—a median of two impressions per ad per participant—we account for the frequency of impressions in this analysis as well.
First, we observe that Neutral ads are not uniformly distributed, as observed by the distance from a uniform distribution. Because of this inherent skew in ad distribution, we treat Neutral (Gini = 0.48) as the baseline for comparison. Second, we see that Healthcare (Gini = 0.60) and Opportunity (Gini = 0.59) ads are more skewed (i.e., less uniformly distributed) than Neutral. This may be because Healthcare and Opportunity ads focus on narrower themes, and may be more personalized to users by advertisers or the platform. Third, we find that all five Problematic categories are more skewed across participants than Neutral. In these categories, we note the following order from least to most skewed: Sensitive: Other (Gini = 0.62), Sensitive: Financial (0.65), Clickbait (0.66), Potentially Prohibited (0.67), and Deceptive (0.69). To offer a concrete example of this skew: 80% of the Deceptive ad impressions (0.8 on -axis) are delivered to just 36 participants (-axis), compared to Healthcare, where the same fraction of impressions are delivered to 47 participants (or 60 participants in the case of Neutral).
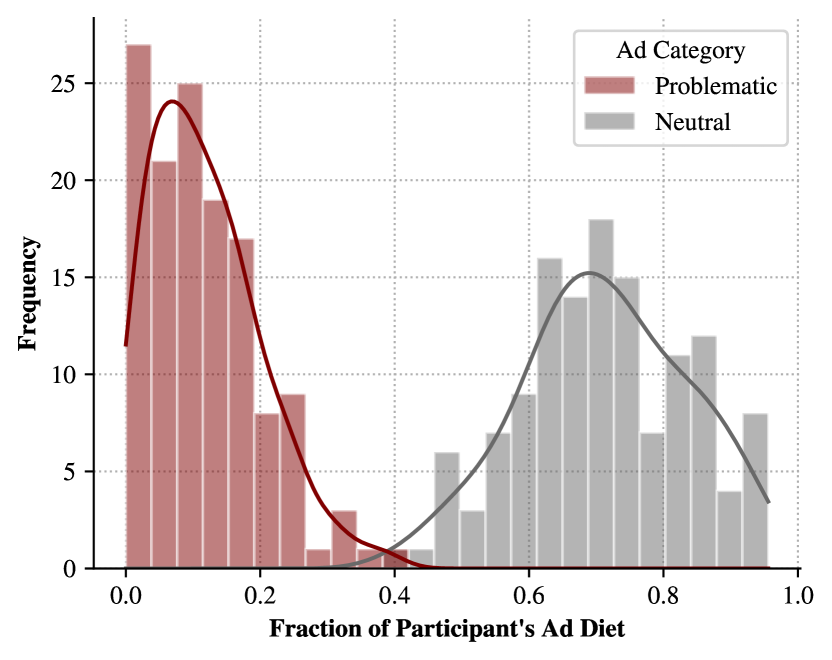
Next, we focus on how individual-level exposure to Problematic ads vary for our participants. First, we note that data contributions themselves are inherently skewed, since participants have varying rates of Facebook use. To control for these differences, we look at the fraction of every participant’s ad diet, i.e., all ads seen by them during the study, that consisted of Neutral vs. Problematic categories. Figure 3 shows the frequency distribution of these fractions across our panel.
We first observe that on average, a higher fraction of our panel’s ad diet is composed of Neutral ads (, ), compared to Problematic (, ). Confirming our findings in the prior section, the distribution of Problematic has a heavier tail, suggesting that certain participants in our panel have increased exposure to these ads compared to the average. This observation is supported by measuring the skewness of these distributions, a statistical measure of asymmetry of a probability distribution. Recall that positive skew implies a distribution has a long right tail, while a negative skew means the left tail is longer. We measure the skewness for Neutral in Figure 3as -0.11, and for Problematic as 0.84. These differences imply that despite the average exposure to Neutral ads in our panel being 71%, certain participants exist at the long left tail of this distribution, who are shown fewer Neutral ads, and a higher fraction of Problematic ads.
| Variable | Estimate () [95% CI] | |||||
| Problematic | Pot. Prohibited | Deceptive | Clickbait | Sensitive: Financial | Sensitive: Other | |
| Intercept | 0.12∗∗∗ [0.09, 0.15] | 0.01∗∗∗ [0.01, 0.01] | 0.008 [0, 0.02] | 0.012 [0, 0.02] | 0.07∗∗∗ [0.04, 0.1] | 0.02∗∗ [0.01, 0.03] |
| Gender: Woman | -0.064∗∗∗ [-0.09, -0.04] | -0.002 [0, 0] | -0.005 [-0.01, 0] | -0.008 [-0.02, 0] | -0.045∗∗∗ [-0.07, -0.02] | -0.004 [-0.02, 0.01] |
| Race: Black | 0.025 [-0.01, 0.06] | -0.001 [0, 0] | 0.006 [0, 0.02] | 0.013∗ [0, 0.02] | 0.004 [-0.02, 0.03] | 0.002 [-0.01, 0.02] |
| Race: Asian | -0.002 [-0.04, 0.04] | 0.001 [0, 0.01] | -0.003 [-0.02, 0.01] | 0.005 [-0.01, 0.02] | -0.007 [-0.04, 0.03] | 0.002 [-0.02, 0.02] |
| Ethnicity: Hispanic | 0.023 [-0.03, 0.08] | -0.007∗ [-0.01, 0] | 0.005 [-0.01, 0.02] | -0.007 [-0.03, 0.01] | 0.036 [-0.01, 0.08] | -0.003 [-0.02, 0.02] |
| Education: college and above | 0.01 [-0.02, 0.04] | -0.002 [0, 0] | 0.004 [-0.01, 0.01] | 0.01 [0, 0.02] | -0.003 [-0.03, 0.02] | 0 [-0.01, 0.01] |
| Age: Gen-X and older | 0.051∗∗∗ [0.02, 0.08] | -0.003∗ [-0.01, 0] | 0.011∗ [0, 0.02] | 0.017∗∗ [0.01, 0.03] | 0.017 [-0.01, 0.04] | 0.009 [0, 0.02] |
; , .
We next examine these participants who are shown a higher fraction of Problematic ads. Specifically, we investigate whether for any particular demographic groups, the Problematic ads constitute a higher fraction of ad diets. Table 4 shows coefficients of six linear models that we build to examine the relationship between participant demographics and fraction of Problematic ads among the ads they encountered. The intercept shows the average fraction in the ad diets of participants for whom all independent demographic variables are false, i.e., white, non-Hispanic men, born in 1980 or after, without a college degree. The proportion of these participants’ ad diets that is composed of Problematic ads is 12% (first column in Table 4). All statistically significant coefficients in the table mark biases in comparison to that baseline.
We find that the ad diets of older participants, born before 1980, are (additively) composed of 5.1% more Problematic ads (CI: 2-8%) than younger participants. Women’s ad diets are composed of 6.4% fewer Problematic ads (CI: 4-9%) than those who do not identify as women—largely because women see 4.5% fewer Sensitive: Financial ads (CI: 2-7%). We also note that older participants’ ad diets are composed of higher fractions of Deceptive (1.1%, CI: 0-2%), and Clickbait ads (1.3%, CI: 1-3%). Ad diets of Black participants contain 1.3% (CI: 0-2%) more Clickbait ads than those of white or Asian participants in our panel. However, older participants and Hispanic participants ad diets have slightly lower fraction of Potentially Prohibited ads, 0.3% (CI: 0-1%) and 0.7% (CI: 0-1%) respectively, potentially because these ads target products assumed by advertisers or the platforms not to be of interest to these groups. To account for possible variance in participants’ privacy behavior (e.g. changing ad preferences), we model their awareness of privacy settings as an additional independent variable in Table A1. We find that privacy awareness does not have any significant effect on the disparate exposure that we observe, and demographic skews similar to those in Table 4 persist. Demographic skews for other ad categories are also shown in Table A1.
5.3 Who is responsible for skews?
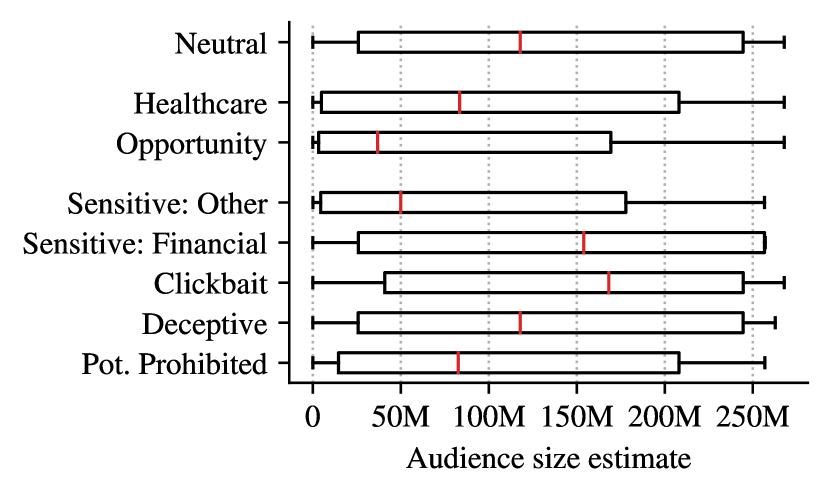
With a better understanding of which participants have increased exposure to problematic ads, we next identify the reasons behind these differences. As discussed in Section 2, whether a particular user sees an ad on Facebook is affected by two main factors: (a) the user has to be among the audience targeted by the advertiser; (b) Facebook’s ad delivery optimization considers the ad relevant to the user, which contributes to it winning an auction [27]. Thus, one can expect that when the advertiser targets a larger audience, the delivery optimization has more influence in selecting the actual audience. With this intuition, we start by investigating audience size across our ad categories.

As described in Section 3.3, we query Facebook’s APIs to obtain audience sizes for each of our collected ads— Figure 4 shows the distributions of these audience sizes broken down by ad category. Observing Problematic categories, we find that the median target audience sizes for Sensitive: Financial (153.9M) and Clickbait (168.2M) ads are larger than for Neutral ads (117.9M); a pairwise Kruskal-Wallis [46] test rejected the null hypothesis that the medians are equal ( for both tests). This implies that Facebook exercises more control for picking the audience subset for these categories. On the other hand, median audience sizes for Potentially Prohibited (82.6M) and Sensitive: Other (49.9M) ads are significantly smaller than Neutral ( and , respectively), indicating that advertisers for these ads more precisely specify the audiences they want to reach. We also note that audience sizes for Opportunity (36.8M) and Healthcare (83.4M), considered non-problematic in this study, are actually smaller than Neutral ().
Next, we investigate what targeting options advertisers use to scope these various audiences. We find that the most used targeting option is age: nearly half the ads use some form of age targeting (49.7%). Around a quarter of ads use Custom Audiences [25] (25.6%) and platform-inferred user interests (26.9%); On the other hand, advertisers for 21.2% of the ads in our dataset don’t change the targeting criteria at all, and use the default targeting of all U.S. adults (267 million users). Finally, we find that only 12.1% ads in our data specifically target by gender; a vast majority use the default option of targeting all genders. Note that these percentages do not sum up to 100% because each ad can be targeted using multiple targeting criteria. Below, we detail how age, custom audiences, interests and default targeting are used in our data.
| Variable | Estimate () [95% CI] | |||||
| Problematic | Pot. Prohibited | Deceptive | Clickbait | Sensitive: Financial | Sensitive: Other | |
| Intercept | 0.191∗∗∗ [0.13, 0.26] | 0.013∗∗∗ [0.01, 0.02] | 0.014∗ [0, 0.03] | 0.023 [-0.01, 0.05] | 0.133∗∗∗ [0.08, 0.18] | 0.009∗ [0, 0.02] |
| Gender: Woman | -0.059∗ [-0.11, -0.01] | -0.006∗ [-0.01, 0] | -0.007 [-0.02, 0] | -0.003 [-0.03, 0.02] | -0.046∗ [-0.09, 0] | 0.004 [0, 0.01] |
| Race: Black | 0.01 [-0.05, 0.07] | 0.002 [0, 0.01] | 0.007 [-0.01, 0.02] | 0.011 [-0.02, 0.04] | -0.007 [-0.06, 0.04] | -0.003 [-0.01, 0] |
| race: Asian | -0.019 [-0.1, 0.06] | -0.005 [-0.01, 0] | -0.003 [-0.02, 0.01] | -0.007 [-0.04, 0.03] | -0.003 [-0.07, 0.06] | 0 [-0.01, 0.01] |
| Ethnicity: Hispanic | 0.017 [-0.08, 0.12] | -0.009 [-0.02, 0] | 0.028∗∗ [0.01, 0.05] | -0.021 [-0.06, 0.02] | 0.027 [-0.05, 0.11] | -0.008 [-0.02, 0] |
| Education: college and above | -0.033 [-0.09, 0.02] | -0.002 [-0.01, 0] | 0 [-0.01, 0.01] | 0.005 [-0.02, 0.03] | -0.036 [-0.08, 0.01] | -0.001 [-0.01, 0.01] |
| Age: Gen-X and older | 0.077∗∗ [0.02, 0.13] | -0.003 [-0.01, 0] | 0.011 [0, 0.02] | 0.041∗∗ [0.02, 0.06] | 0.034 [-0.01, 0.08] | -0.005 [-0.01, 0] |
Age. Figure 5 shows the fraction of ads that include users of a given age in their targeting; fractions of all ages are presented together as a line, which can be perceived as a function of age. Each panel shows this function for a different ad category, and also features the function for Neutral ads for easier comparison. A category-specific line above the (gray) Neutral line signifies that the age group was more often targeted with ads of that category compared to Neutral ads. Focusing on Problematic categories, ads for Sensitive: Other often exclude users aged 18-21. This can be explained by the prevalence of ads for alcoholic beverages in this category, selling of which to individuals below 21 is illegal in the US. Sensitive: Financial, Clickbait and Deceptive ads include older audiences at a higher rate than Neutral ads, which could explain why Deceptive and Clickbait skews towards older users in our panel. Similarly, Potentially Prohibited ads also exclude users over the age of 45. These differences provide evidence that advertisers actively use the platform’s age targeting features to find older users to show clickbait and scam content to. This is notable, since prior work suggests that older users may be more susceptible to such content [59].
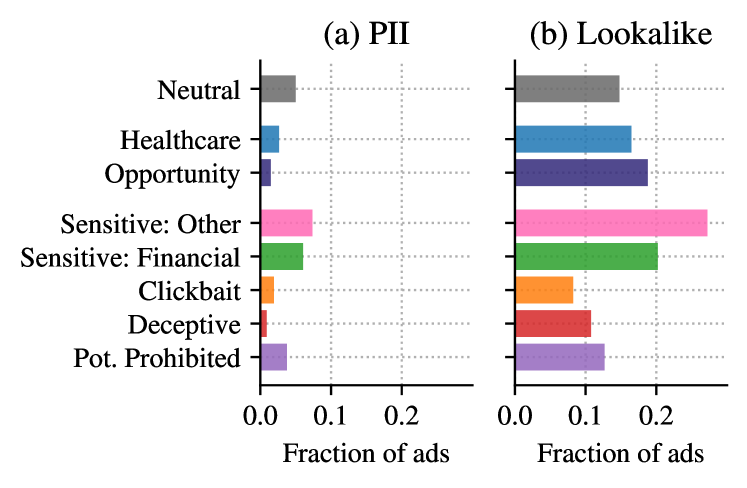
Custom Audiences. We make an distinction between custom audiences where the advertiser provides Facebook with a list of particular individuals to target using their PII (e.g., phone number, email), and Lookalike Audiences [26] that Facebook creates by finding users similar to those that the advertiser provides. The distinction is crucial because of the difference in control: the advertiser exercises complete control over who to include in the first group; however, they have little influence over the characteristics of the lookalike audiences. Figure 6 shows the prevalence of different types of custom audiences per ad category. We observe that lookalike audiences are used more often than PII custom audiences for all categories. We also note that as many as a quarter of Sensitive: Other ads were targeted using Lookalike Audiences. This suggests that while advertisers use the platform’s tool to find vulnerable audiences (e.g., Figure 5), they often outsource this role to the platform, especially when targeting for sensitive themes like weight loss or gambling.
Interests. Precise targeting by inferred interests is one of the features that distinguishes online behavioral advertising from traditional advertising models. A total of 6,028 unique interests were used to target our participants, including highly specific and sensitive inferences pertaining to health (“Multiple sclerosis awareness”, “Fibromyalgia awareness”), sexuality (“LGBT community”, “Gay Love”), religion (“Evangelicalism”, “Judaism”), and others. It is perhaps surprising that a majority of ads in our dataset (73.1%) do not actually use this functionality. Table A2 shows the most commonly targeted interests for each ad category.
Default Targeting. Finally, we investigate the delivery of ads that used the default targeting (i.e., the advertiser included all U.S. adults in their target audience). This allow us to observe the behavior of the delivery optimization in cases where the skew can not be attributed to the advertiser’s actions. To identify skews in delivery, we run a series of linear models, shown in Table 5, to examine the relation between fraction of problematic ads in ad diets and participant demographics, similar to Section 5.2. In contrast to that analysis, however, we subset our data to only include ads that have default targeting from the advertiser. Therefore, for each participant, we model, say, the fraction of Clickbait they saw that had default targeting, out of all of their default-targeted ads. Consequently, we capture purely skews that arise due to the platform’s optimization, since the advertiser specified the broadest possible targeting, and Facebook had to make its judgment of a relevant audience. Again, the first row (intercept) shows the fraction of ad diets for participants who are non-Hispanic white, younger, and without a college education; all significant coefficients mark biases in comparison to that baseline.
Table 5 shows that (similar to Table 4), the effect for older participants seeing a 7.7% higher fraction of Problematic ads (CI: 2-13%), and women seeing 5.9% fewer of them (CI: 1-11%), persists, even without advertiser targeting. Specifically, older participants’ ad diets (additively) contain 4.1% (CI: 2-6%) more Clickbait than the younger participants. We also observe a novel effect of Hispanic participants seeing 2.8% more Deceptive ads (CI: 1-5%). This implies that while their overall ad diets might not contain a significantly higher fraction of scams (Table 4)—delivery optimization independently skews these ads towards Hispanic participants. In further nuance, the effect of women seeing fewer Problematic ads can be explained by their ad diets comprising of 4.6% fewer Sensitive: Financial ads (CI: 0-9%), and 0.6% fewer Potentially Prohibited ads (CI: 0-1%) compared to participants who don’t identify as women. These differences provide evidence that in addition to an advertiser’s targeting—or regardless of it—Facebook’s delivery optimization algorithms are also responsible for skewing the delivery of Problematic ads.
6 Concluding Discussion
Our study presents three main contributions. First, gathering insights from a diverse group of Facebook users, we identify a collection of Problematic categories of ads that were significantly more disliked, and determine participants’ reasons for disliking these ads—they often mistrust these ads and recognize their deceptive nature. Second, we observe that while these ads make up a small fraction (12% on average) of our participants’ ad diets, a subset of our panel are disproportionately exposed to them. Third, using a combination of techniques, we demonstrate that some of these skews in ad distribution persist without targeting from advertisers, implying that the platform’s algorithms are responsible for at least some of the skews we observe.
While our observations are limited to our panel, our study validates anecdotal evidence [54, 76] that clickbait and scam advertising is shown to older users more often. We show that these differences exist both due to advertisers’ targeting and due to the platform’s delivery optimization—which together may create a feedback loop [50]. We also identify instances where the overall outcomes are different than delivery optimization’s biases: Black participants see a higher fraction of Clickbait ads (Table 4), but only when targeted by advertisers. On the other hand, Hispanic participants have higher exposure to Deceptive ads (Table 5), but only within ads that are essentially untargetted by advertisers, suggesting this effect is due to the ad platform.
Further, we find that financial ads are shown more often to participants who identify as men, both as a system-level outcome, and when controlling for ad targeting. As annotators, we observe that Sensitive: Financial ads are quite diverse—ranging from problematic offers like high APR loans to possibly useful financial tools such as savings accounts. Thus, men in our panel are exposed to problematic financial products, as well as financial opportunities, more often.
Finally, our analysis of targeting practices shows that advertisers often cede control to the platform’s optimizations – as evidenced by the popular use of lookalike audiences (Figure 6) and the low usage of targeting interests (Table A2). This implies that advertisers are aware of the usefulness of the platform’s personalization, and malicious actors could rely on these capabilities to target Problematic advertising.
Taken together, our results offer concrete insights into user experiences with problematic advertising and raise questions about the power of platforms in delivering these ads to users.
Limitations. Our ad categories were created through pilot data collection and backed by review of platform policies and literature, including work that also examined user sentiments towards problematic advertising [91]. Still, categorizing ads into just seven categories diminishes some nuance within groups. We analyze a subset of our total collected ads that we were able to annotate manually (one-third of our overall collected data); therefore, we are not able to provide insight into the complete ad diets of our participants. To minimize any selection biases in our analyzed subset, we randomly sampled ads from participants each month for annotating and surveying, but recognize important data could be missed by not assessing the complete ad diets of participants.
Further, our observations are only about participants’ desktop browsing experiences. While we suspect that similar ads would be present on the mobile Facebook app due to the diversity of Facebook’s ad placement options, we do not have direct access to that data. We also do not have access to budgets of the ads that we observe, and therefore are not able to disambiguate whether certain advertisers are simply paying more money to Facebook, resulting in skews. However, to control for these differences, we compare fractions of ad categories out of the ad diets that we observe for each participant (e.g., in Section 5.2). This ensures that we compare only within participants’ desktop experiences, and in the same budget-class of advertisers that were reaching them.
Additionally, we do not have access to participants’ complete ad preferences, and the frequency with which they change these settings. This limits our ability to control for participant actions such as removing ads from an advertiser, or removing a specific interest. Prior work estimates that 10-19% of users tweak their ad settings [39, 41], either from the ad preferences page or from the contextual menu next to ads. We attempt to account for such variance by factoring participants’ awareness of privacy settings in Table A1, and find that disparate exposure to Problematic ads for older and minority participants persists.
Finally, our work currently does not provide insight on advertising’s contextual harms [58]; for instance, while we take an interest in sensitive ads with subject matters like gambling, we do not investigate their distribution among those with gambling addictions. Rather, we try to find commonalities in our panel’s opinions through mixed-effects regression models, and then build our analysis on top of that data. We leave further exploration of contextually problematic ads, such as Gak et al. [34], to future work.
Recommendations. To limit users’ exposure to problematic ads, we propose changes on two levels. First, we advocate for a more fine-grained and user-informed understanding of problematic ads, and other broader harms of advertising [5]. Currently, platforms recognize ads such as Deceptive, Clickbait and Potentially Prohibited as problematic, and typically include language scrutinizing them in their advertising guidelines [23, 31]. However, sensitive ads that present harms for users with addictions or other mental illness are less moderated. Yet, they are still widely disliked across our diverse set of participants. We advocate for a more refined understanding of ads with sensitive themes, and more scrutiny and moderation from platforms towards these ads. For a more nuanced understanding of problematic ads, our work, along with [91] and [34] provide a start.
Second, we argue for more controls not just on moderation, but on optimization as well. Our results demonstrate that once problematic ads circumvent a platform’s review process, the platform then optimizes them towards users similar to other personalized content (e.g. Figure A1). To avoid this systematic personalizing of problematic ads, platforms need policies on their delivery optimization in addition to their policies on content moderation. This would require platforms to constrain the optimization of problematic content for users. For instance, Facebook currently states that it demotes clickbait in content ranking [31], yet a demotion does not stop such content from inevitably reaching and harming some users. There is perhaps a need for an “optimization vacuum” so that problematic content, even after evading moderation, cannot reach users.
We advocate for platforms to take emerging works on user experiences with problematic ads into account, and for a more urgent call for platforms to not only moderate the content users see, but also have mechanisms to suppress the delivery of problematic content, instead of optimizing for it.
Acknowledgements
We are grateful to our shepherd and reviewers for their valuable feedback. We also thank our annotators, Devesh Tarasia and Manjot Bedi, for their work. This work is funded in part by NSF grants CNS-1916020 and CNS-1955227, and Mozilla Research Grant 2019H1.
References
- [1] NYU Cybersecurity for Democracy, Social Media Monitor Extension. https://github.com/CybersecurityForDemocracy/social-media-collector.
- [2] Wikipedia: Gini coefficient. https://en.wikipedia.org/wiki/Gini_coefficient.
- [3] Wikipedia: Skewness. https://en.wikipedia.org/wiki/Skewness.
- [4] Van Buren v. United States, 141 S. Ct. 1648, 593 U.S., 210 L. Ed. 2d 26, 2021.
- [5] Ali, M. Measuring and mitigating bias and harm in personalized advertising. In Proceedings of the 15th ACM Conference on Recommender Systems (2021), pp. 869–872.
- [6] Ali, M., Sapiezynski, P., Bogen, M., Korolova, A., Mislove, A., and Rieke, A. Discrimination through optimization: How Facebook’s ad delivery can lead to biased outcomes. Proceedings of the ACM on Human-Computer Interaction 3, CSCW (2019), 1–30.
- [7] Ali, M., Sapiezynski, P., Korolova, A., Mislove, A., and Rieke, A. Ad Delivery Algorithms: The Hidden Arbiters Of Political Messaging. In ACM International Conference on Web Search and Data Mining (2021).
- [8] Andreou, A., Venkatadri, G., Goga, O., Gummadi, K. P., Loiseau, P., and Mislove, A. Investigating Ad Transparency Mechanisms In Social Media: A Case Study Of Facebook’s Explanations. In Network and Distributed System Security Symposium (San Diego, California, USA, February 2018).
- [9] Aubrey, J. S. Exposure to sexually objectifying media and body self-perceptions among college women: An examination of the selective exposure hypothesis and the role of moderating variables. Sex Roles 55, 3 (2006), 159–172.
- [10] Azungah, T. Qualitative research: deductive and inductive approaches to data analysis. Qualitative Research Journal (2018).
- [11] Baker, S. A., Wade, M., and Walsh, M. J. The challenges of responding to misinformation during a pandemic: Content moderation and the limitations of the concept of harm. Media International Australia 177, 1 (2020), 103–107.
- [12] Benjamini, Y., and Hochberg, Y. Controlling the false discovery rate: A practical and powerful approach to multiple testing. Journal of the Royal Statistical Society: Series B (Methodological) 57, 1 (1995), 289–300.
- [13] Browne Graves, S. Television and prejudice reduction: When does television as a vicarious experience make a difference? Journal of Social Issues 55, 4 (1999), 707–727.
- [14] Chandra, Y., and Shang, L. Inductive coding. In Qualitative Research using R: A Systematic Approach. Springer, 2019, pp. 91–106.
- [15] Cohen, J. Statistical Power Analysis for the Behavioral Sciences. Academic Press, 2013.
- [16] Commission, F. T. Challenging Deceptive Advertising and Marketing . https://www.ftc.gov/reports/annual-report-standard/ftc-2013/challenging-deceptive-advertising-and-marketing.
- [17] Datta, A., Datta, A., Makagon, J., Mulligan, D. K., and Tschantz, M. C. Discrimination in online advertising: A multidisciplinary inquiry. In Conference on Fairness, Accountability and Transparency (2018), PMLR, pp. 20–34.
- [18] Dimock, M. Defining generations: Where Millennials end and Generation Z begins. https://www.pewresearch.org/fact-tank/2019/01/17/where-millennials-end-and-generation-z-begins/.
- [19] Edelman, B., Ostrovsky, M., and Schwarz, M. Internet advertising and the generalized second-price auction: Selling billions of dollars worth of keywords. American Economic Review 97, 1 (2007), 242–259.
- [20] Edelson, L., Lauinger, T., and McCoy, D. A security analysis of the facebook ad library. In 2020 IEEE Symposium on Security and Privacy (SP) (2020), IEEE, pp. 661–678.
- [21] Evans, D. S. The online advertising industry: Economics, evolution, and privacy. Journal of Economic Perspectives 23, 3 (2009), 37–60.
- [22] Facebook. Ad Standards, Online Pharmacies. https://transparency.fb.com/policies/ad-standards/content-specific-restrictions/online-pharmacies.
- [23] Facebook. Advertising Standards, Unacceptable Business Practices. https://transparency.fb.com/policies/ad-standards/deceptive-content/unacceptable-business-practices.
- [24] Facebook. Advertising Standards, Unrealistic Outcomes. https://transparency.fb.com/policies/ad-standards/deceptive-content/unrealistic-outcomes.
- [25] Facebook. Bout Custom Audiences. https://www.facebook.com/business/help/744354708981227?id=2469097953376494.
- [26] Facebook. Facebook: About lookalike audiences. https://www.facebook.com/business/help/164749007013531?id=401668390442328.
- [27] Facebook. Facebook: About the delivery system: Ad auctions. https://www.facebook.com/business/help/430291176997542.
- [28] Facebook. Facebook Advertising Standards. https://transparency.fb.com/policies/ad-standards/.
- [29] Facebook. Facebook Political Ad Collector. https://projects.propublica.org/facebook-ads/.
- [30] Facebook. Facebook Terms of Service, Jobs Policies. https://www.facebook.com/policies_center/Jobs/.
- [31] Facebook. Types of Content We Demote. https://transparency.fb.com/features/approach-to-ranking/types-of-content-we-demote.
- [32] Facebook. Why Am I Seeing This? We Have an Answer for You. https://about.fb.com/news/2019/03/why-am-i-seeing-this/.
- [33] Ford, R. A. Data scams. Houston Law Review 57 (2019), 111.
- [34] Gak, L., Olojo, S., and Salehi, N. The distressing ads that persist: Uncovering the harms of targeted weight-loss ads among users with histories of disordered eating. Proceedings of the ACM on Human-Computer Interaction 6, CSCW2 (nov 2022).
- [35] GDI Global Disinformation Index. The quarter billion dollar question: How is disinformation gaming ad tech? https://www.disinformationindex.org/research/2019-9-1-the-quarter-billion-dollar-question-how-is-disinformation-gaming-ad-tech/.
- [36] Gelman, A., Hill, J., and Yajima, M. Why we (usually) don’t have to worry about multiple comparisons. Journal of Research on Educational Effectiveness 5, 2 (2012), 189–211.
- [37] Goldstein, D. G., Suri, S., McAfee, R. P., Ekstrand-Abueg, M., and Diaz, F. The economic and cognitive costs of annoying display advertisements. Journal of Marketing Research 51, 6 (2014), 742–752.
- [38] Google. Google ads policies. https://support.google.com/adspolicy/answer/6008942?hl=en.
- [39] Habib, H., Pearman, S., Young, E., Saxena, I., Zhang, R., and Cranor, L. F. Identifying user needs for advertising controls on facebook. Proceedings of the ACM on Human-Computer Interaction 6, CSCW1 (2022), 1–42.
- [40] Houlis, A. Part 238 - Guides against bait advertising. https://www.sheknows.com/health-and-wellness/articles/2002320/targeted-advertising-trauma/.
- [41] Im, J., Wang, R., Lyu, W., Cook, N., Habib, H., Cranor, L. F., Banovic, N., and Schaub, F. Less is not more: Improving findability and actionability of privacy controls for online behavioral advertising. In Proceedings of the 2023 CHI Conference on Human Factors in Computing Systems (2023), pp. 1–33.
- [42] Jhaver, S., Birman, I., Gilbert, E., and Bruckman, A. Human-machine collaboration for content regulation: The case of reddit automoderator. ACM Transactions on Computer-Human Interaction (TOCHI) 26, 5 (2019), 1–35.
- [43] Jung, A.-R. The influence of perceived ad relevance on social media advertising: An empirical examination of a mediating role of privacy concern. Computers in Human Behavior 70 (2017), 303–309.
- [44] Kanich, C., Kreibich, C., Levchenko, K., Enright, B., Voelker, G. M., Paxson, V., and Savage, S. Spamalytics: An empirical analysis of spam marketing conversion. In Proceedings of the 15th ACM Conference on Computer and Communications Security (2008), pp. 3–14.
- [45] Kingsley, S., Wang, C., Mikhalenko, A., Sinha, P., and Kulkarni, C. Auditing digital platforms for discrimination in economic opportunity advertising. arXiv preprint arXiv:2008.09656 (2020).
- [46] Kruskal, W. H., and Wallis, W. A. Use of ranks in one-criterion variance analysis. Journal of the American Statistical Association 47, 260 (1952), 583–621.
- [47] Lambrecht, A., and Tucker, C. Algorithmic bias? An empirical study of apparent gender-based discrimination in the display of stem career ads. Management Science 65, 7 (2019), 2966–2981.
- [48] Landis, J. R., and Koch, G. G. The measurement of observer agreement for categorical data. Biometrics (1977), 159–174.
- [49] Le Pochat, V., Edelson, L., Van Goethem, T., Joosen, W., McCoy, D., and Lauinger, T. An audit of Facebook’s political ad policy enforcement. In Proceedings of the 31st USENIX Security Symposium (2022), USENIX Association.
- [50] Leqi, L., and Dean, S. Engineering a safer recommender system. In Workshop on Responsible Decision Making in Dynamic Environments (2022).
- [51] Li, Z., Zhang, K., Xie, Y., Yu, F., and Wang, X. Knowing your enemy: Understanding and detecting malicious web advertising. In Proceedings of the 2012 ACM Conference on Computer and Communications Security (2012), pp. 674–686.
- [52] Madio, L., and Quinn, M. Content moderation and advertising in social media platforms. Available at SSRN 3551103 (2021).
- [53] McDonald, A. M., and Cranor, L. F. Americans’ attitudes about internet behavioral advertising practices. In Proceedings of the 9th Annual ACM Workshop on Privacy in the Electronic Society (2010), pp. 63–72.
- [54] Merrill, J., and Kozlowska, H. A precious-metals scheme used fear and Facebook to trick older conservatives out of their savings, 2019. https://qz.com/1749695/facebook-ads-targeted-fox-news-fans-for-shady-silver-coin-scheme.
- [55] Meta. Advertising policies. https://www.facebook.com/policies_center/ads.
- [56] Meta. New updates to reduce clickbait headlines. https://about.fb.com/news/2017/05/news-feed-fyi-new-updates-to-reduce-clickbait-headlines/.
- [57] Meta. Meta: An update on our ads fairness efforts, 2023. https://about.fb.com/news/2023/01/an-update-on-our-ads-fairness-efforts/.
- [58] Milano, S., Mittelstadt, B., Wachter, S., and Russell, C. Epistemic fragmentation poses a threat to the governance of online targeting. Nature Machine Intelligence 3, 6 (2021), 466–472.
- [59] Munger, K., Luca, M., Nagler, J., and Tucker, J. The (null) effects of clickbait headlines on polarization, trust, and learning. Public Opinion Quarterly 84, 1 (2020), 49–73.
- [60] Nelms, T., Perdisci, R., Antonakakis, M., and Ahamad, M. Towards measuring and mitigating social engineering software download attacks. In 25th USENIX Security Symposium (USENIX Security 16) (2016), pp. 773–789.
- [61] Office of the High Commissioner for Human Rights. Moderating online content: fighting harm or silencing dissent? https://www.ohchr.org/en/stories/2021/07/moderating-online-content-fighting-harm-or-silencing-dissent.
- [62] Panoptykon Foundation. Algorithms of trauma: new case study shows that facebook doesn’t give users real control over disturbing surveillance ads, 2021. https://en.panoptykon.org/algorithms-of-trauma.
- [63] Pengnate, S. F. Measuring emotional arousal in clickbait: Eye-tracking approach. In Americas Conference on Information Systems (2016).
- [64] Pengnate, S. F., Chen, J., and Young, A. Effects of clickbait headlines on user responses: An empirical investigation. Journal of International Technology and Information Management 30, 3 (2021), 1–18.
- [65] Pew Research. Social Media Fact Sheet. https://www.pewresearch.org/internet/fact-sheet/social-media/.
- [66] Posavac, H. D., Posavac, S. S., and Posavac, E. J. Exposure to media images of female attractiveness and concern with body weight among young women. Sex Roles 38, 3 (1998), 187–201.
- [67] Potter, W. J. Cultivation theory and research: A conceptual critique. Human Communication Research 19, 4 (1993), 564–601.
- [68] Prolific. Audience checking tool. https://app.prolific.co/audience-checker.
- [69] Rastogi, V., Shao, R., Chen, Y., Pan, X., Zou, S., and Riley, R. D. Are these ads safe: Detecting hidden attacks through the mobile app-web interfaces. In NDSS (2016).
- [70] Redmiles, E. M., Chachra, N., and Waismeyer, B. Examining the demand for spam: Who clicks? In Proceedings of the 2018 CHI Conference on Human Factors in Computing Systems (2018), pp. 1–10.
- [71] Samat, S., Acquisti, A., and Babcock, L. Raise the curtains: The effect of awareness about targeting on consumer attitudes and purchase intentions. In Thirteenth Symposium on Usable Privacy and Security (SOUPS 2017) (2017), pp. 299–319.
- [72] Sapiezynski, P., Ghosh, A., Kaplan, L., Rieke, A., and Mislove, A. Algorithms that “don’t see color”: Measuring biases in lookalike and special ad audiences. In Proceedings of the 2022 AAAI/ACM Conference on AI, Ethics, and Society (2022), pp. 609–616.
- [73] Scott, K. You won’t believe what’s in this paper! Clickbait, relevance and the curiosity gap. Journal of Pragmatics 175 (2021), 53–66.
- [74] Sculley, D., Otey, M. E., Pohl, M., Spitznagel, B., Hainsworth, J., and Zhou, Y. Detecting adversarial advertisements in the wild. In Proceedings of the 17th ACM SIGKDD International Conference on Knowledge Discovery and Data Mining (2011), pp. 274–282.
- [75] Shaw, E. F. Agenda-setting and mass communication theory. Gazette (Leiden, Netherlands) 25, 2 (1979), 96–105.
- [76] Silverman, C. How A Massive Facebook Scam Siphoned Millions Of Dollars From Unsuspecting Boomers, 2019. https://www.buzzfeednews.com/article/craigsilverman/facebook-subscription-trap-free-trial-scam-ads-inc.
- [77] Smith, S. L., and Donnerstein, E. Harmful effects of exposure to media violence: Learning of aggression, emotional desensitization, and fear. In Human Aggression. Elsevier, 1998, pp. 167–202.
- [78] Sosnovik, V., and Goga, O. Understanding the complexity of detecting political ads. In Proceedings of the Web Conference 2021 (2021), pp. 2002–2013.
- [79] Speicher, T., Ali, M., Venkatadri, G., Ribeiro, F. N., Arvanitakis, G., Benevenuto, F., Gummadi, K. P., Loiseau, P., and Mislove, A. Potential for discrimination in online targeted advertising. In Conference on Fairness, Accountability and Transparency (2018), PMLR, pp. 5–19.
- [80] Statista. Number of adblock users worldwide from 2013 to 2019. https://www.statista.com/statistics/435252/adblock-users-worldwide/.
- [81] Sweeney, L. Discrimination in online ad delivery. Communications of the ACM 56, 5 (2013), 44–54.
- [82] Tang, J., Birrell, E., and Lerner, A. How well do my results generalize now? The external validity of online privacy and security surveys. arXiv preprint arXiv:2202.14036 (2022).
- [83] Thomas, D. R. A general inductive approach for qualitative data analysis. American Journal of Evaluation 27, 2 (2003).
- [84] Ur, B., Leon, P. G., Cranor, L. F., Shay, R., and Wang, Y. Smart, useful, scary, creepy: Perceptions of online behavioral advertising. In Proceedings of the Eighth Symposium on Usable Privacy and Security (2012), pp. 1–15.
- [85] Van den Berg, P., Neumark-Sztainer, D., Hannan, P. J., and Haines, J. Is dieting advice from magazines helpful or harmful? Five-year associations with weight-control behaviors and psychological outcomes in adolescents. Pediatrics 119, 1 (2007), e30–e37.
- [86] Vidmar, N., and Rokeach, M. Archie Bunker’s bigotry: A study in selective perception and exposure. Journal of Communication 24, 1 (1974), 36–47.
- [87] Wakefield, M., Flay, B., Nichter, M., and Giovino, G. Role of the media in influencing trajectories of youth smoking. Addiction 98 (2003), 79–103.
- [88] Xie, G.-X., and Boush, D. M. How susceptible are consumers to deceptive advertising claims? a retrospective look at the experimental research literature. The Marketing Review 11, 3 (2011), 293–314.
- [89] Xie, G.-X., Madrigal, R., and Boush, D. M. Disentangling the effects of perceived deception and anticipated harm on consumer responses to deceptive advertising. Journal of Business Ethics 129, 2 (2015), 281–293.
- [90] Zarras, A., Kapravelos, A., Stringhini, G., Holz, T., Kruegel, C., and Vigna, G. The dark alleys of madison avenue: Understanding malicious advertisements. In Proceedings of the 2014 conference on internet measurement conference (2014), pp. 373–380.
- [91] Zeng, E., Kohno, T., and Roesner, F. Bad news: Clickbait and deceptive ads on news and misinformation websites. In Workshop on Technology and Consumer Protection (2020).
- [92] Zeng, E., Kohno, T., and Roesner, F. What makes a “bad” ad? user perceptions of problematic online advertising. In Proceedings of the 2021 CHI Conference on Human Factors in Computing Systems (2021), pp. 1–24.
- [93] Zeng, E., Wei, M., Gregersen, T., Kohno, T., and Roesner, F. Polls, clickbait, and commemorative $2 bills: problematic political advertising on news and media websites around the 2020 us elections. In Proceedings of the 21st ACM Internet Measurement Conference (2021), pp. 507–525.
Appendix A Appendix
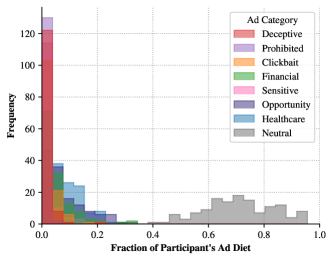
| Variable | Estimate () [95% CI] | |||||
| Problematic | Pot. Prohibited | Deceptive | Clickbait | Sensitive: Financial | Sensitive: Other | |
| Intercept | 0.106∗ [0.02, 0.19] | 0.011∗ [0, 0.02] | -0.001 [-0.03, 0.03] | 0.026 [-0.01, 0.06] | 0.056 [-0.01, 0.13] | 0.015 [-0.02, 0.05] |
| Gender: Woman | -0.066∗∗∗ [-0.09, -0.04] | -0.002 [0, 0] | -0.005 [-0.01, 0] | -0.007 [-0.02, 0] | -0.047∗∗∗ [-0.07, -0.03] | -0.005 [-0.02, 0.01] |
| Race: Black | 0.028+ [0, 0.06] | -0.001 [0, 0] | 0.006 [0, 0.02] | 0.013∗ [0, 0.02] | 0.007 [-0.02, 0.03] | 0.003 [-0.01, 0.02] |
| Race: Asian | -0.001 [-0.04, 0.04] | 0.001 [0, 0.01] | -0.002 [-0.02, 0.01] | 0.004 [-0.01, 0.02] | -0.007 [-0.04, 0.03] | 0.003 [-0.01, 0.02] |
| Ethnicity: Hispanic | 0.037 [-0.01, 0.09] | -0.007∗ [-0.01, 0] | 0.006 [-0.01, 0.02] | -0.01 [-0.03, 0.01] | 0.048∗ [0.01, 0.09] | 0 [-0.02, 0.02] |
| Education: college and above | 0.009 [-0.02, 0.04] | -0.001 [0, 0] | 0.004 [-0.01, 0.01] | 0.011∗ [0, 0.02] | -0.004 [-0.03, 0.02] | 0 [-0.01, 0.01] |
| Age: 42 and above | 0.052∗∗∗ [0.02, 0.08] | -0.003∗ [-0.01, 0] | 0.012∗ [0, 0.02] | 0.017∗∗ [0.01, 0.03] | 0.018 [-0.01, 0.04] | 0.009 [0, 0.02] |
| Privacy Settings Awareness (1–5) | 0.003 [-0.02, 0.02] | 0 [0, 0] | 0.002 [0, 0.01] | -0.003 [-0.01, 0] | 0.003 [-0.01, 0.02] | 0.001 [-0.01, 0.01] |
| Variable | Estimate () [95% CI] | |
| Healthcare | Opportunity | |
| Intercept | 0.089∗∗∗ [0.06, 0.11] | 0.045∗∗ [0.01, 0.08] |
| Gender: Woman | 0.007 [-0.01, 0.03] | 0.022+ [0, 0.05] |
| Race: Black | -0.024+ [-0.05, 0] | 0.038∗ [0.01, 0.07] |
| Race: Asian | -0.017 [-0.05, 0.01] | 0.028 [-0.01, 0.07] |
| Education: college and above | -0.004 [-0.03, 0.02] | 0.034∗ [0.01, 0.06] |
| Ethnicity: Hispanic | 0.011 [-0.03, 0.05] | -0.007 [-0.06, 0.04] |
| Age: 42 and above | 0.018+ [0, 0.04] | -0.021 [-0.05, 0.01] |
; , , .
| Ad Category | Targeted Interest (Prevalence) |
| Neutral | None (72.3%), Online shopping (1.3%), Health & wellness (0.8%), Family (0.7%), Physical fitness (0.7%), Yoga (0.6%) |
| Opportunity | None (67.9%), Employment (2.7%), Education (2.4%), Higher education (2.3%), Career (1.7%), Technology (1.6%) |
| Healthcare | None (76.8%), Health & wellness (2.4%), Clinical trial (2.2%), Physical fitness (1.7%), Physical exercise (1.5%), Medicine (1.0%) |
| Clickbait | None (79.8%), Online shopping (1.3%), Personal finance (1.0%), Amazon.com (0.9%), Home improvement (0.8%), Investment (0.8%) |
| Sensitive: Financial | None (76.4%), Personal finance (5.1%), Investment (3.4%), Online banking (3.1%), Credit cards (2.9%), Financial services (2.0%) |
| Sensitive: Other | None (75.3%), Gambling (2.9%), Alcoholic beverages (2.4%), Bars (2.1%), Beer (1.9%), Vodka (1.4%) |
| Pot. Prohibited | None (81.3%), Health & wellness (2.7%), Meditation (1.8%), Physical fitness (1.4%), Credit cards (1.4%), House Hunting (1.4%) |
| Deceptive | None (68.1%), Online shopping (4.0%), Shopping (2.1%), Amazon.com (1.5%), Clothing (1.5%), Digital marketing (1.5%) |
Example Ads

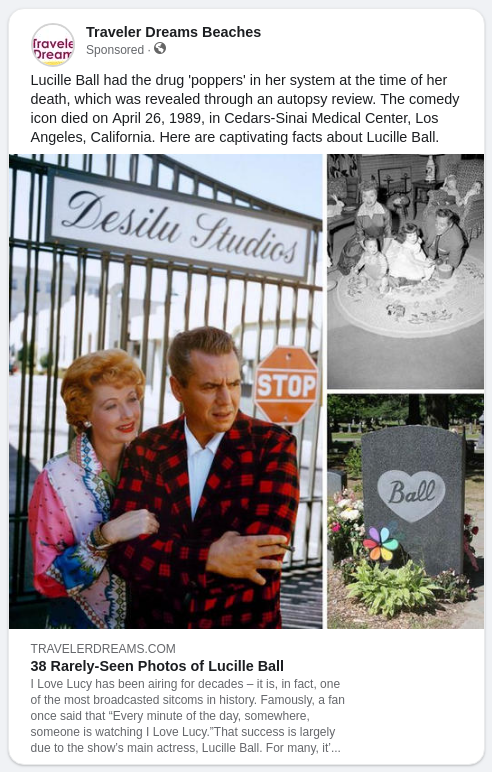

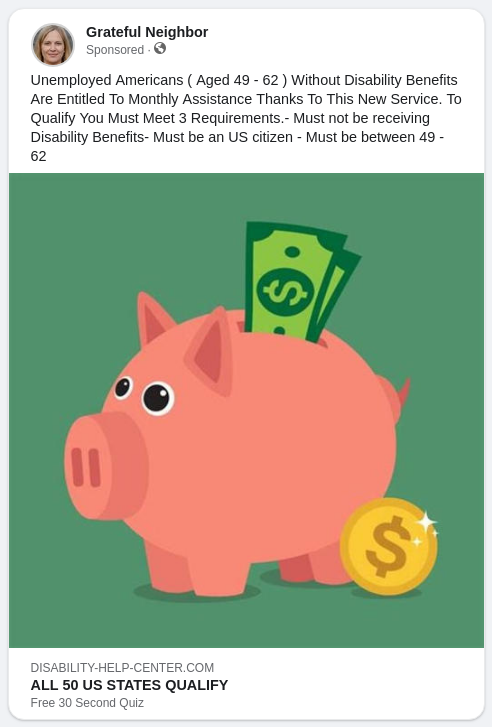
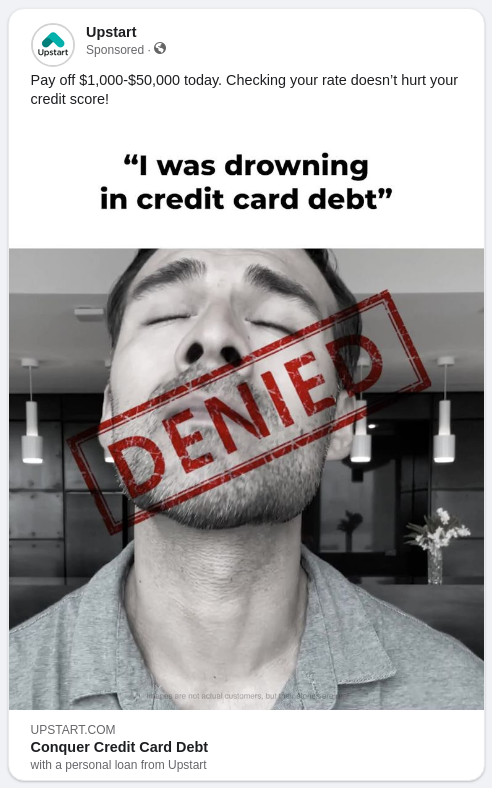

Appendix B Codebook
This appendix replicates the codebook used by annotators to manually categorize ads. Each code was described through a definition, some descriptive examples, and some examples of ads that would not qualify as the code. An example ad is also provided for each code.
B.1 Deceptive
Definition Ads that may overtly or deceptively lead users to engage with fraudulent offers, potential scams, false or misleading claims, or predatory business practices (e.g. recurring billing).

Qualifies
-
•
Ads that have potential to harm users financially, such as
-
–
Payday loans, paycheck advances, bail bonds, or any short-term loans222Also considered deceptive in Facebook’s policies: https://transparency.fb.com/policies/ad-standards/deceptive-content/
-
–
Debt settlement services, especially with strongly worded guarantees
-
–
-
•
Services which are highly unlikely to result in the advertised outcome, e.g. fat burning pills, guaranteed monthly income etc.
-
•
Scams—either for money or personal information—that we can confirm via Facebook reviews or Better Business Bureau reports
-
•
Ads that employ deceptive tactics, such as:
-
–
Containing false or exaggerated claims
-
–
Designed to look like they are advertising a different product than the linked webpage
-
–
-
•
Overly pushy or manipulative ads
-
•
Predatory business practices such as: requests for direct messages, recurring/non-cancellable billing as mentioned by users
Does not qualify
-
•
Sketchy product ads for which we cannot find evidence of deception
-
•
Visibly low quality products that are not inherently harmful e.g. clothing, jewellery, novels
B.2 Potentially Prohibited
Ads that might be prohibited according to Facebook’s prohibited policies333https://transparency.fb.com/policies/ad-standards/ on unacceptable content, dangerous content and objectionable content.

Qualifies
-
•
Prohibited substances—such as illegal prescription and recreational drugs, tobacco, and related products
-
•
Unsafe dietary supplements and medical treatments
-
•
Weapons, ammunition or explosives
-
•
Adult products or services
-
•
Instant loans, pre-financing and security deposits
-
•
Selling human body parts or fluids
-
•
Multilevel marketing, or income opportunities that offer quick income with low investment
-
•
Spyware or malware
-
•
Ads against vaccinations
Does not qualify
-
•
Products for sexual or reproductive health, such as medical devices for family planning and contraception
B.3 Clickbait
Definition Clickbait intentionally omits crucial information or exaggerates the details of a story to make it seem like a bigger deal than it really is444Facebook Business Center: https://www.facebook.com/business/help/503640323442584?id=208060977200861. Such ads often have three distinct characteristics [92]: the ad is attention grabbing, the ad does not tell the viewer exactly what is being promoted to “bait” the viewer into clicking it, and the landing page of the ad often does not live up to people’s expectations based on the ad.
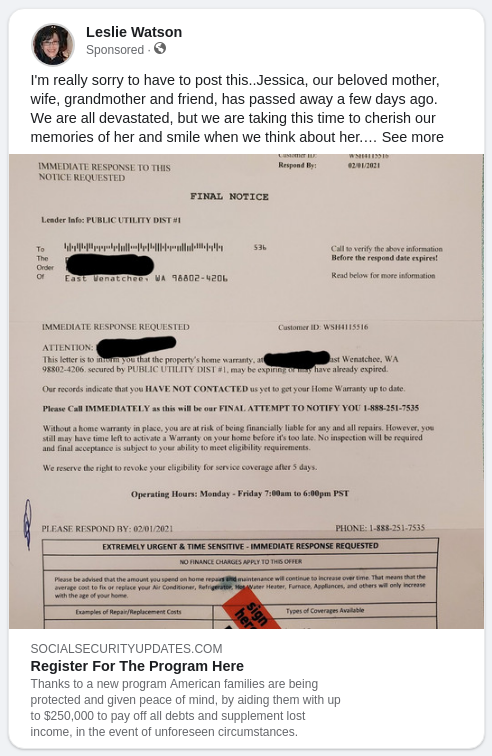
Qualifies
-
•
Ads where the text, headline, and description together don’t clarify what precisely is being advertised
-
•
Ads that omit information to entice users
-
•
Have very dense text in the image
-
•
Invite the users to tap a section of the image/button in image for results
-
•
Ads for products that are actually affiliate marketing links or data collection forms, e.g. home renovation and solar panel surveys
Does not qualify
-
•
Ads that use loud language but are clear about what the advertised product, e.g. e-commerce ads that advertise 200% growth in business but are upfront that they’re advertising an online course
B.4 Sensitive: Financial
Definition Ads that contain products or services related to managing finances, building credit, and other financial tools. Such ads are subject to content-specific restrictions on Facebook555https://transparency.fb.com/policies/ad-standards/content-specific-restrictions, and must comply with additional targeting and authorization restrictions.
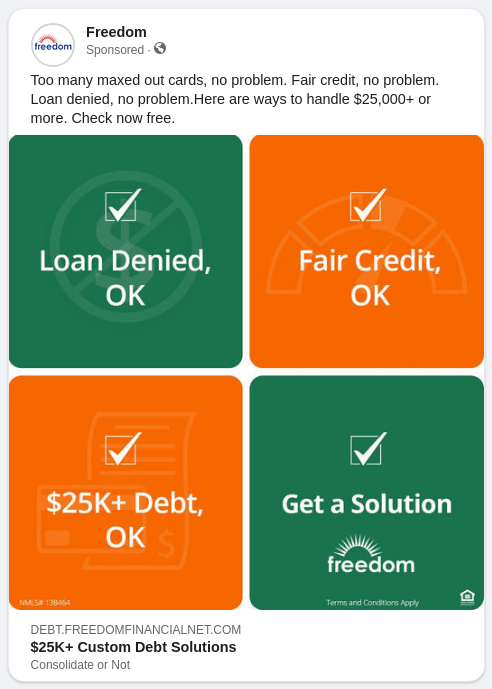
Qualifies
-
•
Loans and mortgage financing ads
-
•
Checking, savings and brokerage accounts ads
-
•
Credit card ads
-
•
Ads regarding financial and investment advice
-
•
Cryptocurrency or stock investment opportunities
Does not qualify
-
•
Ads that reference saving money, but whose products or services are not inherently financial (e.g. browser extensions for deal-hunting)
-
•
Insurance advertising
-
•
Ads for selling homes
B.5 Sensitive: Other
Definition Ads that contain subject matter that may be sensitive or triggering for users to view, or they may contain content that is harmful for vulnerable groups (e.g. those suffering from an addiction). Similar to Sensitive: Financial, such ads are subject to content-specific restrictions on Facebook, and must comply with additional targeting and authorization restrictions.

Qualifies
-
•
Alcohol
-
•
Gambling, casinos, online slot machines
-
•
Dieting, weight loss treatments, anything related to body image
-
•
Prescription and over-the-counter drugs
-
•
Online pharmacies and services for mental and physical health
Does not qualify
-
•
Ads for meal plans
-
•
Popular brick and mortar pharmacy ads e.g., CVS and Walgreens
B.6 Opportunity
Definition Ads that present any sort of employment, housing, or educational opportunity to users.

Qualifies
-
•
Ads for a job or gig, such as
-
–
Full- or part-time employment opportunities
-
–
Gig-work opportunities like Uber, Doordash etc.
-
–
Local job fairs
-
–
-
•
Ads for educational opportunities (for-profit universities and online degrees included)
-
•
Fellowships, scholarships, writing contests, etc.
Does not qualify
-
•
Product sweepstakes or cash-back promotions
-
•
Ads with financial opportunities (savings, credit cards etc.), regardless of how big the sign-up rewards are
-
•
Online studies or market research opportunities, regardless of compensation
B.7 Healthcare
Definition Ads that contain products or services related to healthcare, fitness, mental and physical wellness, or physical appearance.

Qualifies
-
•
Fitness products or services, and gym memberships
-
•
Vitamins or supplements
-
•
Physical appearance-related products or services, like hair growth supplements
-
•
Health insurance
-
•
Dieting products or services (also annotated as Sensitive)
-
•
Online mental health clinics and prescription services
-
•
At-home medical monitoring devices
-
•
Public-health announcements (e.g. CDC, WHO)
-
•
Ads for children’s health
Does not qualify
-
•
Ads for meal plans
-
•
Ads for pet health
B.8 Political
Definition Ads containing references to political parties, bills or laws, political figures or candidates, petitions or causes with outwardly political affiliations, or any other political-related content.
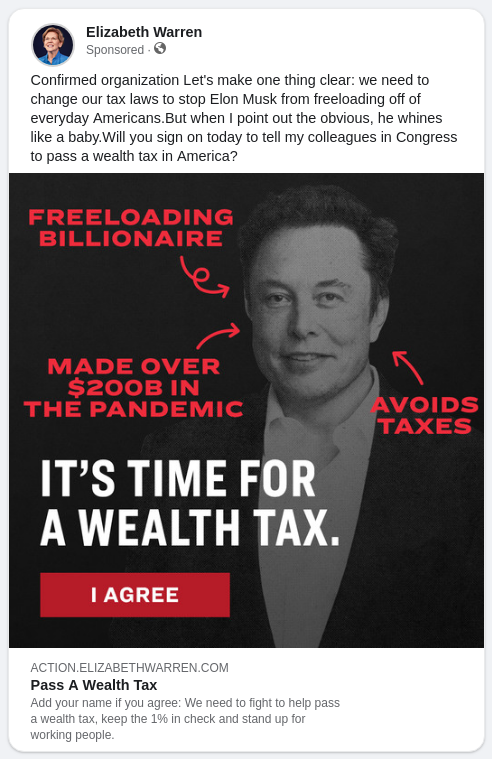
Qualifies
-
•
References to any political candidates or figures
-
•
References to any bills, laws, legislation, etc.
-
•
Petitions, causes, events, or fundraisers that are politically affiliated or motivated
-
•
References to political parties
Does not qualify
-
•
Ads for political merchandise, e.g. t-shirts
-
•
Religious ads
B.9 Neutral
Definition Ads that simply seek to advertise a product, service, local event, apolitical news etc. Ads that don’t fall into other categories, and seem benign based on their impact on users, should be marked Neutral. This code is mutually exclusive from all others.

Qualifies
-
•
Product ads
-
•
Services and subscriptions
-
•
News and information ads, from news outlets as well
-
•
Religious ads
-
•
Insurance ads
Does not qualify
-
•
Ads that fit strongly into one of our other specific categories
-
•
Ads with either opportunities or potential harmful outcomes for users