Sketch2Stress: Sketching with Structural Stress Awareness
Abstract
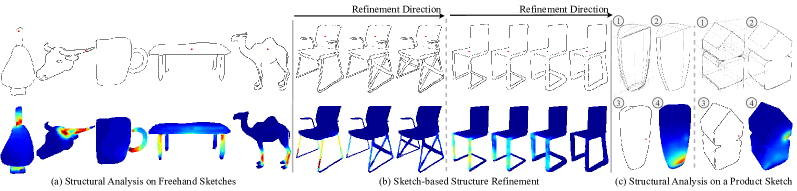
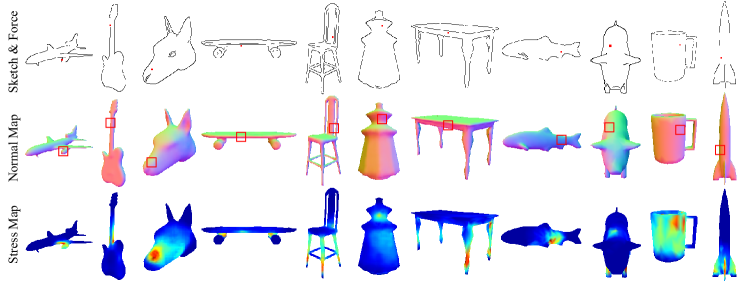
In the process of product design and digital fabrication, the structural analysis of a designed prototype is a fundamental and essential step. However, such a step is usually invisible or inaccessible to designers at the early sketching phase. This limits the user’s ability to consider a shape’s physical properties and structural soundness. To bridge this gap, we introduce a novel approach Sketch2Stress that allows users to perform structural analysis of desired objects at the sketching stage. This method takes as input a 2D freehand sketch and one or multiple locations of user-assigned external forces. With the specially-designed two-branch generative-adversarial framework, it automatically predicts a normal map and a corresponding structural stress map distributed over the user-sketched underlying object. In this way, our method empowers designers to easily examine the stress sustained everywhere and identify potential problematic regions of their sketched object. Furthermore, combined with the predicted normal map, users are able to conduct a region-wise structural analysis efficiently by aggregating the stress effects of multiple forces in the same direction. Finally, we demonstrate the effectiveness and practicality of our system with extensive experiments and user studies.
Index Terms:
sketching, sketch-based image synthesis, digital fabrication.1 Introduction
The design and fabrication process typically begins with sketching on paper, followed by digitization, and eventually, the use of fabrication machineries such as a waterjet, laser cutter, or 3D printer [1]. Conventional structural analysis is used in both the digitization and manufacturing stages in a trial-and-error manner. This is a costly process, in terms of time, labor, and materials. To facilitate product design and digital fabrication, numerous structural analysis techniques [2, 3, 4, 5, 6, 7, 8] have been proposed to simulate the physical environment and directly analyze or optimize digital prototype structures virtually at the digitization stage. The goals of these techniques can be generally categorized into several aspects: weakness analysis [3, 7, 9], structural enhancement [2, 10], inner or surface material optimization [6, 5, 8, 11, 12, 13], and specified properties [14, 5, 15]. While these structural analysis tools enrich product design and fabrication, they are less accessible to designers at the early sketching stage since the effect of external physical factors on an object being designed is unknown to users during sketching.
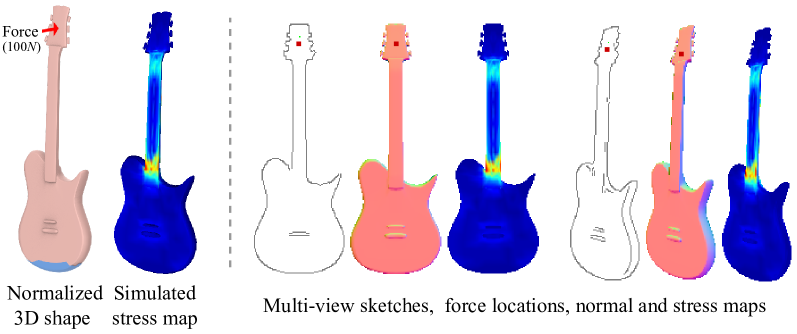
In this work, we study the structural analysis of a sketched object and use the resulting analysis to generate the stress effect of the object under external forces at specified locations, as displayed in Figure 1. Addressing this problem could enable designers to notice the potential structural weakness, specify their design space under different force configurations, and further refine the object at the sketching stage. Furthermore, this will open up possibilities for promoting sketch-based design and diagnosis to non-experts since sketching is an intuitive and universal tool for creativity and expression for novice users.
Since the existing digital structural analysis methods are mainly performed on 3D prototypes, a straightforward strategy to solve our problem might be to first use sketch-based shape reconstruction methods [16, 17, 18, 19, 20, 21, 22], followed by a 3D structural analysis method. However, existing sketch-based shape reconstruction approaches suffer several common limitations. First, they require specified multi-view sketches of the same object as input [16, 17], but their creation is highly demanding for users. Second, when taking a single-view sketch as input, they often demand additional conditions such as camera parameters [20, 21] or 3D deformable templates [19, 22], making it difficult to reconstruct shapes with complex structures from one sketch only. Since 3D shape reconstruction is a difficult task, we are interested in directly performing structural analysis based on only an input sketch and the external force conditions.
While performing a structural analysis method [6] on 3D shapes, we observed that: (i) shapes with similar structures have similar stress distributions under the same external force with the same location, direction, and magnitude; and (ii) on the same shape, neighboring points in local regions undertake similar stress under an external force. This makes it possible to use a data-driven strategy to solve our problem. Therefore, we further transform the problem of sketch-based structural analysis into an image-to-image translation problem [23, 24], where we leverage a neural network to learn the mapping from input sketches to structural analysis results conditioned on external forces.
Since there is no existing dataset for sketch-based structural analysis, we construct a novel sketch-force-stress dataset by first defining rules to normalize and uniform force regions on 3D shapes in the same category based on Observation (i). Based on Observation (ii), we then uniformly sample 200 300 key force locations (sampling more force locations helps increase the accuracy of structural stress map computation for more detailed geometry but would incur heavier computation burdens) on the surface of 3D shapes in each view to analyze their structural soundness rather than exhaustively sampling all the surface points, and apply 3D structural analysis to the shapes, where the external forces are set with equivalent magnitude [6], and finally render multi-view sketches and the corresponding view-dependent stress maps from the 3D structural analysis results. In this way, we collect a large-scale dataset consisting of quadruples of an input sketch, a point map indicating the force location, a normal map recording force directions of all possible forces, and a corresponding structural stress map. Note that inheriting the assumption of [6], we set the magnitude of external forces in our problem to be all the same and set the force directions to be the same as the surface normals (pointing inward) at the force locations. Also, since Ulu et al. [6] rely on the boundary shell to represent the shape structures of 3D models and further approximate the relationship between input forces and resulting stresses on this representation, the same boundary shell representation is inherited implicitly in our assumption for user-designed objects. Therefore, sketched objects corresponding to commonly seen real-world objects might exhibit severely fragile regions (see the ”problematic structure” in Figure 14) since the inner material properties and inter-part connection manners are not considered in the boundary shell setting.
To synthesize a structural stress map from an input sketch conditioned on an external force with arbitrary location and uncertain direction, we present a novel framework combining a one-encoder-two-branch-decoder generator with two discriminators: one branch in the generator is used to synthesize a corresponding structural stress map from the input sketch and the force location; the other branch aims to infer the direction (opposite-normal) of the external force. These two branches jointly guarantee that the generator can perceive the distinctive locations and directions of external forces imposed on sketches. Two discriminators supervise the learning process of the two branches of the generator.
With our trained network, users can easily check the structural soundness of a sketched object under a single force assigned at any location. In addition, a well-known physical axiom states that: ”If two forces act on an object in the same direction, the net force is equal to the sum of the two forces”. Based on this axiom, we present an efficient region-wise sketch-based structural analysis method to approximate the stress effect of the net force at a local region by aggregating the stress maps of multiple forces at different locations but in the same normal direction.
Our contributions can be summarized as follows:
-
•
To the best of our knowledge, we are the first to study the problem of sketch-based shape structural analysis.
-
•
We introduce a novel two-branch generator to learn the mapping from a user-drawn sketch conditioned on the external force variables to a structural stress map.
-
•
We present a sketch-based structural analysis interface that supports structural weakness detection and structural refinement on sketches.
-
•
We collect a large-scale sketch-based structural analysis dataset containing millions of sketch-force-stress data triplets spanning 11 shape categories. We will release the data and code to the research community.
2 Related Work
In this section, we review the previous works closely related to us, namely, 3D structure analysis, sketch-based shape reconstruction, and image-to-image translation.
2.1 3D Structure Analysis
Various recent works support computational analysis on the structural soundness of 3D shapes. Especially with the emergence of 3D printing techniques, numerous approaches were proposed for printed objects in a wide range of tasks, from structural weakness detection [6, 2, 3, 7] to material optimization [5, 8, 11, 12, 13]. Since it is challenging to convey the variations of materials from one sketch, we do not review the material-oriented approaches.
The first structural analysis work for 3D printed objects dates back to [26], where Telea and Jalba identify thin and thick parts and estimate whether a thin part could support its attached parts under several pre-defined geometric rules. Later, Stava et al. [2] use FEM (finite element method [27]) to discover and strengthen problematic components of a printed model under the applied gravity load and 2-finger gripping loads. Then Zhou et al. [3] propose an analysis technique to predict fragile regions under worst-case external force loads by identifying potential regions of a structure that might fail under arbitrary force configurations. Later, Langlois et al. [9] present a stochastic FEM for predicting failure probabilities under the force loads at contact regions. Different from previous works with specified force load settings, Ulu et al. [6] propose a more general structural optimization approach that examines 3D shapes with any force loads at arbitrary locations and computes a feasible material distribution to withstand such forces. Different from 3D prototypes, sketches are usually created in the 2D space with sparse content. This makes it difficult to apply finite element analysis, which is the basic technique for most 3D structural analysis approaches. To model the relationship between the input forces and the corresponding structural stress of the sketched objects, we translate the sketch-based structure analysis problem to the data-driven image-to-image translation task where we learn the mapping between the input sketches and the structural stress responses conditioned on the variable external forces from massive sketch-force-stress data triplets.
2.2 Sketch-based Shape Reconstruction
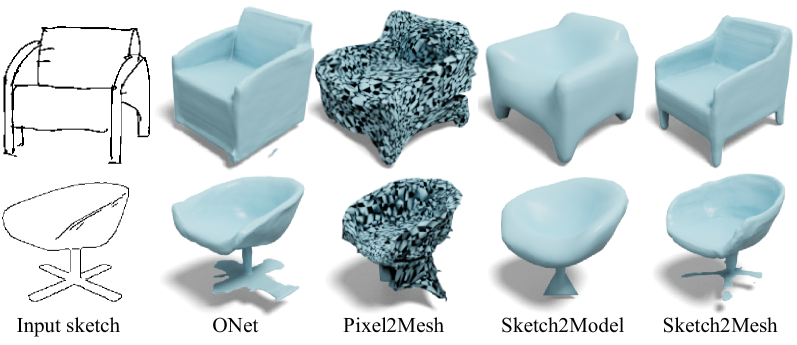
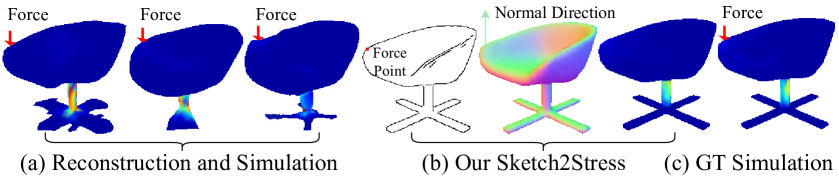
Using an additional step to convert input sketches to intermediate 3D shapes with sketch-based shape reconstruction approaches usually requires extra conditions such as multi-view inputs, camera parameters, and 3D category templates, which are lacking in our scenario. Figure 2 further displays the limitations of state-of-the-art single-view sketch-based shape reconstruction methods. The 3D meshes generated by ONet [25] and Pixel2Mesh [22] have obvious artifacts, like detached parts and inverse patches, which prevent performing FEM requiring continuous and closed input 3D surfaces. The meshes generated by Sketch2Model [20] lose too many geometry details. For Sketch2Mesh [21], its bottom reconstructed mesh has not only broken parts but also inconsistent legs compared with the input sketch. Hence, none of these approaches could perform shape reconstruction from sketches robustly. Therefore, we turn to image-to-image translation techniques to directly generate a feasible 2D structural analysis result for an input sketch. To demonstrate the faithfulness and effectiveness of our sketch-based structure analysis approach, we provide a direct comparison between our Sketch2Stress approach and the reconstruction-and-simulation approach applying stress simulation [6] on generated meshes (Figure 2) by ONet/Sketch2Model/Sketch2Mesh after post-cleanup. Compared with the reconstruction-and-simulation results, as shown in Figure 3, our method can reconstruct a view-dependent structure robustly and is more competent for the sketch-based structure analysis task than the reconstruction-and-simulation way.
2.3 Image-to-Image Translation
Since Isola et al. [23] and Wang et al. [24] introduced the general-purpose cGAN frameworks for diverse types of inputs, e.g., realistic images, sketches, and semantic masks, there are many sketch-based image synthesis tasks using image-to-image translation techniques. The most related to ours are 3D-aware approaches [28, 29] with sketch inputs. For instance, Su et al. [28] present an interactive system for high-quality normal map generation. Later, Jiao et al. [29] propose a joint framework that leverages category and depth information to improve shape understanding for tactile sketch saliency prediction. However, the aforementioned methods cannot be directly applied to our problem since they have no proper way to represent the external forces with their designed frameworks.
Recently, diffusion models [30, 31, 32] have been used to obtain state-of-the-art results in text-to-image synthesis and text-guided image editing [33, 34, 35]. The aforementioned diffusion models commonly rely on a Markov chain of diffusion steps to generate high-quality images from noises. Despite the impressive and realistic generation performance of the aforementioned methods, it is still challenging for diffusion models to impose precise spatial control on the generation outputs due to the nature of the one-to-one mapping between noise vectors and the corresponding ground-truth data samples. This limitation makes diffusion models unsuitable for our problem, which requires precise and faithful control over force locations. Additionally, diffusion models generate images from noise vectors through iterative intermediate steps during the inference (denoising) stage, consuming more time than these image-to-image networks [23, 24]. Therefore, existing diffusion models might not be suitable for our real-time editing scenario.
3 Methodology
In this work, we focus on the study of structural analysis of sketched objects under external forces at user-specified locations. Adapting the structural analysis task from informative 3D objects to 2D sketches is nontrivial due to the ill-posed nature of sparse sketches to represent continuous and closed 3D surfaces as well as the challenge of representing external forces applied to the sketched objects. To address these issues, we simplify the problem and make our assumptions as follows: (i) We decouple the external forces to the constant force magnitude of and directions based on the estimation of a normal map (the force direction and the normal direction at the force location are opposite in our approach, as shown in Figure 3 (b)). (ii) Then we utilize an effective data-driven way to approximate the mathematically/physically precise stress by constructing a novel large-scale sketch-force-stress dataset and proposing a new two-branch (for force location and direction) generation pipeline (see Figure 4). (iii) Note that the materials of the sketched objects are assumed to be the same with linear isotropic materials and small deformations, following [6].
To faithfully represent the external forces applied to sketched objects, we utilize a set of 2D point maps to specify the force locations (one point map for each force location) and a 2D normal map of each view of an object to record the force direction at the corresponding location . In this way, we decouple the original 3D external forces into the above 2D representations that can be further treated as conditions for mapping the input sketches to the corresponding stress maps . Let denote the set of normal maps.
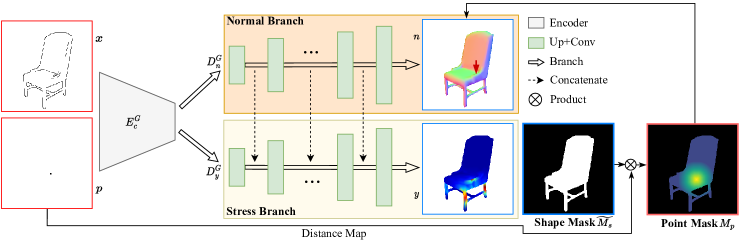
As illustrated in Figure 4, Our framework for sketch-based structural analysis consists of two components: (1) a two-branch generator , including a common sketch-force encoder and two separated decoders and for the normal map and the stress map , illustrated in Figure 4, and (2) two multi-scale discriminators and for normal and stress maps. Specifically, given an input sketch and the condition of a point map, the common encoder of our two-branch generator constructs a joint feature space for the input sketch and the input point map. The subsequent two decoders (7-layer up-sampling and convolution) and infer the correct normal directions and a feasible structural stress map from this joint feature space, respectively. These two branches enforce that the common encoder should learn a joint feature representation that captures not only the geometry and normal directions of the input sketch but also the distinctive force location on the input point map. Note that the feature maps in the normal decoder are layer-wise concatenated to the stress decoder to enrich its structure perception. Finally, the two multi-scale discriminators distinguish real images from the translated ones at , , and scales. This is a standard way to represent distinctive, fine-grained details in images [24]. Finally, we jointly optimize G, , and with the following GAN loss:
| (1) |
where , , , and refer to the quadruple of an input sketch, a point map, a normal map, and the corresponding stress map.
Shape Constraints. To overcome the issue that the generated pixels are often outside of the shape boundary of the sketched objects in the stress maps, we further predict a one-channel shape mask (Figure 4) from the joint feature space . This shape mask is also useful for reducing shape ambiguity in normal map generation. Therefore, we use a shape loss to measure the distance between a generated shape mask and the ground truth, as formulated below:
| (2) |
Force-point Constraints. To emphasize the importance of a force location in the point map, we compute a point attention map by multiplying a point-centered distance map 111This is computed by , where and are the locations of every spatial point and the force point of a point map, respectively. , , and are a set of all pixels in the point map, Euclidean distance, and the largest distance between and , respectively. (emphasizing the spatial importance of regions that surround the assigned force point) with the shape mask. We multiply this attention map respectively with the normal map and the stress map to ensure that the synthesized stress and normal directions surrounding this force point should be consistent with the ground-truth values as much as possible. Here, we design a loss term to compute the distance of the generated stress and normal maps compared with their respective ground truths inside the regions , as defined below.
| (3) |
Therefore, our final objective function is formulated as follows:
| (4) |
where we set , , and in our experiments. The aforementioned setting achieves the best performance to balance the impact of different losses in our experiments. Increasing , , and individually would force the network to partially focus on the different components, i.e., the quality of the generated normal map and stress map, or the predicted shape mask, respectively.
3.1 Sketch-Force-Stress Data Rendering
To learn our network for sketch-based structural analysis, we need a considerably large dataset of training data. However, such a dataset is not available and expensive to acquire since it requires point-wise labeling for external forces and corresponding stress responses on the sketches. Hence, we propose to synthesize the sketch-force-stress data from existing 3D repositories, as shown in Figure 5.
We first collect 3D shapes from several public shape repositories, including ShapeNet [36], AniHead [37], and COSEG [38]. We convert 3D objects to watertight surfaces with [39] to make it ready for the subsequent 3D structure analysis. We then orient all 3D shapes uprightly [40], move them onto the ground plane (for fixing their bottom on the ground plane), and normalize them to a standard sphere. To normalize and uniform the force regions of different 3D shapes with diverse structures, for shapes in the same category, we use the same ratio (0.02% 0.04%) to define regions on 3D surfaces near the ground plane as fixed boundary conditions and the rest as contact regions allowing for any external forces (of magnitude), as illustrated in Figure 5. Given each 3D shape, we uniformly sample force locations on its contact regions and adopt the structural analysis approach in [6] to simulate the stress responses on the shape’s surface under such forces in opposite-normal directions. Finally, we render the multi-view sketches, normal maps, force locations, and corresponding structural stress values from the simulated 3D stress results. All of the above renderings are projected in the spatial resolution. The synthetic multi-view sketches are extracted from 2.5D normal maps using the Canny edge detector [41]. We project the 3D stress results with the azimuth angles of [] degrees and the elevation angles in () degrees.
Since the magnitude of the simulated stress values spans an extremely large range from ten to ten million, we further normalize the structural stress values to a common space in two manners: One is a shape-grained normalization to compare the fine-grained regional stress among single shapes; the other is a category-grained normalization to compare more general-grained shape stress among all the shapes in the same category.
Shape-grained Normalization. As mentioned before, similar shape structures tend to have similar weak regions under the same external forces. To highlight such region-wise stress similarity, we normalize the stress values inside each shape, as formulated below:
| (5) |
where is an index for points in the contact regions of a 3D surface, and is a stress value at the -th point.
Category-grained Normalization. To study the general pattern (knowledge) of how different shape structures respond to the same external forces, we normalize the stress values of all the shapes in the entire dataset as Equation 6.
| (6) |
where is the index of points in the contact regions on 3D surfaces, and and are the mean and standard variance of the entire stress value set, respectively. is the upper boundary of the 99% stress value. Since stress values in are smaller than , we use as the upper boundary to filter out the stress with extremely high values, such as , , etc. Note that the resulting stress values in have some negative values, indicating the extremely low-stress regions. Since we are interested more in the high-stress regions (fragile regions), we clip the positive value () in for further processing.
3.2 Region-wise Multi-force Aggregation
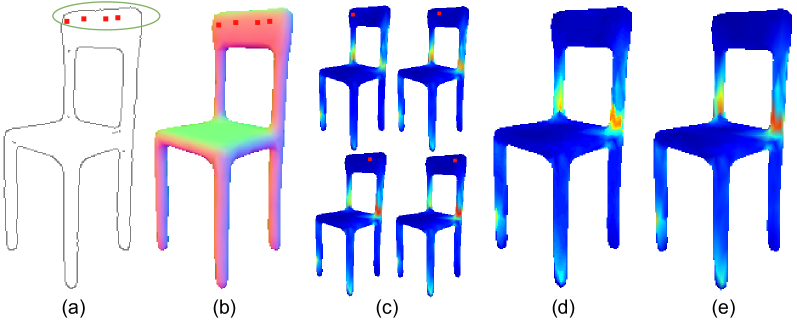
With our trained network, users can easily explore the structural stress anywhere under a manually-assigned force location by clicking on the sketched object. To further improve the efficiency of structural analysis on input sketches, we provide a region-wise analysis method that aggregates the stress effects of multiple forces in a small region along the same normal directions. After the user specifies a small region on a sketch (Figure 6 (a)), with the predicted normal map, we automatically compute the force locations that have the same normal direction as the center point of this region (Figure 6 (b)). Then we directly add and average these stress effects (Figure 6 (c)) together following the physical axiom in Section 1 and produce an aggregated stress map (Figure 6 (d)). Compared with a 3D simulated result (Figure 6 (e)), although the overall stress effect in our aggregated stress map is diluted to some extent, it can still approximate the stress distribution of the 3D simulated result well and can thus be utilized as guidance for fragile detection.
3.3 Structural-Stress Awareness Replacement and Interpolation
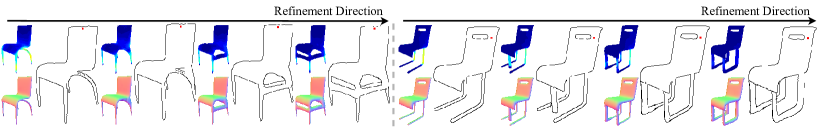
To demonstrate the sensitiveness of our Sketch2Stress to the variations in sketch structures, such as the significant structure changes (Figure 7 (a)) and the more subtle geometry interpolations (Figure 7 (b)), we first decompose an example chair into parts and then replace the original chair legs with legs featuring significantly varied geometries and by linearly interpolating the thickness values of the original chair legs, respectively. Note that we keep the other parts of this example chair unchanged in these two tasks.
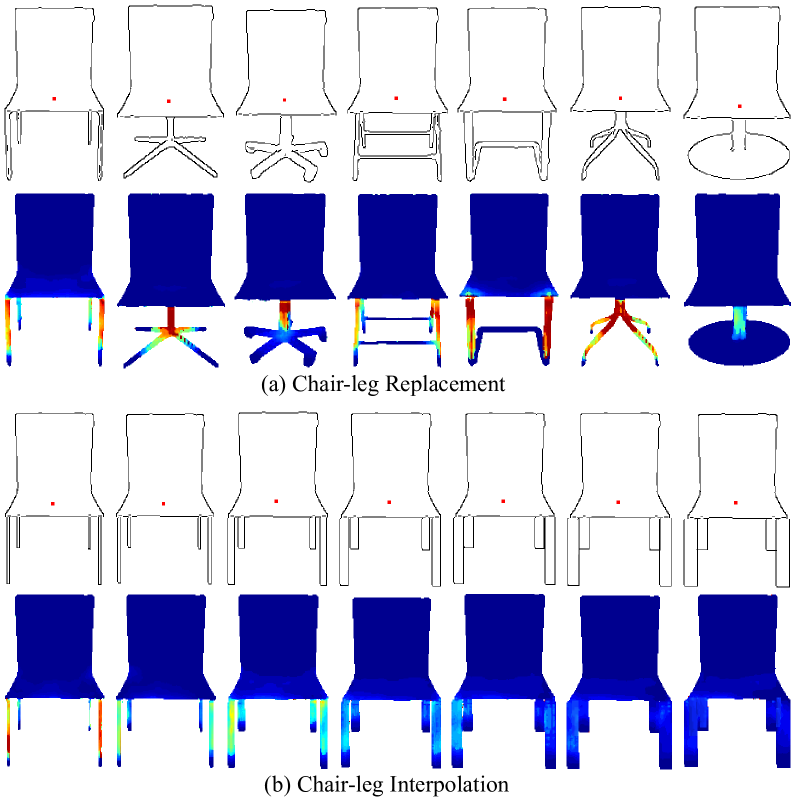
As shown in Figure 7 (a), the results are in line with our expectation that our well-trained Sketch2Stress is natural to perceive the structural soundness among highly changeable structures and identify corresponding fragile regions. Figure 7 (b) further demonstrates our Sketch2Stress algorithm’s capability in perceiving the tendency of thickness increment, distinguishing the subtle differences among highly similar structures, and generating the smooth stress distributions for those interpolated structures. This could facilitate a sketch-based structural soundness suggestion task, where users could easily improve the structural soundness of their created sketches with our Sketch2Stress tool combined with the replacement and interpolation operations.
3.4 Sketching Interface
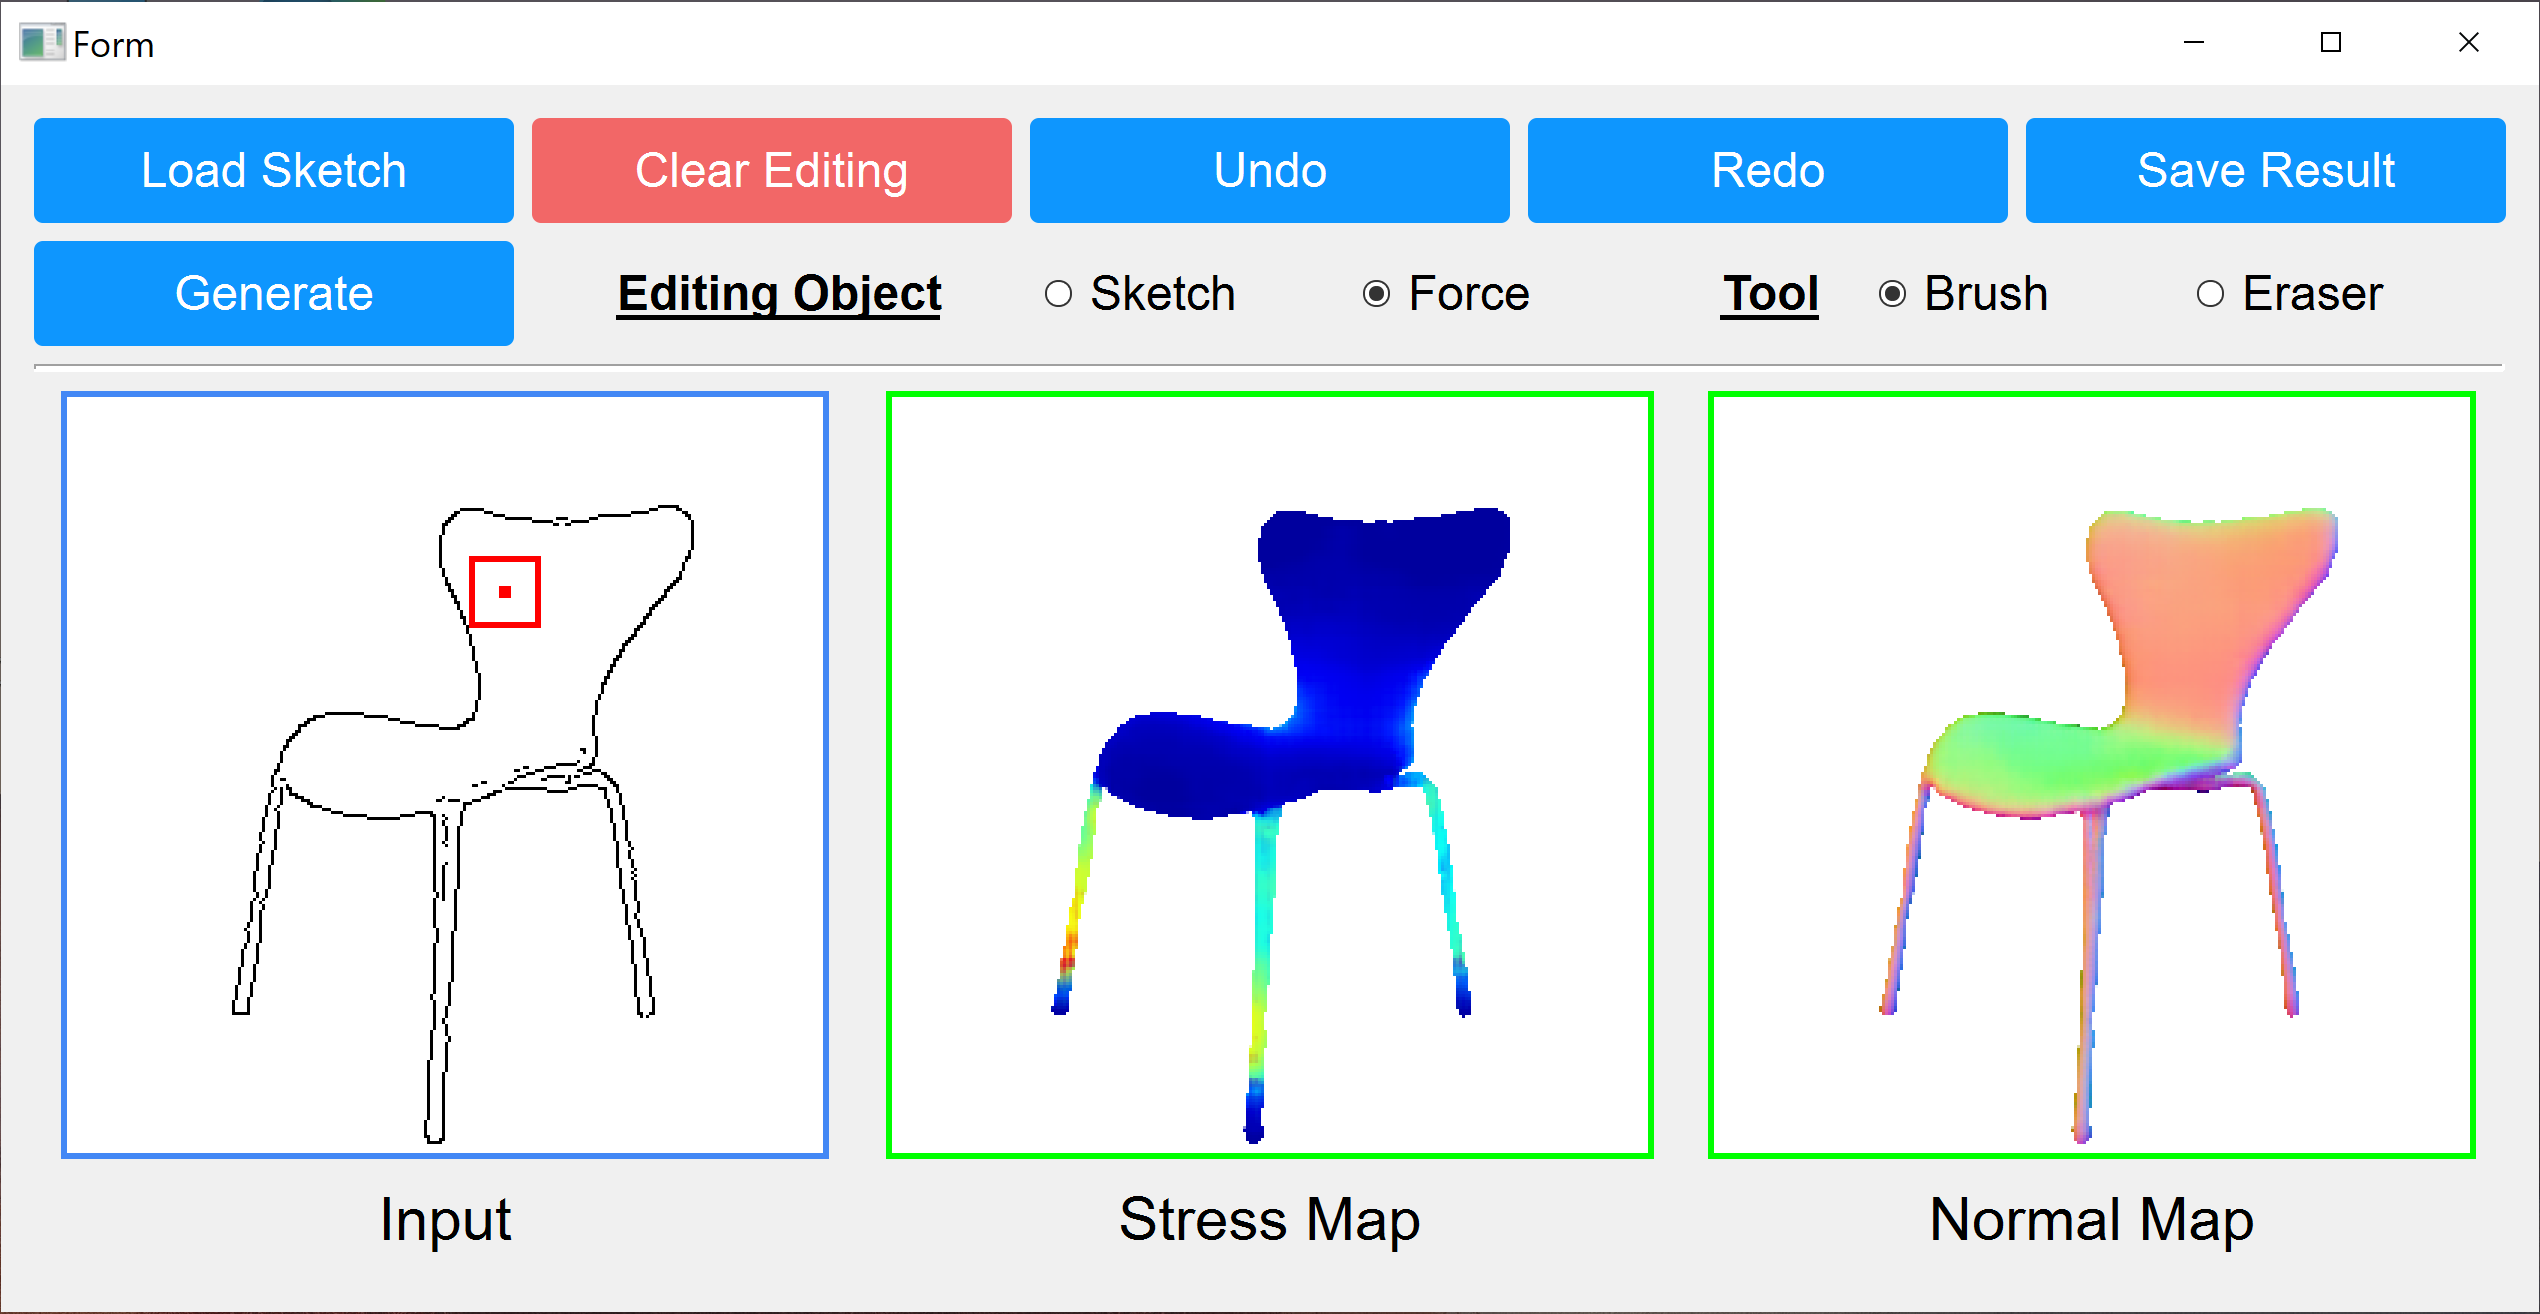
To illustrate how our proposed method aids users in analyzing and strengthening the structural weakness of their sketched objects under external forces, we design a simple interface (Figure 8) for users to interactively edit sketches, assign external forces at specific positions to examine the stress effects, and refine their design.
Our system has two modes (named the sketching mode and the simulation mode), and they can be selected through the “Sketch” and “Force” radio buttons. In the sketching mode, users can load their drawn sketches or directly create one from scratch in the “Input” region. We also provide several basic drawing tools for users to edit their drawings, such as clear, undo, and redo. After finishing one complete sketch, users may change to the simulation mode. In this mode, users can freely impose external forces at desired positions by clicking on their drawn sketch and examine the potential weaknesses through the simulated structural stress map and the normal map. The auxiliary normal map provides clearer (2.5D) shape details for designers than the input sketch and the predicted stress map (most regions are in the same color, deep blue, providing limited shape details), as observed in the middle and bottom rows in Figure 9. During the structure refinement process, the generated normal map can greatly help users to iteratively improve their original drawings at a fine-grained level with its provided shape details. By iteratively using these two modes, designers can create their desired shapes that are also structurally sound under certain external forces.
4 Experiments
We evaluate our approach on 11 shape categories with a large variety of geometry and structure, as shown in Figure 9. The 3D shapes used for sketch rendering and force-conditioned structural stress simulation are collected from the existing 3D shape repositories including ShapeNet [36], COSEG dataset [42], and AniHead dataset [37]. In total, our synthetic dataset contains over 2.7 million sketch-force-stress data pairs with clear point-wise force annotations. The dataset spans 11 categories, namely, chairs (1.5 million), tables (0.7 million), airplanes (0.4 million), vases (22K), mugs (15K), skateboards (24K), rockets (4K), guitars (9K), fishes (2.6K), four-leg animals (13K), and animal heads (78K). After data augmentation, our collected data is able to train our neural network with satisfying generation quality. We provide more details of the data distribution of our sketch-to-stress dataset in Table I.
| Category | #Shape | #Views | #Sketches | #Force-points | #Stress-map |
|---|---|---|---|---|---|
| Chair | 4,277 | 3 | 12,831 | 1,523,390 | 1,523,390 |
| Table | 3,656 | 3 | 7,312 | 715,566 | 715,566 |
| Airplane | 2,231 | 3 | 6,693 | 403,926 | 403,926 |
| Vase | 184 | 1 | 184 | 22,824 | 22,824 |
| Mug | 164 | 1 | 164 | 15,840 | 15,840 |
| Skateboard | 134 | 3 | 402 | 24,471 | 24,471 |
| Rocket | 49 | 1 | 49 | 4,291 | 4,291 |
| Guitar | 39 | 2 | 78 | 9,186 | 9,186 |
| Fish | 20 | 1 | 20 | 2,640 | 2,640 |
| Fourleg | 42 | 3 | 126 | 13,181 | 13,181 |
| AniHead | 208 | 3 | 624 | 78,528 | 78,528 |
4.1 Implementation Details
We implemented our Sketch2Stress with the PyTorch framework [43] and used the Xavier initialization [44]. We show the parameter structures of the two-branch generator of Sketch2Stress in the supplemental materials. The entire pipeline of our Sketch2Stress was trained on an NVIDIA TITAN Xp GPU and optimized by the Adam optimizer (1 = 0.9 and 2 = 0.999) with the learning rate of . Here we trained our models to full convergence until the learning rate decayed to relatively small. Note that training takes 24 48 hours on a single GPU with a batch size of 16 for one category on average. The iteration epochs are set to for those categories with a large number of training samples, namely, Chair, Table, and Airplane. For the rest categories, we set the training epochs to , which is sufficient to achieve the satisfying generation performance in our experiments. Although it takes a long time to train our Sketch2Stress during the training stage due to the large size of training samples, the well-trained two-branch generator of Sketch2Stress only spends around seconds on average to infer a structural stress map for an input sketch under a specified force.
4.2 Performance Evaluation
Here we compare our method with two image-to-image baselines, i.e., pix2pix [23] and pix2pixHD [24], quantitatively and qualitatively. We then perform an ablation study to illustrate the improvement provided by each key component in our method. Finally, we use three user studies to demonstrate the practicality of our proposed method.
4.2.1 Qualitative Evaluation
In Figure 9, we illustrate a number of stress maps generated from input sketches under user-specified external forces using our method. It demonstrates the robustness of our method for input sketches with diverse geometry.
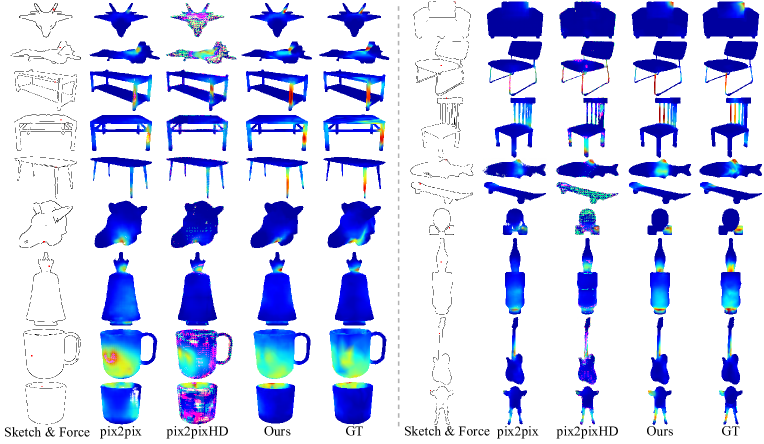
We also provided visual comparisons to pix2pix and pix2pixHD trained on our sketch-force-stress data in Figure 10. In comparison with the ground truth, it can be easily seen that our method achieves the best generation quality. Among the results generated by pix2pixHD, we see obvious high-frequency noises. It is because the VGG loss pre-trained on the high-frequency natural images in pix2pixHD cannot well measure the feature difference of the low-frequency stress maps. Compared with the chair category, the airplane has less training data, making the performance of pix2pixHD significantly worse. pix2pix tends to lose the detail control of local regions during generation, especially surrounding the force locations. More specifically, pix2pix usually fails to synthesize correct colors for the higher-stress regions but only flattens or diffuses these regions with background low-frequency colors, as shown in airplanes, chairs, animal heads, tables, and vases in Figure 10. Please find more qualitative results in the supplemental materials.
| Category | Method | MAE | EMD | FID | FM |
|---|---|---|---|---|---|
| Chair | pix2pix | 9.494 | 0.606 | 28.346 | 0.275 |
| pix2pixHD | 11.018 | 1.316 | 75.852 | 0.186 | |
| Ours | 9.251 | 0.374 | 15.083 | 0.412 | |
| Airplane | pix2pix | 1.834 | 0.106 | 7.380 | 0.438 |
| pix2pixHD | 5.058 | 1.553 | 184.201 | 0.061 | |
| Ours | 1.716 | 0.079 | 3.903 | 0.517 | |
| Table | pix2pix | 9.589 | 0.405 | 24.405 | 0.329 |
| pix2pixHD | 12.345 | 0.701 | 55.440 | 0.204 | |
| Ours | 9.343 | 0.321 | 10.421 | 0.434 | |
| Vase | pix2pix | 8.520 | 0.396 | 42.908 | 0.395 |
| pix2pixHD | 8.653 | 0.493 | 63.969 | 0.322 | |
| Ours | 7.303 | 0.225 | 31.647 | 0.546 | |
| Skateboard | pix2pix | 3.401 | 0.253 | 51.883 | 0.168 |
| pix2pixHD | 6.274 | 1.731 | 315.004 | 0.044 | |
| Ours | 3.120 | 0.091 | 25.563 | 0.341 | |
| Rocket | pix2pix | 4.251 | 6.011 | 72.085 | 0.029 |
| pix2pixHD | 8.168 | 4.848 | 215.600 | 0.025 | |
| Ours | 3.645 | 0.344 | 54.561 | 0.414 | |
| Guitar | pix2pix | 6.779 | 0.830 | 34.000 | 0.242 |
| pix2pixHD | 10.052 | 4.478 | 166.893 | 0.038 | |
| Ours | 4.983 | 0.188 | 31.481 | 0.455 | |
| Mug | pix2pix | 24.116 | 1.321 | 43.275 | 0.321 |
| pix2pixHD | 25.637 | 2.362 | 112.037 | 0.205 | |
| Ours | 21.209 | 0.399 | 26.421 | 0.541 | |
| Fourleg | pix2pix | 7.261 | 0.704 | 76.126 | 0.263 |
| pix2pixHD | 7.176 | 0.664 | 128.312 | 0.215 | |
| Ours | 6.890 | 0.250 | 46.609 | 0.498 | |
| Fish | pix2pix | 10.988 | 6.891 | 124.301 | 0.098 |
| pix2pixHD | 7.094 | 1.804 | 178.352 | 0.123 | |
| Ours | 6.209 | 0.174 | 44.758 | 0.478 | |
| AniHead | pix2pix | 10.399 | 0.396 | 52.854 | 0.418 |
| pix2pixHD | 9.022 | 0.650 | 117.058 | 0.290 | |
| Ours | 8.535 | 0.266 | 27.837 | 0.506 |
4.2.2 Quantitative Evaluation
In the study of sketch-based structural analysis, we focus not only on the generation quality but also on the pixel-level stress accuracy of generated results, compared with the ground truth. We adopt four metrics to comprehensively evaluate the performance of different methods and compare their generated stress maps with the corresponding ground truth, namely, mean absolute error (MAE), F-Measure (FM), earth mover’s distance (EMD), and Fréchet inception distance (FID). The former two metrics are used for the pixel-wise stress accuracy measurement, and the latter two are for the image quality evaluation. We report the quantitative evaluation results of the aforementioned methods on all eleven categories in Table II. Note that we test the compared methods on the unseen data. For instance, the test data for Chair and Airplane contains 100 shapes and 60 shapes with and force samples, respectively.
From Table II, we observe that our method yields overall better image generation quality while achieving significant improvements in pixel-level stress accuracy compared to the competitors. Compared to our approach, pix2pix struggles to accurately predict stress regions surrounding the user-specified force locations, resulting in compromised image quality (FID and EMD values) and pixel-wise stress accuracy (MAE and FM values). For pix2pixHD, its generated stress maps contain too many high-frequency noises (see the qualitative results in Figure 10), leading to its poor performance in metrics associated with image generation quality (EMD and FID values) and pixel-wise stress accuracy (MAE and FM values). Although the value of the four metrics fluctuates across different categories due to the different data amounts of training data, our proposed method remains consistently superior to the competitors in the sketch-based structure analysis task.
| Category | Method | MAE | EMD | FID | FM |
|---|---|---|---|---|---|
| Chair | w/o Normal Branch | 9.494 | 0.606 | 28.346 | 0.275 |
| w/o Shape Mask | 9.490 | 0.390 | 14.718 | 0.402 | |
| w/o Point Mask | 9.366 | 0.378 | 15.092 | 0.415 | |
| w/o GAN Loss | 9.289 | 0.387 | 15.265 | 0.392 | |
| Full | 9.251 | 0.374 | 15.078 | 0.412 | |
| Airplane | w/o Normal Branch | 1.834 | 0.106 | 7.380 | 0.438 |
| w/o Shape Mask | 2.301 | 0.126 | 4.456 | 0.457 | |
| w/o Point Mask | 1.804 | 0.078 | 4.227 | 0.514 | |
| w/o GAN Loss | 1.803 | 0.079 | 6.782 | 0.486 | |
| Full | 1.716 | 0.079 | 3.903 | 0.517 | |
| Guitar | w/o Normal Branch | 6.779 | 0.830 | 34.000 | 0.242 |
| w/o Shape Mask | 5.946 | 0.253 | 34.762 | 0.409 | |
| w/o Point Mask | 5.178 | 0.192 | 32.982 | 0.438 | |
| w/o GAN Loss | 4.993 | 0.194 | 35.037 | 0.436 | |
| Full | 4.983 | 0.188 | 31.481 | 0.455 |
4.2.3 Ablation Study
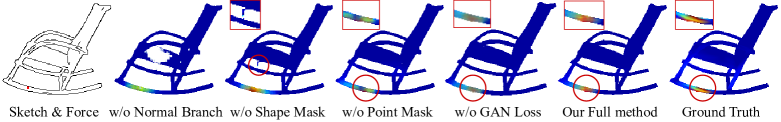
To evaluate the effects of the key components (namely, normal branch, shape mask, point mask, and GAN loss) of our approach, we present both the quantitative comparison of the ablation results in Table III and the qualitative comparison in Figure 11. Note that we report the quantitative comparison of our ablated methods on the chair, airplane, and guitar categories, which were chosen based on their highly varying levels of diversity, complexity, and number of training structures. From Table III, we observe that removing the normal branch (the supervision on force directions and 2.5D shape information), as expected, has a noticeable effect on the four metrics, leading to a significant drop in image generation quality and pixel-level accuracy (also see Figure 11). Without the shape mask, our approach’s performance shows a heavy decrease in the four metrics. This mask plays a critical role in regularizing the shape boundary of the generated images while also reducing the outlier noises, such as the outlier defects below the chair seat in Figure 11. In terms of the point mask, we observed a slightly poorer performance on the three categories if this component was removed. As shown in Figure 11, our method tends to lose fine-grained control over regions surrounding the force point without the point mask. After removing the GAN loss, our approach fails to learn the distribution of high-frequency pixels and produces an over-smoothed effect over high-stress regions.
In summary, our approach relies primarily on normal maps to perceive the underlying 3D shape structures and infer the surface stress. The shape mask is the second most important component in supervising the shape boundaries of generated stress maps. Then, the point mask plays a vital role in guaranteeing the region consistency surrounding the force points. Finally, the GAN loss constrains the distribution of the high-frequency pixels (high-stress regions) in the generated stress maps. In our approach, the shape mask affects the stress map indirectly by regularizing the shape boundaries in normal maps directly while the point mask and the GAN loss influence the final stress map directly during the generation process.
4.3 User Studies
To validate the practicality of our proposed sketch-based analysis tool, we design three user studies. The first study is the sketch-based weakness analysis to help users to analyze and summarize weak regions on their freely drawn sketches. The second study is the sketch-based structural refinement to help users to refine the structures of given sketches based on our computed stress maps. The third study examines the usefulness of our Sketch2Stress tool in assisting designers by providing them with structural stress awareness during the structure refinement process. Thus, we deploy a controlled task where designers are asked to refine the same problematic structures under the specified force conditions. During the trials, they are requested to refine the structure twice; first, without our Sketch2Stress tool, relying on their intuitions and experience, and second, with our tool. We invite 9 volunteers to participate in our user studies. Two of them were professional interior designers with years of drawing experience, and one was a new media artist, and the rest were postgraduate students aged 26 to 29 with no professional drawing skills.
4.3.1 Sketch-based Weakness Analysis
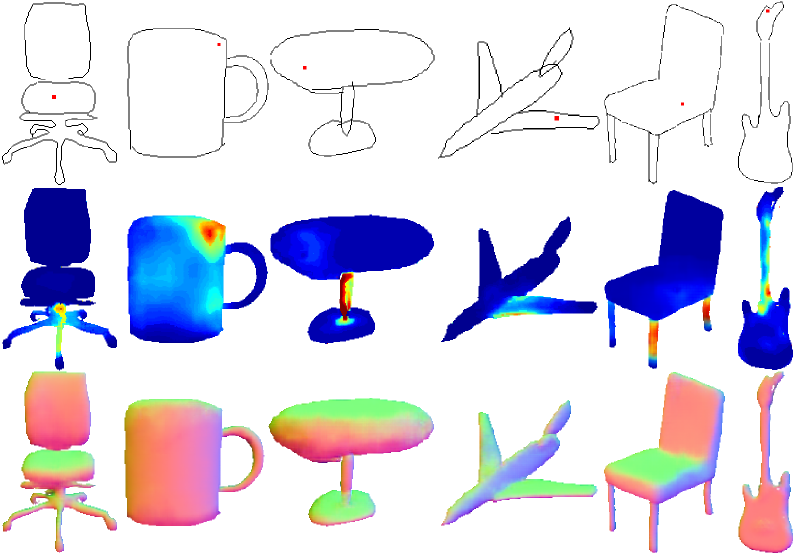
In this study, we invite the participants to sketch their interested shapes among our prepared categories freely, with our interface, and let them figure out the fragile structural weakness by clicking on the sketched objects. After examining their own sketched objects, we require users to summarize their analysis process and answer one question “Which kinds of regions of a shape are the potential or possible weak regions?”. Their answers to this question are ”joint regions, thin structures, non-straight legs, and single legs with variable thickness”. We showcase representative freehand sketches with the user-assigned forces, the corresponding stress maps, and the inferred view-dependent 3D structures in Figure 12. Although the viewpoint of the freely sketched airplane in Figure 12 is quite different from training samples (Figure 9) in our dataset, our Sketch2Stress is still able to infer a faithful view-dependent structure and a feasible stress map for the input.
4.3.2 Sketch-based Structure Refinement
As the chair category exhibits the most complex shape structures, in this study, we invite all the participants to refine and enhance two initial chair structures with weak or problematic regions undertaking higher stress (see the regions with warmer and lighter colors in Figure 13) among the whole dataset. During the refinement process, we do not provide any suggestions and ask users to refine the structure based on the guidance of the computed stress map in our interface. We illustrate the refinement process of two representative sketch-based structure refinements from users, as shown in Figure 13. We also display the generated stress maps and normal maps besides the refined sketches at each time step in Figure 13.
Through the previous two studies, we show that both novice users and designers can easily identify the weak regions that sustain higher stress under the specified external forces with our proposed method. Our method also provides an effective way for users to interactively enhance their created shape structures by step-by-step refinement with our generated stress maps. However, people might be quite interested in how useful our Sketch2Stress tool is for these professional designers with years of design experience. So we further deploy the following controlled trials to answer this question.
4.3.3 Controlled Trials: Structure Refinement with or without Sketch2Stress
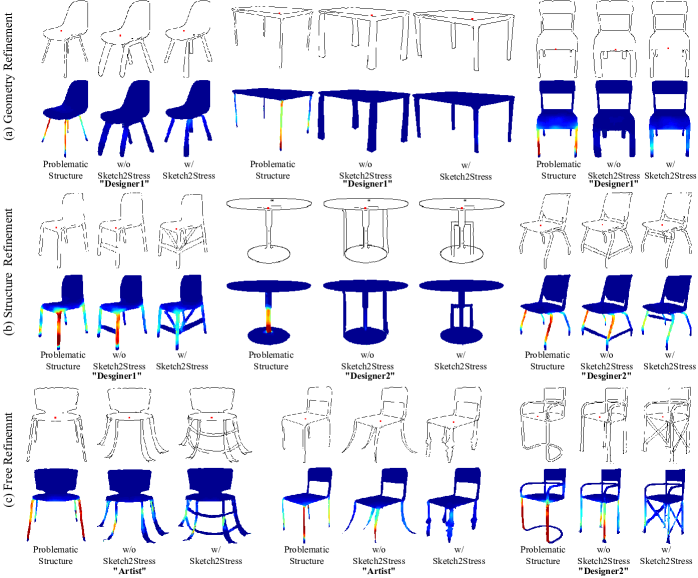
In this study, we invited two professional designers and one artist among the previous study participants and asked them to refine problematic sketch structures as much as possible. In the beginning, we showed the participants both a problematic sketch and its stress map which indicates the weak regions of these fragile structures (see ”problematic structures” in each triplet in Figure 14).
In conventional refinement tasks, designers are commonly requested to respect the original geometry (like the thickness for simplicity) and structure as faithfully as possible. Our sketch-based structure refinement task also follows the same rule. However, in our scenario, drastically changing the original structure by adding extra structures also works for improving the structural soundness, so we further customize and define our own requirements for different types of refinements as shown in Figure 14: (a) Geometry refinement: participants are only allowed to adjust the thickness of the fragile parts to improve the problematic structure without changing the original structures. (b) Structure refinement: participants are only allowed to change structures but not modify the thickness of the original structures. (c) Free refinement: participants are allowed to edit both the geometry and the entire structures.
In the first trial, guided by the requirements stated previously, the participants were asked to heal these weak regions with their own learned knowledge, design experience, and intuitions but without our Sketch2Stress. Although three participants used our Sketch2Stress tool in the previous two user studies and learned where might be the potential regions and how the problematic structures were iteratively improved with our tool, we are still interested to know how well the participants could use the learned knowledge and fix the novel problematic cases by themselves. During this process, the participants were allowed to edit the problematic sketch structures multiple times following the different refinement requirements until they were satisfied. Note that we did not update the stress maps during this refinement process. The final refined sketches and their corresponding stress maps of the first trial can be seen in Figure 14 (”w/o Sketch2Stress” in each triplet). In the second trial, we allowed the participants to refine the problematic structure obeying three refinement requirements with our Sketch2Stress tool. During this process, we provided an instant response in the form of a stress map after each editing operation. The final sketch refinements and their corresponding stress maps from the second trial can be seen in Figure 14 (”w/ Sketch2Stress”).
Through the controlled trials, we found that relying solely on designers’ experience without our Sketch2Stress tool could only mildly relieve the weak regions’ stress or sometimes worsen the situation. For example, in geometry refinement (Figure 14 (a)), the designers usually attempted to thicken these thin legs as much as possible. However, this is not the optimal way to strengthen problematic regions meanwhile not modifying the original geometry too much. While our Sketch2Stress tool can help the designers and the artist to iteratively adjust and obtain a more suitable, even optimal thickness by giving them instant stress feedback after each modification. Also, as illustrated in Figure 14 (b) and (c), our Sketch2Stress informs the designers and the artist where (potential fragile regions), which auxiliary strategies (thickening, adding extra structures), and how effective their modifications by showing them the instant stress responses after their edition operations. Using Sketch2Stress, all the participants successfully refined the problematic sketch structures to better versions. The practicality and usefulness of our Sketch2Stress tool received high appreciation from the designers and artist. All three participants spoke highly of our designed tool for helping them quickly locate the weak regions and inform them of the vivid and instant stress responses after every editing operation. Before our user studies, they did not have much experience performing structural analysis and refinement in the sketching phase.
4.3.4 Compared with Traditional Structural Analysis
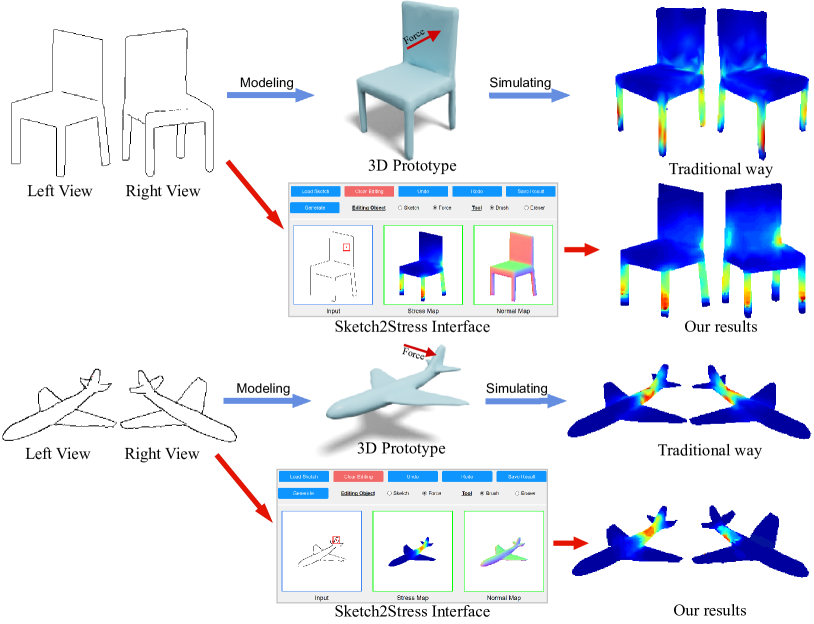
In our previous user studies, we have demonstrated the effectiveness of Sketch2Stress for novice users and professional designers in the sketch-based structural analysis and refinement tasks. In this user study, we will further explore how our proposed method compares with a traditional structural analysis approach (i.e., the reconstruction-and-simulation approach in Figure 3 but with multi-view input sketches), as illustrated in Figure 15.
Following the traditional structural analysis pipeline, we first invited two professional interior designers to draw multi-view 2D sketches of envisioned 3D objects (a chair and an airplane in our comparison), then created 3D models from the drawn 2D sketches with a multi-view sketch-based reconstruction approach [45], and finally used the structural analysis technique [6] on the resulting 3D models. Figure 15 displays the structural stress maps produced by such a traditional pipeline and our method. We also computed the distances (i.e., MAE, EMD, FID, and FM) between the resulting structural stress maps (see Figure 15) generated by our Sketch2Stress approach and the traditional reconstruction-and-simulation method from multi-view sketches. Note that our predicted stress maps for the multi-view input sketches are generated separately since our method is designed for the single-view scenario. Therefore, the generated stress maps by our method may lack the consistency across views (see the inconsistent stress effects across views in regions of the chair back and the airplane tail in Figure 15), compared to the traditional way. From this figure, we can observe that given the individual left-view sketches of both the chair and the airplane, our results generally reflect the consistent stress distribution comparable to the results by the traditional method, though there are some geometrical distortions on the chair legs and back, and the airplane tails and wings in the generated results due to the imprecise sketching. In addition, the view angle of the right input views (drawn at around degrees azimuth angle) is a novel view that was not in our dataset ([0, 45, 90] degrees in Section 3.1) and never seen by our model (see the changes in the computed distances when switching from the left to the right views in Table IV). However, our method can still infer similar and reasonable stress maps compared to the traditional method (see Figure 15). From Table IV, we also observe that the distances between our method and the traditional method change significantly with input of sketches with different levels of distortions (the fewer distortions (airplane sketch), the smaller distances). This indicates the importance of professional drawing skills and the necessity of further beautification for the user’s freehand sketches in the early sketching stage of the design and fabrication processes [46].
| Examples | Views | MAE | EMD | FID | FM |
|---|---|---|---|---|---|
| Airplane | Left View | 3.842 | 0.166 | 49.074 | 0.499 |
| Right View | 4.123 | 0.348 | 125.668 | 0.357 | |
| Chair | Left View | 18.074 | 1.072 | 192.250 | 0.404 |
| Right View | 29.765 | 1.401 | 299.330 | 0.178 |
The similar results between the generated stress maps by our method and the traditional method confirm the effectiveness of our approach. Furthermore, in the traditional way, although the quality of the generated mesh and simulated structural stress (Figure 15) with multi-view reconstruction is significantly better and more faithful to the input sketches than single-view reconstruction (Figures 2 and 3), in practice, it is still mentally demanding for designers to accurately depict a desired 3D shape with multi-view sketches. In contrast, our method directly infers the corresponding stress map from an input sketch (far less than 1 second, as quantified in Section 4.1), thus making designers bypass the cumbersome reconstruction and simulation steps (at least 10 seconds for each user-assigned force, even with our fastest deployment). With our method, designers can rapidly obtain a sufficiently good structural stress map of input sketches, without considering the complex spatial relationships among multi-view sketches. Through the comparison between our method and the traditional way, we further show that it is feasible for designers to perform the structural analysis task in the early sketching stage.
4.4 Structural Analysis on Real Product Sketches
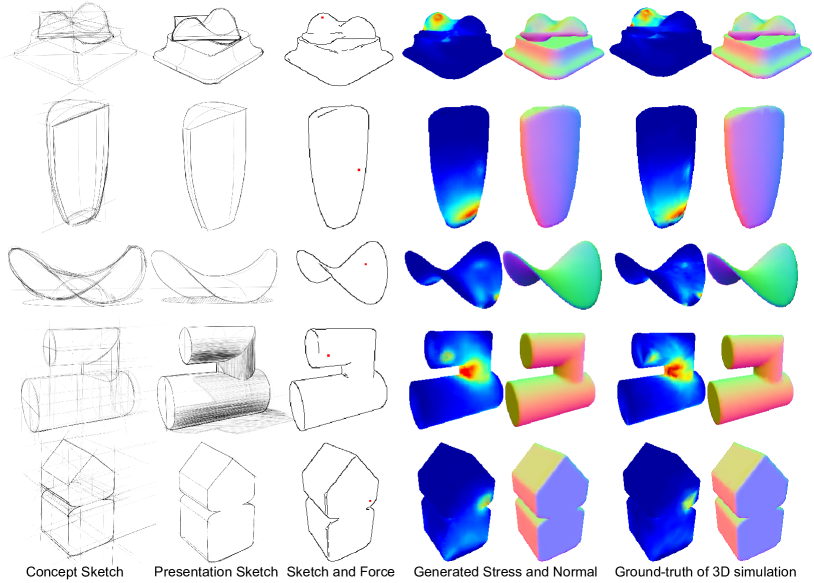
As product designers extensively use sketches in their creation and communication, to demonstrate the powerful feature of our method in aiding sketch-based structural analysis, we further apply our Sketch2Stress method to real product design sketches in OpenSketch [47].
More specifically, we first leverage the 3D objects in OpenSketch to render the 2D sketch-force-stress data (as described in Subsection 3.1) and then train our network on the projected synthetic data. The OpenSketch dataset has a limited number of shapes with highly diverse structures. To conduct the shape-level training and testing (in contrast to the category-level training and testing in Table I), for each shape, we rendered 12 views instead of 3 views of the previous 11 categories. We uniformly sampled 70% of the force points from all the force points and took their corresponding stress maps in each view as the training set, and used the remaining force points for testing our trained model. This training strategy is implemented based on our Observation (ii) (Section 1), i.e., the neighboring force points tend to produce similar structural stress responses.
As shown in Figure 16, with clean sketches and the user-assigned forces, our re-trained model is able to generate feasible and high-quality structural stress maps for the forces applied on the real product sketches. With the aid of our method, designers will have more opportunities to check and refine the structural weaknesses of their ideal products in advance at the sketching stage. Furthermore, with our method, designers will have a larger design space by incorporating external physical factors in the form of different force configurations.
5 Conclusion and Discussion
We have introduced the novel problem of sketch-based structural analysis, where we constrain the external forces to variables with the same magnitude but different locations and opposite-normal directions. We further present a two-branch generator to synthesize feasible structural stress maps by considering the sketches’ geometry and force variables simultaneously. We find that usually, the long, thin, tilt, and joint regions tend to suffer higher stress, and shapes with such regions are weaker than those shapes without them.
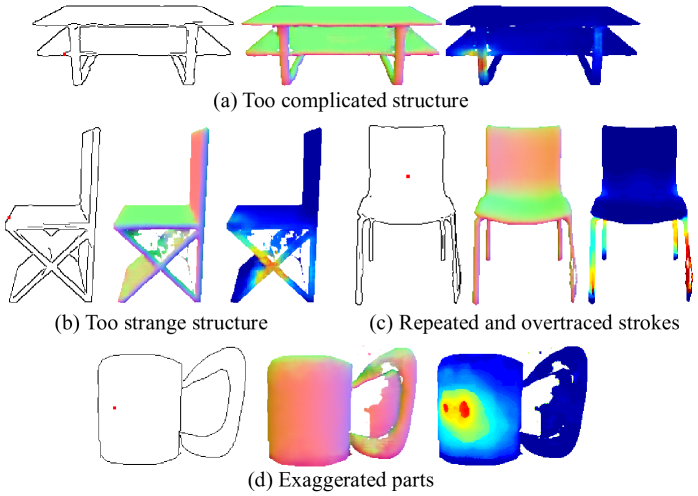
While the work we proposed provides an efficient approach for sketch-based structural analysis, our method has some limitations. First, our method cannot synthesize the stress effects of forces that are not in opposite-normal directions. Second, the force magnitude in our problem is set to a fixed value, which makes it challenging to analyze the stress effects of external forces with dynamic values. These two limitations are inherited from the method [6] we adopted for synthesizing the training data. Hence, further advances in new structural stress analysis solutions on 3D models, such as more efficient structural analysis techniques[48], could also help to improve our approach. Third, since our Sketch2stress method is learning-based, it might fail to infer reasonable stress maps and faithful underlying structures for input sketches with strange structures, repeated and over-traced strokes, or exaggerated part geometries. As shown in Figure 17 (a) and (b), some defects can be observed in the generated normal maps and synthesized structural stress maps of the double-layer table and ”X”-leg chair. Also, the over-traced strokes and the exaggerated parts will lead to failures with our approach, i.e., the holes and the mismatched mug-handle in (Figure 17 (c) and (d)). For the small flaws in generated stress maps and normal maps in Figure 17 (c) and (d), they could be fixed by refining the normal map (similar to [28]). Lastly, similar to [20, 21, 25], we train individual models for each category to exploit the finer-grained structural similarities and subtle structural differences in the same category. Therefore, when deploying our approach, the weights of different categories have to be reloaded accordingly during the inference time. However, in practice, a universal network trained to handle diverse kinds of objects is more welcomed, though it might be at the cost of a longer training time and decreased performance. In particular, for freeform sketching and ideation at the early stage in product design and digital fabrication, a universal network is more friendly for designers to have more creative space and explore more fancy interactions of objects from different classes.
5.1 Future Work
In the future, we would like to improve our approach from the following two aspects, i.e., practical usage and more accurate synthesis.
For practical usage, in our user studies, users needed to draw their refinements on our interface repeatedly by trial and error to obtain refined structures. Ideally, a more intuitive interface will further guide users to fix the problematic parts more easily, e.g., by providing a slider for users to adjust the thickness of problematic parts. Furthermore, to simplify the setup of the stress map computation or approximation, our current method re-orients the sample objects in their upright positions. In practical applications, users might need to re-orient the objects in the desired directions and perform re-training. In the future, we would like to extend our approach to allow for more user control over orientations. Our method is currently designed in the single-view scenario, which cannot guarantee the consistency across views in the predicted stress maps (Section 4.3.4). We might combine our approach with sketch correspondence algorithms (e.g., SketchDesc [49]) to further compute the dense correspondences among multi-view sketches to reduce such inconsistency. Only having one sketch provides limited information to indicate the material properties. Meanwhile, our current approach cannot take as input multi-forces at different directions since the combination of multiple forces requires an extra module to process carefully, not simply recording the mapping between input multiple forces and the corresponding output structural stress effect. In the future, we aim to explore further the proper representations and definitions for materials and external multiple forces in the generative process.
For more accurate synthesis, compared to the traditional structural analysis method (Section 4.3.4), our method can produce coarse-level comparable structural stress results and be potentially used as an upstream process for 3D fabrication, e.g., structural enhancement [2, 10]. For more fine-grained level fabrication, it is still challenging for our method to generate precise stress distributions, especially the orientations of the stress in a generated stress map. This can be partially solved by incorporating mechanisms from more advanced frameworks for high-quality image generation, e.g., diffusion models [30, 31, 32]. Furthermore, in our current method, only the stress magnitude (low-order) of the sketched structure but not the stress tensor (second-order) is considered. Therefore, exploring a proper representation for the stress tensor of a sketched structure is also a promising direction to further boost the accuracy of synthesized stress maps.
Acknowledgements
We thank the anonymous reviewers for their constructive comments. This work was partially supported by grants from the Research Grants Council of the Hong Kong Special Administrative Region, China (No. CityU 11212119, 11206319, and 11205420) and the Centre for Applied Computing and Interactive Media (ACIM) of the School of Creative Media, CityU.
References
- [1] G. Johnson, M. Gross, E. Y.-L. Do, and J. Hong, “Sketch it, make it: sketching precise drawings for laser cutting,” in CHI’12 Extended Abstracts on Human Factors in Computing Systems, 2012, pp. 1079–1082.
- [2] O. Stava, J. Vanek, B. Benes, N. Carr, and R. Měch, “Stress relief: improving structural strength of 3d printable objects,” ACM Transactions on Graphics (TOG), vol. 31, no. 4, pp. 1–11, 2012.
- [3] Q. Zhou, J. Panetta, and D. Zorin, “Worst-case structural analysis.” ACM Trans. Graph., vol. 32, no. 4, pp. 137–1, 2013.
- [4] W. Wang, T. Y. Wang, Z. Yang, L. Liu, X. Tong, W. Tong, J. Deng, F. Chen, and X. Liu, “Cost-effective printing of 3d objects with skin-frame structures,” ACM Transactions on Graphics (ToG), vol. 32, no. 6, pp. 1–10, 2013.
- [5] R. Prévost, E. Whiting, S. Lefebvre, and O. Sorkine-Hornung, “Make it stand: balancing shapes for 3d fabrication,” ACM Transactions on Graphics (TOG), vol. 32, no. 4, pp. 1–10, 2013.
- [6] E. Ulu, J. Mccann, and L. B. Kara, “Lightweight structure design under force location uncertainty,” ACM Transactions on Graphics (TOG), vol. 36, no. 4, pp. 1–13, 2017.
- [7] J. Panetta, A. Rahimian, and D. Zorin, “Worst-case stress relief for microstructures,” ACM Transactions on Graphics (TOG), vol. 36, no. 4, pp. 1–16, 2017.
- [8] L. Lu, A. Sharf, H. Zhao, Y. Wei, Q. Fan, X. Chen, Y. Savoye, C. Tu, D. Cohen-Or, and B. Chen, “Build-to-last: Strength to weight 3d printed objects,” ACM Transactions on Graphics (ToG), vol. 33, no. 4, pp. 1–10, 2014.
- [9] T. Langlois, A. Shamir, D. Dror, W. Matusik, and D. I. Levin, “Stochastic structural analysis for context-aware design and fabrication,” ACM Transactions on Graphics (TOG), vol. 35, no. 6, pp. 1–13, 2016.
- [10] M. Miki, T. Igarashi, and P. Block, “Parametric self-supporting surfaces via direct computation of airy stress functions,” ACM Transactions on Graphics (TOG), vol. 34, no. 4, pp. 1–12, 2015.
- [11] J. Zehnder, S. Coros, and B. Thomaszewski, “Designing structurally-sound ornamental curve networks,” ACM Transactions on Graphics (TOG), vol. 35, no. 4, pp. 1–10, 2016.
- [12] J. Dumas, A. Lu, S. Lefebvre, J. Wu, and C. Dick, “By-example synthesis of structurally sound patterns,” ACM Transactions on Graphics (TOG), vol. 34, no. 4, pp. 1–12, 2015.
- [13] G. Fang, T. Zhang, S. Zhong, X. Chen, Z. Zhong, and C. C. Wang, “Reinforced fdm: Multi-axis filament alignment with controlled anisotropic strength,” ACM Transactions on Graphics (TOG), vol. 39, no. 6, pp. 1–15, 2020.
- [14] M. Yao, Z. Chen, L. Luo, R. Wang, and H. Wang, “Level-set-based partitioning and packing optimization of a printable model,” ACM Transactions on Graphics (TOG), vol. 34, no. 6, pp. 1–11, 2015.
- [15] C. Schumacher, B. Bickel, J. Rys, S. Marschner, C. Daraio, and M. Gross, “Microstructures to control elasticity in 3d printing,” ACM Transactions on Graphics (Tog), vol. 34, no. 4, pp. 1–13, 2015.
- [16] Z. Lun, M. Gadelha, E. Kalogerakis, S. Maji, and R. Wang, “3d shape reconstruction from sketches via multi-view convolutional networks,” in 3DV’ 2017, pp. 67–77.
- [17] C. Li, H. Pan, Y. Liu, X. Tong, A. Sheffer, and W. Wang, “Robust flow-guided neural prediction for sketch-based freeform surface modeling,” ACM Transactions on Graphics (TOG), vol. 37, no. 6, pp. 1–12, 2018.
- [18] J. Delanoy, M. Aubry, P. Isola, A. A. Efros, and A. Bousseau, “3d sketching using multi-view deep volumetric prediction,” Proceedings of the ACM on Computer Graphics and Interactive Techniques, vol. 1, no. 1, pp. 1–22, 2018.
- [19] D. Smirnov, M. Bessmeltsev, and J. Solomon, “Learning manifold patch-based representations of man-made shapes,” in ICLR’ 2021.
- [20] S.-H. Zhang, Y.-C. Guo, and Q.-W. Gu, “Sketch2model: View-aware 3d modeling from single free-hand sketches,” in CVPR’ 2021, pp. 6012–6021.
- [21] B. Guillard, E. Remelli, P. Yvernay, and P. Fua, “Sketch2mesh: Reconstructing and editing 3d shapes from sketches,” in ICCV’ 2021, pp. 13 023–13 032.
- [22] N. Wang, Y. Zhang, Z. Li, Y. Fu, W. Liu, and Y.-G. Jiang, “Pixel2mesh: Generating 3d mesh models from single rgb images,” in ECCV’ 2018), pp. 52–67.
- [23] P. Isola, J.-Y. Zhu, T. Zhou, and A. A. Efros, “Image-to-image translation with conditional adversarial networks,” in CVPR’ 2017, pp. 1125–1134.
- [24] T.-C. Wang, M.-Y. Liu, J.-Y. Zhu, A. Tao, J. Kautz, and B. Catanzaro, “High-resolution image synthesis and semantic manipulation with conditional gans,” in CVPR’ 2018, pp. 8798–8807.
- [25] L. Mescheder, M. Oechsle, M. Niemeyer, S. Nowozin, and A. Geiger, “Occupancy networks: Learning 3d reconstruction in function space,” in CVPR’ 2019, pp. 4460–4470.
- [26] A. Telea and A. Jalba, “Voxel-based assessment of printability of 3d shapes,” in International symposium on mathematical morphology and its applications to signal and image processing. Springer, 2011, pp. 393–404.
- [27] T. HUGHES, “The finite element method,” Linear Static and Dynamic Finite Element Analysis, 1987.
- [28] W. Su, D. Du, X. Yang, S. Zhou, and H. Fu, “Interactive sketch-based normal map generation with deep neural networks,” Proceedings of the ACM on Computer Graphics and Interactive Techniques, vol. 1, no. 1, pp. 1–17, 2018.
- [29] J. Jiao, Y. Cao, M. Lau, and R. Lau, “Tactile sketch saliency,” in Proceedings of the 28th ACM International Conference on Multimedia, 2020, pp. 3072–3080.
- [30] J. Sohl-Dickstein, E. Weiss, N. Maheswaranathan, and S. Ganguli, “Deep unsupervised learning using nonequilibrium thermodynamics,” in ICML’ 2015, pp. 2256–2265.
- [31] J. Ho, A. Jain, and P. Abbeel, “Denoising diffusion probabilistic models,” NeurIPS’ 2020, vol. 33, pp. 6840–6851, 2020.
- [32] Y. Song, J. Sohl-Dickstein, D. P. Kingma, A. Kumar, S. Ermon, and B. Poole, “Score-based generative modeling through stochastic differential equations,” arXiv preprint arXiv:2011.13456, 2020.
- [33] C. Meng, Y. He, Y. Song, J. Song, J. Wu, J.-Y. Zhu, and S. Ermon, “Sdedit: Guided image synthesis and editing with stochastic differential equations,” in ICLR’ 2021.
- [34] A. Nichol, P. Dhariwal, A. Ramesh, P. Shyam, P. Mishkin, B. McGrew, I. Sutskever, and M. Chen, “Glide: Towards photorealistic image generation and editing with text-guided diffusion models,” arXiv preprint arXiv:2112.10741, 2021.
- [35] A. Ramesh, P. Dhariwal, A. Nichol, C. Chu, and M. Chen, “Hierarchical text-conditional image generation with clip latents,” arXiv preprint arXiv:2204.06125, 2022.
- [36] A. X. Chang, T. Funkhouser, L. Guibas, P. Hanrahan, Q. Huang, Z. Li, S. Savarese, M. Savva, S. Song, H. Su et al., “Shapenet: An information-rich 3d model repository,” arXiv preprint arXiv:1512.03012, 2015.
- [37] D. Du, X. Han, H. Fu, F. Wu, Y. Yu, S. Cui, and L. Liu, “Sanihead: Sketching animal-like 3d character heads using a view-surface collaborative mesh generative network,” IEEE Transactions on Visualization and Computer Graphics, 2020.
- [38] Y. Wang, S. Asafi, O. Van Kaick, H. Zhang, D. Cohen-Or, and B. Chen, “Active co-analysis of a set of shapes,” ACM Transactions on Graphics (TOG), vol. 31, no. 6, pp. 1–10, 2012.
- [39] D. Stutz and A. Geiger, “Learning 3d shape completion under weak supervision,” International Journal of Computer Vision, vol. 128, no. 5, pp. 1162–1181, 2020.
- [40] H. Fu, D. Cohen-Or, G. Dror, and A. Sheffer, “Upright orientation of man-made objects,” in ACM SIGGRAPH 2008 papers, 2008, pp. 1–7.
- [41] J. Canny, “A computational approach to edge detection,” IEEE Transactions on pattern analysis and machine intelligence, no. 6, pp. 679–698, 1986.
- [42] O. Sidi, O. van Kaick, Y. Kleiman, H. Zhang, and D. Cohen-Or, “Unsupervised co-segmentation of a set of shapes via descriptor-space spectral clustering,” in Proceedings of the 2011 SIGGRAPH Asia Conference, 2011, pp. 1–10.
- [43] A. Paszke, S. Gross, F. Massa, A. Lerer, J. Bradbury, G. Chanan, T. Killeen, Z. Lin, N. Gimelshein, L. Antiga et al., “Pytorch: An imperative style, high-performance deep learning library,” NeurIPS’ 2019, vol. 32.
- [44] X. Glorot and Y. Bengio, “Understanding the difficulty of training deep feedforward neural networks,” in Proceedings of the thirteenth international conference on artificial intelligence and statistics. JMLR Workshop and Conference Proceedings, 2010, pp. 249–256.
- [45] J. Zhou, Z. Luo, Q. Yu, X. Han, and H. Fu, “Ga-sketching: Shape modeling from multi-view sketching with geometry-aligned deep implicit functions,” arXiv preprint arXiv:2309.05946, 2023.
- [46] D. Yu, M. Lau, L. Gao, and H. Fu, “Sketch beautification: Learning part beautification and structure refinement for sketches of man-made objects,” arXiv preprint arXiv:2306.05832, 2023.
- [47] Y. Gryaditskaya, M. Sypesteyn, J. W. Hoftijzer, S. C. Pont, F. Durand, and A. Bousseau, “Opensketch: a richly-annotated dataset of product design sketches.” ACM Trans. Graph., vol. 38, no. 6, pp. 232–1, 2019.
- [48] N. Umetani and R. M. Schmidt, “Cross-sectional structural analysis for 3d printing optimization.” in SIGGRAPH Asia technical briefs. Citeseer, 2013, pp. 5–1.
- [49] D. Yu, L. Li, Y. Zheng, M. Lau, Y.-Z. Song, C.-L. Tai, and H. Fu, “Sketchdesc: Learning local sketch descriptors for multi-view correspondence,” IEEE Transactions on Circuits and Systems for Video Technology, vol. 31, no. 5, pp. 1738–1750, 2020.
![[Uncaptioned image]](/html/2306.05911/assets/figures/authors/Deng_Yu.jpg) |
Deng Yu is pursuing the Ph.D. degree at the School of Creative Media, City University of Hong Kong. He received the B.Eng. degree and the Master degree in computer science and technology from China University of Petroleum (East China). His research interests include computer graphics and data-driven techniques. |
![[Uncaptioned image]](/html/2306.05911/assets/figures/authors/Photo_Chufeng.jpg) |
Chufeng Xiao is working toward the Ph.D. degree at the School of Creative Media, City University of Hong Kong. Before that, he received B.Eng. degree in computer science and network engineering from South China University of Technology. His research interests include computer graphics and human computer interaction. |
![[Uncaptioned image]](/html/2306.05911/assets/figures/authors/Manfred_Lau.jpg) |
Manfred Lau is an Assistant Professor in the School of Creative Media at the City University of Hong Kong. His research interests are in computer graphics, human-computer interaction, and digital fabrication. His recent research in the perception of 3D shapes uses crowdsourcing and learning methods for studying human perceptual notions of 3D shapes. He was previously an Assistant Professor in the School of Computing and Communications at Lancaster University in the UK, and a post-doc researcher in Tokyo at the Japan Science and Technology Agency - Igarashi Design Interface Project. He received his Ph.D. degree in Computer Science from Carnegie Mellon University, and his B.Sc. degree in Computer Science from Yale University. He has served in the program committees of the major graphics conferences including Siggraph Asia. |
![[Uncaptioned image]](/html/2306.05911/assets/figures/authors/Hongbo_Fu.png) |
Hongbo Fu is a Professor with the School of Creative Media, City University of Hong Kong. He received the B.S. degree in information sciences from Peking University, and the Ph.D. degree in computer science from Hong Kong University of Science and Technology. He has served as an Associate Editor of The Visual Computer, Computers & Graphics, and Computer Graphics Forum. His primary research interests include computer graphics and human computer interaction. |
See pages - of Sketch2Stress_Supplemental_Materials.pdf