Y. Jiao et al. \righttitleIAU Symposium 379: Template
17 \jnlDoiYr2023 \doival10.1017/xxxxx
Proceedings of IAU Symposium 379
Revisiting mass estimates of the Milky Way
Abstract
We use the rotation curve from Gaia data release (DR) 3 to estimate the mass of the Milky Way. We consider an Einasto density profile to model the dark matter component. We extrapolate and obtain a dynamical mass at kpc. This lower-mass Milky Way is consistent with the significant declining rotation curve, and can provide new insights into our Galaxy and halo inhabitants.
keywords:
Galaxy: kinematics and dynamics – Galaxy:structure – dark matter – methods: numerical1 Introduction
The rotation curve (RC) is an essential tool for estimating the enclosed mass at different radii. The Milky Way (MW) disc is in relatively equilibrium because there was no major merger since 9 to 10 Gyr ago (Hammer et al., 2007; Haywood et al., 2018). Then, its dynamical mass can be well established from its RC. Previous RC studies based on the second Gaia data release (DR2, Gaia Collaboration et al., 2018) provided a declining MW RC, with a slope of and for Mróz et al. (2019) and Eilers et al. (2019), respectively. Such declining RCs have led to estimates of the total MW mass near or well below (de Salas et al., 2019; Eilers et al., 2019; Karukes et al., 2020; Jiao et al., 2021).
The Gaia DR3 (Gaia Collaboration et al., 2022) provides a wider sample of stars with new determinations of spectra, radial velocity, chemical abundance, etc. Recently, Wang et al. (2023) have applied a statistical inversion method introduced by Lucy (1974) to reduce the errors in the distance determination in the Gaia DR3 data-set and provided the MW rotation curve up to about 27.5 kpc. Their RC is in reasonably good agreement with the RC measurement based on Gaia DR2 (Mróz et al., 2019; Eilers et al., 2019) and DR3 (Ou et al., 2023). However, Zhou et al. (2023) found a systematically higher RC based on Gaia DR3 when it is compared to Wang et al. (2023) and Ou et al. (2023). Ou et al. (2023) argue that this systematic differences are caused by different methods of measuring distance. In particular, Wang et al. (2023) found that a steeper slope of RC, with , which is smaller than previous studies. A more rapidly declining RC provides a more stringent constraint, leading to a lower mass MW. Jiao et al. (2021) have shown that a Navarro–Frenk–White (NFW) profile could not be reconciled with a low mass MW and that an Einasto profile gives a larger mass range. Here we focus on the Einasto profile for the fitting of the MW RC.
2 Method
The baryonic model of this study is the same model that we used in Jiao et al. (2021, model I), which was obtained from Pouliasis et al. (2017) and corresponded to a mass of . Some studies argue that this model overestimates the mass of baryons towards the outer galactic radii (de Salas et al., 2019; Ou et al., 2023). We have also tested some different baryonic models with smaller mass. Though it has some minor impact on the estimated dark matter (DM) mass, it does not affect the results of dynamical mass (total mass). So the choices of baryonic mass do not change our main results.
We apply the method to fit the RC and calculate its associated probability, for which we have tested an extremely large parameter space. The is calculated by the sum at each disk radius :
| (1) |
where is the modeled circular velocity for the cumulative baryons + DM profiles, is the observed circular velocity and is the statistical uncertainty of the measurement so that to which we have added the systematic uncertainty to calculate . Hence the probability can be expressed as :
| (2) |
where is the number of independent observed velocity points in the RC and is the number of degrees of freedom.
3 Result and conclusion
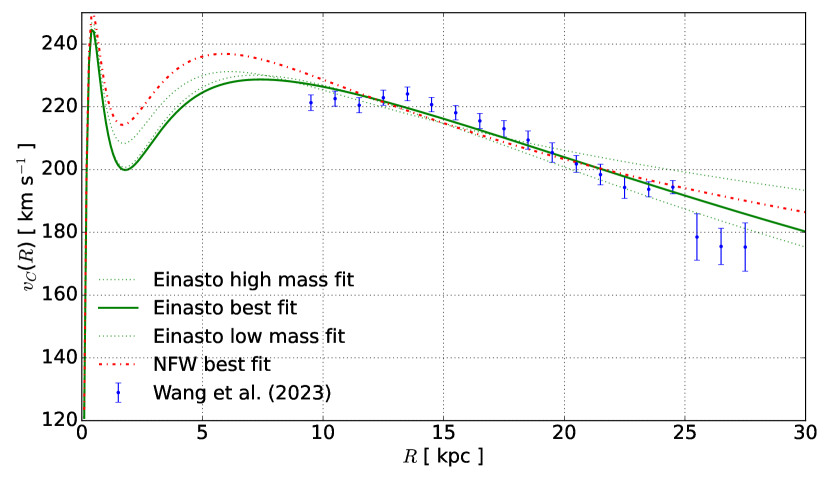
Jiao et al. (2021) explained in detail that the NFW profile may lead to a possible methodological bias particularly against low MW masses. With the RC from Gaia DR3 (Wang et al., 2023), we find that the Einasto profile provides better fitting results than the NFW model. In Figure 1 we present the RC from Wang et al. (2023), 3 models (low mass fit, best fit and high mass fit) of Einasto profile and best-fit model of NFW profile. The reduced of the best fit model is (for comparison, the reduced of best fit NFW profile is ). Ou et al. (2023) and Sylos Labini et al. (2023) have also found a similar result. In short, the three-parameter Einasto profile provides a much better fit to the declining RC.
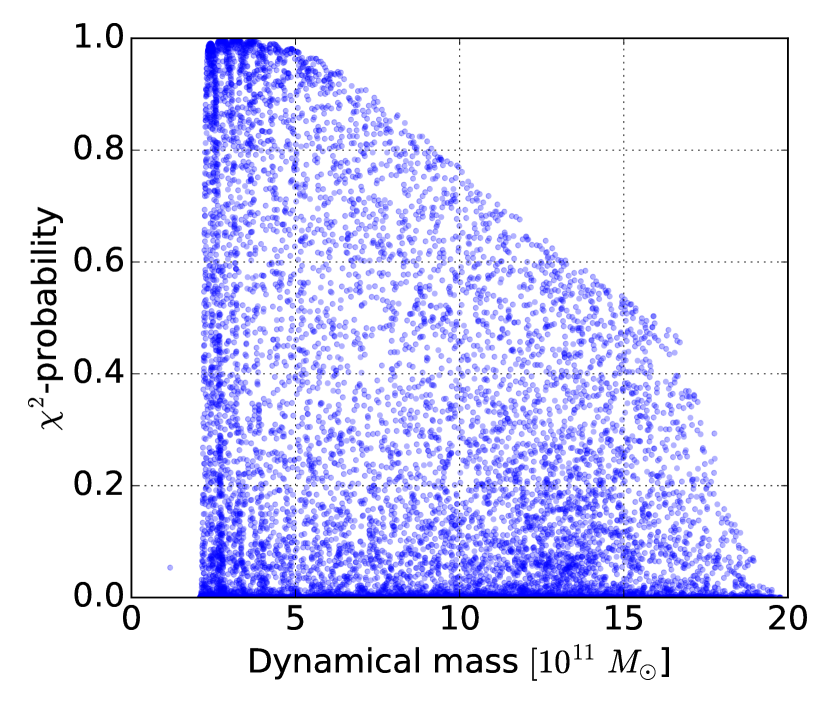
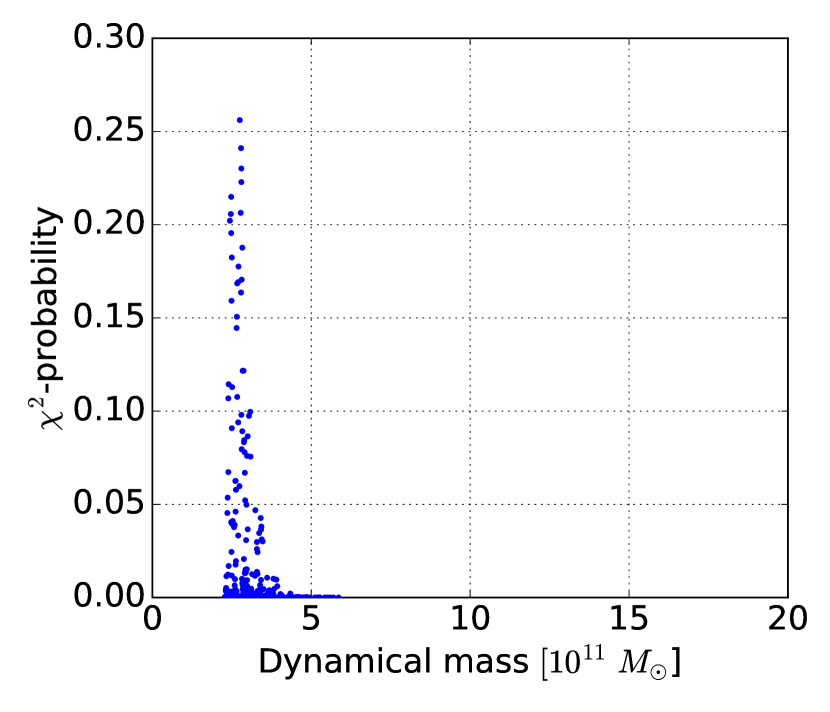
In Fig. 2. we compare the results of Einasto profile using Gaia DR2 and DR3. We keep the same parameter space as in Jiao et al. (2021) but the estimated MW mass range is much narrower. The best-fit dynamical mass remains consistent, from to , indicating that the Einasto profile gives a consistent estimated dynamical mass.
The low mass fits of RC are mostly constrained by the data at large radii ( kpc). Wang et al. (2023) find a consistent slope beginning at kpc. The last five points seem contradictory to each other. For now we think that inconsistencies may be due to the lack of a strict systematic uncertainty analysis, like the neglected cross term in Jeans equation and the uncertainty of scale length (see also Eilers et al. 2019). We will present this analysis in an upcoming work, but preliminary results show that the systematic does not lead to significant differences in our main results, including the choices of DM profile, estimated mass range and best fit model.
The Magellanic Clouds (MCs), Globular clusters (GCs) and dwarf galaxies are also widely used as tracers to estimate the enclosed mass of the MW at large radii. However, these methods can easily lead to prior selection bias. Wang et al. (2022) found that by excluding two GCs with large orbit energy, Crater and Pyxis, their estimated MW mass decreased from to with Einasto profile. In fact, as relatively old halo inhabitants (Hammer et al., 2023), GCs behave consistently with a large MW mass range. We have tested orbits of all GCs with the MW mass from 2 to 15 , and find that almost all GCs are gravitationally bound. However, about half of the dwarf galaxies are not bound with a low mass MW (). If most dwarfs came late in the MW halo ( 3 Gyr, Hammer et al., 2023), it is unrealistic to use them as tracers for estimating MW mass. For example, it is likely that the consideration of Leo I as a bound satellite would lead to a significant overestimate of the MW mass. On the other hand, orbital studies of other halo inhabitants are sensitive to the choice of MW mass and need more rigorous analysis.
References
- de Salas et al. (2019) de Salas, P. F., Malhan, K., Freese, K., et al. 2019, J. Cosmology Astropart. Phys, 2019, 037.
- Eilers et al. (2019) Eilers, A.-C., Hogg, D. W., Rix, H.-W., et al. 2019, ApJ, 871,120
- Gaia Collaboration et al. (2018) Gaia Collaboration, Brown, A. G. A., Vallenari, A., et al. 2018, A&A, 616, A1.
- Gaia Collaboration et al. (2022) Gaia Collaboration, Vallenari, A., Brown, A. G. A., et al. 2022, arXiv:2208.00211.
- Hammer et al. (2007) Hammer, F., Puech, M., Chemin, L., et al. 2007, ApJ, 662, 322.
- Hammer et al. (2023) Hammer, F., Li, H., Mamon, G. A., et al. 2023, MNRAS, 519, 5059.
- Haywood et al. (2018) Haywood, M., Di Matteo, P., Lehnert, M. D., et al. 2018, ApJ, 863, 113.
- Jiao et al. (2021) Jiao, Y., Hammer, F., Wang, J. L., et al. 2021, A&A, 654, A25.
- Karukes et al. (2020) Karukes, E. V., Benito, M., Iocco, F., et al. 2020, J. Cosmology Astropart. Phys, 2020, 033.
- Lucy (1974) Lucy, L. B. 1974, AJ, 79, 745.
- Mróz et al. (2019) Mróz, P., Udalski, A., Skowron, D. M., et al. 2019, ApJ, 870, L10.
- Ou et al. (2023) Ou, X., Eilers, A.-C., Necib, L., et al. 2023, arXiv:2303.12838.
- Pouliasis et al. (2017) Pouliasis, E., Di Matteo, P., & Haywood, M. 2017, A&A, 598, A66.
- Sylos Labini et al. (2023) Sylos Labini, F., Chrobáková, Ž., Capuzzo-Dolcetta, R., et al. 2023, ApJ, 945, 3.
- Wang et al. (2022) Wang, J., Hammer, F., & Yang, Y. 2022, MNRAS, 510, 2242.
- Wang et al. (2023) Wang, H.-F., Chrobáková, Ž., López-Corredoira, M., et al. 2023, ApJ, 942, 12.
- Zhou et al. (2023) Zhou, Y., Li, X., Huang, Y., et al. 2023, ApJ, 946, 73.
Manuel Bayer1. Do I understand correctly that for the modeling of the Eilers et al. (2019) data-set you just take into account the uncertainties for the circular velocity?
2. Did you just use the binned data of Eilers et al. (2019)?
3. What stars do Wang et al. (2023) employ to trace the rotation curve?
Yongjun Jiao1. We consider the neglected term in their Jeans equation, which is a cross-term made by the vertical density gradient of the product of the radial and vertical velocities and add an additional systematic uncertainty of on the velocity scale due to the effect of changing the distance of the Sun to the Galactic center and the scale length, the proper motion of the latter, etc.
2. We directly used their binned data (Eilers et al., 2019, Table 1) with overestimated error bars (see above).
Haifeng Wang3. Wang et al. (2023) use different types of stars in combination with Gaia DR3 line-of-sight velocity, which is based on the Lucy method and mainly in the galactic anticenter direction. The random errors and systematics are acceptable at least for the moment.