Resonant scattering of the OVII X-ray emission line in the
circumgalactic medium of TNG50 galaxies
Abstract
We study the impact of resonantly scattered X-ray line emission on the observability of the hot circumgalactic medium (CGM) of galaxies. We apply a Monte Carlo radiative transfer post-processing analysis to the high-resolution TNG50 cosmological magnetohydrodynamical galaxy formation simulation. This allows us to model the resonant scattering of O vii(r) X-ray photons within the complex, multi-phase, multi-scale CGM. The resonant transition of the O vii He-like triplet is one of the brightest, and most promising, X-ray emission lines for detecting the hot CGM and measuring its physical properties. We focus on galaxies with stellar masses at . After constructing a model for O vii(r) emission from the central galaxy as well as from CGM gas, we forward model these intrinsic photons to derive observable surface brightness maps. We find that scattering significantly boosts the observable O vii(r) surface brightness of the extended and diffuse CGM. This enhancement can be large – an order of magnitude on average at a distance of 200 projected kpc for high-mass M⊙ galaxies. The enhancement is larger for lower mass galaxies, and can even reach a factor of 100, across the extended CGM. Galaxies with higher star formation rates, AGN luminosities, and central O vii(r) luminosities all have larger scattering enhancements, at fixed stellar mass. Our results suggest that next-generation X-ray spectroscopic missions including XRISM, LEM, ATHENA, and HUBS – which aim to detect the hot CGM in emission – could specifically target halos with significant enhancements due to resonant scattering.
keywords:
galaxies: evolution – galaxies: formation – galaxies: haloes – galaxies: clusters1 Introduction
The hot phase of the circumgalactic medium surrounding galaxies is the dominant baryonic reservoir of dark matter halos. Its thermodynamical and cooling properties are largely responsible for the balance between cosmic gas accretion on to, and feedback-driven outflows from, the central galaxy. The hot circumgalactic medium (CGM) therefore regulates the baryon cycle, as well as the process of galaxy evolution (reviewed in Donahue & Voit, 2022).
One way to observationally detect and characterize the hot CGM is through its X-ray emission. X-rays are a key tool to probe massive M⊙ clusters (Pratt et al., 2009; Vikhlinin et al., 2009; McDonald et al., 2013), as well as groups (Lovisari et al., 2015; Eckert et al., 2021). While individual detections of the hot CGM are challenging for Milky Way-mass galaxies with M⊙ (Anderson & Bregman, 2011; Bogdán et al., 2013; Li & Wang, 2013), stacking with ROSAT (Anderson et al., 2015) and recently eROSITA (Comparat et al., 2022; Chadayammuri et al., 2022) can access this regime. However, measuring the physical properties of the CGM, such as temperature, abundance, density, and velocity is difficult at CCD spectral resolution (Kraft et al., 2022). This motivates the need for future X-ray imaging spectrographs.
At Milky Way through cluster mass scales, direct imprints of astrophysical feedback processes from galaxies are expected in the physical properties, and observables, of the hot CGM (Nelson et al., 2018b; Truong et al., 2020; Oppenheimer et al., 2020; Truong et al., 2021a). These gaseous halos contain a relatively small fraction of the baryons expected within CDM for a given dark matter halo mass (Anderson & Bregman, 2010), the remainder having been ejected to the larger scale of the closure radius (Ayromlou et al., 2022).
High-mass K clusters emit primarily via free-free bremsstrahlung due to their high temperatures, as reflected in cluster X-ray scaling relations (Robson & Davé, 2020; Pop et al., 2022). In contrast, lower mass halos are dominated almost exclusively by emission from metal lines. The observational detectability of this diffuse gas has been theoretically studied using modern cosmological hydrodynamical simulations (Wijers & Schaye (2022), Schellenberger et al. in prep). Mapping its spatial variation with high angular resolution imaging, and its spectral variation with high energy resolution X-ray spectroscopy, offers powerful probes of the physical properties of the CGM as well as the underlying connections to galaxy feedback processes (Truong et al. in prep, ZuHone et al. in prep). Forward modeling enables quantitative theoretical predictions for observable X-ray photons (ZuHone et al., 2022) and links those observables back to the underlying physical models (Truong et al., 2021b).
However, a significant complication exists for the detection and interpretation of X-rays from the CGM. While the hot circumgalactic medium has a small optical depth for continuum X-ray photons, this is not necessarily true for the emission lines of resonant transitions of highly ionized metals (Churazov et al., 2004). For example, in massive clusters the optical depths of iron lines including Fe XXV and Fe XXIV can range from of order a few to from the center (Gilfanov et al., 1987). In the absence of scattering, the radial surface brightness profile of an emission line will follow that of the continuum. For a constant total luminosity, resonant scattering will however redistribute emission into the outskirts, lowering the central surface brightness while boosting it at larger distance (Churazov et al., 2010; Hitomi Collaboration et al., 2018b). This effect is analogous to that in the resonant Lyman-alpha line of hydrogen, where scattering significantly flattens the intrinsic surface brightness profile (Byrohl et al., 2021; Lujan Niemeyer et al., 2022). The scattering of X-ray photons from the diffuse cosmic background, in the diffuse intergalactic medium, can also impact the observability of the IGM in emission (Churazov et al., 2001; Khabibullin & Churazov, 2019).
For Milky Way to group mass halos with M⊙ total mass, lines of ionized O vii and O viii are particularly important, as these ions are the dominant ionization states of oxygen (Nelson et al., 2018b). We focus here on O vii, which is He-like with two bound electrons remaining (Chakraborty et al., 2021). The atomic physics of the electronic transitions of He-like ions are well understood (Porquet et al., 2010). The excited state is split into four levels, of which three decay111The fourth excited state can only de-excite via a two-photon channel, producing continuum-like emission. to the ground state, leading to a triplet of emission lines. These are: the resonant line (labeled r), the intercombination lines (i), and the forbidden line (f). In the absence of scattering effects, the triplet component ratios are sensitive to the physical state of the plasma, making it a potential diagnostic of gas density and temperature (Ezoe et al., 2021).
The resonant O vii(r) line at Å has a transition energy of keV in the soft X-ray band. Its resonant nature and considerable optical depth implies that O vii(r) photons scatter off of intervening gas before reaching the observer, modulating observables including surface brightness profiles, spectral shapes, and polarization (Churazov et al., 2010). For example, we can observe radiation emitted in the past by a bright central source such as an active supermassive black hole (AGN), as it scatters off CGM gas. Such an echo of previous AGN activity would constrain the past luminosity, activity, and therefore duty cycles of AGN (Sunyaev et al., 1993; Sazonov et al., 2002). Even more intriguing, because O vii(r) photons sample the scattering medium, they are sensitive to the full three-dimensional velocity field of the CGM. The resulting spectral profiles therefore simultaneously encode information on microturbulent (small-scale) gas motions as well as large-scale motion and bulk flows (Sanders & Fabian, 2006; Zhuravleva et al., 2011). Unlike most other extragalactic velocity observables, we can therefore probe gas motion in all directions, either through spectral distortions or polarization (Zhuravleva et al., 2010), as opposed to the line-of-sight component alone.
Accessing the information content of X-ray emission lines such as the O vii triplet and O vii(r) in particular requires high spectral resolution. To date, instrumentation has restricted the observational possibilities: the RGS onboard XMM-Newton has been used to measure the characteristic turbulent velocity and impact of resonant scattering with the Fe xvii line (Werner et al., 2009). Turbulent velocities have also been inferred via Fe xvii for samples of nearby elliptical galaxies (de Plaa et al., 2012; Ogorzalek et al., 2017). However, the modern era of high-resolution X-ray spectroscopy began with the observations of turbulence in the Perseus cluster core by Hitomi (Hitomi Collaboration et al., 2018a), which also detected resonant scattering of the FeXXV He line (Hitomi Collaboration et al., 2018b).
The impending launch of XRISM (XRISM Science Team, 2020) promises to provide detailed observations of X-ray emitting gas in galaxy clusters, constraining the physics of turbulence, enrichment, and mixing (Simionescu et al., 2019a, b). Ambitious future mission concepts will, for the first time, probe the physics of the hot CGM down to Milky Way-mass halo scales. The X-IFU instrument onboard ATHENA (Nandra et al., 2013) will offer an unparalleled view on the physics of the energetic Universe and the hot X-ray emitting gas in and around dark matter halos (Barret et al., 2013; Kaastra et al., 2013).
The Line Emission Mapper (LEM; Kraft et al., 2022) NASA Probe concept is an imaging spectrometer based on pixel TES microcalorimeter array with eV spectral resolution, a 30’ field of view, and a 15" angular resolution, focusing its effective area entirely at the 0.2-2 keV soft X-ray range. With 1Ms pointings on a large number of nearby Milky Way-mass halos, it will map the distribution and kinematics of the hot CGM. One of its principal targets will be the forbidden line of O vii, redshifted away from the Milky Way foreground at the same wavelength. As we argue herein, the surface brightness dimming effect of moving to slightly higher redshift targets may be offset, or even reversed, due to resonant scattering enhancement of O vii(r), making it a compelling target.
In this work we combine the TNG50 cosmological magnetohydrodynamical galaxy formation simulation with a Monte Carlo radiative transfer method. We construct an emission model for the resonant O vii(r) line of O6+ oxygen ions, and focus on galaxies with stellar masses at . We forward model these intrinsic photons via resonant scattering into observable surface brightness maps around individual galaxies. Capturing the multi-phase, multi-scale CGM, this enables us to study the impact of X-ray resonant scattering on the observability of the hot CGM.
2 Methods
2.1 The TNG50 Simulation
Given its combination of high numerical resolution and large volume, the TNG50 cosmological magnetohydrodynamical simulation (Pillepich et al., 2019; Nelson et al., 2019b) is ideal for the current study. The TNG50 volume spans (50 cMpc)3, with a baryonic (gas/star) mass resolution of M⊙. It is the third volume of the IllustrisTNG project (TNG hereafter; Springel et al., 2018; Naiman et al., 2018; Pillepich et al., 2018b; Marinacci et al., 2018; Nelson et al., 2018a), a suite of cosmological simulations which are the successor of the original Illustris simulation (Vogelsberger et al., 2014b, a; Genel et al., 2014; Sijacki et al., 2015).
The TNG simulations are run with the Arepo moving-mesh code (Springel, 2010), and all adopt the same ‘TNG model’ for galaxy formation physics (Weinberger et al., 2017; Pillepich et al., 2018a), including the effects of magnetic fields using an ideal magnetohydrodynamics, divergence cleaning method (Pakmor et al., 2011, 2014). Self-gravity is solved with the Tree-PM scheme, while the fluid dynamics is based on a Godunov-like finite-volume scheme, using an unstructured, moving, Voronoi tessellation to discretize space.
The TNG simulations include a broad and well-tested physical model for the most important processes driving the formation and evolution of galaxies. In brief: (i) gas microphysics and radiative processes, including primordial/metal-line cooling and heating from the background radiation field i.e. UVB, (ii) star formation in the dense interstellar medium, based on a density-threshold model, (iii) stellar population evolution, chemical enrichment, and metal return, following supernovae type Ia, II, as well as AGB stars, and individually tracking nine elements: H, He, C, N, O, Ne, Mg, Si, and Fe, (iv) galactic-scale outflows driven by stellar i.e. supernovae feedback (see Pillepich et al., 2018a), (v) supermassive black holes: their seeding/formation, coalescence/mergers, and growth via gas accretion, (vi) and blackhole feedback, operating in a time-continuous thermal mode at high accretion rates, and a high-velocity, time stochastic, kinetic wind mode at low accretion rates (see Weinberger et al., 2017).
Consistent with the TNG simulations, we adopt a Planck Collaboration (2016) cosmology with , , , , and .
2.2 O vii(r) Emission Model
Our modeling of the emissivity of diffuse gas follows directly the methodology of Nelson et al. (2021) for Mg ii emission, which we summarize briefly here. We compute the emission from the O vii(r) line using Cloudy (Ferland et al., 2017, v17.00), including both collisional and photo-ionization processes, and assuming ionization equilibrium given a UV + X-ray background (Faucher-Giguère et al., 2009, FG11 update, making this choice fully self-consistent with the simulations). We account for self-shielding with a frequency dependent attenuation of the UVB at high densities (following Bird et al., 2014; Rahmati et al., 2013). We use Cloudy in its single-zone mode and iterate to equilibrium, running in the constant temperature mode, with no induced processes (following Wiersma et al., 2009) and assuming the solar abundances of Grevesse et al. (2010).
Emissivities are tabulated over a 4D grid of hydrogen number density, temperature, redshift, and metallicity. To derive the emission from each gas cell in the simulation, we interpolate in this table, taking into account the actual gas-phase oxygen abundance, as tracked directly in the simulation, following its production in stars and subsequent return and mixing (Pillepich et al., 2018a).222We note that the vast majority of oxygen is produced promptly via the SNII channel, for which TNG adopts a combined stellar yield model from Kobayashi et al. (2006) and Portinari et al. (1998). At solar metallicity, within a Hubble time, 1.8% per unit stellar mass formed returns to the ISM as oxygen. AGB stars contribute 1 dex less, and SNIa 1 dex less still.
Dense, star-forming gas cells in the TNG model adopt a two-phase pressurization model (Springel & Hernquist, 2003). In contrast to our previous emission models, which simply assumed that the total mass of such cells exists at their cold-phase temperature of 1000 K, we here develop a new two-phase emission model for star-forming ISM gas. Specifically, we calculate the mass fraction of the hot and cold components, as well as the temperature of the hot phase, which are all density dependent (Springel & Hernquist, 2003). The mass fraction of the hot phase is small – roughly 10% at the star-formation threshold density of , and decreases to % with increasing density (see e.g. Stevens et al., 2019). The temperature of the hot phase increases asymptotically from K at to K at the highest densities. As the mean density of star-forming gas in high-resolution TNG model simulations is , the corresponding hot-phase temperature of K can efficiently host high abundances of O vii (Nelson et al., 2018b).
To model the O vii(r) emission from multi-phase ISM gas we derive the hot-phase density from the respective mass fraction, and adopt its corresponding density-dependent temperature for the respective Cloudy calculation. This is an approximate model for the emission from the hot interstellar medium of galaxies, and is primarily meant to give a non-vanishing, density dependent emissivity which can then be scaled as needed. In particular, we introduce a ‘boost parameter’, being our fiducial value, which we treat as a free parameter to scale up or down this emission component. A value of corresponds to zero emission from star-forming gas, while a value of corresponds to the naive application of the described model (as we show below, produces unphysically high luminosities in galaxies). As the hot ISM is within the central galaxy itself, i.e. at small radii kpc, our -parameter also allows us to experiment with the impact of a central, bright source, which in reality could be the galaxy itself, or a luminous AGN. A low or zero value therefore also corresponds to negligible or no O vii(r) emission from the AGN itself.
Our model makes several assumptions. First, individual gas cells i.e. at the simulation resolution limit have constant density and temperature: no emission arises from gas structure inhomogeneity on physical scales 100 pc, which are unresolved in TNG50. Second, we do not include any stellar continuum emission at the frequency of the O vii(r) line. Third, we omit the impact of radiation from local stellar/AGN sources, which could change oxygen ions fractions near galaxies (Suresh et al., 2017; Oppenheimer et al., 2018).
2.3 Resonant scattering radiative transfer
Unlike Nelson et al. (2021), we do not assume that photons propagate through an optically thin medium. Instead, we introduce a full radiative transfer (RT) treatment of the resonant scattering process. To do so, we extend the Monte Carlo RT method of Byrohl et al. (2021); Byrohl & Nelson (2022), previously used to study Lyman-alpha, to resonant metal lines, including O vii(r). This transition occurs at Å and we adopt an oscillator strength of and emission coefficient s-1 (Verner et al., 1996).
While the multi-scattering physics is similar to the Lyman- line of hydrogen (Prochaska et al., 2011), the optical depths involved are much lower. In particular, resonantly trapped O vii photons require only scatterings to escape a CGM environment, similar to the situation for Fe xxv in clusters, and Fe xvii in groups. This allows us to disable the numerical acceleration schemes, including core skipping, used in Byrohl et al. (2021) to speed up the frequency diffusion process. The resulting RT of O vii(r) is relatively straightforward in comparison to Lyman-alpha.
O vii(r) photons are emitted at the velocity of each moving gas cell, meaning that bulk velocities as well as (resolved) turbulent velocities are fully taken into account, for the emitting gas as well as the scattering gas. We do not include an additional turbulent velocity component to account for unresolved turbulence, i.e. on scales pc, which would introduce an ad hoc assumption. Photons have an initial wavelength distribution with respect to the line-center frequency corresponding to a thermal Gaussian, given the temperature of the gas. Photons are emitted with a random initial direction, and we adopt an isotropic scattering phase function, a simplification which is expected to have negligible impact on our results. After each scattering, we calculate a luminosity contribution which escapes towards a defined observer viewing direction (the peeling-off algorithm; Whitney, 2011). During the RT, O vii(r) photons only scatter (via absorption followed by rapid re-emission), they are not destroyed, and do not alter the gas state (its temperature or ionization). Our RT method can ray-trace through a variety of geometrical discretizations of the underlying gas, including unstructured Voronoi tessellations, which we use here for full consistency with TNG50.
2.4 Galaxy sample
We process each halo individually, propagating photons out to twice the virial radius, and neglecting any IGM-scale scattering effects. Our sample is drawn from TNG50 at . We select central galaxies with . There are a total of 479 such galaxies, and we randomly sub-select up to 30 per 0.1 dex bin of . Our final sample contains 298 galaxies.
We do not apply any explicit observational realism effects, such as noise, or a finite angular resolution/point spread function. Our conclusions are thus general and apply broadly to future X-ray spectroscopic instruments including XRISM, LEM, ATHENA, and HUBS.
3 Results
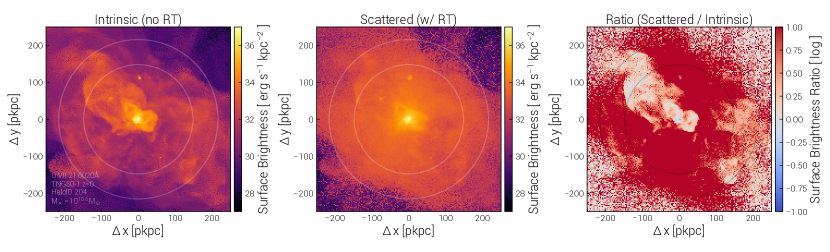
We begin with a demonstration of the impact of resonant scattering for a single TNG50 galaxy. Figure 1 shows the predicted O vii(r) surface brightness from the scale of the circumgalactic medium (CGM) of this system. We contrast two cases: intrinsic photons, where we neglect radiative transfer effects and any scattering (left panel), and scattered photons, where we process this emission with our radiative transfer method (middle panel). We find a striking visual difference. In particular, the scattered surface brightness map – that is, the observable emission – is significantly brighter throughout large areas of the halo. O vii(r) photons originating from the central galaxy scatter off gas throughout the CGM before last scattering towards the observer, significantly boosting its surface brightness. The circumgalactic medium in O vii(r) is largely illuminated by light which is originally emitted at its very center.
Each map is shown 250 kpc across, and through an equal projection depth along the line of sight direction. The viewing direction i.e. galaxy orientation is random. We always sum across an energy range sufficient to include all the line emission. The inner circle marks , while the outer circle marks , which are kpc and kpc, respectively. These emission maps have a large dynamic range. The central surface brightness values reach erg s-1 kpc-2 (in white), while the majority of the halo region is much lower at erg s-1 kpc-2, decreasing to erg s-1 kpc-2 (on average) in the outskirts, at distances comparable to the virial radius.
This galaxy has a mass similar to that of the Milky Way, with M⊙, a star formation rate of M⊙ yr-1, and a total halo mass M⊙. The supermassive black hole (SMBH) of this galaxy has transitioned into the stronger ‘kinetic mode’, which is common at this galaxy mass in the TNG model, being the case for of Milky-Way mass galaxies at (Pillepich et al., 2021; Ramesh et al., 2023). As a result it drives a large, halo-scale outflow. In the projection shown, this outflow is visible as the bright feature towards the upper left, extending from the central galaxy across . The galaxy also has smaller scale, ongoing outflows, visible as bright inner loop-like structures on tens of kpc scales. These galactic center bubbles are produced in TNG50 Milky Way-like galaxies and have features qualitatively similar to Fermi/eROSITA bubbles observed in our own Milky Way (Pillepich et al., 2021).
Due to the ionization state, density, and temperature in these SMBH-driven outflows, they light up as intrinsically bright O vii(r) features. This suggests that they may be directly observable signposts of galactic feedback. However, their strong surface brightness contrast with respect to the background CGM is partially washed out after taking into account scattering. The smoothing out of shock fronts and bubble-like structures will hinder their detection and characterization, in contrast to non-resonant lines including O vii(f) and O vii(i). Observing the complete triplet is clearly advantageous, and by design any LEM pointing which captures O vii(r) will simultaneously cover the other two lines. This is apparent in the ratio image (right panel), which highlights the outflow-driven bubbles as regions where the surface brightness stays relatively constant or even decreases (white to light blue colors). As a result, energetic outflows light up the CGM as a whole via resonant scattering.
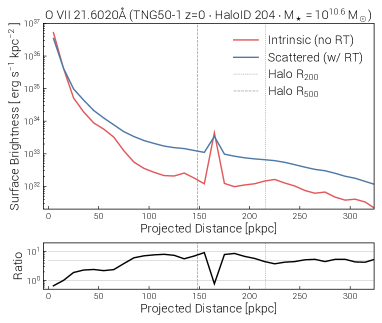
Figure 2 quantifies the radial surface brightness profile of O vii(r) emission for this same galaxy. The top panel shows the intrinsic profile neglecting scattering (red line), as well as the scattered i.e. observable profile after treating radiative transfer effects (blue line). The ratio of the scattered to intrinsic profiles, giving the effective surface brightness enhancement, is shown in the bottom panel (black line). This enhancement is actually a deficit at two locations: within the central galaxy itself, at zero projected distance, and within a satellite galaxy at a distance of kpc, which produces a strong local enhancement of intrinsic O vii(r) emission. In both cases photons from these compact sources scatter outwards, illuminating their surroundings out to larger scales.
The most important feature is the redistribution of O vii(r) emission from the central galaxy into the extended CGM. As the luminosity at the very center of the halo is several orders of magnitude larger than in the outskirts, there is ample opportunity (i.e. available photons) to significantly enhance the observable surface brightness throughout the halo. For this halo, the enhancement ratio rises from unity at 10 kpc to a factor of five by 80 kpc, and reaches a factor of ten at 150 kpc (). Qualitatively speaking, the radial surface brightness profile is enhanced by a factor of several, all the way out to the virial radius. As discussed above, this enhancement can be spatially localized, e.g. greater outside of bright outflows, and the impact is not fully captured by the radial trend alone.
The intrinsic luminosity of the central galaxy in the O vii(r) line is erg s-1, where we sum emission from within a circular aperture of 5 kpc, corresponding to 45" at .333The total observable luminosity of the halo, integrated out to the virial radius, is erg s-1, while the intrinsic value is erg s-1, i.e. 10% of the total O vii(r) emission of the halo is scattered beyond . Scattering reduces the luminosity within this small aperture by 40%, giving an observable luminosity of erg s-1. As a point of comparison, at this same distance and within the same aperture, NGC 7213 (with a similar stellar mass) has an observed luminosity of erg s-1 (Starling et al., 2005, with RGS). This suggests that our overall emission model is reasonably realistic, being neither too bright nor too faint. We consider further observational validations below.
3.1 Diversity and variation across the galaxy population
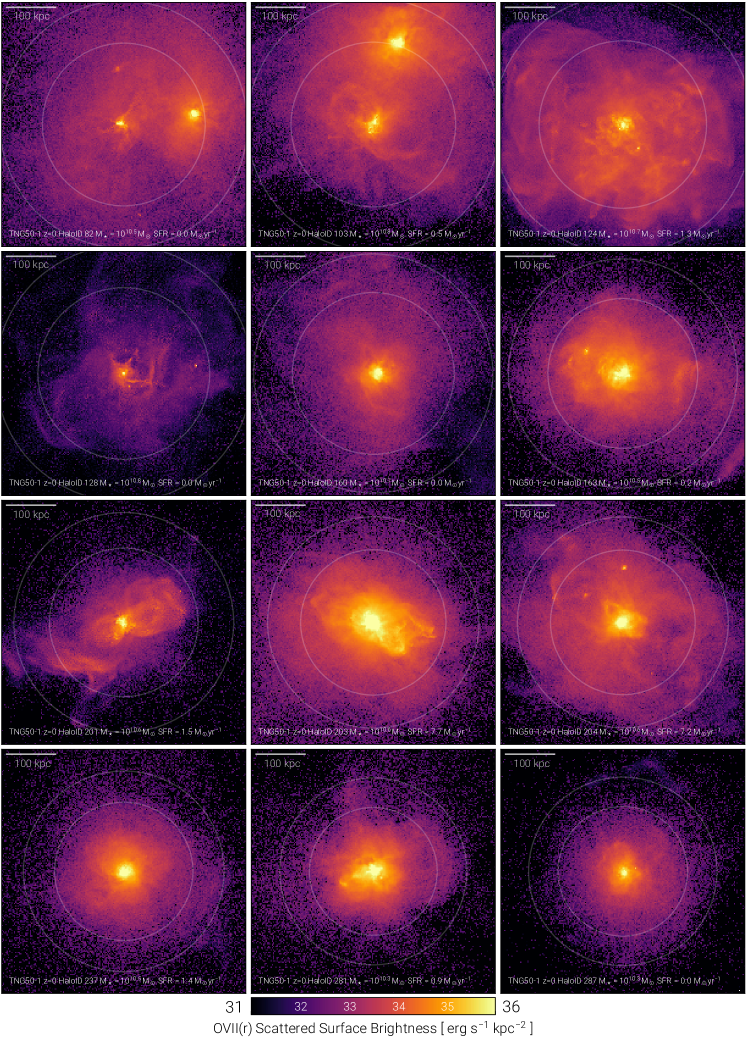
In Figure 3 we show a gallery of twelve halos, selected randomly from the full TNG50 sample. All images show the predicted observable O vii(r) surface brightness maps, after accounting for scattering, across a fixed field of view of 250 kpc. Stellar masses range from M⊙ to M⊙, and star formation rates range from M⊙ yr-1 to M⊙ yr-1. Across this subset of the sample there is already a significant diversity of structure evident. In particular, O vii(r) line emission from the circumgalactic medium reveals large merger events in progress (first two examples), as well as smaller and subtler substructures (last column). Many although not all of the twelve galaxies exhibit clear signatures of feedback-driven outflows. In some cases the central CGM is extraordinarily bright out to 10s of kpc, while other halos reach such high values only in their very cores. The surface brightness at the virial radius (outer white circle; ) varies by many orders of magnitude across different halos.
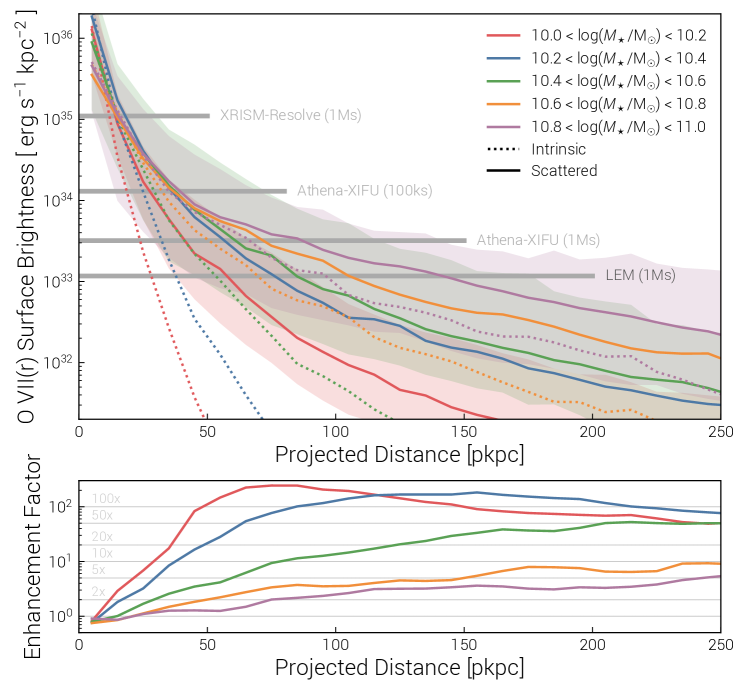
Given this significant diversity across the population, we next assess the average impact of resonant scattering on observable O vii(r) emission. Figure 4 shows radial O vii(r) surface brightness profiles, contrasting intrinsic (dotted lines) versus scattered (solid lines) emission (top panel). We stack all galaxies in the sample into five bins of stellar mass, from , where individual profiles are constructed as before, and we median combine the profiles of halos in each bin. Shaded regions, included only for three bins for visual clarity, show the percentile halo to halo scatter.
As a function of galaxy stellar mass, the O vii(r) surface brightness of the extended CGM increases for more massive galaxies. At a fixed distance of kpc, from erg s-1 kpc-2 at M⊙, to erg s-1 kpc-2 at M⊙. To some degree this reflects the increasing size of the gaseous halos, as we plot distances throughout in physical kpc and do not normalize by the virial radius. The central luminosities have the opposite trend – less massive galaxies have brighter cores, on scales of 30 kpc. As a result, the radial surface brightness profiles of more massive galaxies are shallower, i.e. flatter and more extended, than their lower mass counterparts.
At all stellar masses we consider, scattering boosts the O vii(r) surface brightness profiles of the extended CGM.444We have explicitly checked the importance of including the velocity field of the gas. To do so, we assume that both the emitting and scattering media are at rest. In this case, the scattered emission is substantially brighter, from 10% to a factor of two, depending on mass and distance (not shown). As thermal broadening is not a significant factor for O vii(r), velocities are important for shifting photons out of resonance. With the velocity field zeroed, there is significantly more scattering. This demonstrates the importance of including the gas kinematics in order to not overestimate the impact of scattering. With horizontal gray lines, we include estimates for the surface brightness values reachable for upcoming X-ray instruments: XRISM-Resolve, Athena-XIFU, and LEM. For the first two cases, we adopt a line width, a detection significance, include xspec wabs Galactic absorption with , and assume a single field of view pointing with the given exposure time is binned (adopted from Wijers & Schaye, 2022).555Athena X-IFU values derived before the Athena reformulation as of 2022. For the case of LEM we estimate the total background rate within a eV band at the location of the redshifted O vii(r) line to be cnt s-1 arcmin-2, including three thermal foreground components, the cosmic X-ray background without removing any bright sources, and the conservative estimate of the LEM instrumental background. We then estimate the LEM 5 line sensitivity assuming an effective area of cm2 (Kraft et al., 2022), for a source filling the LEM field of view. As this threshold reaches erg s-1 kpc-2, the distance out to which each profile can be detected becomes much greater after accounting for scattering. We also emphasize the mapping capabilities of LEM: given that the FoV is times larger than Athena X-IFU, the latter would require a mosaic of roughly this number of pointings to cover a field-filling CGM to the same depth, requiring substantially more exposure time than indicated in the Figure.
The lower panel of Figure 4 quantifies this enhancement, as before, taking the ratio of the scattered to intrinsic radial profiles. Horizontal gray lines mark enhancements of 2x, 5x, 10x, 20x, 50x, and 100x, as indicated. Resonant scattering leads to a larger enhancement for extended surface brightness levels in lower mass galaxies. Remarkably, the average enhancement reaches a peak factor of 200, at kpc scales around M⊙ galaxies (red lines). However, the observable surface brightness is ultimately much lower for lower mass galaxies, i.e. although the relative scattering-induced enhancement is impressive, it is largely irrelevant from an observational detectability point of view. The most massive galaxies, up to M⊙, are still the brightest beyond kpc, as expected given the increasing density of the CGM as well as the relatively flat abundance of O vii across this halo mass range – O viii starts to dominate just beyond M⊙ (Nelson et al., 2018b).
Particularly in the two lower mass bins, we can see that the enhancement factor is not monotonic with distance, but instead has a maximum at intermediate scales. Namely, the average enhancement within kpc is less than unity, and begins to increase monotonically with increasing distance. For galaxies with M⊙, a peak occurs at 70 kpc, which is of these halos. For galaxies with M⊙, the peak is broad and occurs at 150 kpc, which is , while for the three most massive bins the enhancement factor monotonically rises within the entire 250 kpc range that we consider here.
The most important quantitative result of Figure 4 is the enhancement factor on CGM scales for intermediate M⊙ mass galaxies, where O vii(r) emission would potentially reach observable levels. For galaxies with this stellar mass (green lines), the enhancement rises from a factor of 2 at 30 kpc, to a factor of 5 at 60 kpc, to a factor of 10 at 100 kpc. It eventually reaches a factor of 50 at even larger distances of 200 kpc. The relevance of this depends on the observability of an absolute surface brightness level of erg s-1 kpc-2 in O vii(r) line emission. For more massive galaxies with stellar mass M⊙ (orange lines), the enhancements due to scattering are less impressive, although the actual observable surface brightness values are higher. For example, on average galaxies have an enhancement factor of 5 at 100 kpc, where the predicted surface brightness is then erg s-1 kpc-2. Our most massive bin with M⊙ (purple lines) has essentially the same predicted median radial O vii(r) surface brightness profile, as the increasing halo mass and thus intrinsic emission is counterbalanced by a decreasing impact of resonant scattering.
Overall, these results quantify our population level prediction that scattering of the O vii(r) line significantly boosts the observable surface brightness values, as a function of galaxy stellar mass and projected distance. What remains unclear is the level of halo to halo variation, and whether other observables of a galaxy may indicate, a priori, that the O vii(r) emitting halo of that system will be brighter.
3.2 Connection to galaxy properties
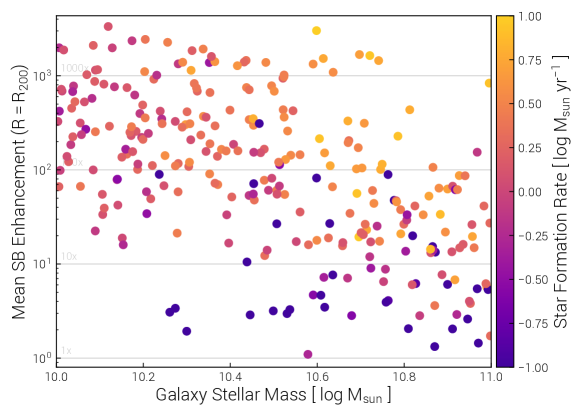
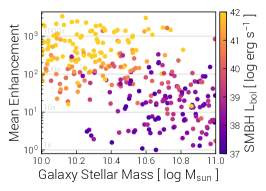
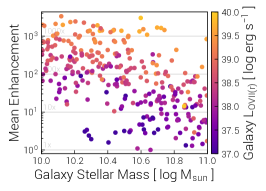
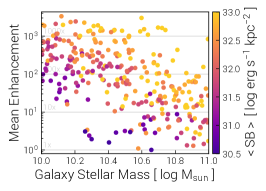
Figure 5 shows the mean O vii(r) surface brightness enhancement as a function of galaxy stellar mass, at a particular choice of distance: the virial radius . In each of the four panels, all galaxies in the sample are shown with individual colored symbols, where color corresponds to galactic star formation rate (main panel), bolometric luminosity of the central SMBH/AGN (lower left panel), central O vii(r) luminosity of the galaxy itself, within a 10 kpc aperture (lower middle panel), and mean, scattered O vii(r) surface brightness at (lower right panel).666These statistics, particularly median values, depend to some degree on pixel size (PSF), and we adopt an angular resolution of 60” at , corresponding to a smoothing scale of kpc. In order to minimize shot noise from our Monte Carlo radiative transfer, we select this value to be four times worse than the LEM concept, which is optimized for characterizing the CGM due to its large grasp and high spectral resolution (Kraft et al., 2022).
The overall trend with mass is monotonically decreasing, as previously seen: the impact of scattering is largest for the lower mass galaxies. However, the scatter is enormous. At intermediate masses, halo to halo variation in the surface brightness enhancement factor spans the entire range, from essentially unity to a factor of 1000. In the top panel, color indicates log of galaxy star formation rate, and a clear correlation exists. At fixed stellar mass, galaxies with higher star formation rate (SFR) in their centers have larger enhancements of O vii(r) surface brightness at their virial radii. This effect is strong: systems with M⊙ yr-1 have hardly any enhancement from scattering, while systems with M⊙ yr-1 have the largest.
The three lower panels of Figure 5 show that the O vii(r) surface brightness enhancement is also connected to other galactic properties. Namely, to the luminosity of the central AGN (lower left panel), which is computed assuming an accretion rate dependent radiative efficiency (see Nelson et al., 2019a; Churazov et al., 2005)
| (1) |
where is the Eddington ratio, and no obscuration is considered. Higher therefore indicate increased SMBH accretion rates, tracing more massive/denser gas reservoirs in the galaxy, which also then lead to higher SFRs. That is, the correlation with AGN luminosity does not necessarily imply a physical causation. We also note that although the TNG model does treat – albeit in a simplified manner – radiation from AGN, particularly its impact on gas cooling physics, we do not include AGN radiation in our radiative transfer simulations. Regardless, at fixed stellar mass, galaxies with higher SFRs and/or AGN luminosities (as well as higher SMBH masses; not shown) have the greatest scattering-induced enhancements of O vii(r) surface brightness.
As expected, the enhancement also correlates directly with of the central galaxy itself (Figure 5, lower middle panel). The scaling is almost linear: if the central galaxy produces ten times more O vii(r) photons, then the resulting surface brightness at the virial radius is of order ten times higher. We also evaluate the distribution of line-center optical depth for this line (not shown), finding a large variation across halos with similar mass. While one halo can have within the central galaxy, other cases can have , indicating that significant differences in the abundance of O vii exist at the population level, and partially drive the scatter seen here.
On the other hand, there is no correlation of surface brightness enhancement with the parent dark matter halo mass at fixed (not shown). There is also no strong correlation with SMBH mass at fixed stellar mass (not shown). For the lower half of our mass range, , stellar feedback dominates in the TNG simulations. In this regime, higher mass halos have more total gas and higher densities, leading to larger optical depths as well as overall emission. For the upper half of our mass range, , where SMBH feedback begins to dominate in TNG, this is not necessarily the case, as more massive halos host more massive black holes which have injected larger cumulative amounts of kinetic energy, lowering halo-scale gas fractions (Zinger et al., 2020; Davies et al., 2020; Ayromlou et al., 2022). The lack of correlation between surface brightness enhancement at the virial radius and halo mass suggests that these effects are subdominant with respect to the total core luminosity, i.e. in the halo center.
Finally, the lower right panel of Figure 5 demonstrates an important point. It colors each symbol by the mean, scattered surface brightness of O vii(r) emission at the virial radius. A clear trend with enhancement factor is present. This need not necessarily be the case, for instance if the intrinsically dimmest halos were enhanced the most due to scattering, leaving their observable surface brightness values still too low to be observed. However, we see that larger enhancement factors imply larger observable surface brightness values. As a result, the previous correlations with galaxy SFR, AGN luminosity, and central O vii(r) luminosity are all promising tracers of galaxies whose extended O vii(r) emission will be brightest.
3.3 Dependence on distance and location within the CGM
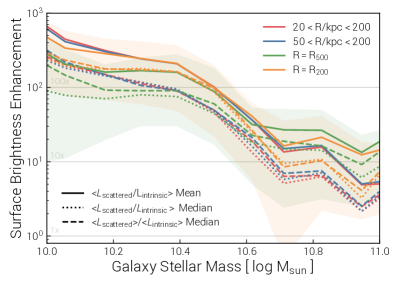
The degree to which scattering boosts O vii(r) surface brightness varies throughout the halo as a function of distance. Figure 6 again shows the O vii(r) surface brightness enhancement as a function of galaxy stellar mass, where we now visualize the result with the running median trend, instead of individual markers. This allows us to compare four different distance regimes: the entire circumgalactic medium excluding the central 20 kpc (red), the outer CGM only (; blue), at of the halo (green), and at of the halo (orange, as shown previously). The median trends of O vii(r) surface brightness enhancement are relatively insensitive to this choice. In all cases, the median across the galaxies decreases rapidly with mass, from at M⊙ to at M⊙. Across the four radial ranges considered, variation in the median is at the factor of two level at most. At low stellar masses, the halo outskirts have the smaller enhancements in comparison to the inner halo. In contrast, at high stellar masses, the halo outskirts have the larger enhancements.
In Figure 6 we also compare the enhancement computed in three different ways. First, as the mean of the ratio of the scattered luminosity to intrinsic luminosity, across all pixels in the relevant region of the surface brightness maps (solid lines). Second, as the median of the ratio of the same regions, i.e. pixel by pixel (dotted lines). Third, first taking the median surface brightness for scattered pixels, and likewise for intrinsic pixels, in the relevant region, and then their ratio. Overall, the enhancement factor does not strongly depend on this choice.777The first approach is consistent with Figure 5, while the last approach is more similar to the ratio of the radial surface brightness profiles as in Figure 4. We also note that taking the ratio of the mean scattered pixel value to the mean intrinsic pixel value, which is the same as taking the ratio of the total scattered luminosity to total intrinsic luminosity in the given radial range, is exactly consistent with Figure 4. In this case, the surface brightness enhancement is consistent with all the other measurements at large radii, while radial ranges including the inner halo have much lower enhancement factors, being dominated in luminosity by the bright central regions. The mean map enhancement is generally larger than the median, suggesting that localized regions within the CGM are preferentially boosted by scattering, even at a given, fixed distance such as . However, discreteness effects and shot noise in our Monte Carlo radiative transfer technique will artificially increase this effect to some degree, especially at smaller pixel sizes. The median values represent sky area weighted values, and median surface brightness enhancements tend to be a factor of 2 lower than mean values, regardless of stellar mass. At M⊙ the median enhancement factors are up to % lower than in the mean.
3.4 Observational checks and modeling sensitivities
We have seen that the impact of scattering depends strongly on the available luminosity in the bright, central region of the halo. This could either arise from the increasing dense gas of the CGM towards the halo center, with temperatures resulting from structure formation and of order the virial temperature (Nelson et al., 2016; Ramesh et al., 2023). Alternatively, it could arise from the hot, star-forming interstellar medium of the galaxy, or emission from the AGN, itself. In our case, the former is a direct output of the simulation coupled to our CLOUDY based emission model, and has no flexibility, while the latter is an ingredient designed to be controlled via the boost -parameter. We explore these aspects here, starting with a comparison with available observational constraints.
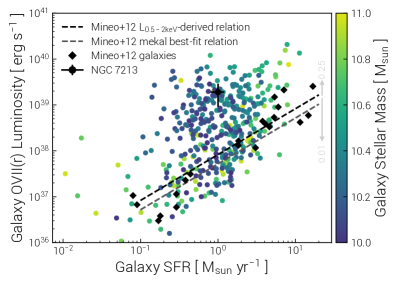
Figure 7 shows the scaling relation between galaxy O vii(r) luminosity and star formation rate. The TNG50 predictions, given our emission modeling, are shown as circles for the full sample, with color indicating stellar mass. We overplot the observational sample of Mineo et al. (2012) which includes 21 nearby, late-type galaxies with SFRs ranging from M⊙ yr-1 and stellar masses M⊙. We show the individual measurements (black symbols), as well as two best-fit relations (dashed lines).
A critical caveat exists: Mineo et al. (2012) measure the entire keV soft X-ray luminosity, and not the O vii(r) line luminosity alone. However, emission from the O vii(r) line is a fractional contribution to the broadband total. Knowing this fraction we could convert the observed broadband values into O vii(r) line values, and vice versa. We have therefore used Cloudy to compute this fraction for a single-zone case, for solar as well as one third solar metallicity gas, where the results are similar. The ( O vii(r)/ keV) flux ratio has a strong temperature and density dependence, peaking at for temperatures K and densities cm-3. That is, the O vii(r) line can be a large component of the soft broadband emission.888This would imply that even broadband keV luminosities predicted from theoretical models, if spatially localized e.g. to a galaxy or a particular regime of the CGM, could be substantially modified by scattering effects. Similarly, comparison of radial keV profiles (e.g. as recently undertaken with eROSITA/eFEDS; Comparat et al., 2022; Chadayammuri et al., 2022) must account for scattering of the individual lines within this band, to avoid the erroneous interpretation that simulated profiles are too steep. Outside of this range, for K or K or cm-3, the fractional contribution drops rapidly to negligible amounts. However, the hot interstellar medium and central dense CGM gas span a wide range of physical densities and temperatures. We have also preformed a calculation with the APEC collisional ionization model, considering all non-starforming gas within within TNG50-1 galaxies across our mass range. In this case, we find that the O vii(r) line flux is 10-15% of the keV total. However, this case excludes the hot ISM, and it is not clear if this is a lower limit, or how robust this fraction is.
We therefore proceed by adopting a reasonable fractional value of 0.1, and reduce the Mineo et al. (2012) broadband luminosities by this factor for a more direct comparison against the simulations in Figure 7. We simultaneously show, with gray arrows, the vertical shift had we instead assumed either 25 percent or 1 percent. We caution, however, that the resulting comparison is intended in the qualitative sense, i.e. as an order of magnitude assessment, rather than as a robust quantitative assessment. In addition to the uncertain conversion from line to broadband luminosity, the observational analysis of Mineo et al. (2012) also involves several additional steps. To isolate the emission of the hot ISM, they must remove many other sources of emission, including compact X-ray sources and counts from extremely bright compact X-ray sources, including PSF effects, as well as instrumental and cosmic X-ray backgrounds, unresolved high-mass and low-mass X-ray binaries, and other types of active/young stars. In addition, we measure luminosities within an aperture of the stellar half mass radius, which may not directly coincide with the aperture used in the observational analysis. Given the analysis complexities, differing samples, and different physical measurements, we do not suggest any direct nor quantitative comparison. Instead, we treat the Mineo et al. (2012) relations between and SFR as a qualitative guide.
Despite the caveats, the comparison is useful. First, the observations of Mineo et al. (2012) show a positive correlation between soft X-ray luminosity of the halo gas and galaxy SFR, which is also present in our model (see also Truong et al., 2020). However, this face-value comparison also suggests that, if anything, TNG50 central O vii(r) luminosities may be larger than in reality. This is an important caveat to our results on the impact of resonant scattering. If the simulated central luminosities in the O vii(r) line are too large (small), the relative impact of scattering will be over (under) estimated. Future data providing large statistical measurements of galaxy O vii(r) luminosity as a function of mass, including from LEM itself, are needed to help resolve this source of uncertainty.
Emission from diffuse, circumgalactic gas in O vii(r) has not been observationally detected. Measurements of O vii(r) luminosity from galaxies themselves are, indeed, limited, which is why we focused on the broadband Mineo et al. (2012) results above. In terms of O vii(r) emission, we have previously discussed NGC 7213, which has an observed luminosity of erg s-1 (Starling et al., 2005; Salvestrini et al., 2020, with RGS). This is a S0 at Mpc, with a bolometric erg s-1, a SMBH with mass M⊙ at , a SFR of M⊙ yr-1, and a strong outflow. A significant fraction of the O vii(r) emission from this galaxy may be due to the AGN itself, and/or to an AGN-driven outflow. We include NGC 7213 in Figure 7, as a potentially ‘normal’ galaxy against which we can compare. In contrast, NGC 253 is a nearby SAB starburst at Mpc which drives a hot superwind, similar to M82. Summing up all flux across four available spatial regions, it has a low luminosity of erg s-1 (Bauer et al., 2007). Finally, Liu et al. (2012) present a sample of nine nearby star-forming galaxies, with luminosities ranging from erg s-1. Ultimately, the realism of our O vii(r) emission model, and thus our results on the important impact of resonant scattering, require future X-ray data to fully assess.
A more accessible sanity check with data is the comparison of total broadband X-ray luminosity, i.e. in the keV energy range. Our line emission modeling in this work does not enable such a direct comparison, however we note that the TNG model outcome, and the TNG50 simulations in particular, have been compared against observations. In particular, Truong et al. (2020) model the X-ray luminosity of TNG galaxies with an APEC-based approach (excluding star-forming gas, our case, see Appendix C of that work). Focusing on small apertures of for keV, we compared against data from MASSIVE and ATLAS3D (Goulding et al., 2016), as well as the ETG sample of Lakhchaura et al. (2019). Considering out to five times the effective radii () for keV, we compared against early-type data from Babyk et al. (2018). In the galaxy mass range of interest here, the TNG50 simulations are well within the observational scatter of these datasets. Moreover, the key finding of Truong et al. (2020) was the prediction that, at fixed mass, star-forming galaxies should have X-ray brighter atmospheres than quenched galaxies (Truong et al., 2021a), a result which also holds in the EAGLE simulation (Oppenheimer et al., 2020) as well as in observations (e.g Su et al., 2015). This suggests that the inner density structure of the O vii(r) emitting CGM, and so the importance of resonant scattering, is sensitive to galactic feedback processes including AGN-driven outflows, as already shown in Figure 5.
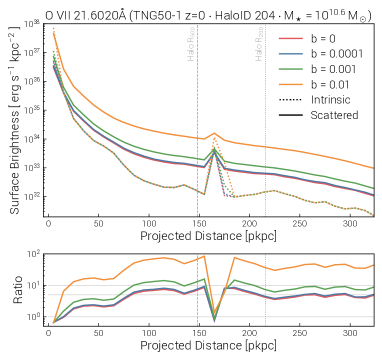
We conclude with a final comment on the impact of emission from the hot ISM itself. As a reminder, we incorporate a model for this component by treating star-forming gas as a two-phase medium (Springel & Hernquist, 2003) and adopting the hot-phase fractional density and temperature for the respective Cloudy computation. This gives us a non-vanishing, centrally concentrated emission which can represent both the hot ISM and the presence of an AGN. We scale the emissivity of this component by a free parameter . This fiducial value shows that the underlying physical assumptions of this emission component are rough at best, and/or that intrinsic absorption of O vii(r) in the dense ISM is non-negligible (as expected at high column densities; Lehmer et al., 2022; Vladutescu-Zopp et al., 2023). We note that the ISM component is a small contribution in general, and that the diffuse, non star-forming gas dominates the total luminosity budget of essentially all galaxies in our model.
Figure 8 shows the impact of changing the strength of the hot ISM emission component. We return to our single galaxy test case, the same halo as in Figures 1 and 2, showing the radial surface brightness profile of O vii(r) emission (top panel) and enhancement factor due to scattering (bottom panel). We contrast the intrinsic emission (dotted lines) with the scattered, observable emission (solid lines). We vary the parameter from (star-forming gas has no emission; red), to (fiducial choice; blue), (green), and (orange). Only in the latter cases does this emission component start to have a non-vanishing impact on the observable surface brightness profiles. However, we rule out such choices as leading to overly high galaxy luminosities. For our fiducial choice, the hot ISM component of our emission model has little importance. Instead, it is the density, temperature, and ionization structure of the diffuse gas, as directly resolved in the simulations and used for the emissivity calculations, which dominates our predictions for the observability of O vii(r) emission from the circumgalactic medium of galaxies.
4 Summary and Conclusions
In the near future, high resolution X-ray imaging spectroscopy will advance our understanding of the physics of the hot, virialized gas within dark matter halos. To date it has remained observationally elusive, but the hot circumgalactic medium of galaxies encodes signatures of the rich – albeit complex – interface of structure formation, galaxy evolution, and astrophysics.
In this study we have focused exclusively on one of the promising emission lines of highly ionized oxygen ions: the O vii(r) transition of the O vii He-like triplet, with an energy of keV in the soft X-rays. Due to its resonant nature, intrinsically emitted O vii(r) photons which originate from the bright halo center – e.g., the hot star-forming ISM, a central AGN, or the dense inner CGM – can scatter in the extended halo gas. This effect will enhance the observable surface brightness of the O vii(r) emitting circumgalactic medium.
To explore this phenomenon, we extend our Monte Carlo radiative transfer method, originally designed to study Lyman-alpha (Byrohl et al., 2021; Byrohl & Nelson, 2022), to also treat resonant metal-line transitions, including O vii(r). Taking advantage of its ability to ray-trace photons through unstructured Voronoi tessellations of space, we apply it to a sample of several hundred galaxies with at from the high-resolution galaxies from the TNG50 cosmological magnetohydrodynamical simulation (Nelson et al., 2019a; Pillepich et al., 2019). Our key findings are:
-
•
Resonant scattering significantly enhances the observable surface brightness of O vii(r) emission in the extended CGM of galaxies.
-
•
The boost to the observable surface brightness can be large, even an order of magnitude effect. We adopt the ratio of scattered (observable) to intrinsic O vii(r) surface brightness at the virial radius () as our ‘enhancement factor.’ This is largest for low-mass galaxies, and decreases with increasing stellar mass. At intermediate masses M⊙, the mean enhancement is a factor of one hundred. This decreases to a factor of ten by M⊙.
-
•
This scattering-induced enhancement boosts the entire extended CGM outside of 10 kpc, and is generally stronger with increasing distance away from the galaxy. The mean enhancement from each surface brightness map is much larger than the median, indicating that localized bright regions are preferentially boosted. For M⊙, the median surface brightness at the virial radius is enhanced by factor of 20 and 3, respectively.
-
•
The enhancement of O vii(r) surface brightness depends, at fixed stellar mass, on galaxy properties. Specifically, galaxies with higher star formation rates, higher supermassive black hole (AGN) bolometric luminosities, and central galaxy O vii(r) luminosities all have significantly larger enhancement factors. In contrast, there is no trend with halo mass at fixed stellar mass. The scatter in this respect is comparable to the overall mass trend, suggesting that an identifiable subset of the galaxy population will be the most promising targets for detecting scattering enhanced O vii(r) emission from the CGM.
We have concentrated on O vii(r) in large part because of its observability with the Line Emission Mapper (LEM) X-ray observatory concept (Kraft et al., 2022). While LEM could focus its primary CGM science survey on the non-resonant O vii(f) transition, which at is redshifted out of the Milky Way foreground emission, our results suggest that O vii(r) at slightly higher redshifts could be a compelling target. Namely, the CGM of galaxies at would also clear MW foregrounds, and the marginal % surface brightness dimming due to this distance increase would be far out-weighed by surface brightness enhancement factors of many, to tens, due to the impact of resonant scattering.999For comparison with O vii(r), we have also evaluated the impact of resonant scattering on the Ly line of O viii at Å by running our radiative transfer method on a number of TNG50 halos from our sample with M⊙. As expected, scattering has a much weaker impact for O viii. Enhancements are typically at the percent, to tens of percent, level, and roughly an order of magnitude less than for O vii(r). For the galaxy shown in Figures 1 and 2, the peak scattering enhancement of the O viii Ly surface brightness is %, as compared to a factor of ten for O vii(r). Scattering of this line may be more important for higher mass halos. At this redshift, the 30’ LEM field of view corresponds to approximately one physical Mpc, which is more than sufficient to capture the entire CGM of even the most massive halos considered here. In particular, the 1 Ms detectability level of erg s-1 kpc-2 for LEM (Figure 4) intersects our predicted surface brightness profile at a projected distance of kpc for high-mass M⊙ galaxies. The detectable O vii(r) CGM would therefore fill the inner detector. This will also be advantageous given the hybrid design that includes higher energy resolution pixels in the center: LEM will not only detect and spatially map this hot gas, but also characterize its kinematics.
In general, resonantly scattered X-ray line emission encapsulates a rich set of physics. Our methodology and results establish that forward modeling of this emission must account for radiative transfer effects. Future work can study additional observable implications, for example: the spectral distortions introduced by scattering, and possible surface brightness fluctuation smoothing effects. Scattering impacts all upcoming X-ray imaging spectroscopy missions and concepts, including XRISM, HUBS, and ATHENA. Properly treating this complexity opens new opportunities, as observations of resonantly scattering X-rays probe hot gas kinematics across several interesting regimes: microscopic turbulence, bulk flows, mixing, shock fronts, accretion streams, and feedback-driven outflows, from the circumgalactic medium of galaxies to the intracluster medium of the most massive dark matter halos in the Universe.
Data Availability
The IllustrisTNG simulations, including TNG50, are publicly available and accessible at www.tng-project.org/data, as described in Nelson et al. (2019a). Data directly related to this publication is available on request from the corresponding author.
Acknowledgements
DN and CB acknowledge funding from the Deutsche Forschungsgemeinschaft (DFG) through an Emmy Noether Research Group (grant number NE 2441/1-1). We also thank the Hector Fellow Academy for their funding support. This work was further supported by the Deutsche Forschungsgemeinschaft (DFG, German Research Foundation) under Germany’s Excellence Strategy EXC 2181/1 - 390900948 (the Heidelberg STRUCTURES Excellence Cluster). The material is based upon work supported by NASA under award number 80GSFC21M0002. IK acknowledge support by the COMPLEX project from the European Research Council (ERC) under the European Union’s Horizon 2020 research and innovation program grant agreement ERC-2019-AdG 882679. AO thanks Kristen Garofali for useful discussions. NW was supported by a CIERA Postdoctoral Fellowship. SVZ acknowledges support by the DFG project nr. 415510302. The TNG50 simulation was run with compute time awarded by the Gauss Centre for Supercomputing (GCS) under GCS Large-Scale Project GCS-DWAR on the Hazel Hen supercomputer at the High Performance Computing Center Stuttgart (HLRS). Additional computations were carried out on the Vera machine of the Max Planck Institute for Astronomy (MPIA) operated by the Max Planck Computational Data Facility (MPCDF).
References
- Anderson & Bregman (2010) Anderson M. E., Bregman J. N., 2010, ApJ, 714, 320
- Anderson & Bregman (2011) Anderson M. E., Bregman J. N., 2011, ApJ, 737, 22
- Anderson et al. (2015) Anderson M. E., Gaspari M., White S. D. M., Wang W., Dai X., 2015, MNRAS, 449, 3806
- Ayromlou et al. (2022) Ayromlou M., Nelson D., Pillepich A., 2022, arXiv e-prints, p. arXiv:2211.07659
- Babyk et al. (2018) Babyk I. V., McNamara B. R., Nulsen P. E. J., Hogan M. T., Vantyghem A. N., Russell H. R., Pulido F. A., Edge A. C., 2018, ApJ, 857, 32
- Barret et al. (2013) Barret D., et al., 2013, preprint, (arXiv:1308.6784)
- Bauer et al. (2007) Bauer M., Pietsch W., Trinchieri G., Breitschwerdt D., Ehle M., Read A., 2007, A&A, 467, 979
- Bird et al. (2014) Bird S., Vogelsberger M., Haehnelt M., Sijacki D., Genel S., Torrey P., Springel V., Hernquist L., 2014, MNRAS, 445, 2313
- Bogdán et al. (2013) Bogdán Á., et al., 2013, ApJ, 772, 97
- Byrohl & Nelson (2022) Byrohl C., Nelson D., 2022, arXiv e-prints, p. arXiv:2212.08666
- Byrohl et al. (2021) Byrohl C., et al., 2021, MNRAS, 506, 5129
- Chadayammuri et al. (2022) Chadayammuri U., Bogdán Á., Oppenheimer B. D., Kraft R. P., Forman W. R., Jones C., 2022, ApJ, 936, L15
- Chakraborty et al. (2021) Chakraborty P., Ferland G. J., Chatzikos M., Guzmán F., Su Y., 2021, ApJ, 912, 26
- Churazov et al. (2001) Churazov E., Haehnelt M., Kotov O., Sunyaev R., 2001, MNRAS, 323, 93
- Churazov et al. (2004) Churazov E., Forman W., Jones C., Sunyaev R., Böhringer H., 2004, MNRAS, 347, 29
- Churazov et al. (2005) Churazov E., Sazonov S., Sunyaev R., Forman W., Jones C., Böhringer H., 2005, MNRAS, 363, L91
- Churazov et al. (2010) Churazov E., Zhuravleva I., Sazonov S., Sunyaev R., 2010, Space Sci. Rev., 157, 193
- Comparat et al. (2022) Comparat J., et al., 2022, A&A, 666, A156
- Davies et al. (2020) Davies J. J., Crain R. A., Oppenheimer B. D., Schaye J., 2020, MNRAS, 491, 4462
- Donahue & Voit (2022) Donahue M., Voit G. M., 2022, Phys. Rep., 973, 1
- Eckert et al. (2021) Eckert D., Gaspari M., Gastaldello F., Le Brun A. M. C., O’Sullivan E., 2021, Universe, 7, 142
- Ezoe et al. (2021) Ezoe Y., Ohashi T., Mitsuda K., 2021, Reviews of Modern Plasma Physics, 5, 4
- Faucher-Giguère et al. (2009) Faucher-Giguère C.-A., Lidz A., Zaldarriaga M., Hernquist L., 2009, ApJ, 703, 1416
- Ferland et al. (2017) Ferland G. J., et al., 2017, Rev. Mex. Astron. Astrofis., 53, 385
- Genel et al. (2014) Genel S., et al., 2014, MNRAS, 445, 175
- Gilfanov et al. (1987) Gilfanov M. R., Syunyaev R. A., Churazov E. M., 1987, Soviet Astronomy Letters, 13, 3
- Goulding et al. (2016) Goulding A. D., et al., 2016, ApJ, 826, 167
- Grevesse et al. (2010) Grevesse N., Asplund M., Sauval A. J., Scott P., 2010, Ap&SS, 328, 179
- Hitomi Collaboration et al. (2018a) Hitomi Collaboration et al., 2018a, PASJ, 70, 9
- Hitomi Collaboration et al. (2018b) Hitomi Collaboration et al., 2018b, PASJ, 70, 10
- Kaastra et al. (2013) Kaastra J., et al., 2013, preprint, (arXiv:1306.2324)
- Khabibullin & Churazov (2019) Khabibullin I., Churazov E., 2019, MNRAS, 482, 4972
- Kobayashi et al. (2006) Kobayashi C., Umeda H., Nomoto K., Tominaga N., Ohkubo T., 2006, ApJ, 653, 1145
- Kraft et al. (2022) Kraft R., et al., 2022, arXiv e-prints, p. arXiv:2211.09827
- Lakhchaura et al. (2019) Lakhchaura K., Truong N., Werner N., 2019, MNRAS, 488, L134
- Lehmer et al. (2022) Lehmer B. D., Eufrasio R. T., Basu-Zych A., Garofali K., Gilbertson W., Mesinger A., Yukita M., 2022, ApJ, 930, 135
- Li & Wang (2013) Li J.-T., Wang Q. D., 2013, MNRAS, 428, 2085
- Liu et al. (2012) Liu J., Wang Q. D., Mao S., 2012, MNRAS, 420, 3389
- Lovisari et al. (2015) Lovisari L., Reiprich T. H., Schellenberger G., 2015, A&A, 573, A118
- Lujan Niemeyer et al. (2022) Lujan Niemeyer M., et al., 2022, ApJ, 929, 90
- Marinacci et al. (2018) Marinacci F., et al., 2018, MNRAS, 480, 5113
- McDonald et al. (2013) McDonald M., et al., 2013, ApJ, 774, 23
- Mineo et al. (2012) Mineo S., Gilfanov M., Sunyaev R., 2012, MNRAS, 426, 1870
- Naiman et al. (2018) Naiman J. P., et al., 2018, MNRAS, 477, 1206
- Nandra et al. (2013) Nandra K., et al., 2013, arXiv e-prints, p. arXiv:1306.2307
- Nelson et al. (2016) Nelson D., Genel S., Pillepich A., Vogelsberger M., Springel V., Hernquist L., 2016, MNRAS, 460, 2881
- Nelson et al. (2018a) Nelson D., et al., 2018a, MNRAS, 475, 624
- Nelson et al. (2018b) Nelson D., et al., 2018b, MNRAS, 477, 450
- Nelson et al. (2019a) Nelson D., et al., 2019a, Computational Astrophysics and Cosmology, 6, 2
- Nelson et al. (2019b) Nelson D., et al., 2019b, MNRAS, 490, 3234
- Nelson et al. (2021) Nelson D., Byrohl C., Peroux C., Rubin K. H. R., Burchett J. N., 2021, MNRAS, 507, 4445
- Ogorzalek et al. (2017) Ogorzalek A., et al., 2017, MNRAS, 472, 1659
- Oppenheimer et al. (2018) Oppenheimer B. D., Segers M., Schaye J., Richings A. J., Crain R. A., 2018, MNRAS, 474, 4740
- Oppenheimer et al. (2020) Oppenheimer B. D., et al., 2020, ApJ, 893, L24
- Pakmor et al. (2011) Pakmor R., Bauer A., Springel V., 2011, MNRAS, 418, 1392
- Pakmor et al. (2014) Pakmor R., Marinacci F., Springel V., 2014, ApJ, 783, L20
- Pillepich et al. (2018a) Pillepich A., et al., 2018a, MNRAS, 473, 4077
- Pillepich et al. (2018b) Pillepich A., et al., 2018b, MNRAS, 475, 648
- Pillepich et al. (2019) Pillepich A., et al., 2019, MNRAS, 490, 3196
- Pillepich et al. (2021) Pillepich A., Nelson D., Truong N., Weinberger R., Martin-Navarro I., Springel V., Faber S. M., Hernquist L., 2021, MNRAS, 508, 4667
- Planck Collaboration (2016) Planck Collaboration 2016, A&A, 594, A13
- Pop et al. (2022) Pop A.-R., et al., 2022, arXiv e-prints, p. arXiv:2205.11528
- Porquet et al. (2010) Porquet D., Dubau J., Grosso N., 2010, Space Sci. Rev., 157, 103
- Portinari et al. (1998) Portinari L., Chiosi C., Bressan A., 1998, A&A, 334, 505
- Pratt et al. (2009) Pratt G. W., Croston J. H., Arnaud M., Böhringer H., 2009, A&A, 498, 361
- Prochaska et al. (2011) Prochaska J. X., Kasen D., Rubin K., 2011, ApJ, 734, 24
- Rahmati et al. (2013) Rahmati A., Pawlik A. H., Raičevic M., Schaye J., 2013, MNRAS, 430, 2427
- Ramesh et al. (2023) Ramesh R., Nelson D., Pillepich A., 2023, MNRAS, 518, 5754
- Robson & Davé (2020) Robson D., Davé R., 2020, MNRAS, 498, 3061
- Salvestrini et al. (2020) Salvestrini F., Gruppioni C., Pozzi F., Vignali C., Giannetti A., Paladino R., Hatziminaoglou E., 2020, A&A, 641, A151
- Sanders & Fabian (2006) Sanders J. S., Fabian A. C., 2006, MNRAS, 370, 63
- Sazonov et al. (2002) Sazonov S. Y., Sunyaev R. A., Cramphorn C. K., 2002, A&A, 393, 793
- Sijacki et al. (2015) Sijacki D., Vogelsberger M., Genel S., Springel V., Torrey P., Snyder G. F., Nelson D., Hernquist L., 2015, MNRAS, 452, 575
- Simionescu et al. (2019a) Simionescu A., et al., 2019a, Space Sci. Rev., 215, 24
- Simionescu et al. (2019b) Simionescu A., et al., 2019b, MNRAS, 483, 1701
- Springel (2010) Springel V., 2010, MNRAS, 401, 791
- Springel & Hernquist (2003) Springel V., Hernquist L., 2003, MNRAS, 339, 289
- Springel et al. (2018) Springel V., et al., 2018, MNRAS, 475, 676
- Starling et al. (2005) Starling R. L. C., Page M. J., Branduardi-Raymont G., Breeveld A. A., Soria R., Wu K., 2005, MNRAS, 356, 727
- Stevens et al. (2019) Stevens A. R. H., et al., 2019, MNRAS, 483, 5334
- Su et al. (2015) Su Y., Irwin J. A., White Raymond E. I., Cooper M. C., 2015, ApJ, 806, 156
- Sunyaev et al. (1993) Sunyaev R. A., Markevitch M., Pavlinsky M., 1993, ApJ, 407, 606
- Suresh et al. (2017) Suresh J., Rubin K. H. R., Kannan R., Werk J. K., Hernquist L., Vogelsberger M., 2017, MNRAS, 465, 2966
- Truong et al. (2020) Truong N., et al., 2020, MNRAS,
- Truong et al. (2021a) Truong N., Pillepich A., Werner N., 2021a, MNRAS, 501, 2210
- Truong et al. (2021b) Truong N., Pillepich A., Nelson D., Werner N., Hernquist L., 2021b, MNRAS, 508, 1563
- Verner et al. (1996) Verner D. A., Verner E. M., Ferland G. J., 1996, Atomic Data and Nuclear Data Tables, 64, 1
- Vikhlinin et al. (2009) Vikhlinin A., et al., 2009, ApJ, 692, 1060
- Vladutescu-Zopp et al. (2023) Vladutescu-Zopp S., Biffi V., Dolag K., 2023, A&A, 669, A34
- Vogelsberger et al. (2014a) Vogelsberger M., et al., 2014a, MNRAS, 444, 1518
- Vogelsberger et al. (2014b) Vogelsberger M., et al., 2014b, Nature, 509, 177
- Weinberger et al. (2017) Weinberger R., et al., 2017, MNRAS, 465, 3291
- Werner et al. (2009) Werner N., Zhuravleva I., Churazov E., Simionescu A., Allen S. W., Forman W., Jones C., Kaastra J. S., 2009, MNRAS, 398, 23
- Whitney (2011) Whitney B. A., 2011, Bulletin of the Astronomical Society of India, 39, 101
- Wiersma et al. (2009) Wiersma R. P. C., Schaye J., Smith B. D., 2009, MNRAS, 393, 99
- Wijers & Schaye (2022) Wijers N. A., Schaye J., 2022, MNRAS, 514, 5214
- XRISM Science Team (2020) XRISM Science Team 2020, arXiv e-prints, p. arXiv:2003.04962
- Zhuravleva et al. (2010) Zhuravleva I. V., Churazov E. M., Sazonov S. Y., Sunyaev R. A., Forman W., Dolag K., 2010, MNRAS, 403, 129
- Zhuravleva et al. (2011) Zhuravleva I. V., Churazov E. M., Sazonov S. Y., Sunyaev R. A., Dolag K., 2011, Astronomy Letters, 37, 141
- Zinger et al. (2020) Zinger E., et al., 2020, arXiv e-prints, p. arXiv:2004.06132
- ZuHone et al. (2022) ZuHone J., et al., 2022, arXiv e-prints, p. arXiv:2212.11028
- de Plaa et al. (2012) de Plaa J., Zhuravleva I., Werner N., Kaastra J. S., Churazov E., Smith R. K., Raassen A. J. J., Grange Y. G., 2012, A&A, 539, A34