Athermal quasistatic cavitation in amorphous solids: effect of random pinning
Abstract
Amorphous solids are known to fail catastrophically via fracture, wherein cavitation at nano-metric scales is known to play a significant role. Micro-alloying via inclusions is often used as a means to increase the fracture toughness of amorphous solids. Modeling such inclusions as randomly pinned particles that move only affinely and do not participate in plastic relaxation, we study how the pinning influences the process of cavitation-driven fracture in an amorphous solid. Using extensive numerical simulations and probing in the athermal quasistatic limit, we show that just by pinning a very small fraction of particles, the tensile strength is increased and also the cavitation is delayed. Further, the cavitation that is expected to be spatially heterogeneous becomes spatially homogeneous by forming a large number of small cavities instead of a dominant cavity.
I Introduction
The mechanical properties of amorphous solids are utilized in diverse applications in industries and our daily lives Schuh et al. (2007); Bonn et al. (2017). Therefore, mechanical failure of these materials is an area of concern. Hence, understanding the physical processes that lead to the failure of these structurally disordered solids is a domain of current active research, with the primary goal being to figure out design pathways that can sustain against such failures Rodney et al. (2011); Liu et al. (2021). Cavitation, i.e., the formation of nano-cavities within the solid, has been identified as a precursor to eventual failure via fracture Bouchaud et al. (2008); Murali et al. (2011). In experiments, the fracture in amorphous solids has been shown to propagate via the coalescence of cavities in the solid along the direction of the crack Shen et al. (2021), which has motivated numerical investigations to analyze the mechanisms underlying the cavitation process Guan et al. (2013); Chaudhuri and Horbach (2016); Altabet et al. (2018a, b); Paul et al. (2020). Recently Dattani et al. (2022), it has been demonstrated that the plasticity associated with cavitation has the same universal characteristic elastoplastic response of amorphous solids undergoing failure via cavitation under uniform expansionDattani et al. (2022) and on exploring a combination of loading scenarios where cavitation can occurDattani et al. (2023). In Ref.Dattani et al. (2023), we demonstrated that a combination of deformation processes, for example, uniform expansion followed by oscillatory shear of a certain amplitude, can enhance the formation of cavities at densities that are much higher than the cavitation density observed in uniform expansion only. These results suggest that in a natural deformation process in which various forms of deformations will be coupled together, the material can show unpredictable failure behavior, which will be difficult to control. Thus a systematic study of how such a cavity-dominated failure process in an amorphous solid can be mitigated effectively will be of significant interest for practical applications.
In the quest of making glasses with higher fracture-toughness, the seeding of the amorphous solids with micro-alloyed inclusions has gained a lot of popularity in the last few years Hofmann et al. (2008); Hardin and Homer (2015); Torquato and Haslach Jr (2002); Tyukodi et al. (2016); Garrett et al. (2012); González (2016). In the numerical modeling, a minimal model of these micro-alloyed inclusions describes these inclusions as pinned/frozen particles Gendelman et al. (2014); Bhowmik et al. (2019a, b); Liu et al. (2023). In the context of probing their mechanical behavior, it is assumed that they only move affinely during the deformation and do not actually undergo non-affine motion. Using such a model system, systematic studies investigating the response of a pinned amorphous solid to a shear-deformation have explored the microscopic theoriesGendelman et al. (2014), yielding mechanismsBhowmik et al. (2019a), suppression of shear-banding Bhowmik et al. (2019b), development of intrinsic length-scales Bhowmik et al. (2019a); Liu et al. (2023) etc. As these studies focus on the shear-deformation of high-density amorphous solids, they do not access the region where cavitation instabilities occur, i.e., under axial tension Altabet et al. (2018a); Dattani et al. (2022, 2023). Due to the importance of cavitation instabilities in fracture, it becomes important to study the response of an amorphous solid under deformation modes where cavitation can occur.
In this work, we, therefore, study the response of amorphous solids with micro-alloyed inclusions modeled as pinned particles under uniform expansive deformation under athermal quasistaic conditions. We find that, even in presence of a very small fraction of pinned particles, cavitation becomes more spatially homogeneous and the cavitation point shift to lower densities and lower pressures, implying a higher load-bearing capacity of the pinned solid. The sharp brittle-yielding-like transition seen in unpinned solids becomes more gradual with significantly smaller sizes of plastic events due to which system size dependence becomes very weak. On tracking the eigenvalues of the Hessian near cavitation instabilities, we find that, on the potential energy landscape, cavitation occurs via a saddle-node bifurcation and the average spatial decay of displacements in the plastic eigenmodes from the plastic center reveal a length-scale in pinned solids that parallels the length-scale set by average distance between two pinned sites. The presence of a length-scale explains the absence of system-size effects and the drastic decrease in the mean sizes of plastic events. Our findings thus reveal how micro-alloyed inclusions can suppress the cavitation and how the presence of a length-scale of plasticity controls the deformation response of such a pinned solid.
The manuscript is organised as follows. After initial introductory discussion in Section I, we provide in Section II a brief overview of the model amorphous solid that we consider for our study and the methodology of our simulations as well as analysis. In Section III, we discuss the detailed findings of our investigations regarding the presence of random pinning and its influence on the cavitation process. Finally, we provide a concluding discussion in Section IV.
II Model and Methods
II.1 Model details and initial states
We use the well-characterized two-dimensional model consisting of two species labelled and at concentration ratio, interacting via pairwise Lennard-Jones potential. The interaction parameters are – , , , , , Brüning et al. (2008). With this model, we smoothen the interaction potential up to first two derivatives. The form of the interactions between and particle becomes:
| (1) |
where,
| (2) |
Here, and correspond to either of the labels or . The constants , and are determined by requiring the potential and its first two derivatives to be zero at the cutoff . The simulations have been performed for a variety of system sizes ranging from to .
II.2 Initial states
To prepare initial states for our study, we first equilibriate the system at (in LJ units), which is in the liquid regime, followed by cooling at a constant rate of per MD timestep to a final temperature of Bhowmik et al. (2019a), which is in the glassy regime. The corresponding glass transition temperature of the model system is at Brüning et al. (2008). The athermal states used in our study are generated by obtaining inherent structure states corresponding to the glassy configurations at , via conjugate gradient (CG) minimizationPolak and Ribiere (1969).
II.3 Athermal Quasistatic Expansion
Starting from a spatially homogeneous high density state ( for KABLJ) having positive barostatic pressure, we study the athermal quasi-static response (i.e. in the absence of any thermal effects and in the limit of vanishing driving rates) of this system to isotropic expansion Altabet et al. (2018a). In each expansion step, a constant volume strain is applied on the system by rescaling the length of the box by a factor along with affine transformation of particle coordinates, followed by minimization of the energy of this strained configuration using the conjugate gradient algorithm Polak and Ribiere (1969). The values of are varied from to . The AQE simulations are done using LAMMPSPlimpton (1995).
II.4 Pinning
We choose a small fraction of particles to in the generated solid and freeze their motion. The particles are chosen randomly as long as no two pinned particles lie within the cut off of the interaction between themBhowmik et al. (2019a). This helps avoiding the scenario where two close-by pinned sites increase the energy of the system. The pinned particles only move affinely when the strain is applied. During the energy minimization, these pinned particles are not allowed to move.
II.5 Hessian of potential energy
LAPACKEAnderson et al. (1999) is used for doing the stability analysis of the local minima states, by computing eigenvalues and eigenvectors of the Hessian matrix , which is defined as
| (3) |
where is the potential energy of the system and is the position vector of particle . The indices whereas .
If we now consider a system of particles, where particle numbers, are free and particle numbers are pinned, then the potential energy of such a system can be expressed as
| (4) |
where the first term comes from the interactions between unpinned particles, the second term comes due to the interactions between the pinned and the unpinned particles. Note that the term due to interactions between pinned sites is set to zero because of our pinning protocol
By substituting Eq.(4) in Eq.(3) , it can be shown that the first term in the sum of Eq.(4) gives a contribution,
| (5) |
The second term of the sum in Eq.(4) gives,
| (6) |
where and are first and second derivatives of the pair-potential with respect to variable respectively.
III Results
III.1 Yielding and spatial ramifications
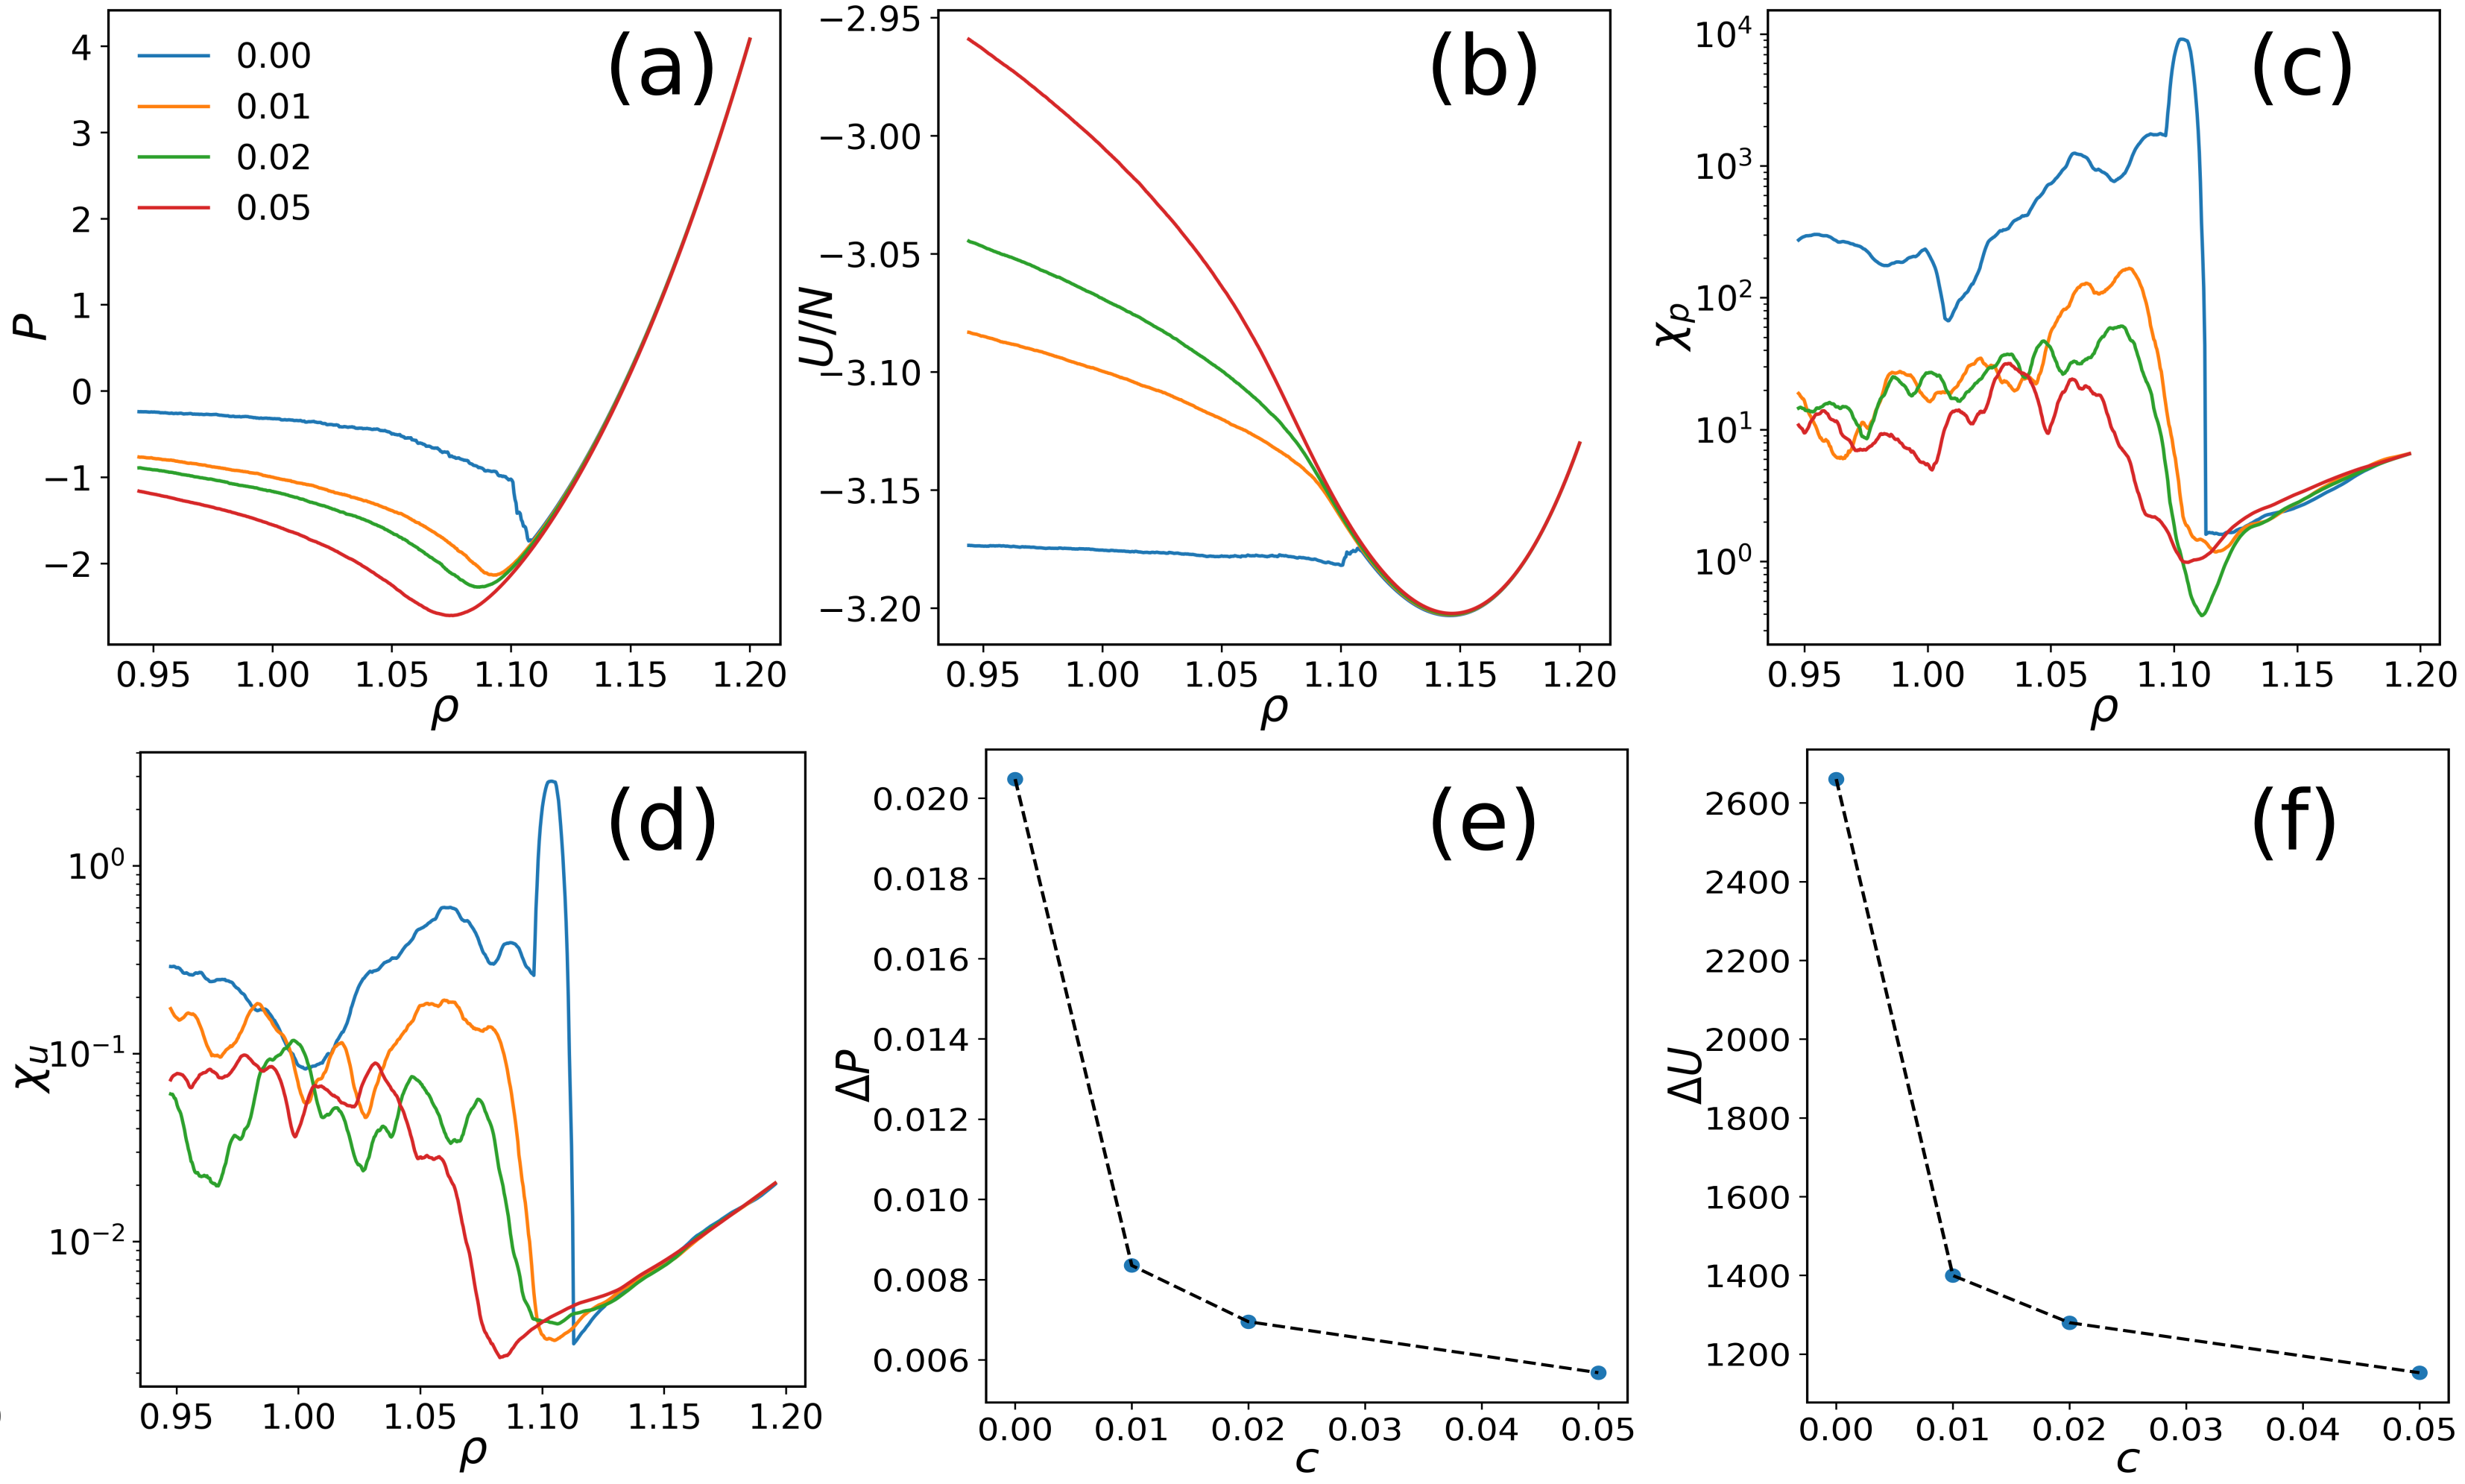
Upon expanding the amorphous solid isotropically under quasistatic loading, as discussed in previous worksAltabet et al. (2018a); Dattani et al. (2022), the pressure of the solid decreases monotonically, eventually reaching negative values. After a certain threshold, a sharp jump in the pressure accompanies the cavitation of the solid. Upon further expansion, the cavities grow and merge, leading to system-spanning fracture of the solid Dattani et al. (2022). Here, we expand the same amorphous solid isotropically but with a small fraction of particles pinned(frozen) and compare it with the case without pinningAltabet et al. (2018a); Dattani et al. (2022). As shown in Fig. 1(a), compared to the unpinned solid, the pinned solid, on average, does not show a large pressure jump that is seen around the first cavitation event. The location of the yield point, which is usually marked by a turn in the pressure-density curves, shifts to lower and lower densities with increasing concentration of pinned particles, , demonstrating an increase in the load-bearing capacity of pinned solids. In the pinned solids (), the turning of the curve occurs due to small pressure jumps that occur gradually, leading to a smooth average pressure vs density () curve as opposed to the ensemble-averaged trajectories of an unpinned solid (), which show an abrupt jump. A similar trend reflects in the per particle energy vs density () plots in Fig. 1(b) i.e. no large energy drop shows up in the pinned solid unlike the case of unpinned solid and in fact, the energy per particle of the pinned solid keeps increasing with increasing pinning concentration. The nature of critical-like behaviour in the () or () plots can be studied by measuring the fluctuations of pressure and energy at a given value of density across ensembles as characterized by the following susceptibilitiesDattani et al. (2022),
| (7) | |||||
| (8) |
and shown in Fig. 1(c) & (d) respectively. A sharp susceptibility peak around the big pressure jump / energy drop seen in the unpinned solid Dattani et al. (2022) is tamed down due to pinning. For higher pinning concentrations, a clear peak around the yielding is not seen implying that the yielding of the solid is more localised and gradual. The gradual nature of cavitation in pinned solids is also echoed in the average size of pressure jumps and energy drops encountered during expansion (see 1(e) & (f)) for different pinning concentrations . The average size of avalanches, & decreases drastically with increasing values of implying suppression of large pressure jumps and energy drops.
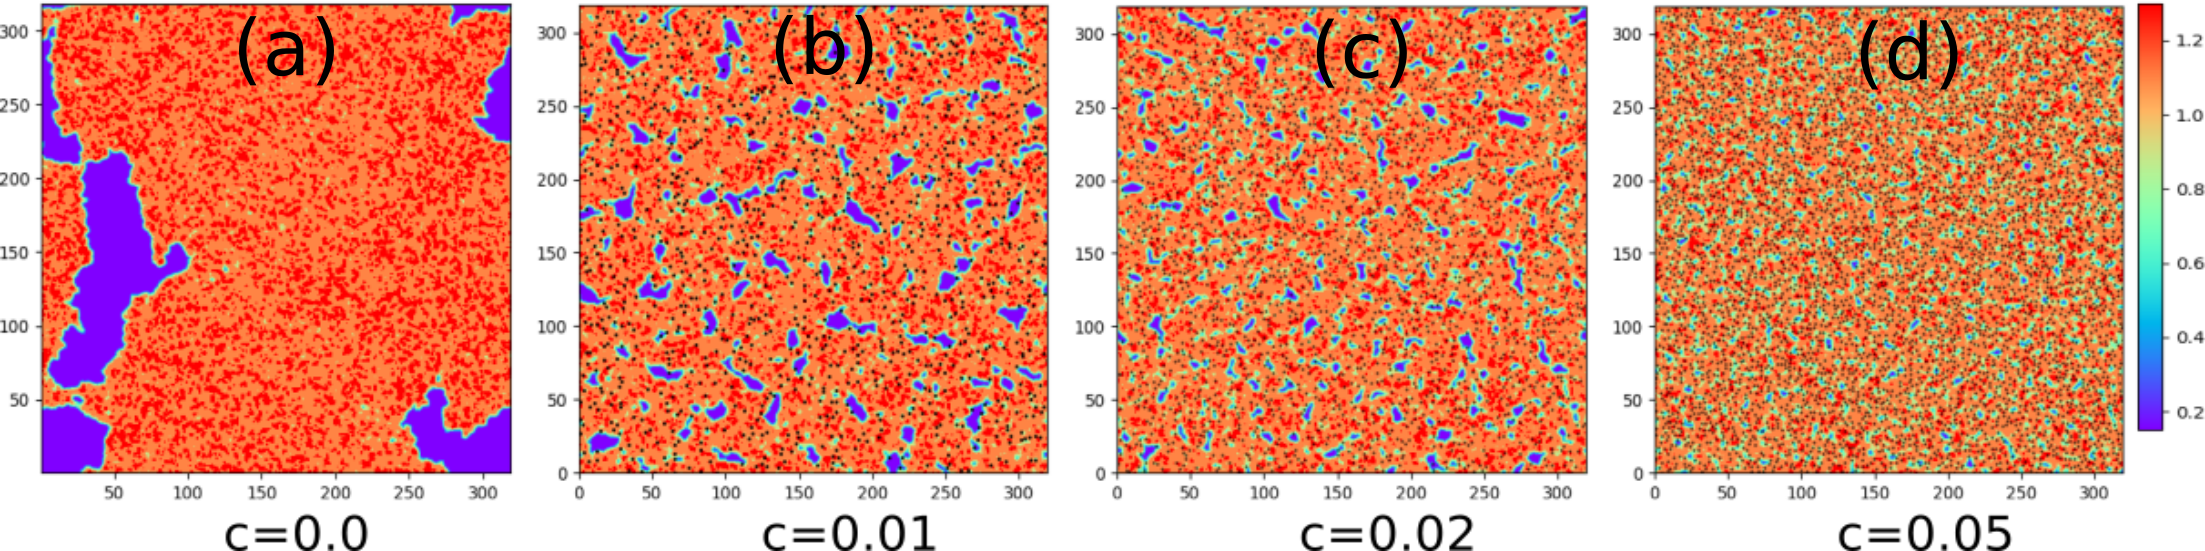
To probe the spatial-nature of cavitation in pinned solids, we look at the coarse-grained spatial density maps for different values of at a same value of density ( shown in Fig. 2). They suggest that the cavitation occurs at multiple sites in the solid gradually over the course of expansion for instead of a heterogeneous cavitation starting with a big cavity for . The creation of a large number of cavities in the system also explains the increase in energy with expansion seen in Fig. 1(b) as presence of a large number of particles on the surfaces is expected to increase the energy of pinned solids. So, to summarise, pinning smooths out the sharp brittle yielding-like cavitation transition seen in amorphous solids without any micro-alloying and causes less heterogeneous cavitation. This scenario is consistent with a previous study on effect of pinning on yielding transition under simple shearBhowmik et al. (2019a) where pinning made the yielding more spatially homogeneous.
III.2 System-size effects
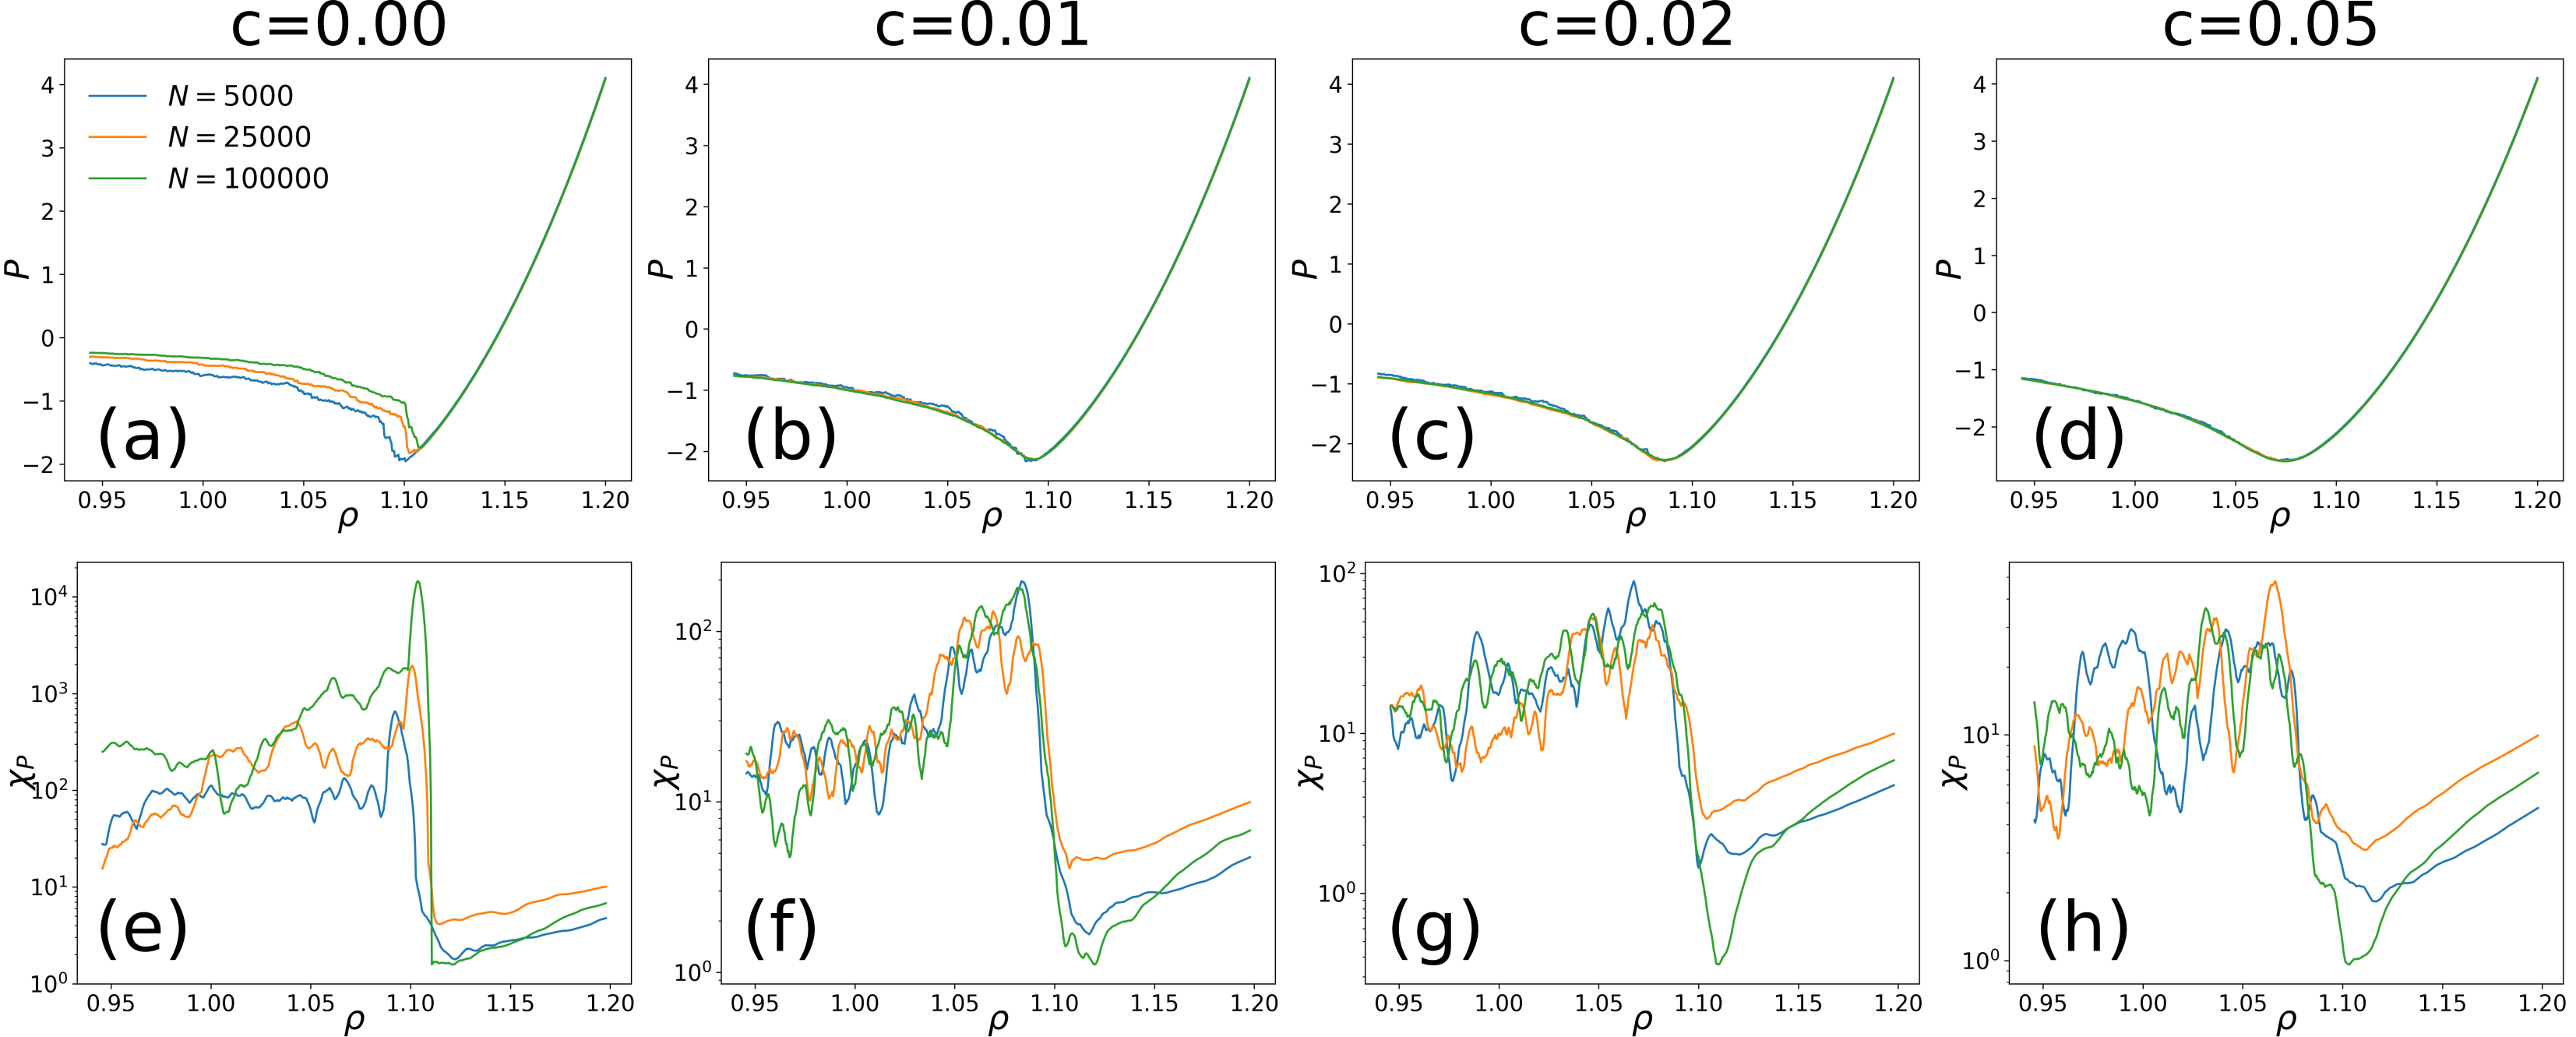
In Ref. Dattani et al. (2022), strong system size effects were observed in the the curves for athermal quasistatic expansion of amorphous solid. Hence it is important to probe the dependence on system sizes for pinned solids as well. The plots and plots for different system sizes across the pinning concentrations are shown in Fig.3 top panel and bottom panels, respectively. Unlike the case of unpinned solids, the and curves for pinned solids show little to no dependence on the system size. This occurs due to the emergence of an intrinsic length scale of plasticity in these systems due to the imposed random pinning constraints, which are discussed in the subsequent paragraphs.
III.3 Irreversible plastic events on the potential energy landscape
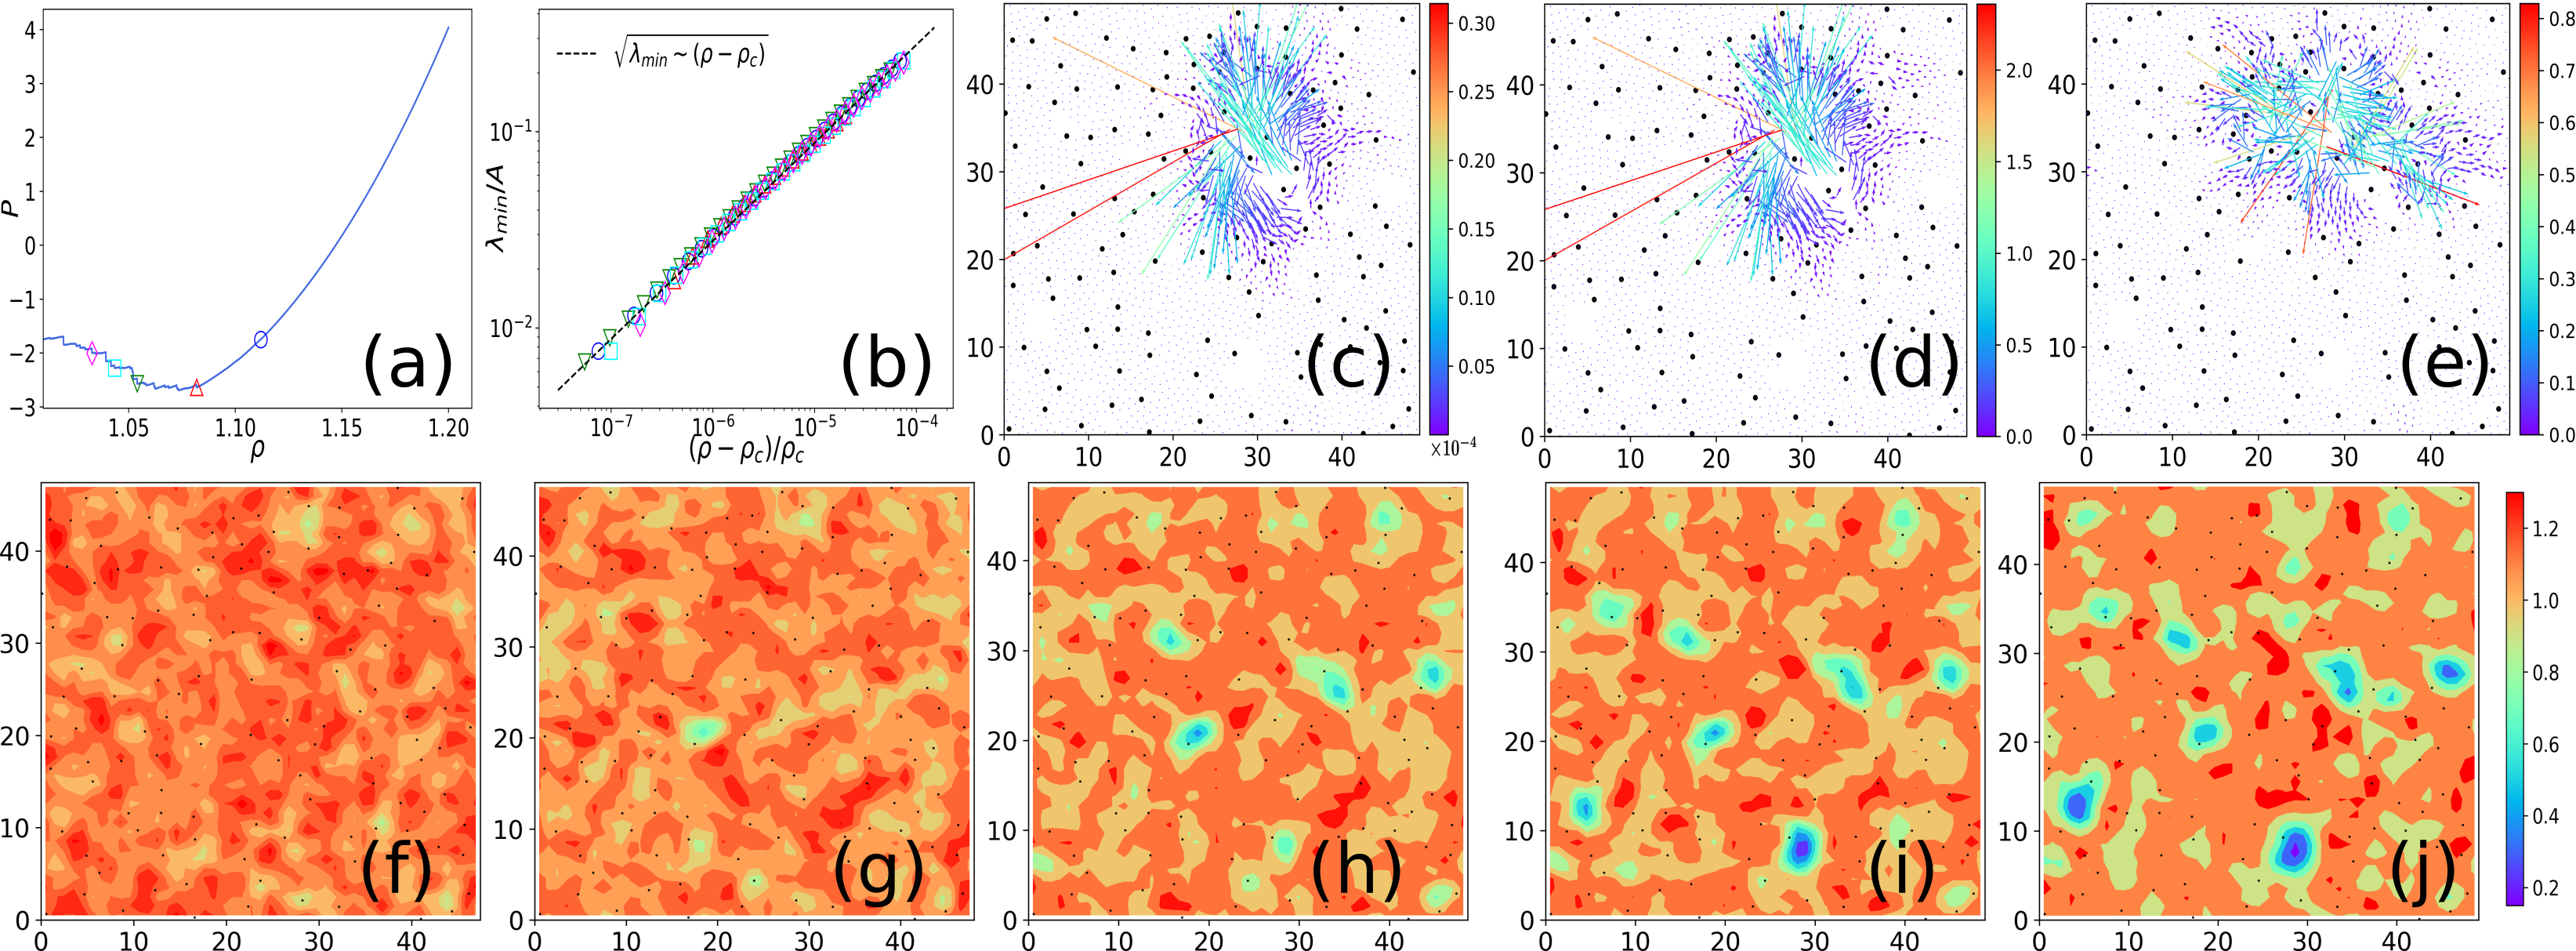
Under athermal quasistatic shear, near a plastic instability, the lowest non-zero eigenvalue (apart from the two zero-modes in 2D) of the hessian matrix of the potential energy Eq. 3 is known to vanish as a square root of strain difference from the point of instability Malandro and Lacks (1999); Maloney and Lemaître (2006). i.e. , where refers to the minimum eigenvalue. This occurs due to a saddle-node bifurcation on a potential energy landscape (PEL) where the local minima in which the system resides becomes unstable in one direction. One of the possible ways to arrive at such a square-root power law has been discussed in Ref. Karmakar et al. (2010a), where it has been shown how the nature of non-affine displacements in amorphous solids near a plastic instability with only gives rise to the square-root singularity. Vanishing of only the lowest non-zero eigenvalue near the plastic instability ensures that the spatial map of eigenmode corresponding to the vanishing eigenvalue dominates the displacement field on the approach to such a plastic instability Maloney and Lemaître (2006). The same scenario of a square-root singularity with only one vanishing eigenvalue was shown to hold under athermal quasistatic expansion on approach to a cavitation instability as well Dattani et al. (2022).
In the current context of the athermal quasistatic expansion of pinned solids, we find that the same square-root singularity scenario holds. In Fig. 4(a), we show one such trajectory corresponding to & . Fig.4(b) shows the square root singularity at which the lowest-eigenvalue of the Hessian vanishes as on approach to the plastic instability at the points marked in Fig.4(a), where is the point at which the plastic instability occurs. The Fig. 4(d)-(e) show an eigenmode on the approach to the plastic instability, displacement field on the approach to the plastic instability, and the displacement field across the pressure drop, respectively, for one of the pressure-jumps in Fig.4(a)& (b). As evident from the vector-field maps, the displacement fields on the approach to instability are predicted by the eigenvector of , but the displacement fields across the pressure jump do not have a high overlap with the eigenmode on the approach to the instability. This occurs because of the cascade/avalanche nature of the plastic jump. These avalanches are also more localized spatially due to pinning, unlike those seen in unpinned solids which can be system spanningLemaître and Caroli (2009); Karmakar et al. (2010b); Dattani et al. (2022). All in all, the mechanism of plasticity on PEL being analogous to unpinned solids does not come as a surprise because pinning only blocks certain pathways of relaxation on the PEL of unpinned solids Niblett et al. (2018).
III.4 Spatial decay of plastic modes and a length scale of plasticity
The plasticity under shear deformation is known to occur via localised rearrangements of particles in a shear transformation zone Argon and Kuo (1979); Falk and Langer (1998); Richard et al. (2021a). These localised rearrangements(and their eigenmode) have a quadrupolar shape Eshelby (1957); Gartner and Lerner (2016) and the radial part of the displacements of the medium decay as ; where is the distance from the center of rearrangement, and is the spatial dimensions. Even though the rearrangements are local, the displacement fields have a long-range character, i.e., in 2d, they decay as from the center. The eigenmodes, , corresponding to the vanishing eigenvalue are known to decide the direction of failure on the PEL for both shear and expansion Maloney and Lemaître (2006); Tanguy et al. (2010); Manning and Liu (2011); Dattani et al. (2022).
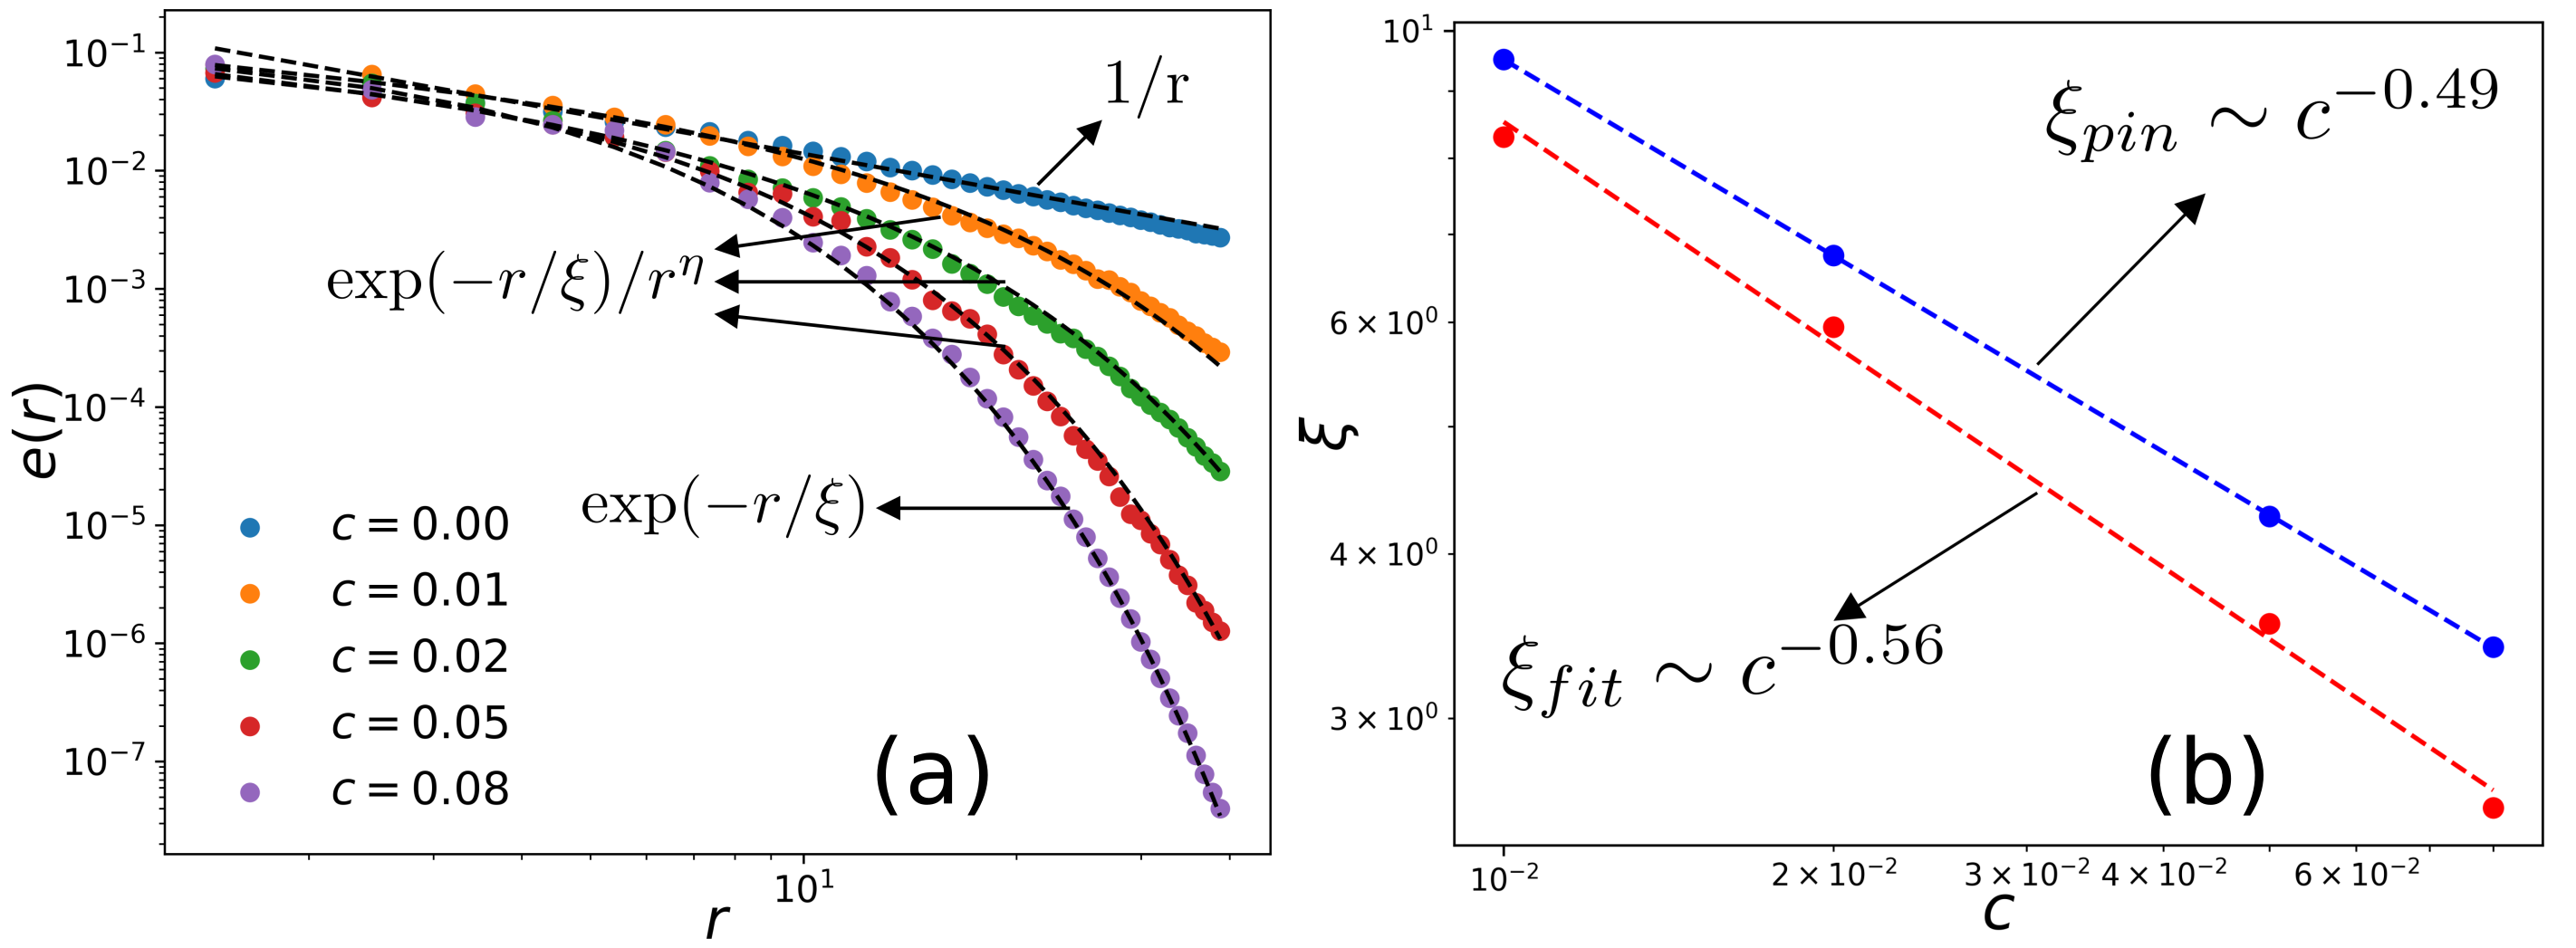
In the context of pinning, we, too, look at the radial decay profile of displacements from the plastic center 111defined as particle undergoing highest displacement in an eigenmode of the eigenmode , just before the plastic event, i.e., at a distance of , in the pre-yield regime. We choose to study the spatial profiles in the pre-yield regime, where density inhomogeneities (which can interfere with the profile shapes) are largely absent. The decay profiles averaged over plastic events for each pinning concentration are shown in Fig.5(a). For the unpinned case, as one would expect, the decay profile . For the pinned solids, interestingly, we find two regimes. For the smaller pinning concentrations, viz. , and , we see that the decay profile fits a screened power-law function with for and whereas for . For larger pinning concentration, viz. , we find that the decay profile is well-fitted by an exponential form suggesting a crossover from a screening-like decay to a purely exponential decay. The scale-dependent exponential part of the decay profile allows us to extract a length scale from the fit parameters. The values of for different pinning concentrations are shown using red color in Fig.5(b).
For a fixed pinning concentration , one naturally obtains a length scale , which denotes an average distance between any two pinned sites. But, since the eigenmode decay profiles shown in Fig.5(a) are sampled at different densities from the expansion trajectory, the blue curve showing for the sampled densities in Fig.5(b). The length scale extracted from the fits in Fig. 5(a) thus shows reasonable parallels with the length scale introduced by pinning as seen in Fig.5(b). The decay exponents of length scales with pinning concentrations for is slightly different from exponent primarily due to the changes in density where these decay profiles are obtained for each pinning concentration.
The exponential nature of the decay profiles and the extracted length scales thus suggest that, with increasing pinning concentrations, the displacements in the eigenmode become more and more localized. This implies that the consequence of plastic events in a pinned solid has reduced spatial effects, unlike the unpinned solid, which has a non-local power-law character. Hence, this will restrict the size of cascades/avalanches, which are caused due to triggering of multiple such plastic modes at different spatial locationsStanifer and Manning (2022). This is also consistent with the data in Fig.1(e) & (f), where the magnitude of the drops in pressure/energy decrease with an increase in pinning concentration. The presence of a plasticity length scale in pinned solids also explains why there are negligible system size effects in the data shown in Fig. 3 as long as , which is the case for the system sizes that we report. As the length-scale prevents the system from acting as a whole beyond the lengths .
IV Summary & Discussion
To summarize, using extensive numerical simulations, we have investigated how random inclusions, at the level of atoms/particles, influence the cavitation failure in amorphous solids. Our studies are done in the athermal quasistatic limit, i.e., where fluctuations originating from thermal fluctuations or finite deformation rates are absent. Like in previous studies, we model the inclusions as randomly pinned particles that only undergo affine motion during the mechanical deformation process but do not undergo any non-affine motion during the plastic relaxation.
We demonstrate how an amorphous solid with a small concentration of micro-inclusions, intended to make the solid stronger, can delay the cavitation and increase the tensile strength. The resulting glass obtained from the inclusions is thus not only stronger glass but also less susceptible to catastrophic fracture failure via cavitation. From a thermodynamic point of view, the delay in cavitation and, thus, the increase in tensile strength is likely a result of a change in the densities of coexisting solid and gas phases in the temperature-density Sastry (2000); Testard et al. (2011) phase diagram of the amorphous solid. A sharp yielding-like cavitation transition observed in amorphous solids Altabet et al. (2018a); Dattani et al. (2022) accompanied by an extensive peak in the pressure fluctuations characterized via a susceptibility is suppressed by particle-pinning. Particle pinning not only increases the tensile strength but also decreases the size of avalanches that lead to cavitation in amorphous solids by restricting them spatially; as a result, the cavitation occurs more homogeneously in this pinned solid. The expansion response of a pinned solid is somewhat analogous to the shear response of a ductile solid, as the sharp macroscopic drop leading to yielding is absent. But the analogy with a ductile solid doesn’t hold completely as the yielding via cavitation is delayed in pinned solids. In a ductile solid, the yielding under shear would occur at lower strains and bulk stress Yeh et al. (2020). Also, with increasing system sizes, the ductile solid shows brittle behaviour under shear via shear-banding-like events, as claimed in a recent work Richard et al. (2021b). In our range of probing, the finite size effects in the pressure vs curves and the pressure fluctuation vs curves do not show such a brittle-like character for the large system sizes. The absence of finite-size effects in the and curves, along with decreasing sizes of avalanches, is explained using a length-scale extracted from the spatial decay of displacements in plastic-eigenmodes.
We have modeled these micro-alloyed inclusions via random pinning, which is a drastic simplifying approximation. Future studies can perhaps create more realistic models of inclusions in amorphous solids and study their deformation response. In Ref. Das et al. (2017), it was found that a particle that has a larger size compared to the typical size of the particles of the host medium can act as temporary pinning sites (termed as “soft pinning”) over a timescale relevant to the medium relaxation time. Similarly, particles having different geometric shapes, like rods, can have significantly lower mobility due to their enhanced caging effect in a crowded environment and can also act as possible micro-alloying agents. Recent experimental realization of this “soft pinning” concept in colloidal glasses Ganapathi et al. (2018), molecular glasses Das et al. (2021), and glassy polymer mixture Kikumoto et al. (2020) is indeed very encouraging, indicating a clear possibility to test some of our results in experiments.
V Acknowledgements
We thank the HPC facility at IMSc-Chennai for providing computational resources. S.K. would like to acknowledge the support from Swarna Jayanti Fellowship Grants No. DST/SJF/PSA-01/2018-19 and No. SB/SFJ/2019-20/05 and Core Research Grant from SERB via grant CRG/2019/005373. PC acknowledges funding from SERB via grant MTR/2022/001034.
References
- Schuh et al. (2007) C. A. Schuh, T. C. Hufnagel, and U. Ramamurty, Acta Materialia 55, 4067 (2007).
- Bonn et al. (2017) D. Bonn, M. M. Denn, L. Berthier, T. Divoux, and S. Manneville, Reviews of Modern Physics 89, 035005 (2017).
- Rodney et al. (2011) D. Rodney, A. Tanguy, and D. Vandembroucq, Modelling and Simulation in Materials Science and Engineering 19, 083001 (2011).
- Liu et al. (2021) C. Liu, S. Dutta, P. Chaudhuri, and K. Martens, Physical Review Letters 126, 138005 (2021).
- Bouchaud et al. (2008) E. Bouchaud, D. Boivin, J.-L. Pouchou, D. Bonamy, B. Poon, and G. Ravichandran, Europhysics Letters 83, 66006 (2008).
- Murali et al. (2011) P. Murali, T. Guo, Y. Zhang, R. Narasimhan, Y. Li, and H. Gao, Physical Review Letters 107, 215501 (2011).
- Shen et al. (2021) L.-Q. Shen, J.-H. Yu, X.-C. Tang, B.-A. Sun, Y.-H. Liu, H.-Y. Bai, and W.-H. Wang, Science Advances 7, eabf7293 (2021).
- Guan et al. (2013) P. Guan, S. Lu, M. J. B. Spector, P. K. Valavala, and M. L. Falk, Phys. Rev. Lett. 110, 185502 (2013).
- Chaudhuri and Horbach (2016) P. Chaudhuri and J. Horbach, Physical Review B 94, 094203 (2016).
- Altabet et al. (2018a) Y. E. Altabet, A. L. Fenley, F. H. Stillinger, and P. G. Debenedetti, The Journal of Chemical Physics 148, 114501 (2018a), https://doi.org/10.1063/1.5019274 .
- Altabet et al. (2018b) Y. E. Altabet, A. L. Fenley, F. H. Stillinger, and P. G. Debenedetti, The Journal of Chemical Physics 148, 114501 (2018b).
- Paul et al. (2020) K. Paul, R. Dasgupta, J. Horbach, and S. Karmakar, Phys. Rev. Research 2, 042012 (2020).
- Dattani et al. (2022) U. A. Dattani, S. Karmakar, and P. Chaudhuri, Phys. Rev. E 106, 055004 (2022).
- Dattani et al. (2023) U. A. Dattani, R. Sharma, S. Karmakar, and P. Chaudhuri, arXiv preprint arXiv:2303.04529 (2023).
- Hofmann et al. (2008) D. C. Hofmann, J.-Y. Suh, A. Wiest, G. Duan, M.-L. Lind, M. D. Demetriou, and W. L. Johnson, Nature 451, 1085 (2008).
- Hardin and Homer (2015) T. J. Hardin and E. R. Homer, Acta Materialia 83, 203 (2015).
- Torquato and Haslach Jr (2002) S. Torquato and H. Haslach Jr, Appl. Mech. Rev. 55, B62 (2002).
- Tyukodi et al. (2016) B. Tyukodi, C. A. Lemarchand, J. S. Hansen, and D. Vandembroucq, Physical Review E 93, 023004 (2016).
- Garrett et al. (2012) G. R. Garrett, M. D. Demetriou, J. Chen, and W. L. Johnson, Applied Physics Letters 101, 241913 (2012).
- González (2016) S. González, Journal of Materials Research 31, 76 (2016).
- Gendelman et al. (2014) O. Gendelman, A. Joy, P. Mishra, I. Procaccia, and K. Samwer, Acta materialia 63, 209 (2014).
- Bhowmik et al. (2019a) B. P. Bhowmik, P. Chaudhuri, and S. Karmakar, Phys. Rev. Lett. 123, 185501 (2019a).
- Bhowmik et al. (2019b) B. P. Bhowmik, S. Karmakar, I. Procaccia, and C. Rainone, Phys. Rev. E 100, 052110 (2019b).
- Liu et al. (2023) Y. Liu, H. Liu, and H. Peng, Journal of Non-Crystalline Solids 601, 122052 (2023).
- Brüning et al. (2008) R. Brüning, D. A. St-Onge, S. Patterson, and W. Kob, Journal of Physics: Condensed Matter 21, 035117 (2008).
- Polak and Ribiere (1969) E. Polak and G. Ribiere, Revue française d’informatique et de recherche opérationnelle. Série rouge 3, 35 (1969).
- Plimpton (1995) S. Plimpton, Journal of Computational Physics 117, 1 (1995).
- Anderson et al. (1999) E. Anderson, Z. Bai, C. Bischof, S. Blackford, J. Demmel, J. Dongarra, J. Du Croz, A. Greenbaum, S. Hammarling, A. McKenney, and D. Sorensen, LAPACK Users’ Guide, 3rd ed. (Society for Industrial and Applied Mathematics, Philadelphia, PA, 1999).
- Malandro and Lacks (1999) D. L. Malandro and D. J. Lacks, The Journal of Chemical Physics 110, 4593 (1999), https://doi.org/10.1063/1.478340 .
- Maloney and Lemaître (2006) C. E. Maloney and A. Lemaître, Phys. Rev. E 74, 016118 (2006).
- Karmakar et al. (2010a) S. Karmakar, E. Lerner, and I. Procaccia, Phys. Rev. E 82, 026105 (2010a).
- Lemaître and Caroli (2009) A. Lemaître and C. Caroli, Phys. Rev. Lett. 103, 065501 (2009).
- Karmakar et al. (2010b) S. Karmakar, E. Lerner, I. Procaccia, and J. Zylberg, Phys. Rev. E 82, 031301 (2010b).
- Niblett et al. (2018) S. P. Niblett, V. K. de Souza, R. L. Jack, and D. J. Wales, The Journal of Chemical Physics 149, 114503 (2018), https://doi.org/10.1063/1.5042140 .
- Argon and Kuo (1979) A. Argon and H. Kuo, Materials Science and Engineering 39, 101 (1979).
- Falk and Langer (1998) M. L. Falk and J. S. Langer, Phys. Rev. E 57, 7192 (1998).
- Richard et al. (2021a) D. Richard, G. Kapteijns, J. A. Giannini, M. L. Manning, and E. Lerner, Phys. Rev. Lett. 126, 015501 (2021a).
- Eshelby (1957) J. D. Eshelby, Proceedings of the royal society of London. Series A. Mathematical and physical sciences 241, 376 (1957).
- Gartner and Lerner (2016) L. Gartner and E. Lerner, Phys. Rev. E 93, 011001 (2016).
- Tanguy et al. (2010) A. Tanguy, B. Mantisi, and M. Tsamados, Europhysics Letters 90, 16004 (2010).
- Manning and Liu (2011) M. L. Manning and A. J. Liu, Phys. Rev. Lett. 107, 108302 (2011).
- Note (1) Defined as particle undergoing highest displacement in an eigenmode.
- Stanifer and Manning (2022) E. Stanifer and M. L. Manning, Soft Matter 18, 2394 (2022).
- Sastry (2000) S. Sastry, Physical Review Letters 85, 590 (2000).
- Testard et al. (2011) V. Testard, L. Berthier, and W. Kob, Physical review letters 106, 125702 (2011).
- Yeh et al. (2020) W.-T. Yeh, M. Ozawa, K. Miyazaki, T. Kawasaki, and L. Berthier, Phys. Rev. Lett. 124, 225502 (2020).
- Richard et al. (2021b) D. Richard, C. Rainone, and E. Lerner, The Journal of Chemical Physics 155, 056101 (2021b).
- Das et al. (2017) R. Das, S. Chakrabarty, and S. Karmakar, Soft matter 13, 6929 (2017).
- Ganapathi et al. (2018) D. Ganapathi, K. H. Nagamanasa, A. Sood, and R. Ganapathy, Nature communications 9, 397 (2018).
- Das et al. (2021) R. Das, B. P. Bhowmik, A. B. Puthirath, T. N. Narayanan, and S. Karmakar, arXiv preprint arXiv:2106.06325 (2021).
- Kikumoto et al. (2020) G. Kikumoto, N. Torii, K. Fukao, C. P. Royall, H. Yao, Y. Saruyama, and S. Tatsumi, arXiv preprint arXiv:2003.06089 (2020).