A physically motivated analytical expression for the temperature dependence of the zero-field splitting of the nitrogen-vacancy center in diamond
Abstract
The temperature dependence of the zero-field splitting (ZFS) between the and levels of the nitrogen-vacancy (NV) center’s electronic ground-state spin triplet can be used as a robust nanoscale thermometer in a broad range of environments. However, despite numerous measurements of this dependence in different temperature ranges, to our knowledge no analytical expression has been put forward that captures the scaling of the ZFS of the NV center across all relevant temperatures. Here we present a simple, analytical, and physically motivated expression for the temperature dependence of the NV center’s ZFS that matches all experimental observations, in which the ZFS shifts in proportion to the occupation numbers of two representative phonon modes. In contrast to prior models our expression does not diverge outside the regions of fitting. We show that our model quantitatively matches experimental measurements of the ZFS from 15 to 500 K in single NV centers in ultra-pure bulk diamond, and we compare our model and measurements to prior models and experimental data.
Introduction.— The zero-field splitting (ZFS) quantifies the energy difference between a spin system’s levels in the absence of externally applied fields. This value plays a critical role in determining the properties of spin defects in crystals, which have emerged as leading platforms for quantum sensing [1, 2, 3, 4] and quantum networking [5, 6]. Besides characterizing a spin defect’s level structure, the ZFS can also be temperature dependent and thereby provides a mechanism for nanoscale thermometry. This effect has already been exploited with the nitrogen-vacancy (NV) center in diamond for in vivo thermometry [7, 8, 9] and thermal conductivity measurements [10]. In the context of the NV center, the ZFS refers to the splitting between the and levels of the negatively charged NV center’s electronic ground-state spin triplet.
The centrality of the ZFS to NV physics and its applications to thermometry has motivated a number of prior works examining its temperature dependence [11, 12, 13, 14, 15, 16, 17, 18]. While various analytical expressions have been fit to the measured NV ZFS temperature dependence over specific temperature ranges, to our knowledge all prior models make use of power series expansions or other approximate polynomial expressions, and as such diverge outside the range of experimental data used to fit the models and tend to provide little physical insight [12, 13, 15, 16]. Recent ab initio efforts have demonstrated near quantitative agreement between numerical calculations and experiment, but lack useful analytical expressions [18]. These factors motivate the development of a model of the NV ZFS temperature dependence that is both analytical and physically motivated, such that the model is predictive and practically useful over a wide temperature range, and also provides insight into the spin-lattice interactions that give rise to the temperature dependence.
In this work, we measure the ZFS as a function of temperature in multiple, as-grown, single NV centers in high-purity bulk diamond over a wide range of experimentally relevant temperatures, from 15 to 500 K. We present a novel, simple analytical model of the ZFS temperature dependence in which the ZFS shifts in proportion to the occupation numbers of two representative phonon modes. We provide physical justification for the model by demonstrating that it describes the effects of both first- and second-order atomic displacements. Finally, we discuss the advantages of the proposed model over other currently available models and we highlight the applicability of the proposed model to other spin-lattice effects in spin defects.
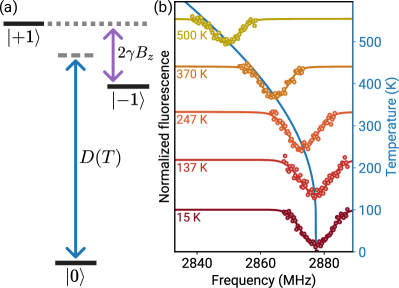
Experimental methods.— The NV center electronic ground-state level structure is depicted in Fig. 1a. An external magnetic field is commonly applied along the NV axis to lift the degeneracy by , where MHz/G is the NV gyromagnetic ratio. However, measurements in this work are conducted using a pulsed optically-detected magnetic resonance (ODMR) sequence under no externally applied field (Fig. 1b). The ZFS is recorded as the center frequency of the fit to each spectrum [19]. The experimental apparatus is similar to that described in Ref. [20]. The apparatus features dual low- and high-temperature operation modes where the sample temperature is monitored by a resistance temperature detector (RTD) mounted immediately adjacent to the diamond sample. Experiments are conducted using two sets of NV centers within the same high-purity bulk diamond sample ([NV] ppb). Low-temperature measurements were conducted with 5 single NV centers comprising set A at temperatures between 15 and 295 K. Unfortunately, after switching from low-temperature to high-temperature operation we were unable to relocate the region with the NV centers in set A. High-temperature measurements were therefore conducted with 5 single NV centers in a different region comprising set B at temperatures between 296 and 500 K. NVs belonging to the same set are within approximately 100 microns of each other, and are over 10 microns below the diamond surface. The two sets are mutually exclusive and from different regions of the diamond. Further experimental details are available in the Supplemental Material [19].
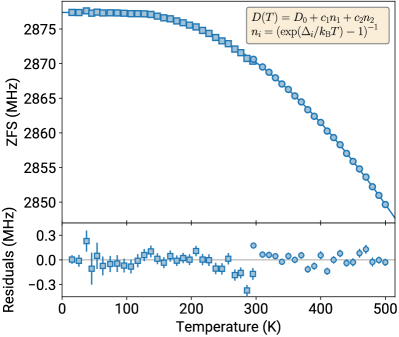
Results.— Figure 2 shows the average ZFS recorded for the NV centers belonging to each set (set A - blue filled squares, set B - blue filled circles) as a function of temperature. For reasons that we detail below, the following model provides an excellent fit to the experimental data:
| (1) |
where
| (2) |
is the mean occupation number for a phonon mode with energy , and is the total number of discrete phonon modes included in the model. Here is the ZFS at a given temperature , is the ZFS at 0 K, the are coefficients describing the strength of the contribution of each phonon mode to the ZFS, and is the Boltzmann constant. We find that including only representative phonon modes is sufficient to fully capture the behavior of the ZFS over the entire temperature range measured in this and prior works [19], resulting in the simple analytical expression:
| (3) |
We fit Eq. 3 to the data with the quantities , , and as free parameters. The values extracted from the fit are presented in Table 1. The energies of the two phonon modes as determined by the fit are meV and meV. These energies are roughly consistent with the highest energies of the diamond acoustic and optical phonon branches respectively, and coincide with the energies of the two representative phonon modes found to dominate spin-phonon relaxation [20] and the NV optical phonon sideband [21, 22, 23, 24] ([19]).
| (MHz) | (MHz) | (meV) | (MHz) | (meV) |
| 2877.38 0.03 | -54.91 7.35 | 58.73 2.32 | -249.6 19.4 | 145.5 8.4 |
The fit residuals are consistent with statistical uncertainties over most of the measured temperature range (Fig. 2 bottom). Larger residuals arise near room temperature where the measured ZFS values from sets A and B were found to be offset from each other by approximately 300 kHz. The low-temperature measurements made in this work are similarly approximately 300 kHz below those reported by Chen et al. and Li et al. in Refs. [12, 15]. The offset with respect to these prior measurements is consistent both near room temperature and at very low temperatures where the ZFS has a weak temperature dependence, suggesting that the low ZFS values of the set A NVs may be the result of a small but real physical effect in the diamond resulting in a shift, rather than arising from a systematic error in measurement. The ZFS values of the NV centers in set A display more variation than the ZFS values of the NV centers from other regions of the same diamond sample recorded under ambient conditions, suggesting that the local environment of the set A centers may feature large strain or a higher density of charged defects. To investigate this we measured the room temperature ODMR spectra of a number of NV centers in different spatial locations throughout the diamond sample, and identified another region (distinct from the regions containing the set A and set B NV centers) in which most NV centers exhibit MHz-scale splittings of the ZFS line. Taken together, these observations suggest that an individual NV center requires careful calibration in order to function as a temperature sensor with high absolute accuracy. Further discussion and a figure showing the result of the room temperature ODMR survey are available in the Supplemental Material [19].
Discussion.— We now turn to a discussion of the physical origins of Eq. 1. For a generic solid-state spin system, changes in temperature affect the positions of atoms in the solid which in turn modulate the system’s electronic wavefunction, leading the ZFS to acquire a temperature dependence. For the NV center, the ZFS is the result of the spin-spin interaction between the NV’s two unpaired electrons [26]. As the electron spin density is highly localized to the three carbon atoms adjacent to the vacancy, the ZFS can be accurately modeled by accounting for the temperature-dependent positions of the atoms nearest the defect [26]. Recent ab initio work has achieved near-quantitative agreement with experiment by considering the time-averaged atomic positions in a 64 atom supercell up to second order [18]. Here we adopt a similar premise as a starting point. With indicating the contribution to the ZFS at the th order in the atomic displacements,
| (4) |
As in Eq. (1), is the ZFS at zero temperature. The linear term is given by
| (5) |
where indicates the time average and is the displacement of the th atom in the lattice along the axis. The quadratic term is given by
| (6) |
As we explain below, both the first-order and second-order contributions can be written as a weighted sum over a small number of mean phonon occupation numbers, ultimately yielding the proposed model given by Eq. (1).
Beginning with the first-order contributions, the time-averaged first-order atomic displacements are proportional to the deviation of the lattice constant from its zero-temperature limit:
| (7) |
where and denote the lattice constant at temperature and 0 K respectively, and the are coefficients. First-order contributions to the ZFS are therefore proportional to the change in the lattice constant as a function of temperature. To obtain an expression for this quantity, we adopt the quasi-harmonic approximation, in which the crystal’s phonon modes are assumed to have volume-dependent frequencies but are otherwise treated harmonically. The quasi-harmonic approximation is widely used to account for thermal expansion in crystals, where the coefficient of thermal expansion is [27]
| (8) |
Here, the th phonon mode with polarization has energy and mean occupation number . The bulk modulus and volume are denoted and respectively. The frequency derivatives are closely related to the Grüneisen parameters that appear in the quasi-harmonic model of thermal expansion [28, 29]. We obtain the lattice constant from the coefficient of thermal expansion using
| (9) |
Integrating Eq. (8) with and neglecting the weak temperature dependence of the bulk modulus, the argument of the exponential becomes a weighted sum over mean occupation numbers. After expanding the exponential and dropping higher order terms we obtain
| (10) |
where . This sum can be simplified by considering only a small number of representative modes with modified coefficients that absorb the effects of the other modes. For diamond, we find that a sum over just two modes displays excellent agreement with measurements of the lattice constant as a function of temperature. Reduced to two modes, Eq. (10) becomes
| (11) |
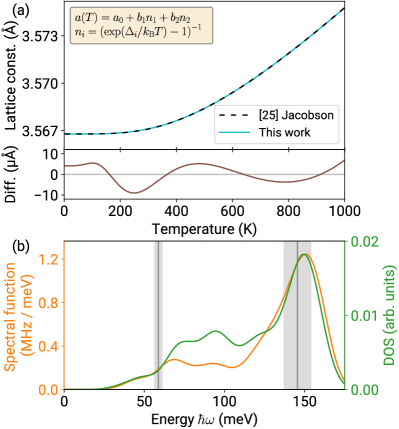
As in Eq. (3) the are the mean occupation numbers of the representative modes. Matching the energies extracted from the ZFS temperature dependence fit, we fix the energies of the modes to meV and meV. We treat the zero-temperature lattice constant and the coefficients as fit parameters. To demonstrate that this model accurately captures the temperature dependence of the diamond lattice constant, we fit Eq. 10 to a set of lattice constant data generated from the results of Ref. [25], which accurately matches experimental measurements of the diamond lattice constant. (Further details regarding the generated data are available in the Supplemental Material [19].) As shown in Fig. 3a, Eq. (11) provides an excellent description of the diamond lattice constant with only three free parameters. Over the fit range of 0 to 1000 K, the maximal difference between the two curves is just 9 , or 0.11% of the change in the lattice constant between 0 and 1000 K. The first-order contribution to the NV ZFS temperature dependence is therefore well approximated as
| (12) |
where the are here simply interpreted as unknown weights.
By writing Eq. 6 in terms of the normal coordinates the second-order contribution to the ZFS for a generic system can similarly be expressed as a weighted sum over occupation numbers:
| (13) |
Assuming that the time average of the cross terms is zero, each of the remaining terms is proportional to the mode occupation number in the quasi-harmonic approximation [18]. Thus we can write
| (14) |
where the are second-order spin-phonon coupling coefficients proportional to the second derivatives in Eq. 13. In the continuum limit, the coupling coefficients are replaced by the second-order spin-phonon spectral density defined such that
| (15) |
where is the mean occupation number at energy . The NV center spectral density and phonon density of states according to the supercell calculations described in Ref. [20] are reproduced in Fig. 3a as the orange and green lines respectively. In Ref. [20], it was shown that NV center spin-phonon relaxation can be reproduced by replacing this spectral density with two representative phonon modes, and we take the same approach here. The similarity between the spectral density and the density of states indicates that this may be done most effectively by retaining the modes associated with a large density of states. Because such modes are also good representative modes for the diamond lattice constant, we expect that the second-order contributions to the ZFS can be expressed by considering the same two representative modes used to describe the first-order contribution as given in Eq. 12. Therefore we have
| (16) |
where the coefficients are again unknown weights. Finally combining the contributions up to second order yields
| (17) |
and substituting , we arrive at Eq. (3).
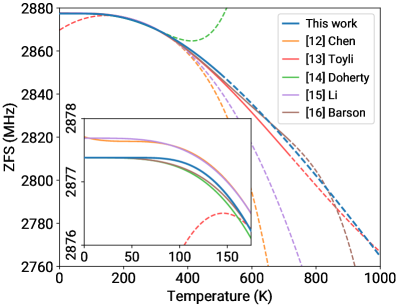
In Fig. 4 we compare our model to ZFS temperature dependence expressions from prior works that were fit to experimental data spanning a temperature range of at least 100 K. For clarity, the experimental data from the prior works is not shown in the main text plot, but is available in the Supplemental Material [19]. The NV center has been coherently manipulated at temperatures up to approximately 1000 K [30], (at temperatures above 600 K the temperature was verified by recording the ZFS and inverting the ZFS temperature dependence expression from Ref. [13],) so we treat 0-1000 K as the full experimentally relevant temperature range. Each model provides a good description of the data on which it was fit (solid regions of lines in Fig. 4, see [19]), but all models aside from the model proposed in this work diverge at either high or low temperatures outside of the regions they were fit to, which is characteristic of power series. We provide more detailed direct comparisons between the models in the Supplemental Material [19].
The available experimental data sets somewhat disagree with each other in several limits. As discussed above, the low-temperature ZFS values measured for this work are approximately 300 kHz lower than those presented in Refs. [12] and [15]. The results of Refs. [13] and [17] and our own measurements are in good agreement under ambient conditions, but exhibit slightly different temperature scalings such that the three data sets disagree with each other by several hundred kHz at 400 K [19]. This is most likely due to systematic temperature differentials between the diamond and the temperature sensor in two or potentially all three experiments. A detailed description of how temperature was determined in this work is provided in the Supplemental Material [19]. Despite these differences, we emphasize that the ZFS temperature dependence model presented in this work and given by Eq. 3 can fully describe all of the available experimental data sets even if the energies of the representative modes are held fixed to the values we report in Table 1, 58.73 and 145.5 meV [19].
While our measurements were performed on single NV centers in bulk diamond, we expect that the model of the ZFS temperature dependence presented here should be applicable to high density ensembles of NV centers, near surface NV centers, and NV centers in nanodiamonds, as the characteristic wavelengths of the representative phonon modes are both below 1 nm. The arguments used to arrive at Eq. 3 could also be adapted to other phenomena that arise due to spin-lattice interactions, suggesting that similar expressions to Eq. (3) could be replacements for the power series expansions commonly employed in experimental works. The advantages of using a physically motivated expression like Eq. 3 are apparent in Fig. 4, in which several of the prior models quickly diverge outside the range of experimental on which the models were fit [13, 12]. Other efforts with more sophisticated models still display asymptotic power law behavior that results in similar divergences [15, 14, 16]. It is likely that the temperature dependence of other important quantities of the NV center, such as the optical zero-phonon line wavelength [12, 14], hyperfine coupling strengths [31, 17], and the excited state zero-field splitting [32, 33] could be described by expressions similar to Eq. (3). Similar models could also be developed for other defect systems, such as divacancy centers in silicon carbide [34] or vacancies in 2D materials [35].
Conclusion.— In this work we have presented measurements of the ground-state zero-field splitting (ZFS) in single NV centers in high-purity bulk diamond sample from 15 to 500 K. Our novel analytical model for the NV ZFS, which describes the shift as proportional to the occupation numbers of two representative phonon modes, is in excellent agreement with the experimental data. We explained the physical origins of our model, and suggested that it could replace the power series commonly employed in other works. Finally, we suggested that this model may be readily adapted to several other important properties of the NV center and to other solid-state defects.
We gratefully acknowledge Hao Tang, Ariel Rebekah Barr, and Guoqing Wang for enlightening conversations, and Peter Maurer for helpful feedback on our manuscript. Experimental work, data analysis, and theoretical efforts conducted at UW–Madison were supported by the U.S. Department of Energy, Office of Science, Basic Energy Sciences under Award #DE-SC0020313. Part of this work by V. L. was performed under the auspices of the U.S. Department of Energy at Lawrence Livermore National Laboratory under Contract DE-AC52-07NA27344. A. N. acknowledges financial support from Fondecyt Iniciación No 11220266. A. G. acknowledges support from the Department of Defense through the National Defense Science and Engineering Graduate Fellowship (NDSEG) program. Á. G. acknowledges the support from the NKFIH in Hungary for the National Excellence Program (Grant No. KKP129866), the Quantum Information National Laboratory (Grant No. 2022-2.1.1-NL-2022-00004), and the EU QuantERA II MAESTRO project and from the European Commission for the QuMicro project (Grant No. 101046911). G. T. was supported by the János Bolyai Research Scholarship of the Hungarian Academy of Sciences. Á. G. and G. T. acknowledge the high-performance computational resources provided by KIFÜ (Governmental Agency for IT Development) institute of Hungary. J. R. M. acknowledges support from ANID-Fondecyt 1221512 and ANID-Anillo ACT192023..
References
- Abendroth et al. [2022] J. M. Abendroth, K. Herb, E. Janitz, T. Zhu, L. A. Völker, and C. L. Degen, Single-nitrogen–vacancy NMR of amine-functionalized diamond surfaces, Nano Letters 22, 7294 (2022).
- Qiu et al. [2022] Z. Qiu, A. Hamo, U. Vool, T. X. Zhou, and A. Yacoby, Nanoscale electric field imaging with an ambient scanning quantum sensor microscope, npj Quantum Information 8, 107 (2022).
- Chen et al. [2023] Y. Chen, C. Li, T. Yang, E. A. Ekimov, C. Bradac, S. T. Ha, M. Toth, I. Aharonovich, and T. T. Tran, Real-time ratiometric optical nanoscale thermometry, ACS nano 17, 2725 (2023).
- Rovny et al. [2022] J. Rovny, Z. Yuan, M. Fitzpatrick, A. I. Abdalla, L. Futamura, C. Fox, M. C. Cambria, S. Kolkowitz, and N. P. de Leon, Nanoscale covariance magnetometry with diamond quantum sensors, Science 378, 1301 (2022).
- Bradley et al. [2022] C. Bradley, S. de Bone, P. Möller, S. Baier, M. Degen, S. Loenen, H. Bartling, M. Markham, D. Twitchen, R. Hanson, et al., Robust quantum-network memory based on spin qubits in isotopically engineered diamond, npj Quantum Information 8, 122 (2022).
- Stas et al. [2022] P.-J. Stas, Y. Q. Huan, B. Machielse, E. N. Knall, A. Suleymanzade, B. Pingault, M. Sutula, S. W. Ding, C. M. Knaut, D. R. Assumpcao, et al., Robust multi-qubit quantum network node with integrated error detection, Science 378, 557 (2022).
- Kucsko et al. [2013] G. Kucsko, P. C. Maurer, N. Y. Yao, M. Kubo, H. J. Noh, P. K. Lo, H. Park, and M. D. Lukin, Nanometre-scale thermometry in a living cell, Nature 500, 54 (2013).
- Fujiwara et al. [2020] M. Fujiwara, S. Sun, A. Dohms, Y. Nishimura, K. Suto, Y. Takezawa, K. Oshimi, L. Zhao, N. Sadzak, Y. Umehara, et al., Real-time nanodiamond thermometry probing in vivo thermogenic responses, Science advances 6, eaba9636 (2020).
- Choi et al. [2020] J. Choi, H. Zhou, R. Landig, H.-Y. Wu, X. Yu, S. E. Von Stetina, G. Kucsko, S. E. Mango, D. J. Needleman, A. D. Samuel, et al., Probing and manipulating embryogenesis via nanoscale thermometry and temperature control, Proceedings of the National Academy of Sciences 117, 14636 (2020).
- Laraoui et al. [2015] A. Laraoui, H. Aycock-Rizzo, Y. Gao, X. Lu, E. Riedo, and C. A. Meriles, Imaging thermal conductivity with nanoscale resolution using a scanning spin probe, Nature communications 6, 8954 (2015).
- Acosta et al. [2010] V. M. Acosta, E. Bauch, M. P. Ledbetter, A. Waxman, L.-S. Bouchard, and D. Budker, Temperature dependence of the nitrogen-vacancy magnetic resonance in diamond, Physical review letters 104, 070801 (2010).
- Chen et al. [2011] X.-D. Chen, C.-H. Dong, F.-W. Sun, C.-L. Zou, J.-M. Cui, Z.-F. Han, and G.-C. Guo, Temperature dependent energy level shifts of nitrogen-vacancy centers in diamond, Applied Physics Letters 99, 161903 (2011).
- Toyli et al. [2012] D. Toyli, D. Christle, A. Alkauskas, B. Buckley, C. Van de Walle, and D. Awschalom, Measurement and control of single nitrogen-vacancy center spins above 600 K, Physical Review X 2, 031001 (2012).
- Doherty et al. [2014a] M. W. Doherty, V. M. Acosta, A. Jarmola, M. S. Barson, N. B. Manson, D. Budker, and L. C. Hollenberg, Temperature shifts of the resonances of the NV- center in diamond, Physical Review B 90, 041201 (2014a).
- Li et al. [2017] C.-C. Li, M. Gong, X.-D. Chen, S. Li, B.-W. Zhao, Y. Dong, G.-C. Guo, and F.-W. Sun, Temperature dependent energy gap shifts of single color center in diamond based on modified Varshni equation, Diamond and Related Materials 74, 119 (2017).
- Barson et al. [2019] M. Barson, P. Reddy, S. Yang, N. Manson, J. Wrachtrup, and M. W. Doherty, Temperature dependence of the 13C hyperfine structure of the negatively charged nitrogen-vacancy center in diamond, Physical Review B 99, 094101 (2019).
- Lourette et al. [2022] S. Lourette, A. Jarmola, V. M. Acosta, A. G. Birdwell, D. Budker, M. W. Doherty, T. Ivanov, and V. S. Malinovsky, Temperature sensitivity of and ground state manifolds, arXiv preprint arXiv:2212.12169 (2022).
- Tang et al. [2023] H. Tang, A. R. Barr, G. Wang, P. Cappellaro, and J. Li, First-principles calculation of the temperature-dependent transition energies in spin defects, The Journal of Physical Chemistry Letters 14, 3266 (2023), pMID: 36977131, https://doi.org/10.1021/acs.jpclett.3c00314 .
- [19] See Supplemental Material for additional experimental and theoretical details, which includes Refs. [36, 37, 38, 39, 40, 41, 42, 43, 44].
- Cambria et al. [2022] M. Cambria, A. Norambuena, H. Dinani, G. Thiering, A. Gardill, I. Kemeny, Y. Li, V. Lordi, A. Gali, J. Maze, et al., Temperature-dependent phonon-induced relaxation of the nitrogen-vacancy spin triplet in diamond, arXiv preprint arXiv:2209.14446 (2022).
- Davies [1974] G. Davies, Vibronic spectra in diamond, Journal of Physics C: Solid State Physics 7, 3797 (1974).
- Collins et al. [1987] A. Collins, M. Stanley, and G. Woods, Nitrogen isotope effects in synthetic diamonds, Journal of Physics D: Applied Physics 20, 969 (1987).
- Kehayias et al. [2013] P. Kehayias, M. Doherty, D. English, R. Fischer, A. Jarmola, K. Jensen, N. Leefer, P. Hemmer, N. Manson, and D. Budker, Infrared absorption band and vibronic structure of the nitrogen-vacancy center in diamond, Physical Review B 88, 165202 (2013).
- Alkauskas et al. [2014] A. Alkauskas, B. B. Buckley, D. D. Awschalom, and C. G. Van de Walle, First-principles theory of the luminescence lineshape for the triplet transition in diamond NV centres, New Journal of Physics 16, 073026 (2014).
- Jacobson and Stoupin [2019] P. Jacobson and S. Stoupin, Thermal expansion coefficient of diamond in a wide temperature range, Diamond and Related Materials 97, 107469 (2019).
- Gali [2019] Á. Gali, Ab initio theory of the nitrogen-vacancy center in diamond, Nanophotonics 8, 1907 (2019).
- Ashcroft and Mermin [2022] N. W. Ashcroft and N. D. Mermin, Solid state physics (Cengage Learning, 2022).
- Blackman [1957] M. Blackman, On the thermal expansion of solids, Proceedings of the Physical Society. Section B 70, 827 (1957).
- Reeber [1975] R. R. Reeber, Thermal expansion of some group iv elements and zns, physica status solidi (a) 32, 321 (1975).
- Liu et al. [2019] G.-Q. Liu, X. Feng, N. Wang, Q. Li, and R.-B. Liu, Coherent quantum control of nitrogen-vacancy center spins near 1000 kelvin, Nature Communications 10, 1344 (2019).
- Xu et al. [2022] S. Xu, M. Liu, T. Xie, Z. Zhao, Q. Shi, P. Yu, C.-K. Duan, F. Shi, and J. Du, Temperature-dependent behaviors of single spin defects in solids determined with Hz-level precision, arXiv preprint arXiv:2212.02849 (2022).
- Fuchs et al. [2008] G. Fuchs, V. Dobrovitski, R. Hanson, A. Batra, C. Weis, T. Schenkel, and D. Awschalom, Excited-state spectroscopy using single spin manipulation in diamond, Physical review letters 101, 117601 (2008).
- Neumann et al. [2009] P. Neumann, R. Kolesov, V. Jacques, J. Beck, J. Tisler, A. Batalov, L. Rogers, N. Manson, G. Balasubramanian, F. Jelezko, et al., Excited-state spectroscopy of single NV defects in diamond using optically detected magnetic resonance, New Journal of Physics 11, 013017 (2009).
- Lin et al. [2021] W.-X. Lin, F.-F. Yan, Q. Li, J.-f. Wang, Z.-H. Hao, J.-Y. Zhou, H. Li, L.-X. You, J.-S. Xu, C.-F. Li, et al., Temperature dependence of divacancy spin coherence in implanted silicon carbide, Physical Review B 104, 125305 (2021).
- Liu et al. [2021] W. Liu, Z.-P. Li, Y.-Z. Yang, S. Yu, Y. Meng, Z.-A. Wang, Z.-C. Li, N.-J. Guo, F.-F. Yan, Q. Li, et al., Temperature-dependent energy-level shifts of spin defects in hexagonal boron nitride, ACS Photonics 8, 1889 (2021).
- Wang et al. [2022] Z. Wang, J. Zhang, X. Feng, and L. Xing, Microwave heating effect on diamond samples of nitrogen-vacancy centers, ACS omega 7, 31538 (2022).
- Ouyang et al. [2022] K. Ouyang, Z. Wang, L. Xing, X. Feng, J. Zhang, C. Ren, and X. Yang, Temperature dependence of the zero-field splitting parameter of nitrogen-vacancy centre ensembles in diamond considering microwave and laser heating effect, Measurement Science and Technology 34, 015102 (2022).
- Mittiga et al. [2018] T. Mittiga, S. Hsieh, C. Zu, B. Kobrin, F. Machado, P. Bhattacharyya, N. Rui, A. Jarmola, S. Choi, D. Budker, et al., Imaging the local charge environment of nitrogen-vacancy centers in diamond, Physical review letters 121, 246402 (2018).
- Sato et al. [2002] T. Sato, K. Ohashi, T. Sudoh, K. Haruna, and H. Maeta, Thermal expansion of a high purity synthetic diamond single crystal at low temperatures, Physical Review B 65, 092102 (2002).
- Doherty et al. [2014b] M. W. Doherty, V. V. Struzhkin, D. A. Simpson, L. P. McGuinness, Y. Meng, A. Stacey, T. J. Karle, R. J. Hemley, N. B. Manson, L. C. Hollenberg, et al., Electronic properties and metrology applications of the diamond NV- center under pressure, Physical review letters 112, 047601 (2014b).
- Reeber and Wang [1996] R. R. Reeber and K. Wang, Thermal expansion, molar volume and specific heat of diamond from 0 to 3000 K, Journal of Electronic Materials 25, 63 (1996).
- Rohatgi [2022] A. Rohatgi, Webplotdigitizer: Version 4.6 (2022).
- Bosak and Krisch [2005] A. Bosak and M. Krisch, Phonon density of states probed by inelastic x-ray scattering, Physical Review B 72, 224305 (2005).
- Stoupin and Shvyd’ko [2010] S. Stoupin and Y. V. Shvyd’ko, Thermal expansion of diamond at low temperatures, Physical review letters 104, 085901 (2010).