SN 2023ixf in Messier 101: Photo-ionization of Dense, Close-in Circumstellar Material in a Nearby Type II Supernova
Abstract
We present UV/optical observations and models of supernova (SN) 2023ixf, a type II SN located in Messier 101 at 6.9 Mpc. Early-time (“flash”) spectroscopy of SN 2023ixf, obtained primarily at Lick Observatory, reveals emission lines of H i, He i/ii, C iv, and N iii/iv/v with a narrow core and broad, symmetric wings arising from the photo-ionization of dense, close-in circumstellar material (CSM) located around the progenitor star prior to shock breakout. These electron-scattering broadened line profiles persist for 8 days with respect to first light, at which time Doppler broadened features from the fastest SN ejecta form, suggesting a reduction in CSM density at cm. The early-time light curve of SN 2023ixf shows peak absolute magnitudes (e.g., mag, mag) that are mag brighter than typical type II supernovae, this photometric boost also being consistent with the shock power supplied from CSM interaction. Comparison of SN 2023ixf to a grid of light curve and multi-epoch spectral models from the non-LTE radiative transfer code CMFGEN and the radiation-hydrodynamics code HERACLES suggests dense, solar-metallicity, CSM confined to cm and a progenitor mass-loss rate of yr-1. For the assumed progenitor wind velocity of , this corresponds to enhanced mass-loss (i.e., “super-wind” phase) during the last 3-6 years before explosion.
tablenum \restoresymbolSIXtablenum
1 Introduction
A paramount issue in astrophysics is constraining how the lives of red supergiant (RSG) stars end. This avenue of study has a direct impact on the observed diversity of core-collapse supernovae (SNe), compact object formation, and element creation in the Universe. Advancing our understanding of late-stage RSG evolution can be accomplished by probing the composition and structure of the circumstellar medium (CSM) surrounding these stars in the final years before explosion. This CSM is composed of material once located on the RSG surface and is enriched as the progenitor star loses mass via winds and/or violent outbursts (Smith, 2014). Understanding the structure of this CSM provides needed constraints on the final stages of stellar evolution before core collapse and the proposed mechanisms for both dynamic (e.g., gravity waves, super-Eddington winds; Owocki et al. 2004, 2017; Quataert & Shiode 2012; Quataert et al. 2016; Fuller 2017; Wu & Fuller 2021) as well as secular (i.e., steady-state wind; Beasor et al. 2020) mass-loss.
Early-time, multi-wavelength observations of young type II SNe (SNe II) are an essential probe of the final stages of stellar evolution; these last months-to-centuries are almost completely unconstrained in stellar evolutionary models. In the era of all-sky transient surveys, “flash” or rapid spectroscopic observations have become a powerful tool in understanding the direct circumstellar environment of SN progenitors in the final months before explosion (e.g., Gal-Yam et al. 2014a; Groh 2014; Smith et al. 2015; Khazov et al. 2016; Yaron et al. 2017; Jacobson-Galán et al. 2020; Bruch et al. 2021, 2022; Jacobson-Galán et al. 2022; Terreran et al. 2022; Tinyanont et al. 2022; Davis et al. 2023; Wang et al. 2023). Very early-time spectra ( days) can be used to identify prominent emission lines from the recombination of CSM photo-ionized by the incoming SN radiation at, and following, shock breakout. However, these spectral features are transient, leaving behind broad lines from the fastest ( km s-1) SN ejecta layers (Chugai, 2001; Dessart et al., 2017). The strength of the narrow emission features depends on the CSM density and its chemical abundance. This is a robust tracer of the progenitor’s chemical composition, identity and recent mass-loss at small distances ( cm from the explosion; Gal-Yam et al., 2014b; Yaron et al., 2017; Dessart et al., 2017; Boian & Groh, 2020).
Spectroscopic modeling of CSM-interacting SNe II with non-LTE radiative transfer codes (e.g., CMFGEN; Hillier & Dessart 2012; Dessart et al. 2015) has been used to extract quantitative information on the progenitor’s radius, chemical composition, wind velocity and mass-loss rate. CMFGEN in particular allows for self-consistent post-processing of radiation hydrodynamics simulations, allowing for physically robust constraints on both the SN ejecta and CSM properties (shocked and unshocked) and the creation of accurate synthetic spectra that contain critical information absent from light curves. For example, CMFGEN spectral modeling of the prototypical “flash” spectroscopy type II SN 1998S indicated an enhanced RSG mass-loss rate of M⊙ yr-1 () in the final 15 years before core-collapse (Shivvers et al., 2015; Dessart et al., 2016). This mass-loss rate is significantly larger than that observed in galactic RSGs e.g., M⊙ yr-1 (Beasor et al., 2020). Similarly, modeling of the emission line spectrum in the first days of SNe 2017ahn and 2020pni (Tartaglia et al., 2021; Terreran et al., 2022) suggested N-rich CSM derived from mass-loss rates of M⊙ yr-1. Further diversity was revealed from CMFGEN modeling of SN 2013fs (Yaron et al., 2017), observed within hours of explosion, which suggested a compact CSM ( cm) with a lower mass-loss rate of M⊙ yr-1 (Dessart et al., 2017). Additionally, both UV/optical photometry and the spectral series of SN 2020tlf were accurately modeled by CMFGEN simulations involving an inflated RSG progenitor (, which exploded into a dense ( M⊙ yr-1, ), extended ( cm) CSM; this scenario is also consistent with the detection of luminous precursor emission before explosion (Jacobson-Galán et al., 2022).
In this paper we present, analyze, and model photometric and spectroscopic observations of SN 2023ixf, first reported to the Transient Name Server by Koichi Itagaki (Itagaki, 2023) on 2023-05-19 (MJD 60083.90). SN 2023ixf was classifed as a Type II SN (Perley et al., 2023) and is located at , in host galaxy Messier 101 (NGC 5457). Based on reported pre-discovery images from numerous observations of SN 2023ixf, we adopt a time of first light to be MJD (Mao et al., 2023) that is based on the average between last non-detection and first detection, but could be earlier given the shallow depth of the last non-detection limit. All phases reported in this paper are with respect to this adopted time of first light. In this paper, we use a redshift-independent host-galaxy distance of Mpc reported by Riess et al. (2022), which is the updated value beyond what is presented in Riess et al. (2016). We adopt a redshift of (Perley et al., 2023).
Given its close proximity and current relative brightness, SN 2023ixf represents an unparalleled opportunity to study both the very early-time and the long-term evolution of a CSM-interacting SN II in unprecedented detail. In §2 we describe UV, optical, and NIR observations of SN 2023ixf. In §3 we present analysis, comparisons and modeling of SN 2023ixf’s optical photometric and spectroscopic properties. Finally, in §4 we discuss the progenitor environment and mass-loss history prior to SN 2023ixf. Conclusions are drawn in §5. All uncertainties are quoted at the 68% confidence level (c.l.) unless otherwise stated.
2 Observations
2.1 Photometric Observations
SN 2023ixf was observed with the Pan-STARRS telescope (PS1/2; Kaiser et al., 2002; Chambers et al., 2017) between 21 May and 2 June 2023 in -bands through the Young Supernova Experiment (YSE) (Jones et al., 2021). Data storage/visualization and follow-up coordination was done through the YSE-PZ web broker (Coulter et al., 2022, 2023). The YSE photometric pipeline is based on photpipe (Rest et al., 2005), which relies on calibrations from (Magnier et al., 2020; Waters et al., 2020). Each image template was taken from stacked PS1 exposures, with most of the input data from the PS1 3 survey. All images and templates were resampled and astrometrically aligned to match a skycell in the PS1 sky tessellation. An image zero-point is determined by comparing PSF photometry of the stars to updated stellar catalogs of PS1 observations (Flewelling et al., 2016). The PS1 templates are convolved with a three-Gaussian kernel to match the PSF of the nightly images, and the convolved templates are subtracted from the nightly images with HOTPANTS (Becker, 2015). Finally, a flux-weighted centroid is found for the position of the SN in each image and PSF photometry is performed using “forced photometry”: the centroid of the PSF is forced to be at the SN position. The nightly zero-point is applied to the photometry to determine the brightness of the SN for that epoch.
We obtained imaging of SN 2023ixf with the Las Cumbres Observatory (LCO) 1 m telescopes from 20 May to 1 June 2023 (Programs NSF2023A-011 and NSF2023A-015; PIs Foley and Kilpatrick, respectively). After downloading the BANZAI-reduced images from the LCO data archive (McCully et al., 2018), we used photpipe (Rest et al., 2005) to perform DoPhot PSF photometry (Schechter et al., 1993). All photometry was calibrated using PS1 stellar catalogs described above with additional transformations to SDSS -band derived from Finkbeiner et al. (2016). For additional details on our reductions, see Kilpatrick et al. (2018). We also obtained photometry using a 0.7 meter Thai Robotic Telescope at Sierra Remote Observatories and the Nickel Telescope at Lick Observatory in the bands. Images are bias subtracted and field flattened. Absolute photometry is obtained using stars in the 1010′ field of view.
We also observed SN 2023ixf with the Lulin 1 m telescope in bands from 21 May to 1 June 2023. Standard calibrations for bias and flat-fielding were performed on the images using IRAF, and we reduced the calibrated frames in photpipe using the same methods described above for the LCO images.
We also observed SN 2023ixf with the Auburn 10” telescope located in Auburn, AL from 27 May to 3 June 2023 in bands. Following standard procedures in python, we corrected each frame for bias, dark current, and flat-fielding using image frames obtained in the same instrumental setup. We then registered each frame using Gaia DR3 astrometric standard stars (Gaia Collaboration, 2022) observed in the same field as each image. Finally, we stacked images in each filter for each night with swarp and performed final photometry using DoPhot with calibration using Pan-STARRS standard stars transformed to bands111Note that our -band filter is close to Johnson -band, and so we calibrate against Pan-STARRS standard stars transformed into this band. For filter functions, see https://astronomy-imaging-camera.com/product/zwo-lrgb-31mm-filters-2.. The complete multi-color light curve of SN 2023ixf is presented in Figure 1(a)).
The Milky Way (MW) -band extinction and color excess along the SN line of site is mag and E(B-V) = 0.008 mag (Schlegel et al., 1998; Schlafly & Finkbeiner, 2011), respectively, which we correct for using a standard Fitzpatrick (1999) reddening law ( = 3.1). In addition to the MW color excess, we estimate the contribution of galaxy extinction in the local SN environment. Using a high resolution Kast spectrum of SN 2023ixf at days, we calculate Na i D2 and D1 equivalent widths (EWs) of 0.16 and 0.12 Å, respectively; these values are consistent with those derived from a Keck Planet Finder spectrum (Lundquist et al. 2023). We use Equations 7 & 8 in Poznanski et al. (2012) to convert these EWs to an intrinsic E(B-V) and find a host galaxy extinction of mag, also corrected for using the Fitzpatrick (1999) reddening law.
2.2 Spectroscopic Observations
SN 2023ixf was observed with Shane/Kast (Miller & Stone, 1993) between days. For all these spectroscopic observations, standard CCD processing and spectrum extraction were accomplished with IRAF222https://github.com/msiebert1/UCSC_spectral_pipeline. The data were extracted using the optimal algorithm of Horne (1986). Low-order polynomial fits to calibration-lamp spectra were used to establish the wavelength scale and small adjustments derived from night-sky lines in the object frames were applied. SN 2023ixf spectra were also obtained with the Kitt Peak Ohio State Multi-Object Spectrograph (KOSMOS, Martini et al. 2014) on the Astrophysical Research Consortium (ARC) 3.5-meter Telescope at Apache Point Observatory (APO). The KOSMOS spectra were reduced through the KOSMOS333https://github.com/jradavenport/pykosmos pipeline. One optical spectrum (in a red and blue arm) was taken through the Low-Resolution Spectrograph 2 (LRS2) instrument on the Hobby Eberly Telescope (HET) on 2023-05-21 (blue arm) and 2023-05-22 (red arm). The LRS2 data were processed with Panacea444https://github.com/grzeimann/Panacea, the HET automated reduction pipeline for LRS2. The initial processing includes bias correction, wavelength calibration, fiber-trace evaluation, fiber normalization, and fiber extraction; moreover, there is an initial flux calibration from default response curves, an estimation of the mirror illumination, as well as the exposure throughput from guider images. After the initial reduction, we use LRS2Multi555https://github.com/grzeimann/LRS2Multi in order to perform sky subtraction.
In Figure 2 we present the complete series of optical spectroscopic observations of SN 2023ixf from days. In this plot, we also show the classification spectrum of SN 2023ixf at days from the Liverpool telescope (Perley et al., 2023). However, because we cannot verify the quality of this spectral reduction, we only use these data for narrow line identification. Additionally, we include Swift UV grism spectra of SN 2023ixf from days in Appendix Figure 7; data were reduced using the techniques outlined in Pan et al. (2020). The complete spectral sequence is shown in Figure 2 and the log of spectroscopic observations is presented in Appendix Tables A1.
3 Analysis
3.1 Photometric Properties
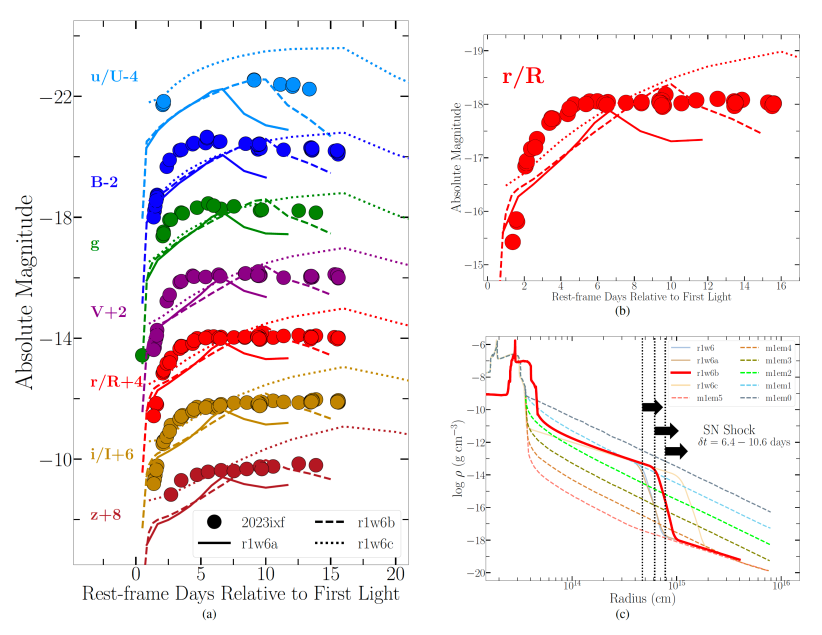
The complete early-time, multi-band light curve of SN 2023ixf is presented in Figure 1(a). We fit a -order polynomial to the band light curve to derive a peak absolute band magnitude of mag at MJD , where the uncertainty on peak magnitude is the error from the fit and the uncertainty on the peak phase is found from adding the uncertainties on both the time of peak magnitude and the time of first light in quadrature. Using the adopted time of first light, this indicates a rise time of days with respect to -band maximum. Other filters display similarly bright peak absolute magnitudes e.g., mag and mag — this indicates a bolometric boost to the SN brightness rather than a color effect. Following its rise to peak, the multi-color light curve of SN 2023ixf has remained at an approximately constant brightness, indicating that it could be entering a plateau phase (i.e., SN II-P classification). However, at this time, the SN is still very blue, therefore indicating that the recombination phase has yet to be reached. All peak magnitudes and rise-times are presented in Table 1.
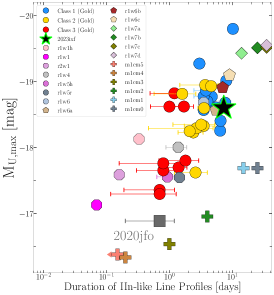
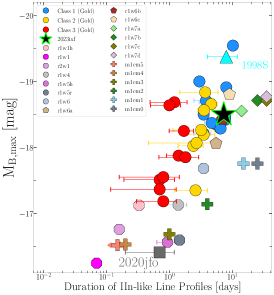
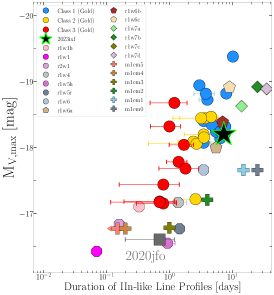
In Figure 3, we compare the observed peak absolute magnitudes of SN 2023ixf to a sample of SNe II with spectroscopic signatures of CSM-interaction (i.e., IIn-like profiles) (Jacobson-Galán et al., 2023). This gold sample includes most of the known CSM-interacting SNe II that show detectable IIn-like profiles in their early-time spectra and have early-time UV observations with Swift UVOT. The color delineation of all presented sample objects is as follows: at phases of days post-explosion, blue colored objects show high ionization emission lines of N iii, He ii, and C iv (e.g., SNe 1998S, 2017ahn, 2018zd, 2020pni, 2020tlf, etc), yellow colored objects have no N iii emission but do show He ii, and C iv (e.g., SNe 2014G, 2022jox), and red colored objects only show weaker He ii emission (e.g., SNe 2013fs). However, it should be noted that high ionization lines of O v/vi, C v, and N iv are also present in SN 2013fs at day due to a more compact CSM than other CSM-interacting SNe II (Yaron et al., 2017; Dessart et al., 2017). With respect to other SNe II with evidence for interaction with CSM, SN 2023ixf is 0.5 mag brighter in all observed filters than the median peak absolute magnitude observed in the sample. SN 2023ixf has a comparable peak brightness and rise-times to SNe 2017ahn, 2018zd, 2020pni, 2020abjq and 2022ffg (Zhang et al., 2020; Hiramatsu et al., 2021; Tartaglia et al., 2021; Terreran et al., 2022; Jacobson-Galán et al., 2023), all of which have similar early-time spectral morphology and duration of the IIn-like line profiles (§3.2). However, the rise-time of SN 2023ixf is significantly shorter than more extreme events such as SNe 1998S, 2019qch, 2020tlf, 2021tyw and 2022pgf, whose rise-times are 12 days. This difference reflects a shorter interaction timescale in a less extended, high-density CSM in SN 2023ixf. Furthermore, SN 2023ixf is distinct from other prototypical SNe II with IIn-like profiles such as SN 2013fs and 2014G (Terreran et al., 2016; Yaron et al., 2017), which have shorter rise-times and lower peak absolute magnitudes. Finally, SN 2023ixf is 2 mags brighter in multi-band (i.e., ) filters than SNe II without IIn-like profiles in their early-time spectra e.g., SN 2020jfo (Teja et al. 2022; Fig. 3) or average values derived from samples of SNe II (Anderson et al., 2014).
3.2 Spectroscopic Properties
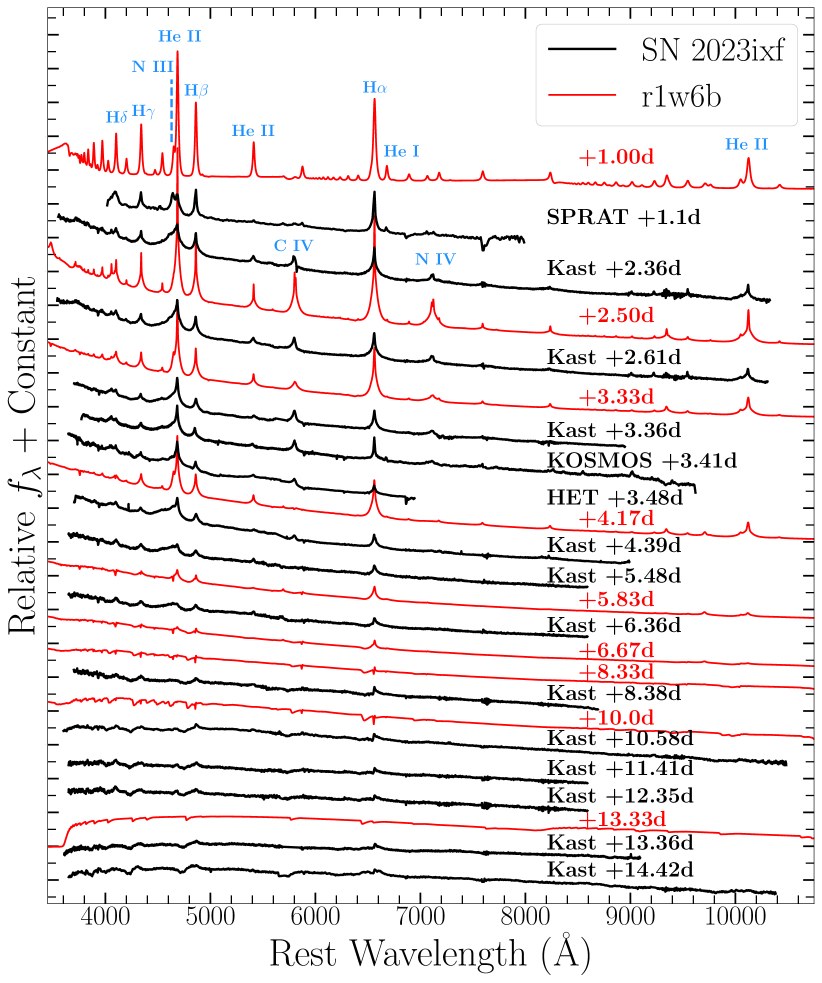
The complete early-time spectroscopic sequence of SN 2023ixf from to days is presented in Figure 2, consistent with other spectral sequences released on this object (Stritzinger et al., 2023; Yamanaka et al., 2023). In the earliest spectrum, SN 2023ixf shows narrow, symmetric emission features of H i, He i/ii, N iii/iv and C iv. A two-component Lorentzian model fit to the H profile in the high resolution () +2.4 d Kast spectrum shows a narrow component full width at half maximum (FWHM) velocity of 150 and broad symmetric component velocity of 1400 ; the former is ascribed to the progenitor wind while the latter is caused by scattering of recombination line photons by free, thermal electrons in the ionized CSM (Chugai, 2001; Dessart et al., 2009; Huang & Chevalier, 2018). However, it should be noted that at these phases, there could be radiative acceleration of the CSM that causes the width of the narrow component to be larger than the true velocity of the progenitor wind (Dessart et al., 2015; Tsuna et al., 2023).
SN 2023ixf may be the first SN to exhibit a rapid rise in ionization between the first and second spectrum as shown in Figure 2. This is caused initially by the shock breakout pulse and later on by the incoming radiation from the embedded shock. This is witnessed here with the presence of lines of moderately ionized species (i.e. lines of He i or N iii) and a moderately blue color at days. At days, the SN 2023ixf spectrum is much bluer, the lines of He i 5875, 6678, and 7065 have weakened or disappeared, and the spectrum exhibits instead lines of C iv (5808) and He ii (4686). Furthermore, there is emission from N v contributing at wavelengths bluewards of the He ii line, consistent with heightened ionization at these phases.
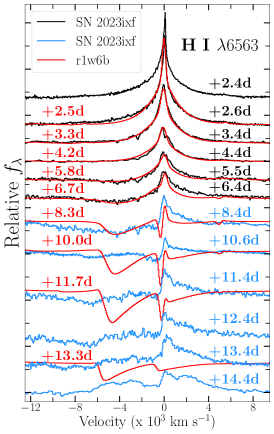
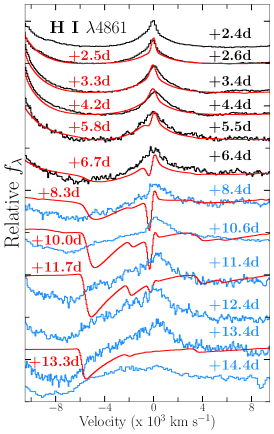
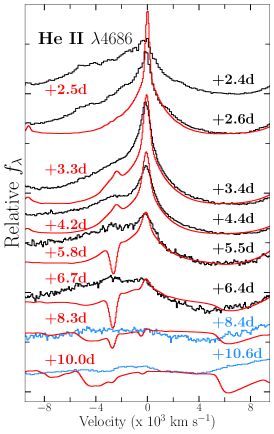
The narrow, symmetric line profiles with Lorentzian wings caused by electron-scattering (i.e., IIn-like) continue to persist in SN 2023ixf for the first week of the SN evolution. Then, in the +5.48 d and +6.36 d spectra, the He ii emission begins to fade (Fig. 4) and the SN develops a broad absorption profile in all Balmer transitions, indicating the escape of photons from the fast moving ejecta and a decrease in CSM density. We therefore define the duration of the IIn-like line profiles as the transition point at which the optical depth to electron-scattering has dropped enough to see the emerging fast-moving SN ejecta. For SN 2023ixf, we estimate that this change occurs at days, which is reflective of the disappearance of the electron-scattering wings in the He ii emission line and the development of broad absorption profiles at Balmer series wavelengths. This indicates that the photosphere is first located in the unshocked CSM (far above the shock), then in the swept up material present in the fast moving dense shell (i.e., shocked CSM), and then in the fastest moving SN ejecta below the dense shell. Based on the keV X-ray spectrum of SN 2023ixf (Grefenstette et al., 2023), there is sufficiently high temperatures for He ii to exist, so the decrease in line strength can be attributed to a reduction in particle density as the shock samples CSM at cm. As shown in Figure 4, the bluest edge of the H and H line profiles corresponds to velocities of 8500 , which provides a lower limit on the velocities of the fastest moving H-rich material at the shock front. By two weeks post-explosion, the SN spectra is composed of broad H i absorption profiles, similar to other young SNe II.
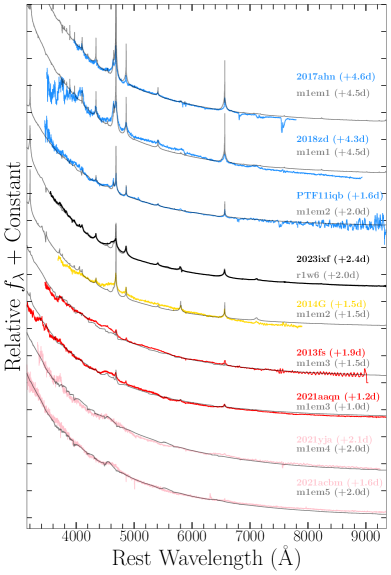
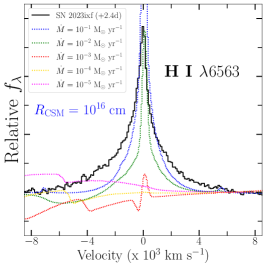
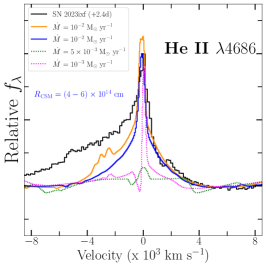
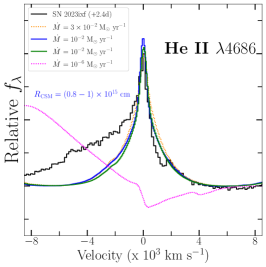
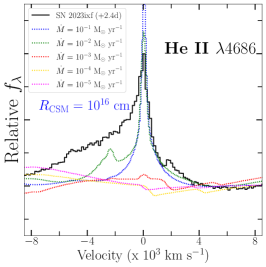
The duration of the IIn-like signatures in SN 2023ixf is consistent with other CSM-interacting SNe II with enhanced progenitor mass-loss rates of yr-1 (Figure 3). In Figure 3, we present peak absolute magnitudes with respect to IIn profile duration for all gold sample CSM-interacting SNe II analyzed in Jacobson-Galán et al. (2023). Intriguingly, there exists a natural trend between peak brightness and IIn-like profile duration amongst these events, which is reflective of a continuum of progenitor mass-loss rate and CSM extent. The observed in SN 2023ixf is most similar to SNe 2017ahn, 2018zd, 2020pni, 2020tlf and 2022ffg, but is not as large as that observed in 2020tlf, 2021tyw, or 2022pgf, likely due to a more extended dense CSM in those objects. Furthermore, the evolution of SN 2023ixf is unlike other CSM-interacting SNe II with days post-explosion (e.g., SNe 2013fs or 2014G), which do not show N emission lines at phases day post-explosion and is caused by a more compact/high density or extended/low density CSM (Dessart et al., 2017). The observed early spectral differences between SN 2023ixf and other CSM-interacting SNe II is illustrated in Figure 5. Here it is shown that the line profiles of SN 2023ixf at days post-explosion are most consistent with interaction between SN ejecta and CSM constructed from a high progenitor mass-loss rate ( yr-1; also see Fig. 6).
3.3 Modeling
In order to quantify the CSM properties of SN 2023ixf, we compared the spectral and photometric properties of SN 2023ixf to a model grid of non-LTE, radiative transfer simulations covering a wide range of progenitor mass-loss rates ( yr-1; ) and CSM radii ( cm), all in spherical symmetry. Simulations of the SN ejecta-CSM interaction were performed with the multi-group radiation-hydrodynamics code HERACLES (González et al., 2007; Vaytet et al., 2011; Dessart et al., 2015), which consistently computes the radiation field and hydrodynamics. Then, at selected snapshots in time post-explosion, the hydrodynamical variables are imported into the non-LTE radiative-transfer code CMFGEN (Hillier & Dessart, 2012; Dessart et al., 2015) for an accurate calculation of the radiative transfer, which includes a complete model atom, frequency points, and treatment of continuum and line processes as well as electron scattering. For each model, we adopt an explosion energy of erg, a 15 progenitor with a radius ranging from , and a CSM composition set to the surface mixture of a RSG progenitor (Davies & Dessart, 2019). For the simulations presented in this work, the CSM extent is much greater than (500–1200 for a RSG mass range of 10–20 ) and therefore the progenitor properties have no impact during phases of ejecta-CSM interaction. The progenitor radius plays a more significant role on the light curve evolution during the plateau phase (e.g., see Dessart et al. 2013; Jacobson-Galán et al. 2022), i.e., once the interaction phase is over and the emission from from the deeper ejecta layers dominate the SN luminosity. Specific methods for each simulation can be found in Dessart et al. (2016, 2017); Jacobson-Galán et al. (2022); Dessart & Jacobson-Galán (2023) and all CSM properties of each model are presented in Table A2.
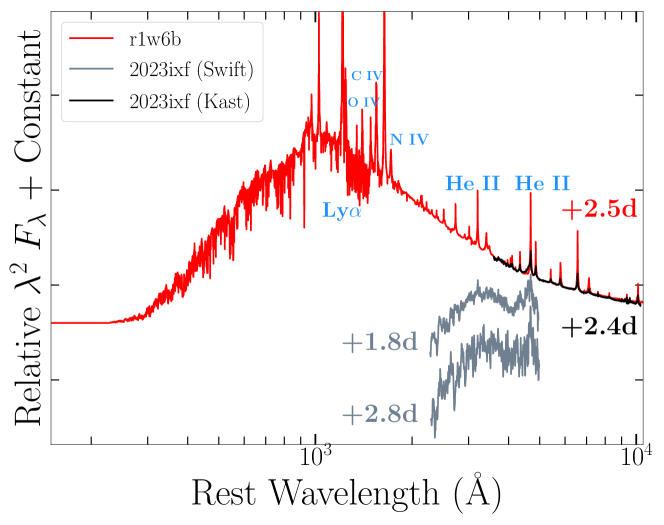
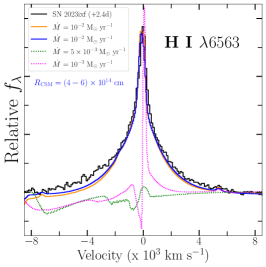
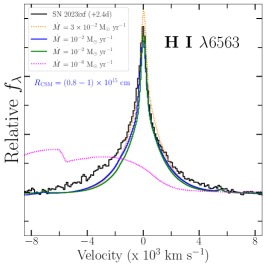
From the CMFGEN model grid, we identify four models (r1w6, r1w6a,b,c) with the smallest residuals between model predictions and both the observed multi-color peak magnitudes and rise-times (§3.1) as well as the duration of IIn profiles (§3.2). The best matched model peak magnitudes are within 0.5 mag of SN 2023ixf in all filters and have a that is within days of that observed in SN 2023ixf. The features used for determination of the most consistent model are presented in Figure 3. We find that the best-fit models to SN 2023ixf have a mass-loss rate of yr-1, confined to a radius of cm and containing a total CSM mass of . Based on model predictions, the mass-loss then decreases to yr-1 (e.g., Fig. 1b) at larger distances ( cm) with a constant wind velocity of ; this geometry is consistent with the changing X-ray absorption observed in SN 2023ixf (Grefenstette et al., 2023). This wind velocity is not derived from spectroscopic observations but the narrow line cores of the higher resolution Kast spectra indicate . The spectral time series of the r1w6b model and multi-color light curve of the r1w6a,b,c models are presented in Figures 2 and 1(a). In Figure 6, we present SN 2023ixf spectra with respect to a range of early-time CMFGEN models with varying mass-loss rates and CSM radii to further illustrate the consistencies and inconsistencies between models and observations. In Figure 7, we present the UV spectrum of the r1w6b at +2.5 days, which predicts a plethora of high-ionization features (e.g., O iv/vi) in the near-to-far UV spectra of SN 2023ixf. Furthermore, the r1w6b model adequately reproduces the observed IIn-like emission line profiles in SN 2023ixf (e.g., Figs. 5 & 6) using the , solar metallicity, RSG progenitor model composition (Dessart et al., 2017; Davies & Dessart, 2019).
| Host Galaxy | M101 | |
| Redshift | 0.000804 | |
| Distance | 6.9 Mpc666Riess et al. (2022) | |
| Time of First Light (MJD) | 60082.83 | |
| 0.008 mag777Schlegel et al. (1998); Schlafly & Finkbeiner (2011) | ||
| 0.033 mag888Poznanski et al. (2012) | ||
| [] | -18.6 mag[4.9 d] | |
| [] | -18.5 mag[5.7 d] | |
| [] | -18.4 mag[5.8 d] | |
| [] | -18.1 mag[6.0 d] | |
| [] | -18.0 mag[6.1 d] | |
| [] | -17.9 mag[7.8 d] | |
| [] | -17.8 mag[8.2 d] | |
| RCSM | cm | |
| MCSM | ||
| []999Mass-loss within cm | yr-1[] | |
| CSM Composition | Solar Metallicity101010Not varied in model grid | |
| Time of | 3-6 years pre-SN |
Unlike the other CSM structures explored in the CMFGEN model grid, the r1w6b model best reproduces both the observed peak absolute magnitudes in filters as well as the duration of IIn-like line profiles observed in SN 2023ixf (Figure 3). However, this model cannot match the early light curve slope observed in SN 2023ixf, which is likely a result of the density profile invoked. A better fit to the light curve would require a higher density immediately above (e.g., through a larger scale height) and a more gradual decline in density at the outer edge of the dense CSM i.e., at cm. A more extended CSM, as in model r1w6c, increases the rise time to maximum and is thus not a suitable solution. Furthermore, a larger model kinetic energy will also increase the luminosity at early-times, which would provide more consistency between the model light curve rise and SN 2023ixf.
The evolution of the line profiles in the r1w6b model are consistent with the observed transition from electron-scattering broadened line profiles of Balmer series H i, He ii, C iv, and N iii/iv ( days) to Doppler broadened absorption profiles of the fastest moving H-rich SN ejecta ( days). Nevertheless, for a consistent continuum slope, the model spectra over-predict the narrow line emission observed in SN 2023ixf (e.g., Fig. 2), which is likely caused by a smaller emitting volume of dense CSM in SN 2023ixf than the r1w6b model. The line strengths of SN 2023ixf are well-matched by the r1w6 model, which is characterized by the same but smaller CSM radius (e.g., Fig. 5); this model, however, is unable to reproduce the extended duration of the IIn-like features (e.g., see Fig. 3). Furthermore, as shown in Figure 4(c), the He ii line profile is not completely reproduced by the model spectrum, which could be due to the fact that these simulations are performed in 1D, assume spherical symmetry of the CSM, or require higher kinetic energies. Additionally, once the IIn-like profiles fade, the model H i ejecta velocities are lower than in SN 2023ixf (e.g., Fig. 4). It should also be noted that the narrow H P Cygni profile that develops in SN 2023ixf at days has higher velocities () than the r1w6b model (), suggesting potential radiative acceleration of the unshocked CSM.
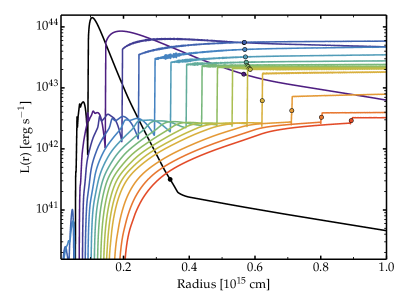
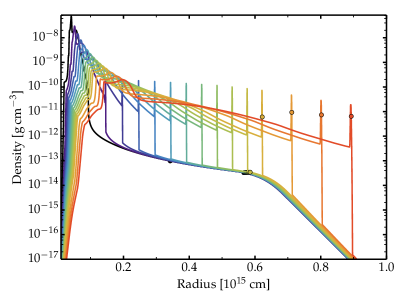
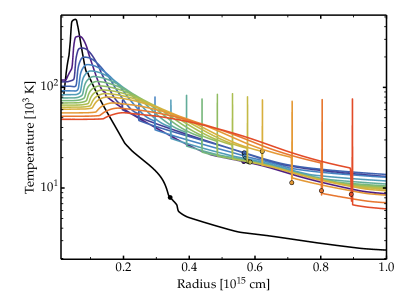
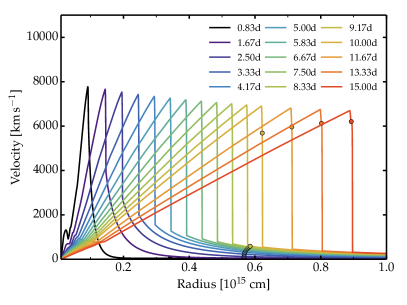
Using the lower limit on the SN shock velocity of 8500 as observed at the bluest edge of the H absorption profile shown in Figure 4, we find that the location of the SN shock at days is cm, which corresponds to an optical depth to electron-scattering of in the r1w6b model. Then, by days, the shock is located at cm, which in the r1w6b model, is in CSM with an electron-scattering optical depth of . This decrease in in the r1w6b model is consistent with the observed fading of IIn-like profiles in SN 2023ixf and reflects a reduction in CSM density at cm. However, it should be noted that the shock velocity decreases as the shock crosses the CSM and, therefore, the shock position is not as simplified as . We present the time-series evolution of the r1w6b model luminosity, density, temperature and velocity as a function of radius in Figure 8. Furthermore, at +15 days, the r1w6b model has a maximum ejecta velocity of , which is below the maximum velocities observed in the H profile of SN 2023ixf. This may indicate some degree of CSM asymmetry that would cause a deceleration along certain lines of sight while also allowing for typical SN ejecta velocities of to be preserved. Also, the weaker Doppler broadened absorption observed in SN 2023ixf compared to the r1w6b model may be the result of persistent CSM interaction that will contribute weak, broad, and boxy H emission capable of reducing the absorption profile strength (Dessart & Hillier, 2022).
4 Discussion
The first 2 weeks of photometric and spectroscopic observations of SN 2023ixf have revealed essential characteristics of the SN progenitor system and the explosion itself. Based on the best fitting CMFGEN model, the progenitor of SN 2023ixf was likely a RSG with a mass-loss rate of yr-1, which created dense CSM extending to cm that contained a total mass of . Furthermore, we find that the observed light curve can be fit with standard explosion energy ( ergs) and that the IIn-like signatures in SN 2023ixf can be modeled with a CSM composition that matches typical RSG surface abundances with no need for significant N or He enrichment.
For a wind velocity of , the proposed CSM extent translates to a period of enhanced mass-loss (i.e. “super wind”) in the last 3-6 years years prior to core collapse. This scenario comports with the observed duration of SN 2023ixf’s IIn-like line profiles (8 days), after which time the optical depth to electron-scattering in the CSM has decreased and SN 2023ixf begins to show absorption profiles from the outer, H-rich ejecta and fast moving dense shell. If the CSM detected in SN 2023ixf represents the only high-density shell of CSM (i.e. only one super wind phase), then the SN shock should continue to sample low-density material ( yr-1, ) at larger distances ( cm). Overall, both the confined high-density CSM shell and the extended low-density wind may have made the RSG progenitor star quite dust obscured prior to explosion (Davies et al., 2022). This is consistent with the findings of Kilpatrick et al. (2023) who show that the pre-explosion Hubble and Spitzer imaging of SN 2023ixf indicates a moderately sized (11 ) RSG progenitor star enshrouded in a dust shell.
This physical progenitor picture is also consistent with the initial findings of multi-wavelength observations of SN 2023ixf. X-ray observations revealed a 3-30 keV spectrum consistent with bremsstrahlung emission that initially showed significant absorption in the soft part of the spectrum (Grefenstette et al., 2023). These observations are indicative of shock interaction with dense CSM in a confined shell. Furthermore, radio observations have so far produced non-detections at GHz with SMA, GMRT, and VLA (Berger et al., 2023; Matthews et al., 2023; Chandra et al., 2023), likely caused by large free-free absorption in the optically thick CSM. However, as the SN shock now enters lower density material at larger distances, it is probable that the radio emission in SN 2023ixf will become detectable.
5 Conclusions
In this paper we have presented UV/optical observations and models of the nearby SN II, 2023ixf located in nearby spiral host galaxy M101 at Mpc. Below we summarize the primary observational findings of SN 2023ixf:
-
•
The early-time spectra of SN 2023ixf show prominent narrow emission lines of H i, He i/ii, N iii/iv/v and C iv that result from the photo-ionization of dense, optically thick CSM. These electron-scattering broadened profiles (i.e., IIn-like) last for days, after which time broad absorption profiles from the fastest H-rich SN ejecta begin to form.
-
•
CSM interaction in SN 2023ixf caused increased peak absolute magnitudes (e.g., mag, mag) relative to SNe II that occur in a low density circumstellar environment (e.g., g cm-3). The observed multi-color peak absolute magnitudes and duration of the IIn-like profiles (i.e., places SN 2023ixf in the continuum of SNe II with varying degrees of RSG mass-loss before explosion. Compared to the sample of CSM-interacting SNe II compiled in Jacobson-Galán et al. (2023), SN 2023ixf is most similar to SNe 2017ahn, 2018zd, 2020pni and 2022ffg.
-
•
Comparing SN 2023ixf’s peak absolute magnitudes and duration of IIn-like profiles to a grid of CMFGEN simulations suggests a CSM that has a composition typical of a solar-metallicity RSG, is confined to cm, and is formed from wind corresponding to a progenitor mass-loss rate of yr-1 (i.e., g cm-3 at cm). Adopting a wind velocity of , this scenario corresponds to a period of enhanced mass-loss (i.e., “superwind”) during the last 3-6 years years before core-collapse.
Given its close proximity and present brightness, SN 2023ixf is poised to become the best studied CSM-interacting SN II to date. Future, multi-wavelength observations will, among other things, uncover the density profile of the confined CSM as well as the mass-loss history of the RSG progenitor in its final decades to centuries.
6 Acknowledgements
Research at UC Berkeley is conducted on the territory of Huichin, the ancestral and unceded land of the Chochenyo speaking Ohlone people, the successors of the sovereign Verona Band of Alameda County. PS1/2 observations were conducted on the stolen land of the kānaka ‘ōiwi people. We stand in solidarity with the Pu’uhonua o Pu’uhuluhulu Maunakea in their effort to preserve these sacred spaces for native Hawai‘ians. Shane 3-m observations were conducted on the stolen land of the Ohlone (Costanoans), Tamyen and Muwekma Ohlone tribes.
We thank Greg Zeimann for help with HET data reduction and Dan Weisz for Kast observations.
The Young Supernova Experiment and its research infrastructure is supported by the European Research Council under the European Union’s Horizon 2020 research and innovation programme (ERC Grant Agreement No. 101002652, PI K. Mandel), the Heising-Simons Foundation (2018-0913, PI R. Foley; 2018-0911, PI R. Margutti), NASA (NNG17PX03C, PI R. Foley), NSF (AST-1720756, AST-1815935, PI R. Foley; AST-1909796, AST-1944985, PI R. Margutti), the David & Lucille Packard Foundation (PI R. Foley), VILLUM FONDEN (project number 16599, PI J. Hjorth), and the Center for AstroPhysical Surveys (CAPS) at the National Center for Supercomputing Applications (NCSA) and the University of Illinois Urbana-Champaign.
W.J.-G. is supported by the National Science Foundation Graduate Research Fellowship Program under Grant No. DGE-1842165. W.J.-G. acknowledges support through NASA grants in support of Hubble Space Telescope program GO-16075 and 16500. This research was supported in part by the National Science Foundation under Grant No. NSF PHY-1748958. R.M. acknowledges support by the National Science Foundation under Award No. AST-2221789 and AST-2224255. The Margutti team at UC Berkeley is partially funded by the Heising-Simons Foundation under grant # 2018-0911 and #2021-3248 (PI: Margutti).
C.D.K. is partly supported by a CIERA postdoctoral fellowship and a grant in support of NASA program HST-GO-16136. V.A.V. acknowledges support by the National Science Foundation under Award No.AST-2108676. C.R.A. was supported by grants from VILLUM FONDEN (project numbers 16599). Parts of this research were supported by the Australian Research Council Centre of Excellence for All Sky Astrophysics in 3 Dimensions (ASTRO 3D), through project number CE170100013. Y.-C.P. is supported by the National Science and Technology Council (NSTC grant 109-2112-M-008-031-MY3. A.G. is supported by the National Science Foundation Graduate Research Fellowship Program under Grant No. DGE–1746047. A.G. also acknowledges funding from the Center for Astrophysical Surveys Fellowship at UIUC/NCSA and the Illinois Distinguished Fellowship. C.G. is supported by a VILLUM FONDEN Young Investigator Grant (project number 25501). SJS acknowledges funding from STFC grants Ref: ST/T000198/1 and ST/S006109/1. J.H. was supported by a VILLUM FONDEN Investigator grant (project number 16599). D. M. acknowledges NSF support from grants PHY-2209451 and AST-2206532.
The UCSC team is supported in part by NASA grants NNG17PX03C and 80NSSC22K1518, NSF grant AST–1815935, and by a fellowship from the David and Lucile Packard Foundation to R.J.F.
YSE-PZ (Coulter et al., 2023) was developed by the UC Santa Cruz Transients Team with support from NASA grants NNG17PX03C, 80NSSC19K1386, and 80NSSC20K0953; NSF grants AST-1518052, AST-1815935, and AST-1911206; the Gordon & Betty Moore Foundation; the Heising-Simons Foundation; a fellowship from the David and Lucile Packard Foundation to R.J.F.; Gordon and Betty Moore Foundation postdoctoral fellowships and a NASA Einstein fellowship, as administered through the NASA Hubble Fellowship program and grant HST-HF2-51462.001, to D.O.J.; and a National Science Foundation Graduate Research Fellowship, administered through grant No. DGE-1339067, to D.A.C.
A major upgrade of the Kast spectrograph on the Shane 3 m telescope at Lick Observatory, led by Brad Holden, was made possible through generous gifts from the Heising-Simons Foundation, William and Marina Kast, and the University of California Observatories. Research at Lick Observatory is partially supported by a generous gift from Google.
This research was supported by the Munich Institute for Astro-, Particle and BioPhysics (MIAPbP) which is funded by the Deutsche Forschungsgemeinschaft (DFG, German Research Foundation) under Germany´s Excellence Strategy – EXC-2094 – 390783311.
The Pan-STARRS1 Surveys (PS1) and the PS1 public science archive have been made possible through contributions by the Institute for Astronomy, the University of Hawaii, the Pan-STARRS Project Office, the Max-Planck Society and its participating institutes, the Max Planck Institute for Astronomy, Heidelberg and the Max Planck Institute for Extraterrestrial Physics, Garching, The Johns Hopkins University, Durham University, the University of Edinburgh, the Queen’s University Belfast, the Harvard-Smithsonian Center for Astrophysics, the Las Cumbres Observatory Global Telescope Network Incorporated, the National Central University of Taiwan, STScI, NASA under grant NNX08AR22G issued through the Planetary Science Division of the NASA Science Mission Directorate, NSF grant AST–1238877, the University of Maryland, Eotvos Lorand University (ELTE), the Los Alamos National Laboratory, and the Gordon and Betty Moore Foundation.
IRAF is distributed by NOAO, which is operated by AURA, Inc., under cooperative agreement with the National Science Foundation (NSF).
References
- Anderson et al. (2014) Anderson, J. P., González-Gaitán, S., Hamuy, M., et al. 2014, ApJ, 786, 67, doi: 10.1088/0004-637X/786/1/67
- Beasor et al. (2020) Beasor, E. R., Davies, B., Smith, N., et al. 2020, MNRAS, 492, 5994, doi: 10.1093/mnras/staa255
- Becker (2015) Becker, A. 2015, HOTPANTS: High Order Transform of PSF ANd Template Subtraction, Astrophysics Source Code Library. http://ascl.net/1504.004
- Berger et al. (2023) Berger, E., Keating, G., Alexander, K., et al. 2023, Transient Name Server AstroNote, 131, 1
- Boian & Groh (2020) Boian, I., & Groh, J. H. 2020, MNRAS, 496, 1325, doi: 10.1093/mnras/staa1540
- Bruch et al. (2021) Bruch, R. J., Gal-Yam, A., Schulze, S., et al. 2021, ApJ, 912, 46, doi: 10.3847/1538-4357/abef05
- Bruch et al. (2022) Bruch, R. J., Gal-Yam, A., Yaron, O., et al. 2022, arXiv e-prints, arXiv:2212.03313, doi: 10.48550/arXiv.2212.03313
- Chambers et al. (2017) Chambers, K. C., Huber, M. E., Flewelling, H., et al. 2017, Transient Name Server Discovery Report, 2017-324, 1
- Chandra et al. (2023) Chandra, P., Chevalier, R., Nayana, A. J., Maeda, K., & Ray, A. 2023, The Astronomer’s Telegram, 16052, 1
- Chugai (2001) Chugai, N. N. 2001, MNRAS, 326, 1448, doi: 10.1111/j.1365-2966.2001.04717.x
- Coulter et al. (2022) Coulter, D. A., Jones, D. O., McGill, P., et al. 2022, YSE-PZ: An Open-source Target and Observation Management System, v0.3.0, Zenodo, Zenodo, doi: 10.5281/zenodo.7278430
- Coulter et al. (2023) —. 2023, PASP, 135, 064501, doi: 10.1088/1538-3873/acd662
- Davies & Dessart (2019) Davies, B., & Dessart, L. 2019, MNRAS, 483, 887, doi: 10.1093/mnras/sty3138
- Davies et al. (2022) Davies, B., Plez, B., & Petrault, M. 2022, MNRAS, 517, 1483, doi: 10.1093/mnras/stac2427
- Davis et al. (2023) Davis, K. W., Taggart, K., Tinyanont, S., et al. 2023, MNRAS, doi: 10.1093/mnras/stad1433
- Dessart et al. (2015) Dessart, L., Audit, E., & Hillier, D. J. 2015, MNRAS, 449, 4304, doi: 10.1093/mnras/stv609
- Dessart & Hillier (2022) Dessart, L., & Hillier, D. J. 2022, A&A, 660, L9, doi: 10.1051/0004-6361/202243372
- Dessart et al. (2016) Dessart, L., Hillier, D. J., Audit, E., Livne, E., & Waldman, R. 2016, MNRAS, 458, 2094, doi: 10.1093/mnras/stw336
- Dessart et al. (2009) Dessart, L., Hillier, D. J., Gezari, S., Basa, S., & Matheson, T. 2009, MNRAS, 394, 21, doi: 10.1111/j.1365-2966.2008.14042.x
- Dessart et al. (2013) Dessart, L., Hillier, D. J., Waldman, R., & Livne, E. 2013, MNRAS, 433, 1745, doi: 10.1093/mnras/stt861
- Dessart & Jacobson-Galán (2023) Dessart, L., & Jacobson-Galán, W. V. 2023, arXiv e-prints, arXiv:2307.08584. https://arxiv.org/abs/2307.08584
- Dessart et al. (2017) Dessart, L., John Hillier, D., & Audit, E. 2017, A&A, 605, A83, doi: 10.1051/0004-6361/201730942
- Fassia et al. (2001) Fassia, A., Meikle, W. P. S., Chugai, N., et al. 2001, MNRAS, 325, 907, doi: 10.1046/j.1365-8711.2001.04282.x
- Finkbeiner et al. (2016) Finkbeiner, D. P., Schlafly, E. F., Schlegel, D. J., et al. 2016, ApJ, 822, 66, doi: 10.3847/0004-637X/822/2/66
- Fitzpatrick (1999) Fitzpatrick, E. L. 1999, PASP, 111, 63, doi: 10.1086/316293
- Flewelling et al. (2016) Flewelling, H. A., Magnier, E. A., Chambers, K. C., et al. 2016, arXiv e-prints, arXiv:1612.05243. https://arxiv.org/abs/1612.05243
- Fuller (2017) Fuller, J. 2017, MNRAS, 470, 1642, doi: 10.1093/mnras/stx1314
- Gaia Collaboration (2022) Gaia Collaboration. 2022, VizieR Online Data Catalog, I/355
- Gal-Yam et al. (2014a) Gal-Yam, A., Arcavi, I., Ofek, E. O., et al. 2014a, Nature, 509, 471, doi: 10.1038/nature13304
- Gal-Yam et al. (2014b) —. 2014b, Nature, 509, 471, doi: 10.1038/nature13304
- González et al. (2007) González, M., Audit, E., & Huynh, P. 2007, A&A, 464, 429, doi: 10.1051/0004-6361:20065486
- Grefenstette et al. (2023) Grefenstette, B. W., Brightman, M., Earnshaw, H. P., Harrison, F. A., & Margutti, R. 2023, ApJ, 952, L3, doi: 10.3847/2041-8213/acdf4e
- Groh (2014) Groh, J. H. 2014, A&A, 572, L11, doi: 10.1051/0004-6361/201424852
- Hillier & Dessart (2012) Hillier, D. J., & Dessart, L. 2012, MNRAS, 424, 252, doi: 10.1111/j.1365-2966.2012.21192.x
- Hiramatsu et al. (2021) Hiramatsu, D., Howell, D. A., Van Dyk, S. D., et al. 2021, Nature Astronomy, 5, 903, doi: 10.1038/s41550-021-01384-2
- Horne (1986) Horne, K. 1986, PASP, 98, 609, doi: 10.1086/131801
- Huang & Chevalier (2018) Huang, C., & Chevalier, R. A. 2018, MNRAS, 475, 1261, doi: 10.1093/mnras/stx3163
- Itagaki (2023) Itagaki, K. 2023, Transient Name Server Discovery Report, 2023-1158, 1
- Jacobson-Galán et al. (2023) Jacobson-Galán, W. V., Margutti, R., Chornock, R., Foley, R. J., & Kilpatrick, C. D. 2023, in prep.
- Jacobson-Galán et al. (2020) Jacobson-Galán, W. V., Margutti, R., Kilpatrick, C. D., et al. 2020, ApJ, 898, 166, doi: 10.3847/1538-4357/ab9e66
- Jacobson-Galán et al. (2022) Jacobson-Galán, W. V., Dessart, L., Jones, D. O., et al. 2022, ApJ, 924, 15, doi: 10.3847/1538-4357/ac3f3a
- Jones et al. (2021) Jones, D. O., Foley, R. J., Narayan, G., et al. 2021, ApJ, 908, 143, doi: 10.3847/1538-4357/abd7f5
- Kaiser et al. (2002) Kaiser, N., Aussel, H., Burke, B. E., et al. 2002, in Society of Photo-Optical Instrumentation Engineers (SPIE) Conference Series, Vol. 4836, Survey and Other Telescope Technologies and Discoveries, ed. J. A. Tyson & S. Wolff, 154–164, doi: 10.1117/12.457365
- Khazov et al. (2016) Khazov, D., Yaron, O., Gal-Yam, A., et al. 2016, ApJ, 818, 3, doi: 10.3847/0004-637X/818/1/3
- Kilpatrick et al. (2018) Kilpatrick, C. D., Takaro, T., Foley, R. J., et al. 2018, MNRAS, 480, 2072, doi: 10.1093/mnras/sty2022
- Kilpatrick et al. (2023) Kilpatrick, C. D., Foley, R. J., Jacobson-Galán, W. V., et al. 2023, arXiv e-prints, arXiv:2306.04722, doi: 10.48550/arXiv.2306.04722
- Leonard et al. (2000) Leonard, D. C., Filippenko, A. V., Barth, A. J., & Matheson, T. 2000, ApJ, 536, 239, doi: 10.1086/308910
- Magnier et al. (2020) Magnier, E. A., Schlafly, E. F., Finkbeiner, D. P., et al. 2020, The Astrophysical Journal Supplement Series, 251, 6, doi: 10.3847/1538-4365/abb82a
- Mao et al. (2023) Mao, Y., Zhang, M., Cai, G., et al. 2023, Transient Name Server AstroNote, 130, 1
- Martini et al. (2014) Martini, P., Elias, J., Points, S., et al. 2014, in Society of Photo-Optical Instrumentation Engineers (SPIE) Conference Series, Vol. 9147, Ground-based and Airborne Instrumentation for Astronomy V, ed. S. K. Ramsay, I. S. McLean, & H. Takami, 91470Z, doi: 10.1117/12.2056834
- Matthews et al. (2023) Matthews, D., Margutti, R., Alexander, K. D., et al. 2023, Transient Name Server AstroNote, 146, 1
- McCully et al. (2018) McCully, C., Volgenau, N. H., Harbeck, D.-R., et al. 2018, in Society of Photo-Optical Instrumentation Engineers (SPIE) Conference Series, Vol. 10707, Software and Cyberinfrastructure for Astronomy V, ed. J. C. Guzman & J. Ibsen, 107070K, doi: 10.1117/12.2314340
- Miller & Stone (1993) Miller, J. S., & Stone, R. P. S. 1993, LOTRM
- Owocki et al. (2004) Owocki, S. P., Gayley, K. G., & Shaviv, N. J. 2004, ApJ, 616, 525, doi: 10.1086/424910
- Owocki et al. (2017) Owocki, S. P., Townsend, R. H. D., & Quataert, E. 2017, MNRAS, 472, 3749, doi: 10.1093/mnras/stx2251
- Pan et al. (2020) Pan, Y. C., Foley, R. J., Jones, D. O., Filippenko, A. V., & Kuin, N. P. M. 2020, MNRAS, 491, 5897, doi: 10.1093/mnras/stz3391
- Perley et al. (2023) Perley, D. A., Gal-Yam, A., Irani, I., & Zimmerman, E. 2023, Transient Name Server AstroNote, 119, 1
- Poznanski et al. (2012) Poznanski, D., Prochaska, J. X., & Bloom, J. S. 2012, MNRAS, 426, 1465, doi: 10.1111/j.1365-2966.2012.21796.x
- Quataert et al. (2016) Quataert, E., Fernández, R., Kasen, D., Klion, H., & Paxton, B. 2016, MNRAS, 458, 1214, doi: 10.1093/mnras/stw365
- Quataert & Shiode (2012) Quataert, E., & Shiode, J. 2012, MNRAS, 423, L92, doi: 10.1111/j.1745-3933.2012.01264.x
- Rest et al. (2005) Rest, A., Stubbs, C., Becker, A. C., et al. 2005, ApJ, 634, 1103, doi: 10.1086/497060
- Riess et al. (2016) Riess, A. G., Macri, L. M., Hoffmann, S. L., et al. 2016, ApJ, 826, 56, doi: 10.3847/0004-637X/826/1/56
- Riess et al. (2022) Riess, A. G., Yuan, W., Macri, L. M., et al. 2022, ApJ, 934, L7, doi: 10.3847/2041-8213/ac5c5b
- Schechter et al. (1993) Schechter, P. L., Mateo, M., & Saha, A. 1993, PASP, 105, 1342, doi: 10.1086/133316
- Schlafly & Finkbeiner (2011) Schlafly, E. F., & Finkbeiner, D. P. 2011, ApJ, 737, 103, doi: 10.1088/0004-637X/737/2/103
- Schlegel et al. (1998) Schlegel, D. J., Finkbeiner, D. P., & Davis, M. 1998, ApJ, 500, 525, doi: 10.1086/305772
- Shivvers et al. (2015) Shivvers, I., Groh, J. H., Mauerhan, J. C., et al. 2015, ApJ, 806, 213, doi: 10.1088/0004-637X/806/2/213
- Smith (2014) Smith, N. 2014, ARA&A, 52, 487, doi: 10.1146/annurev-astro-081913-040025
- Smith et al. (2015) Smith, N., Mauerhan, J. C., Cenko, S. B., et al. 2015, MNRAS, 449, 1876, doi: 10.1093/mnras/stv354
- Stritzinger et al. (2023) Stritzinger, M., Valerin, G., Elias-Rosa, N., et al. 2023, Transient Name Server AstroNote, 145, 1
- Tartaglia et al. (2021) Tartaglia, L., Sand, D. J., Groh, J. H., et al. 2021, ApJ, 907, 52, doi: 10.3847/1538-4357/abca8a
- Teja et al. (2022) Teja, R. S., Singh, A., Sahu, D. K., et al. 2022, ApJ, 930, 34, doi: 10.3847/1538-4357/ac610b
- Terreran et al. (2016) Terreran, G., Jerkstrand, A., Benetti, S., et al. 2016, MNRAS, 462, 137, doi: 10.1093/mnras/stw1591
- Terreran et al. (2022) Terreran, G., Jacobson-Galán, W. V., Groh, J. H., et al. 2022, ApJ, 926, 20, doi: 10.3847/1538-4357/ac3820
- Tinyanont et al. (2022) Tinyanont, S., Ridden-Harper, R., Foley, R. J., et al. 2022, MNRAS, 512, 2777, doi: 10.1093/mnras/stab2887
- Tsuna et al. (2023) Tsuna, D., Murase, K., & Moriya, T. J. 2023, arXiv e-prints, arXiv:2301.10667, doi: 10.48550/arXiv.2301.10667
- Vaytet et al. (2011) Vaytet, N. M. H., Audit, E., Dubroca, B., & Delahaye, F. 2011, J. Quant. Spec. Radiat. Transf., 112, 1323, doi: 10.1016/j.jqsrt.2011.01.027
- Wang et al. (2023) Wang, Q., Goel, A., Dessart, L., et al. 2023, arXiv e-prints, arXiv:2305.05015, doi: 10.48550/arXiv.2305.05015
- Waters et al. (2020) Waters, C. Z., Magnier, E. A., Price, P. A., et al. 2020, ApJS, 251, 4, doi: 10.3847/1538-4365/abb82b
- Wu & Fuller (2021) Wu, S., & Fuller, J. 2021, ApJ, 906, 3, doi: 10.3847/1538-4357/abc87c
- Yamanaka et al. (2023) Yamanaka, M., Fujii, M., & Nagayama, T. 2023, arXiv e-prints, arXiv:2306.00263, doi: 10.48550/arXiv.2306.00263
- Yaron et al. (2017) Yaron, O., Perley, D. A., Gal-Yam, A., et al. 2017, Nature Physics, 13, 510, doi: 10.1038/nphys4025
- Zhang et al. (2020) Zhang, J., Wang, X., József, V., et al. 2020, MNRAS, 498, 84, doi: 10.1093/mnras/staa2273
Here we present a log of optical spectroscopic observations of SN 2023ixf in Table A1 and a list of model properties for all CMFGEN simulations in Table A2. Figure 7 presents Swift UVOT grism spectra of SN 2023ixf and model predictions for FUV spectral features. Figure 8 shows the time-series evolution of luminosity, density, temperature and velocity as a function of radius in the r1w6b model.
| UT Date | MJD | PhaseaaRelative to first light (MJD 60082.83) | Telescope | Instrument | Wavelength Range |
|---|---|---|---|---|---|
| (days) | (Å) | ||||
| 2023-05-21 | 60085.20 | 2.36 | Shane | Kast | 3600–10800 |
| 2023-05-21 | 60085.21 | 2.37 | Shane | Kast | 5600–7254 |
| 2023-05-21 | 60085.44 | 2.61 | Shane | Kast | 3600–10800 |
| 2023-05-21 | 60085.46 | 2.63 | Shane | Kast | 5600–7254 |
| 2023-05-22 | 60086.20 | 3.36 | Shane | Kast | 3600–9000 |
| 2023-05-22 | 60086.24 | 3.41 | APO | KOSMOS | 3600–10800 |
| 2023-05-22 | 60086.31 | 3.48 | HET | LRS | 3600–7000 |
| 2023-05-23 | 60087.23 | 4.39 | Shane | Kast | 3600–9000 |
| 2023-05-24 | 60088.31 | 5.48 | Shane | Kast | 3600–9000 |
| 2023-05-25 | 60089.20 | 6.36 | Shane | Kast | 3600–9000 |
| 2023-05-27 | 60091.21 | 8.38 | Shane | Kast | 3600–9000 |
| 2023-05-29 | 60093.41 | 10.58 | Shane | Kast | 3600–10800 |
| 2023-05-29 | 60093.42 | 10.59 | Shane | Kast | 5600–7254 |
| 2023-05-30 | 60094.25 | 11.41 | Shane | Kast | 3600–9000 |
| 2023-05-31 | 60095.19 | 12.35 | Shane | Kast | 3600–9000 |
| 2023-06-02 | 60097.26 | 14.43 | Shane | Kast | 3600–10800 |
| Name | a | Reference | |||
|---|---|---|---|---|---|
| (days) | (M⊙ yr-1) | (g cm-3) | (cm) | ||
| r1w1h | 1.0e-06 | 2.7e-12 | Dessart et al. (2017) | ||
| r1w1 | 1.0e-06 | 1.0e-16 | Dessart et al. (2017) | ||
| r2w1 | 1.0e-06 | 9.0e-16 | Dessart et al. (2017) | ||
| r1w4 | 1.0e-03 | 1.0e-13 | Dessart et al. (2017) | ||
| r1w5h | 3.0e-03 | 5.0e-13 | Dessart et al. (2017) | ||
| r1w5r | 5.0e-03 | 5.0e-13 | Dessart et al. (2017) | ||
| r1w6 | 1.0e-02 | 1.0e-12 | Dessart et al. (2017) | ||
| r1w6a | 1.0e-02 | 1.0e-12 | This work | ||
| r1w6b | 1.0e-02 | 1.0e-12 | This work | ||
| r1w6c | 1.0e-02 | 1.0e-12 | Jacobson-Galán et al. (2022) | ||
| r1w7a | 3.0e-02 | 3.0e-12 | Jacobson-Galán et al. (2022) | ||
| r1w7b | 3.0e-02 | 3.0e-12 | Jacobson-Galán et al. (2022) | ||
| r1w7c | 3.0e-02 | 3.0e-12 | Jacobson-Galán et al. (2022) | ||
| r1w7d | 3.0e-02 | 3.0e-12 | Jacobson-Galán et al. (2022) | ||
| m1em5 | 1.0e-05 | 6.1e-16 | Dessart & Jacobson-Galán (2023) | ||
| m1em4 | 1.0e-04 | 5.2e-15 | Dessart & Jacobson-Galán (2023) | ||
| m1em3 | 1.0e-03 | 5.4e-14 | Dessart & Jacobson-Galán (2023) | ||
| m1em2 | 1.0e-02 | 1.3e-12 | Dessart & Jacobson-Galán (2023) | ||
| m1em1 | 1.0e-01 | 1.4e-11 | Dessart & Jacobson-Galán (2023) | ||
| m1em0 | 1.0e+00 | 7.3e-11 | Dessart & Jacobson-Galán (2023) |