Cerium features in kilonova near-infrared spectra: implication from a chemically peculiar star
Abstract
Observations of the kilonova from a neutron star merger event GW170817 opened a way to directly study -process nucleosynthesis by neutron star mergers. It is, however, challenging to identify the individual elements in the kilonova spectra due to lack of complete atomic data, in particular, at near-infrared wavelengths. In this paper, we demonstrate that spectra of chemically peculiar stars with enhanced heavy element abundances can provide us with an excellent astrophysical laboratory for kilonova spectra. We show that the photosphere of a late B-type chemically peculiar star HR 465 has similar lanthanide abundances and ionization degrees with those in the line forming region in a kilonova at days after the merger. The near-infrared spectrum of HR 465 taken with Subaru/IRD indicates that Ce III lines give the strongest absorption features around 16,000 Å and there are no other comparably strong transitions around these lines. The Ce III lines nicely match with the broad absorption features at 14,500 Å observed in GW170817 with a blueshift of , which supports recent identification of this feature as Ce III by Domoto et al. (2022).
1 Introduction
Multi-messenger observations of a neutron star merger GW170817 opened a new pathway to study the astrophysical sites of -process nucleosynthesis. Following the detection of gravitational waves, an electromagnetic counterpart was identified in ultraviolet, optical, and infrared wavelengths (AT 2017gfo, Abbott et al. 2017). The properties of AT 2017gfo are consistent with those of a kilonova (e.g., Li & Paczyński, 1998; Metzger et al., 2010), a thermal emission powered by decays of -process nuclei, which gives evidence that the neutron star merger is a site of -process nucleosynthesis (e.g., Kasen et al., 2017; Perego et al., 2017; Tanaka et al., 2017; Rosswog et al., 2018; Kawaguchi et al., 2018).
To extract detailed information of -process nucleosynthesis, such as the amounts of individual elements and their spatial distribution, it is necessary to identify elements in the spectra as done for stellar spectra. In fact, a series of optical and near-infrared (NIR) spectra have been taken for AT 2017gfo (e.g., Chornock et al., 2017; Pian et al., 2017; Smartt et al., 2017). However, it is challenging to decode the spectra due to high Doppler shifts of the spectral lines, presence of many heavy elements, and lack of complete and accurate atomic data, in particular, in the NIR wavelengths.
Watson et al. (2019) proposed that the observed absorption features around 9,000 Å are caused by Sr II lines. This identification was further confirmed by Domoto et al. (2021) with full radiative transfer simulations. Also, Gillanders et al. (2022) quantified the Sr abundance by atmospheric modeling. The same feature may also be caused by a He I line (Perego et al., 2022), although the strength of the He I line depends on non local thermodynamic equilibrium (non-LTE) effects (Tarumi et al., 2023).
Recently, Domoto et al. (2022) systematically studied the spectral features of kilonovae in the NIR wavelengths. They identified several elements producing strong transitions in kilonovae, such as Ca, Sr, Y, Zr, Ba, La, and Ce. Then, they constructed a hybrid linelist by combining theoretical linelist based on atomic models of Tanaka et al. (2020) and accurate linelist for the important ions based on spectroscopic experiments. By performing radiative transfer simulations with the hybrid linelist, they showed that the broad NIR features around 13,000 Å and 14,500 Å in AT 2017gfo are reproduced by La III and Ce III lines, respectively.
There are, however, still no complete and accurate atomic data at NIR wavelengths, which cover all the heavy elements synthesized in the neutron star mergers. Therefore, there might be unknown transitions of other elements that contribute to the NIR absorption features of kilonova spectra.
In this paper, we demonstrate that atmosphere of chemically peculiar stars provides an excellent laboratory to decode kilonova spectra. Chemically peculiar stars are known to exhibit abnormal elemental abundance patterns. Some chemically peculiar stars show extremely enhanced metal abundances (hereafter we call stars with enhanced metal abundances as chemically peculiar stars), which are likely to be caused by atomic diffusion (Michaud, 1970). Thus, the atmosphere of such stars can mimic the elemental abundances in kilonovae dominated by heavy elements. In Section 2, we show similarities in the atmospheres of chemically peculiar stars and kilonovae by analyzing the properties of a late B-type chemically peculiar star HR 465 (= HD 9996, e.g., Preston & Wolff 1970; Aller 1972; Cowley & Greenberg 1987). In Section 3, we show the NIR spectrum of HR 465 and measurements of strong absorption lines. Then, we discuss implications to kilonova spectra in Section 4. Finally we give concluding remarks in Section 5. All the wavelengths given in this paper are those in air.
 |
 |
2 Chemically peculiar star as a laboratory of kilonova spectrum
2.1 Abundances
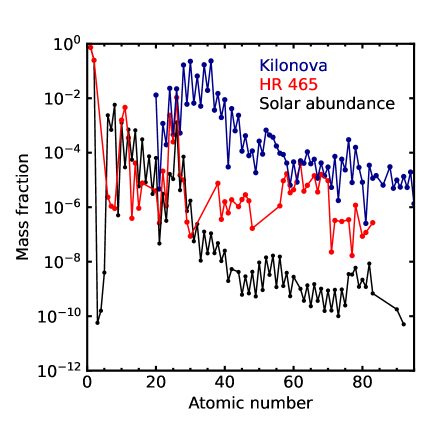
Abundances in the ejected material from neutron star mergers (hereafter kilonova ejecta) are dominated by elements heavier than Fe. The top panel of Figure 1 shows an abundance distribution adopted in the radiative transfer simulations by Domoto et al. (2021) and Domoto et al. (2022) as a representative case of kilonova ejecta (their “light” model assuming a solar -process-like pattern with an enhanced light component; see also Wanajo 2018). This particular example is a case that is consistent with the abundances of metal-poor stars with a weak -process signature such as HD 122563 (Honda et al., 2006).
Chemically peculiar stars often show enhanced abundances of elements heavier than Fe (e.g., Ghazaryan et al., 2018). In particular, Ap and Bp type stars show the abundances of lanthanides (atomic number ) enhanced by more than two orders of magnitude, which can match the high heavy element abundances in kilonovae. The red points in Figure 1 (top panel) show the elemental abundances of HR 465 (B9p, Nielsen et al. 2020). HR 465 is an intensively studied chemically peculiar star (e.g., Preston & Wolff, 1970; Aller, 1972; Cowley & Greenberg, 1987) with a metallicity of [Fe/H] (Nielsen et al., 2020). As clearly shown in Figure 1 (top panel), the abundances of heavy elements in HR 465 are greatly enhanced as compared with the solar abundance pattern (black, Asplund et al. 2009) 111The abundances of HR 465 are known to evolve with a photometric/magnetic phase (Rice, 1988) with a period of 21.5 yr (Pyper & Adelman, 2017). The abundances of the rare-earth elements become maximum at and minimum at . Our IRD observations (Section 3) are performed at . We show the abundances in Figure 1 by taking average of the abundances derived from the lines of different ionization degrees (if any) at different phases ( = 0.45, 0.68, and 0.85 Nielsen et al., 2020). The variation is up to about one order of magnitude, and the global trend discussed in this paper is not affected. .
In particular, the abundances of lanthanides () in HR 465 are enhanced by about 3 orders of magnitude, and their mass fractions are remarkably similar to those in the kilonova ejecta. Lanthanides are known to produce strong lines at NIR wavelengths due to their low-lying, dense energy levels (Kasen et al., 2013; Tanaka & Hotokezaka, 2013; Fontes et al., 2020). Thus, thanks to the similarity in the abundances, NIR spectra of such chemically peculiar stars can provide the candidates for strong absorption lines of lanthanides in kilonova NIR spectra.
2.2 Ionization degrees
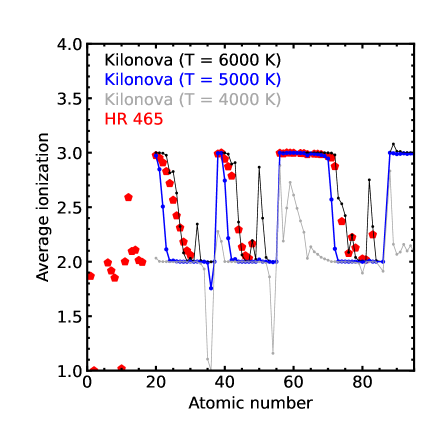
Some chemically peculiar stars also have similar ionization degrees with those in kilonova ejecta in a few days after the merger. The bottom panel of Figure 1 compares ionization degrees of kilonova and those of HR 465. The lines show average ionization degrees (neutral is denoted as 1, single ionization is denoted as 2, and so on) in the line forming region in a kilonova calculated under the assumption of LTE. The fiducial case (blue line) is calculated by assuming the abundance distribution as in the top panel, with a temperature of 5000 K and a matter density of . These parameters are chosen based on the properties of the line forming region in the NIR wavelength () at days after the merger in the radiative transfer simulations (see Figure 6 of Domoto et al. 2022). Typically, heavy elements are singly or doubly ionized under these conditions, and most of lanthanides are doubly ionized.
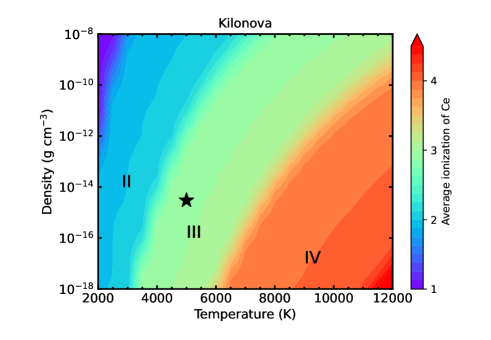
The temperature assumed here is somewhat higher than those derived by blackbody fitting to the observed kilonova spectra ( K e.g., Watson et al. 2019 and Sneppen et al. 2023). The difference stems from the fact that the line forming region in the NIR lines is located at an inner layer ( rather than the “photospheric” velocity of ) due to the lower opacities in the NIR wavelengths (Tanaka et al., 2020). To see the dependence of the ionization to the temperature, we also show the ionization degrees at K (black line in the bottom panel of Figure 1) and K (gray line). Also, the left panel of Figure 2 shows the average ionization of Ce for a wide range of temperature and density. Under the LTE, ionization degrees in kilonova ejecta depend on the temperature rather strongly around K. For example, the latter half of lanthanides become singly ionized at K (gray line in the bottom panel of Figure 1). Note that, as we neglect ionization by non-thermal electrons produced by beta decay of radioactive nuclei, the ionization degrees tend to be underestimated (see also Section 5).
The dominance of doubly ionized lanthanides is also seen in late B-type or early A-type dwarf stars with an effective temperature of K. The red points in the bottom panel of Figure 1 shows average ionization degrees at the photosphere of HR 465: K and . These parameters are taken based on the ATLAS9 atmospheric model (Castelli & Kurucz, 2003) with the stellar parameters of HR 465 (log and K), microturbulence velocity of 2 km s-1, and metallicity of [M/H] = 0.5, which is the most metal rich model available222https://wwwuser.oats.inaf.it/castelli/grids.html. For the calculation of ionization, we only include the elements with measured abundances. But this does not affect the ionization degrees because most of free electrons are provided by H and Fe.
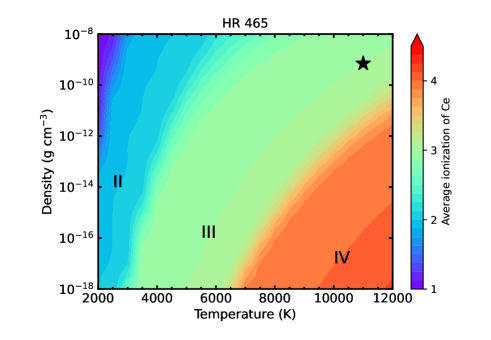
Although the photosphere of HR 465 has a higher temperature than that of kilonovae, ionization degrees are similar to those in kilonovae. This behavior is highlighted in Figure 2. For a given temperature, the ionization degrees decrease for a higher density. Thus, the higher matter density and higher temperature in the stellar photosphere result in a similar ionization degree with that in kilonovae. Around the parameter space of HR 465, the ionization degrees are not very sensitive to the temperature: doubly ionized lanthanides are still dominant even with = 11,000 1000 K.
In summary, the photosphere of late B-type or early A-type dwarf stars show similar ionization degrees with those of the line forming region of kilonovae at early phase. The photosphere of chemically peculiar stars has a higher temperature than that in kilonovae, and thus, for a given ion, more lines can become active in the photosphere of chemically peculiar stars. Therefore, the spectra of these stars can provide the complete and accurate linelist for strong transitions of the elements with a similar abundance to kilonovae (i.e., lanthanides for the case of HR 465).
3 NIR spectrum of HR 465
We obtained the NIR high-resolution spectrum of HR 465 using the Subaru Telescope InfraRed Doppler instrument (IRD; Tamura et al. 2012, Kotani et al. 2018) on 2020 July 25 (UT) with an exposure time of 300 sec. The spectrum covers the wavelength range from 9,300 to 17,600 Å with a spectral resolution of . The signal-to-noise ratios of the data range from 150 to 230 per pixel in the one-dimensional spectra depending on the position of the blaze profiles of the echelle spectra. This quality is sufficient for the purpose of the present study. To our knowledge, this is the first high-resolution spectrum of HR 465 covering the wide NIR wavelength range. The details of the observations and data reduction are reported by Aoki et al. (2022). The telluric absorption lines are correlated by the spectrum of the bright extremely metal-poor star BD+44∘493, in which few absorption lines are found in this wavelength range (Aoki et al., 2022).
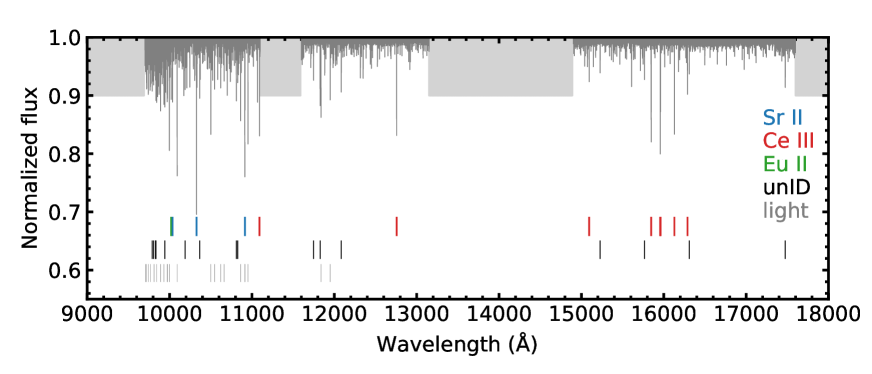
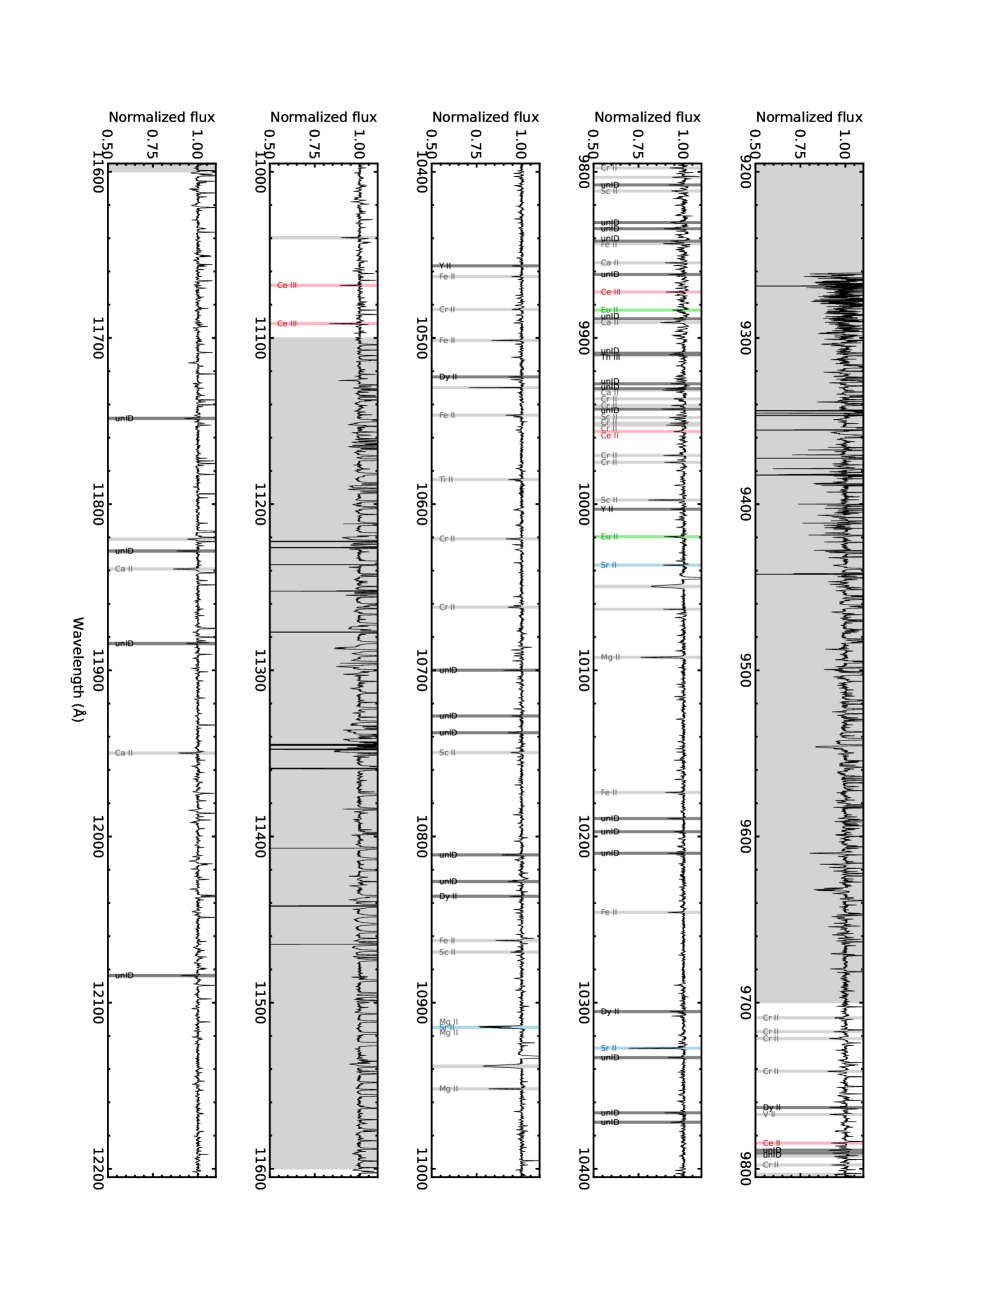
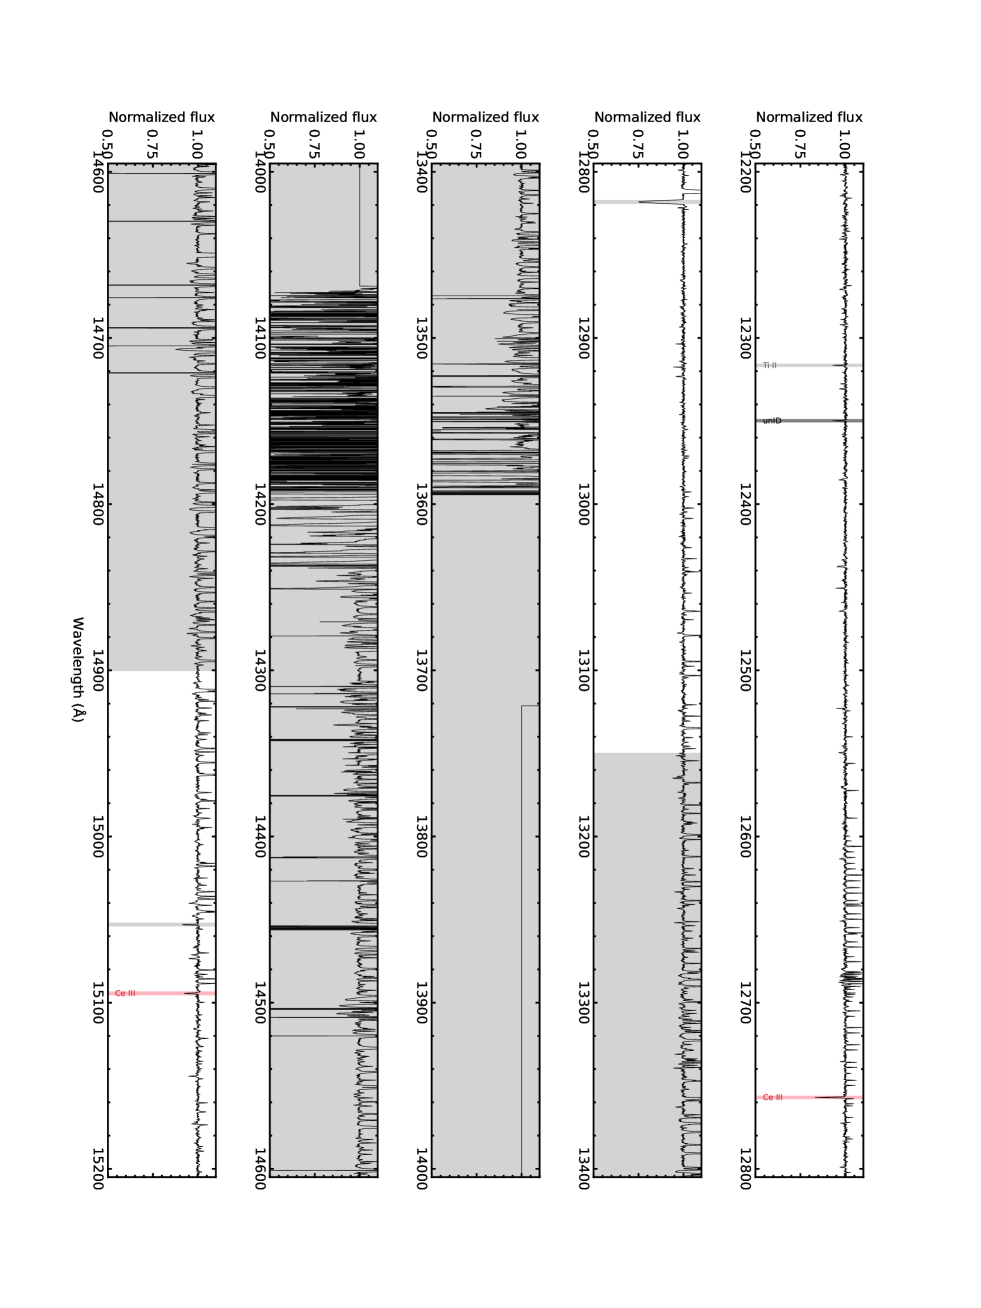
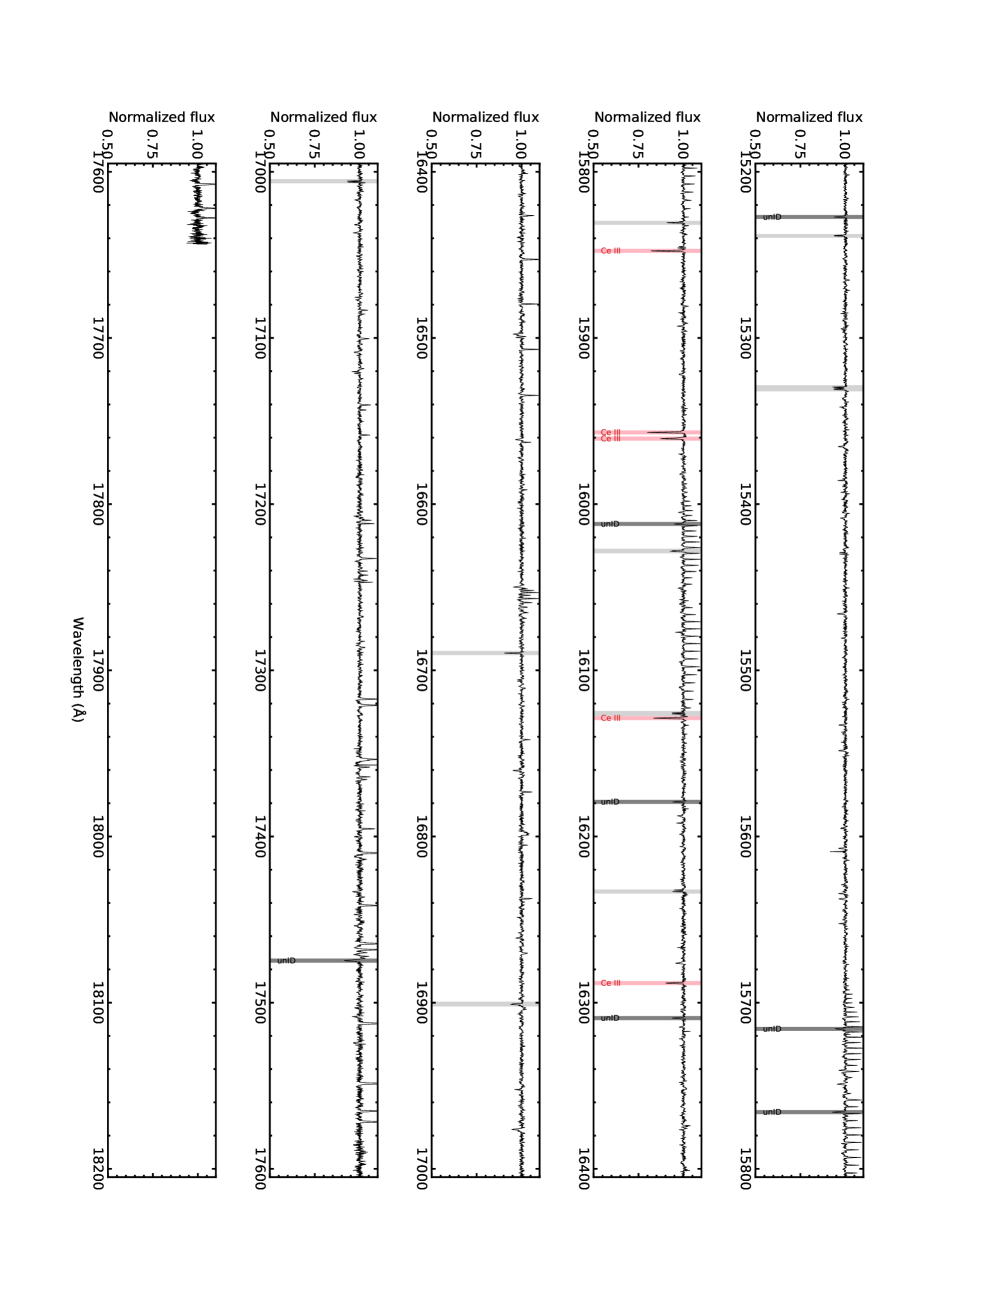
The top panel of Figure 3 shows the entire spectrum of HR 465 (see Figure 6 for the extended view). The spectrum is normalized by the continuum fitting for the ease of line identification. Furthermore, the broad hydrogen absorption features are fitted and the spectrum around those features is flattened. After masking the wavelength ranges with strong atmospheric absorption, i.e., ranges between , , and bands, as well as artifacts in the telluric correction (gray shaded regions without line identification in Figure 6), we detect strong absorption lines. Then, the detected lines are matched with the VALD linelist (Kupka et al., 1999) and the NIR linelist by Domoto et al. (2022). There are some lines with which no known transition is matched, in particular, at shorter wavelengths where more absorption lines exist. We keep these lines as “unID” as they may be caused by heavy elements. Then, we measure the equivalent widths (EWs) of the strong lines by assuming Gaussian profile.
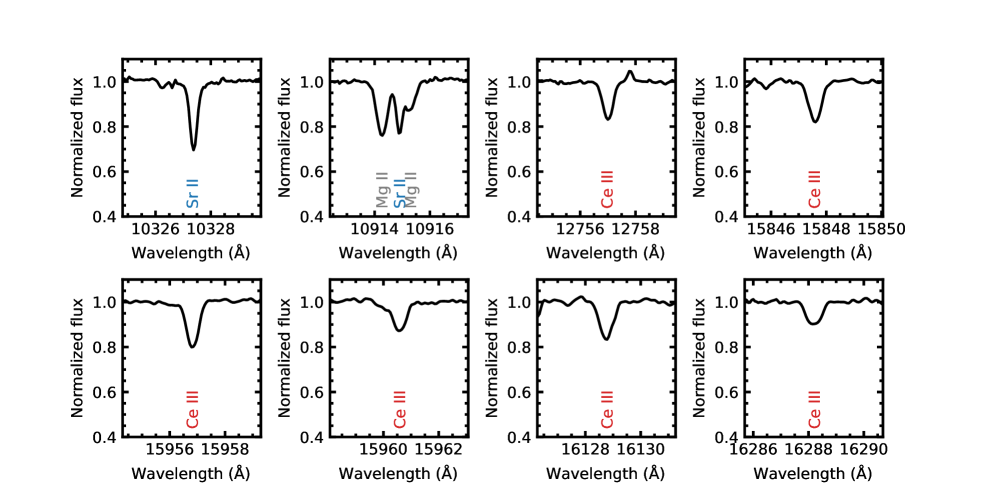
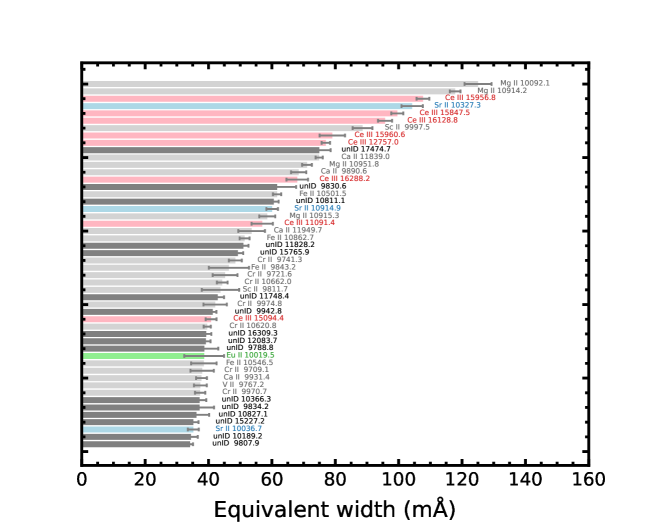
Figure 4 shows the EWs for 50 strongest transitions. It is clearly seen that, excluding elements lighter than Fe, the strongest absorptions in the NIR spectrum of HR 465 are dominated by the lines of Ce III and Sr II. The bottom panels of Figure 3 show the spectra around the six strongest transitions of Ce III and two strongest transitions of Sr II.
4 Implications to kilonova spectra
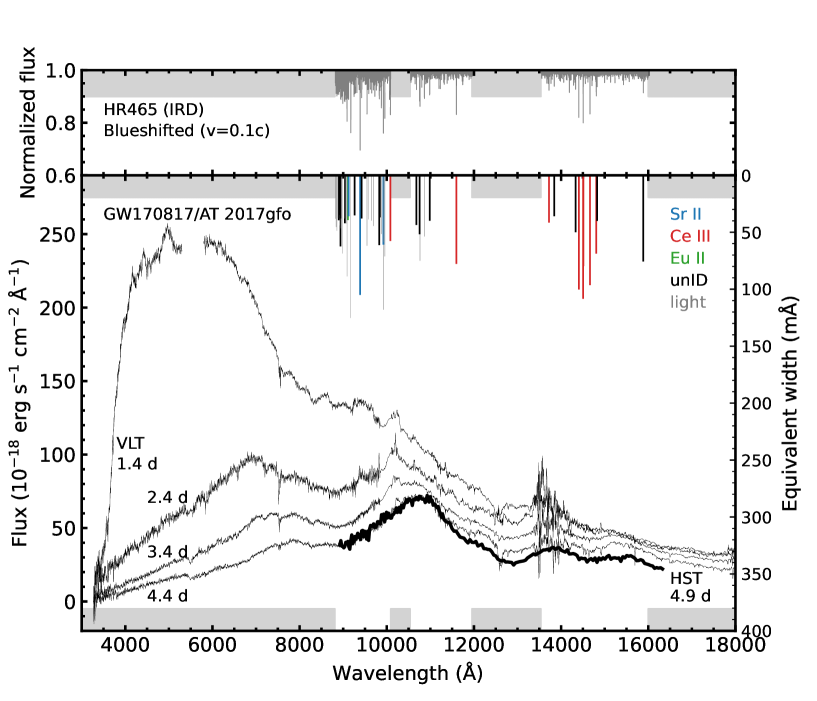
We apply the knowledge from HR 465 to the kilonova spectra. In Figure 5, we show the spectrum of HR 465 (top panel) and the EWs of 50 strongest transitions (bottom panel) compared with the spectra of AT 2017gfo (Pian et al., 2017; Smartt et al., 2017; Tanvir et al., 2017). To account for the expansion velocity of the ejecta, the lines are blueshifted with a velocity of c. This is a typical velocity of line forming region in the NIR wavelengths at days in the model of Domoto et al. (2022).
The absorption features of AT 2017gfo around 14,500 Å nicely match with the four strong lines of Ce III (Ce III 15956.8 Å, 15847.5 Å, 16128.8 Å, and 15960.6 Å) with a blueshift of (red lines). Importantly, there are no other elements that cause as strong contributions as Ce III to this feature. These facts support the element identification by Domoto et al. (2022).
The fact that the temperature of HR 465 is higher than in kilonovae makes our findings more indicative. Due to the higher temperature, the excited states of ions are more populated in HR 465, and transitions from a higher excitation energy can become active, which tends to give more candidate ions/transitions when compared with kilonovae. However, the lines corresponding to the 14,500 Å feature are still dominated by the Ce III lines, and this further supports our identification of the Ce III lines. Note that the excitation energy of the four strongest transitions of Ce III are 0.0 eV (ground state), 0.19 eV, 0.39 eV, and 0.81 eV for the Ce III 15956.8 Å, 15847.5 Å, 16128.8 Å, and 15960.6 Å lines, respectively. Thus, the lower states of these transitions are well populated even at the temperature of kilonova ejecta ( K).
It is worth noting that HR 465 also shows the strong Ce III 12757.0 Å line, which is a transition from the ground state. Since this line is as strong as those around 16000 Å and relatively isolated, it may also contribute to the kilonova spectra. Interestingly, there is a hint of a weak trough around 11500 Å in the HST spectrum of AT 2017gfo (Tanvir et al., 2017). If this tentative identification is tested by high-quality, time-series spectra of kilonovae detected in the future, it strengthens the identification of the Ce III lines in the NIR wavelength range.
Also, the absorption features around 9,000 Å match with the Sr II lines. Note that the velocity of the line forming region depends on the wavelengths due to the wavelength dependence of the opacity: the line forming region is located at higher velocities in optical wavelengths due to the higher optical opacity. A velocity of is more consistent with the observed feature in AT 2017gfo as also demonstrated by Watson et al. (2019). As the Sr abundances are quite different between HR 465 and kilonovae (top panel of Figure 1) and the lower levels of these Sr II lines have a relatively high excitation energy ( eV), the relative line strengths in HR 465 do not necessarily represent the relative line strengths in kilonovae.
The broad feature at 13,000 Å in the kilonova was identified as La III by Domoto et al. (2022). However, we could not test this identification with HR 465 because these lines are located in the wavelength range between the atmospheric windows in the rest wavelengths. To test this identification with stellar spectra, it is necessary to take high-resolution spectra between and bands.
5 Concluding Remarks
We demonstrate that spectra of chemically peculiar stars offer an excellent astrophysical laboratory to decode the kilonova spectra. Thanks to the enhanced trans-iron abundances and similar ionization degrees, the absorption features in chemically peculiar stars can provide the candidates of strong transitions in kilonova spectra. This is particularly true for lanthanides: their abundances in chemically peculiar stars can be remarkably similar to those in kilonovae. By using the NIR spectrum of HR 465, we show that (1) the Ce III lines give the dominant contributions to the kilonova feature around 14,500 Å at early phase, and (2) there are no other comparably strong transitions in this wavelength range even including unID lines. These facts support the Ce III identification by Domoto et al. (2022).
It should be noted that our analysis assumes LTE for ionization and excitation. In a kilonova, non-thermal ionization can be important in particular at later phases due to the presence of fast electrons from radioactive decays. Under such conditions, lanthanides are expected to stay at singly ionized or doubly ionized states (Hotokezaka et al., 2021; Pognan et al., 2022). This may explain the presence of the broad absorption feature around 14,500 Å even at later phases: the ionization degrees do not significantly evolve with time, and the same Ce III lines can keep contributing to the spectra. To test this possibility, detailed calculations are required by taking non-thermal ionization into account. Also, both kilonovae and stellar atmospheres have density and temperature gradients. In particular, the density structure is shallower in a kilonova, and different regions may contribute to the spectrum. Thus, analysis with more realistic density structures is necessary to fully confirm the similarity between kilonovae and stellar atmospheres.
Another caveat is that the abundance ratios of HR 465 are not identical to those in the kilonova ejecta. While the lanthanide fractions are quite similar as shown in Figure 1 (top panel), the elements with are less abundant in HR 465. Strong NIR transitions are expected to be dominated by lanthanides (and actinides) due to their low-lying, dense energy levels (Domoto et al., 2022). Thus, we consider that it is less likely that many lighter elements can contribute to the strong NIR transitions. Nevertheless, it is worth investigating the NIR transitions for various elements in actual stars by obtaining high-resolution NIR spectra for more chemically peculiar stars with different abundance enhancements as well as different stellar types (temperature and density). Such data will provide us with clues to decode kilonova spectra with different abundances at various epochs.
References
- Abbott et al. (2017) Abbott, B. P., Abbott, R., Abbott, T. D., et al. 2017, ApJ, 848, L12, doi: 10.3847/2041-8213/aa91c9
- Aller (1972) Aller, M. F. 1972, A&A, 19, 248
- Aoki et al. (2022) Aoki, W., Beers, T. C., Honda, S., et al. 2022, PASJ, 74, 273, doi: 10.1093/pasj/psab123
- Asplund et al. (2009) Asplund, M., Grevesse, N., Sauval, A. J., & Scott, P. 2009, ARA&A, 47, 481, doi: 10.1146/annurev.astro.46.060407.145222
- Castelli & Kurucz (2003) Castelli, F., & Kurucz, R. L. 2003, in Modelling of Stellar Atmospheres, ed. N. Piskunov, W. W. Weiss, & D. F. Gray, Vol. 210, A20, doi: 10.48550/arXiv.astro-ph/0405087
- Chornock et al. (2017) Chornock, R., Berger, E., Kasen, D., et al. 2017, ApJ, 848, L19, doi: 10.3847/2041-8213/aa905c
- Cowley & Greenberg (1987) Cowley, C. R., & Greenberg, M. 1987, PASP, 99, 1201, doi: 10.1086/132104
- Domoto et al. (2022) Domoto, N., Tanaka, M., Kato, D., et al. 2022, ApJ, 939, 8, doi: 10.3847/1538-4357/ac8c36
- Domoto et al. (2021) Domoto, N., Tanaka, M., Wanajo, S., & Kawaguchi, K. 2021, ApJ, 913, 26, doi: 10.3847/1538-4357/abf358
- Fontes et al. (2020) Fontes, C. J., Fryer, C. L., Hungerford, A. L., Wollaeger, R. T., & Korobkin, O. 2020, MNRAS, 493, 4143, doi: 10.1093/mnras/staa485
- Ghazaryan et al. (2018) Ghazaryan, S., Alecian, G., & Hakobyan, A. A. 2018, MNRAS, 480, 2953, doi: 10.1093/mnras/sty1912
- Gillanders et al. (2022) Gillanders, J. H., Smartt, S. J., Sim, S. A., Bauswein, A., & Goriely, S. 2022, MNRAS, 515, 631, doi: 10.1093/mnras/stac1258
- Honda et al. (2006) Honda, S., Aoki, W., Ishimaru, Y., Wanajo, S., & Ryan, S. G. 2006, ApJ, 643, 1180, doi: 10.1086/503195
- Hotokezaka et al. (2021) Hotokezaka, K., Tanaka, M., Kato, D., & Gaigalas, G. 2021, MNRAS, 506, 5863, doi: 10.1093/mnras/stab1975
- Kasen et al. (2013) Kasen, D., Badnell, N. R., & Barnes, J. 2013, ApJ, 774, 25, doi: 10.1088/0004-637X/774/1/25
- Kasen et al. (2017) Kasen, D., Metzger, B., Barnes, J., Quataert, E., & Ramirez-Ruiz, E. 2017, Nature, 551, 80, doi: 10.1038/nature24453
- Kawaguchi et al. (2018) Kawaguchi, K., Shibata, M., & Tanaka, M. 2018, ApJ, 865, L21, doi: 10.3847/2041-8213/aade02
- Kotani et al. (2018) Kotani, T., Tamura, M., Nishikawa, J., et al. 2018, in Society of Photo-Optical Instrumentation Engineers (SPIE) Conference Series, Vol. 10702, Ground-based and Airborne Instrumentation for Astronomy VII, ed. C. J. Evans, L. Simard, & H. Takami, 1070211, doi: 10.1117/12.2311836
- Kupka et al. (1999) Kupka, F., Piskunov, N., Ryabchikova, T. A., Stempels, H. C., & Weiss, W. W. 1999, A&AS, 138, 119, doi: 10.1051/aas:1999267
- Li & Paczyński (1998) Li, L.-X., & Paczyński, B. 1998, ApJ, 507, L59, doi: 10.1086/311680
- Metzger et al. (2010) Metzger, B. D., Martínez-Pinedo, G., Darbha, S., et al. 2010, MNRAS, 406, 2650, doi: 10.1111/j.1365-2966.2010.16864.x
- Michaud (1970) Michaud, G. 1970, ApJ, 160, 641, doi: 10.1086/150459
- Nielsen et al. (2020) Nielsen, K. E., Carpenter, K. G., Kober, G. V., & Wahlgren, G. M. 2020, ApJ, 899, 166, doi: 10.3847/1538-4357/aba361
- Perego et al. (2017) Perego, A., Radice, D., & Bernuzzi, S. 2017, ApJ, 850, L37, doi: 10.3847/2041-8213/aa9ab9
- Perego et al. (2022) Perego, A., Vescovi, D., Fiore, A., et al. 2022, ApJ, 925, 22, doi: 10.3847/1538-4357/ac3751
- Pian et al. (2017) Pian, E., D’Avanzo, P., Benetti, S., et al. 2017, Nature, 551, 67, doi: 10.1038/nature24298
- Pognan et al. (2022) Pognan, Q., Jerkstrand, A., & Grumer, J. 2022, MNRAS, 513, 5174, doi: 10.1093/mnras/stac1253
- Preston & Wolff (1970) Preston, G. W., & Wolff, S. C. 1970, ApJ, 160, 1071, doi: 10.1086/150494
- Pyper & Adelman (2017) Pyper, D. M., & Adelman, S. J. 2017, PASP, 129, 104203, doi: 10.1088/1538-3873/aa7c9e
- Rice (1988) Rice, J. B. 1988, A&A, 199, 299
- Rosswog et al. (2018) Rosswog, S., Sollerman, J., Feindt, U., et al. 2018, A&A, 615, A132, doi: 10.1051/0004-6361/201732117
- Smartt et al. (2017) Smartt, S. J., Chen, T.-W., Jerkstrand, A., et al. 2017, Nature, 551, 75, doi: 10.1038/nature24303
- Sneppen et al. (2023) Sneppen, A., Watson, D., Bauswein, A., et al. 2023, Nature, 614, 436, doi: 10.1038/s41586-022-05616-x
- Tamura et al. (2012) Tamura, M., Suto, H., Nishikawa, J., et al. 2012, in Society of Photo-Optical Instrumentation Engineers (SPIE) Conference Series, Vol. 8446, Ground-based and Airborne Instrumentation for Astronomy IV, ed. I. S. McLean, S. K. Ramsay, & H. Takami, 84461T, doi: 10.1117/12.925885
- Tanaka & Hotokezaka (2013) Tanaka, M., & Hotokezaka, K. 2013, ApJ, 775, 113, doi: 10.1088/0004-637X/775/2/113
- Tanaka et al. (2020) Tanaka, M., Kato, D., Gaigalas, G., & Kawaguchi, K. 2020, MNRAS, 496, 1369, doi: 10.1093/mnras/staa1576
- Tanaka et al. (2017) Tanaka, M., Utsumi, Y., Mazzali, P. A., et al. 2017, PASJ, 69, 102, doi: 10.1093/pasj/psx121
- Tanvir et al. (2017) Tanvir, N. R., Levan, A. J., González-Fernández, C., et al. 2017, ApJ, 848, L27, doi: 10.3847/2041-8213/aa90b6
- Tarumi et al. (2023) Tarumi, Y., Hotokezaka, K., Domoto, N., & Tanaka, M. 2023, arXiv e-prints, arXiv:2302.13061, doi: 10.48550/arXiv.2302.13061
- Wanajo (2018) Wanajo, S. 2018, ApJ, 868, 65, doi: 10.3847/1538-4357/aae0f2
- Watson et al. (2019) Watson, D., Hansen, C. J., Selsing, J., et al. 2019, Nature, 574, 497, doi: 10.1038/s41586-019-1676-3