JADES: The production and escape of ionizing photons from faint Lyman-alpha emitters in the epoch of reionization
We present the properties of 16 faint Lyman- emitting galaxies (LAEs) at from the JWST Advanced Deep Extragalactic Survey (JADES) spectroscopic data in the Hubble Ultra Deep Field/GOODS-S. These LAEs span a redshift range and UV magnitude range to , with Ly equivalent width (EW) in the range Å. The detection of other rest-optical emission lines in the spectra of these LAEs enables the determination of accurate systemic redshifts and Ly velocity offsets, as well as the physical and chemical composition of their stars and interstellar media. These faint LAEs are consistent with metal-poor systems with high ionization parameters, similar to the general galaxy population at . We measure an average ionizing photon production efficiency, log(/erg-1 Hz) across our LAEs, which does not evolve strongly with redshift. We report an anti-correlation between Ly escape fraction and velocity offset from systemic, consistent with model expectations. We further find that the strength and velocity offset of Ly are not correlated with galaxy spectroscopic properties nor with . We find a decrease in Ly escape fractions with redshift, indicative of decreasing sizes of ionized bubbles around LAEs at high redshifts. We use a range of galaxy properties to predict Lyman continuum escape fractions for our LAEs, finding that the ionizing photon output into the intergalactic medium from our LAEs remains roughly constant across the observed UV magnitude and Ly equivalent width, showing a mild increase with redshift. We derive correlations between the ionizing photon output from LAEs and UV magnitude Ly strengths and redshift, which can be used to build realistic, observationally-driven reionization models.
Key Words.:
(Cosmology:) dark ages, reionization, first stars – Galaxies: high-redshift – Galaxies: evolution – Galaxies: star formation1 Introduction
Cosmic reionization is a crucial phase transition in the Universe’s history, the understanding of which is an important challenge in observational astronomy (see recent review by Robertson, 2022). The emergence of ionizing UV photons from the first structures to form in the Universe began interacting with the neutral intergalactic medium (IGM), gradually ionizing it to near completion by (e.g. Fan et al., 2006), although certain studies have favoured a later end to reionization (e.g. Weinberger et al., 2019; Keating et al., 2020; Bosman et al., 2022). To quantify the contribution towards the cosmic reionization budget from ionizing photon sources in the early Universe, a good understanding is needed of the space density of sources, the efficiency of hydrogen ionizing Lyman continuum (LyC; Å) photon production, and crucially, the fraction of LyC photons that manage to escape into the IGM (e.g. Dayal & Ferrara, 2018).
JWST spectroscopy has offered ground-breaking insights into the state of the interstellar medium (ISM), chemical enrichment of the gas and stars as well as ionizing photon production in galaxies at , pushing towards fainter UV magnitudes than were previously possible from the ground (Arellano-Córdova et al., 2022; Endsley et al., 2022b; Tacchella et al., 2022; Trump et al., 2022; Sun et al., 2022; Cameron et al., 2023; Curtis-Lake et al., 2023; Curti et al., 2023; Fujimoto et al., 2023; Katz et al., 2023a; Robertson et al., 2023; Sanders et al., 2023). However, accurately measuring the escape fraction of LyC photons () becomes hard already at mainly due to the increasing neutrality of the IGM (e.g. Inoue et al., 2014), which efficiently absorbs LyC photons along the line of sight. A further complication is introduced by the fact that no clear dependence between (LyC) and galaxy properties has been observationally established (e.g. Naidu et al., 2018; Fletcher et al., 2019; Nakajima et al., 2020; Pahl et al., 2021; Saxena et al., 2022b)
Therefore, in order to constrain the all-important escape fraction of ionizing photons from reionization era galaxies, it is of utmost importance to find reliable indirect indicators of (LyC). The presence of young, actively forming stars as well as relatively gas and dust-free environments is thought to enable significant (LyC) from galaxies (e.g. Zackrisson et al., 2013), and spectroscopic and/or photometric indicators probing such conditions can be explored as indirect indicators of LyC photon escape (e.g. Flury et al., 2022a, b; Topping et al., 2022; Mascia et al., 2023). Important insights can also be gained from high-resolution simulations of reionization-era galaxies, where a good handle on the escaping LyC radiation can be correlated with prevalent galaxy conditions (e.g. Barrow et al., 2020; Maji et al., 2022) that can then be converted into observables (e.g. Choustikov et al., 2023) and used to predict from galaxies.
Uniquely, galaxies at that show strong Ly\textalpha emission in their spectra (typically EW(Ly\textalpha) Å; e.g. Ajiki et al. 2003), also known as Ly\textalpha emitters (or LAEs) can be excellent probes of studying how reionization unfolds over redshifts. The presence of strong Ly\textalpha emission at often traces the existence of large ionized bubbles in an otherwise neutral IGM (Miralda-Escudé 1998; Furlanetto et al. 2006; Roberts-Borsani et al. 2016; Castellano et al. 2022; Trapp et al. 2022; Tang et al. 2023; Jung et al. 2023; Saxena et al. 2023, c.f. Bunker et al. 2023), offering direct observational insights into reionized regions of the early Universe. Further, as intrinsic Ly\textalpha luminosities are expected to increase with star-formation rates, the fraction of galaxies that appear to be strong LAEs can be an important diagnostic of the ionizing photon production capabilities of reionization era galaxies (e.g. Smith et al., 2019; Garel et al., 2021; Matthee et al., 2022) as well as the evolving state of IGM neutral fraction (e.g. Caruana et al., 2012, 2014; Stark, 2016; Pentericci et al., 2018a; Hoag et al., 2019; Kusakabe et al., 2020; Fuller et al., 2020; Jones et al., 2023).
Considerable information about the neutral gas and dust content within a galaxy can be gained by the observed strength and emission line profile of Ly\textalpha (e.g. Hayes et al., 2023). The separation between the blue and red peaks in the emission as well as the offset from systemic redshift in the absence of a double-peaked profile can be used to infer neutral gas densities (Verhamme et al., 2015; Orlitová et al., 2018) and dust (Hayes et al., 2013), although it has been shown that the neutral gas distribution may play the more dominant role in controlling Ly\textalpha escape (e.g. Atek et al., 2008). At , both the number density of LAEs (Haiman, 2002; Malhotra & Rhoads, 2006) and the shape of the Ly\textalpha line originating from star-forming galaxies residing within ionized bubbles can further be used to estimate the size of those bubbles (e.g. Mason & Gronke 2020; Hayes & Scarlata 2023, Witstok et al. submitted).
With a plethora of models available to link the observed Ly\textalpha properties to both galaxy properties and the state of the IGM at , it is imperative to expand samples of observed LAEs in the reionization era, pushing to fainter magnitudes. Probing Ly\textalpha emission from UV-faint galaxies has the added advantage of providing much tighter constraints on both bubble sizes as well as the ionized fraction of the IGM (e.g. Mason et al., 2018; Bolan et al., 2022). Importantly, Ly\textalpha emission from fainter galaxies can provide additional sightlines from which the impact of galaxy associations on the production efficiency of ionizing photons (e.g. Witten et al., 2023) and their transmission through the IGM (e.g. Trapp et al., 2022) can be studied in detail.
Perhaps most importantly, detailed studies of faint LAEs can inform our understanding of the key drivers of cosmic reionization, particularly testing whether compact star-forming galaxies are indeed contributing the bulk of ionizing photons towards the reionization budget (e.g. Robertson et al., 2015), which are often expected to produce large intrinsic Ly\textalpha luminosities (e.g. Matthee et al., 2022). LAEs that have their Ly\textalpha emission peaking close to systemic redshifts are also expected to have high LyC escape fractions (Verhamme et al., 2015; Dijkstra, 2014; Naidu et al., 2022). With signatures of hard radiation fields (Stark et al., 2015; Mainali et al., 2017; Feltre et al., 2020; Saxena et al., 2022a; Roy et al., 2023) and elevated ionizing photon production efficiencies (e.g. Matthee et al., 2017a; Harikane et al., 2018; Ning et al., 2023; Simmonds et al., 2023) measured from LAEs across redshifts, Ly\textalpha emitting galaxies in the reionization era are exciting laboratories to both test and constrain reionization models. With access to stellar and ISM properties of LAEs at high redshifts thanks to JWST, it is now finally possible to study the potential role of LAEs in driving cosmic reionization.
In an attempt to quantify the production and escape of both Ly\textalpha and LyC photons from LAEs in the reionization era, in this study we dramatically increase the number of faint LAEs detected at using exquisitely deep spectra from the JWST Advanced Deep Extragalactic Survey (JADES; Eisenstein et al. 2023). The main aim of this work is to explore the physical properties of faint LAEs in the reionization era, while also investigating the physical mechanisms within the galaxy that control the visibility of Ly\textalpha emission. We further assess the impact of an increasingly neutral IGM on the emergent Ly\textalpha emission at the highest redshifts. Finally, using all available spectroscopic and photometric information about our faint LAEs, we estimate their ionizing photon contribution towards the global reionization budget. In companion papers, we also measure the LAE fraction (Jones et al., 2023) as well as the size of ionized bubbles around our LAEs and their clustering (Witstok et al. submitted).
The layout of this paper is as follows: Section 2 describes the JWST data used in this study as well as the measurement of key spectroscopic quantities that are used in this study. Section 3 presents the chemical enrichment and ionization state inferred from the spectra of our LAEs compared with other reionization era galaxies in the literature. Section 4 explores the mechanisms within galaxies that control the escape of Ly\textalpha photons along the line of sight. Section 5 discusses the implications for the reionization of the Universe from these new LAE observations and presents quantities that would help build realistic reionization models. The main conclusions of this study are presented in Section 6.
2 Data and measurements
2.1 NIRSpec data
The JWST observations used in this study are part of JADES, which is a collaboration between the Near-Infrared Camera (NIRCam; Rieke et al. 2022) and Near-Infrared Spectrograph (NIRSpec; Ferruit et al. 2022; Jakobsen et al. 2022) Instrument Science teams with an aim of using over 750 hours of guaranteed time observations (GTO) to study the evolution of galaxies in the Great Observatories Origins Deep Survey (GOODS)-South and GOODS-North fields (Giavalisco et al., 2004). We describe the NIRSpec and NIRCam observations and data reduction steps below.
Spectroscopic data presented in this work was obtained using the Micro-Shutter Assembly (MSA; Ferruit et al. 2022) on the NIRSpec instrument on board JWST. Two ‘Tiers’ of JADES data was utilized in this study: the Deep Tier NIRSpec observations are part of the GTO program ID: 1210 (PI: Lützgendorf) and in GOODS-S centred near the Hubble Ultra Deep Field (HUDF), obtained between 22 October and 25 October 2022 over 3 visits, and the Medium Tier observations are part of GTO program 1180 (PI: Eisenstein) obtained over a larger area in GOODS-S (see Eisenstein et al., 2023, for an overview of the field layout)).
For Deep observations, the PRISM/CLEAR setup, which gives wavelength coverage in the range m with a spectral resolution of (Böker et al., 2023), and G140M/F070LP, G235M/F170LP, G395M/F290LP, and G395H/F290LP filter/grating setups were used, whereas for Medium observations all of the above but the G395H/F290LP filter/grating setup were used. For the Deep Tier, three sub-pointings were planned in the same field (although each sub-pointing had minor pointing differences), with each visit having a total of 33.613 ks of exposure in PRISM/CLEAR and 8.4 ks of exposure in each of the gratings. The Medium Tier observations were carried out in parallel to NIRCam observations, and therefore, consisted of several single pointings covering a larger sky area, with 3.8 ks of exposure time in PRISM/CLEAR and 3.1 ks of exposure time in the gratings per pointing. We note that as the sources targeted were generally high-priority targets owing to their possible high redshift nature, it was possible for one target to be covered over multiple Medium tier pointings. We refer the readers to Bunker et al. (2023) and Eisenstein et al. (2023) for further details about the observational setup, strategy and challenges.
The targets for spectroscopy were selected from existing deep HST-based catalogues as well as JADES NIRCam catalogues (Rieke & the JADES Collaboration, 2023). Candidate high redshift galaxies with photometric redshifts , identified via the classic photometric ‘drop-out’ technique (e.g. Steidel et al., 1996), whereby the Lyman break in the spectrum of a galaxy is captured in adjacent broad-band filters, were assigned higher priorities. Full details of the target selection and priority classes can be found in the accompanying paper by Bunker et al. (2023c).
The data reduction was carried out using pipelines developed by the ESA NIRSpec Science Operations Team (SOT) and the NIRSpec GTO Team (Ferruit et al. 2022, Carniani et al. in prep). Some of the main data reduction steps implemented by the pipeline are pixel-level background subtraction, pixel-to-pixel flat-field correction, absolute flux calibration, slit-loss correction, and eventually 2-dimensional (2D) and 1-dimensional (1D) spectra extraction and co-addition. In this version of the reduction, the final 1D spectra are not extracted from the 2D spectra, but result from the weighted averaging of 1D spectra from all integrations (see Curtis-Lake et al., 2023). Due to the compact size of our LAEs, slit-loss corrections were applied by modelling it as point-like source. A nominal 3-pixel extraction aperture was used to produce the co-added 1D spectra. A detailed description of the data reduction and spectral extraction methods is given in Bunker et al. (2023) (but see also Curtis-Lake et al. 2023 and Cameron et al. 2023)).
2.2 Identification of Lyman-alpha emitters
Ly\textalpha emission in the spectra of galaxies in the parent sample was identified through a combination of template fitting (Jones et al., 2023) of the R100 spectra as well as visual inspection of both the R100 and R1000 (G140M) spectra of all confirmed high-redshift galaxies in the parent sample. Using both these methods, we identified 9 candidate LAEs in Deep and 7 candidate LAEs in Medium at . We then measure the Ly\textalpha line flux by fitting a single Gaussian function to the emission in both R100 and R1000 spectra.
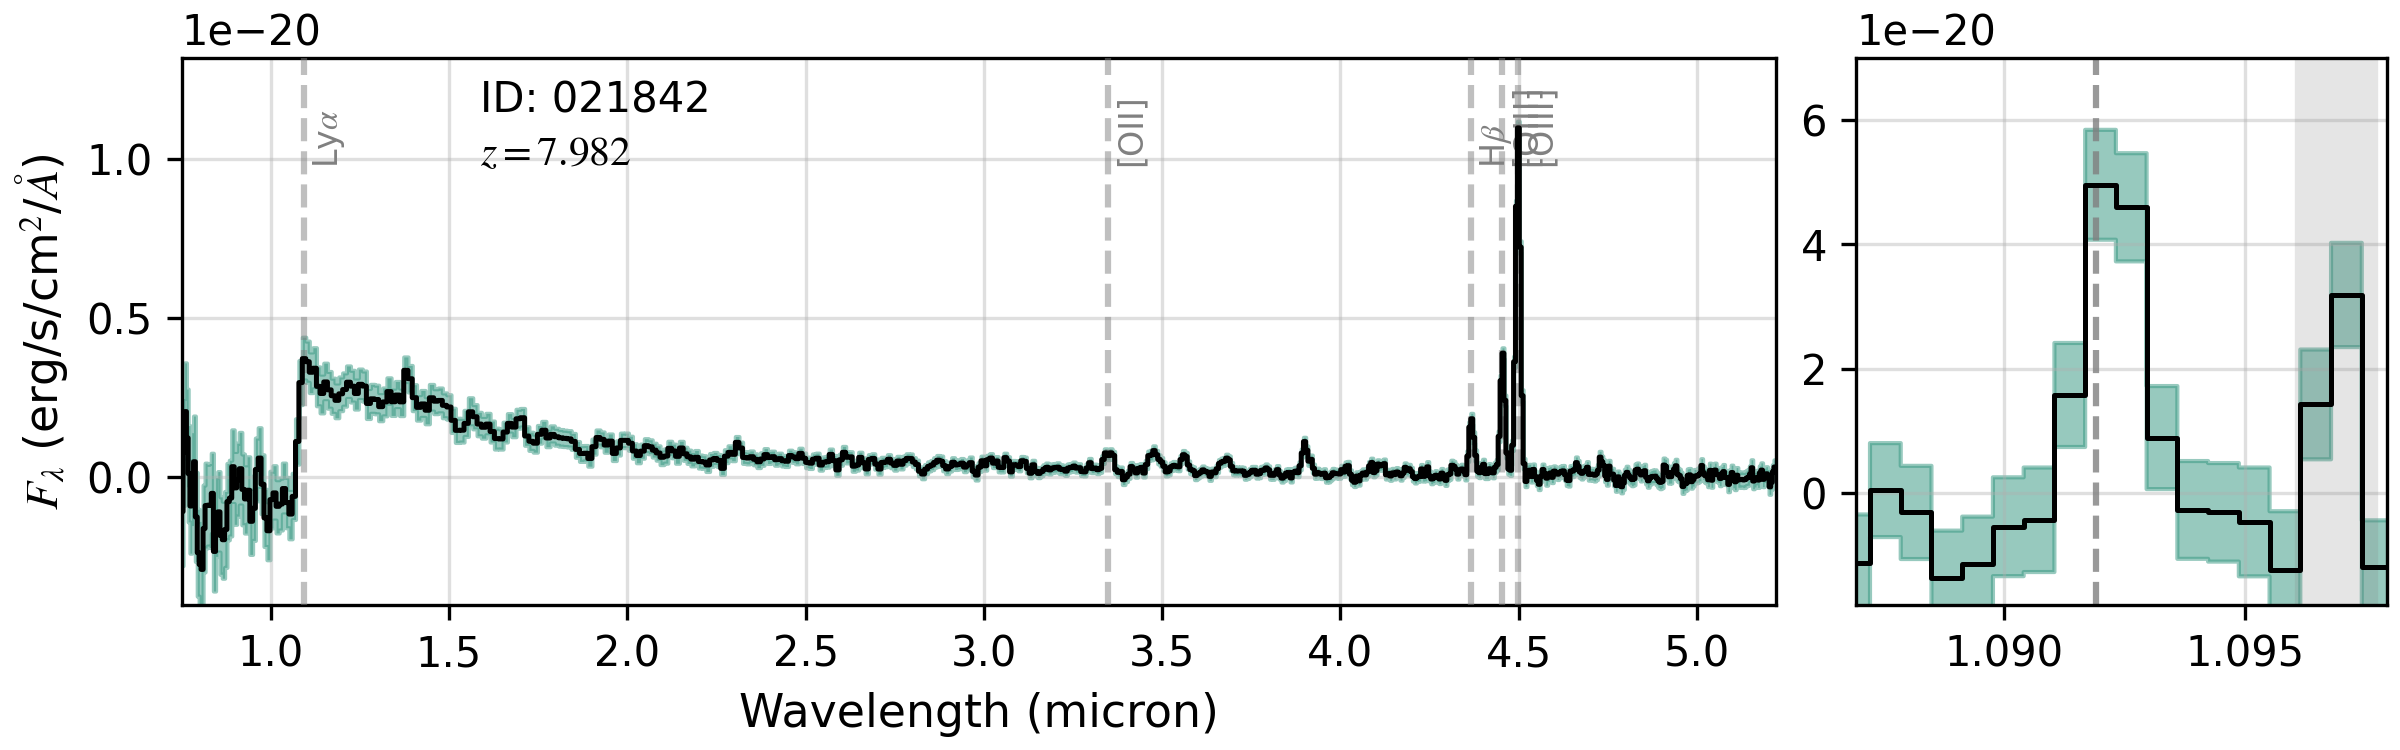
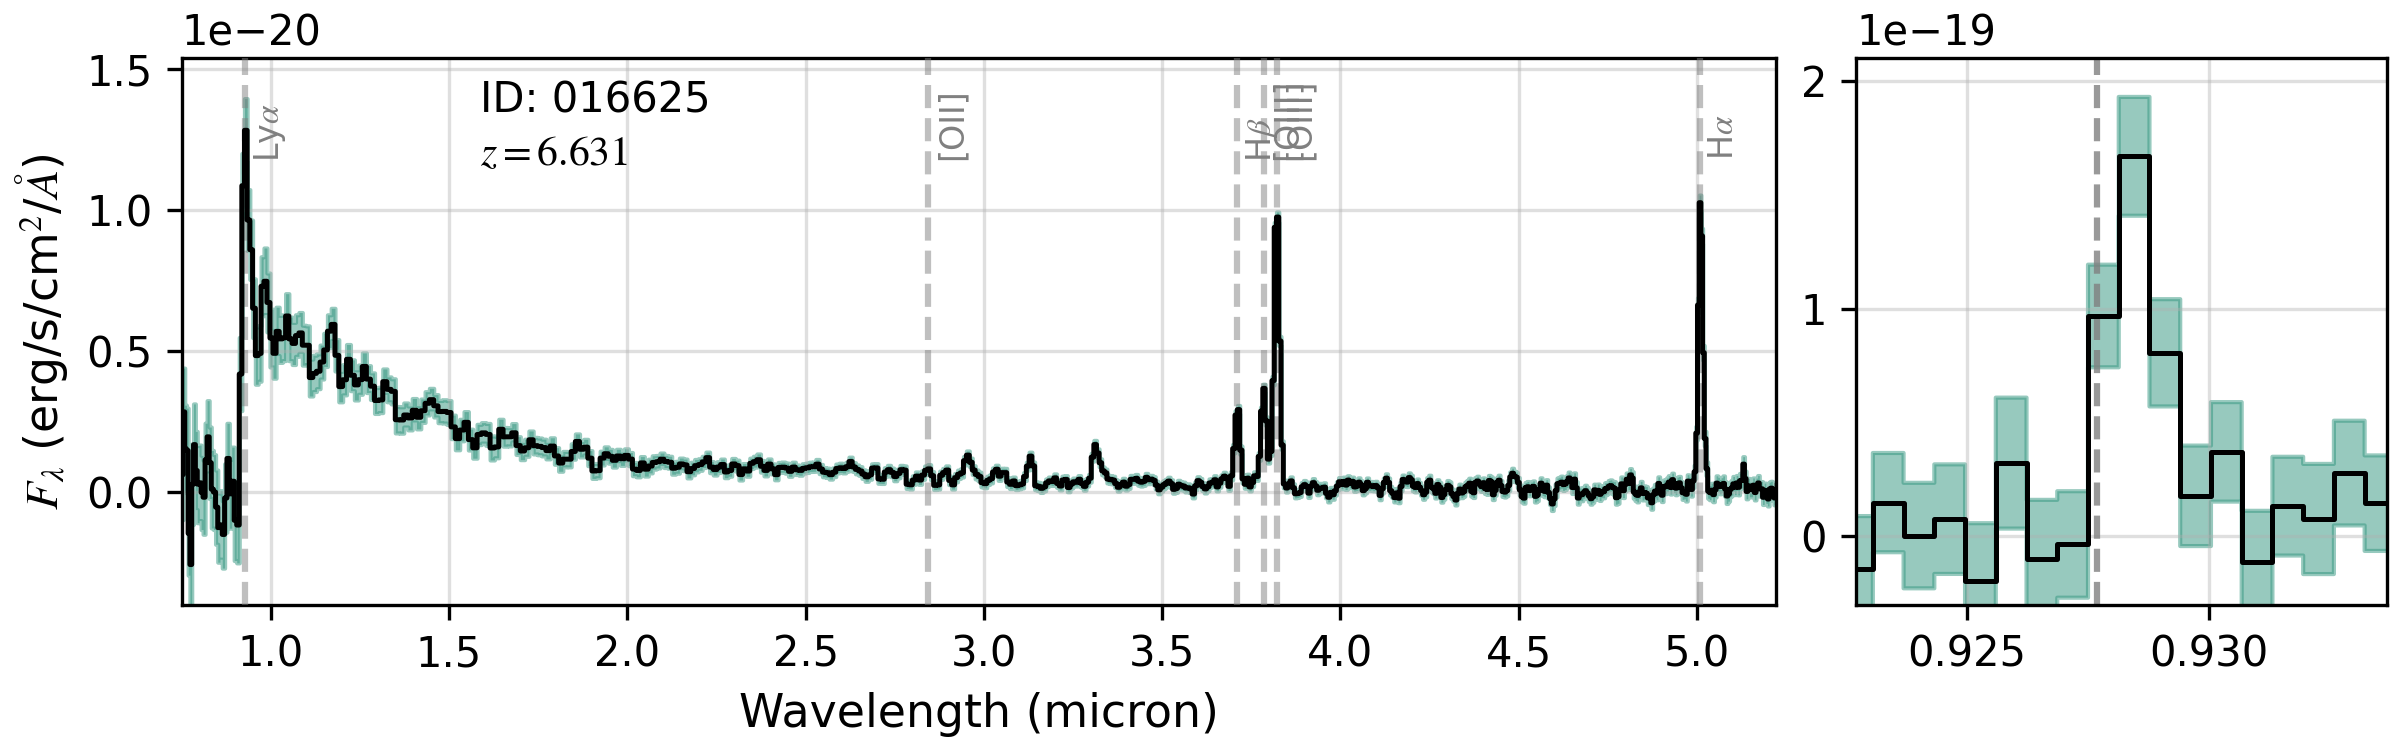
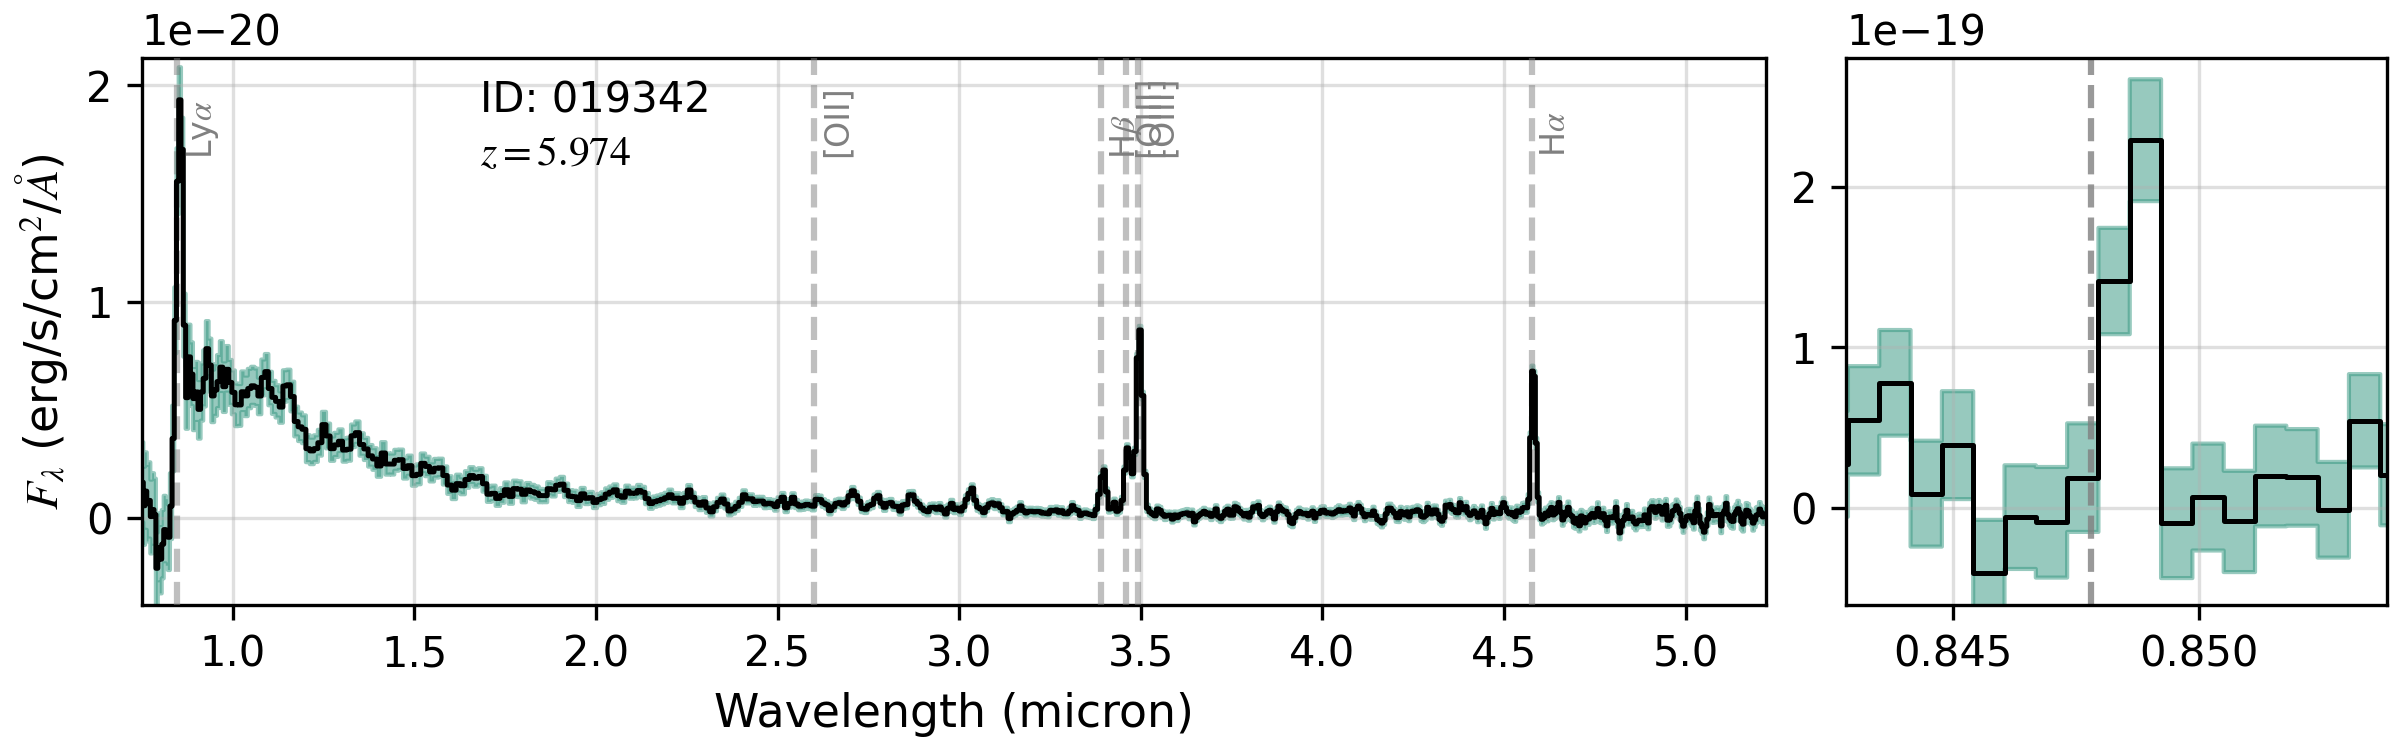
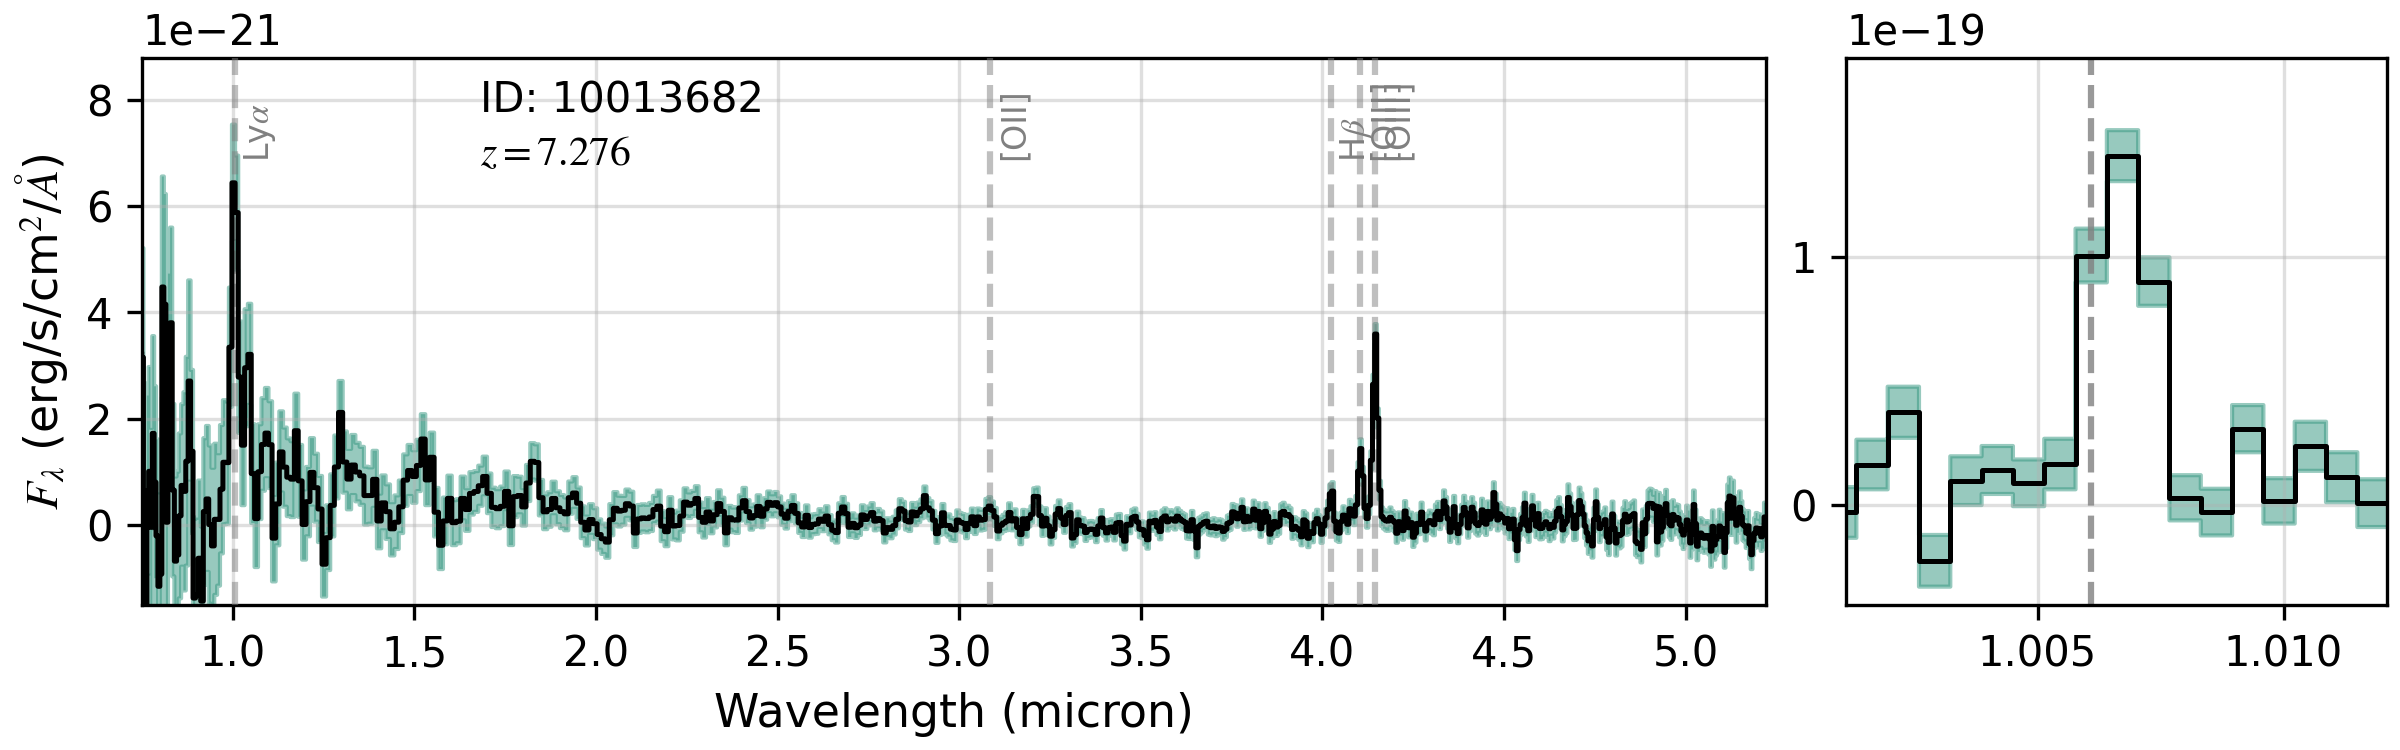
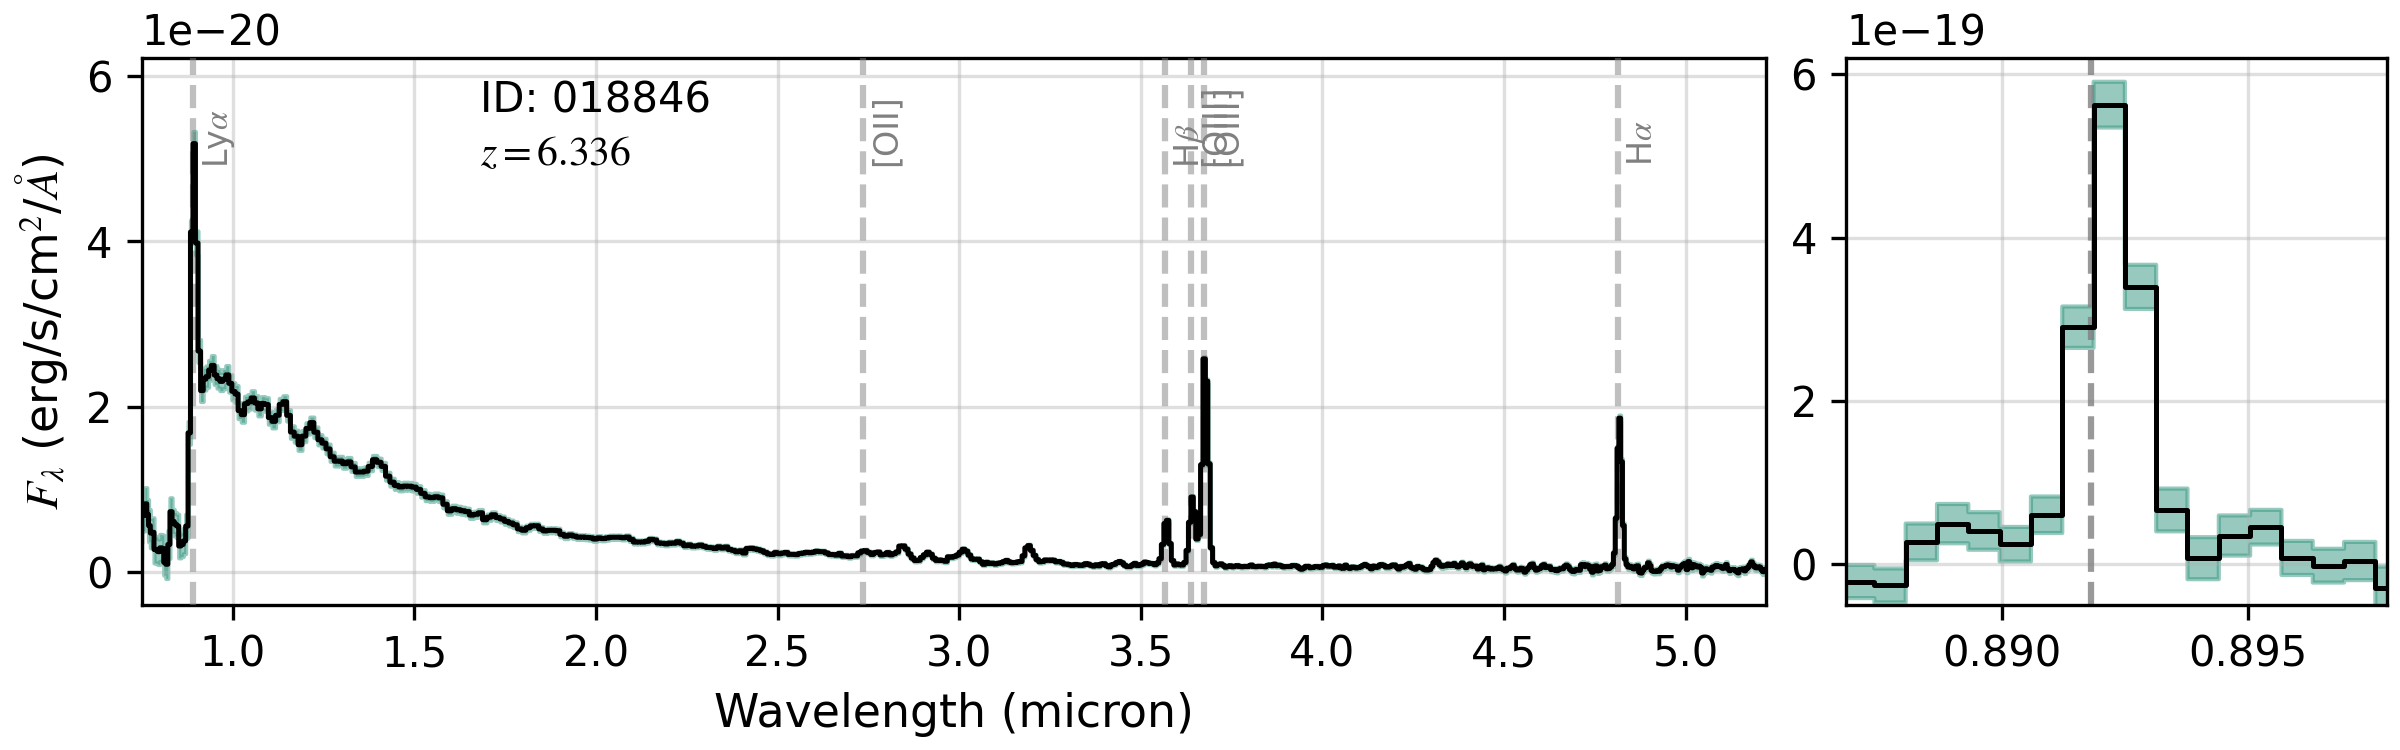
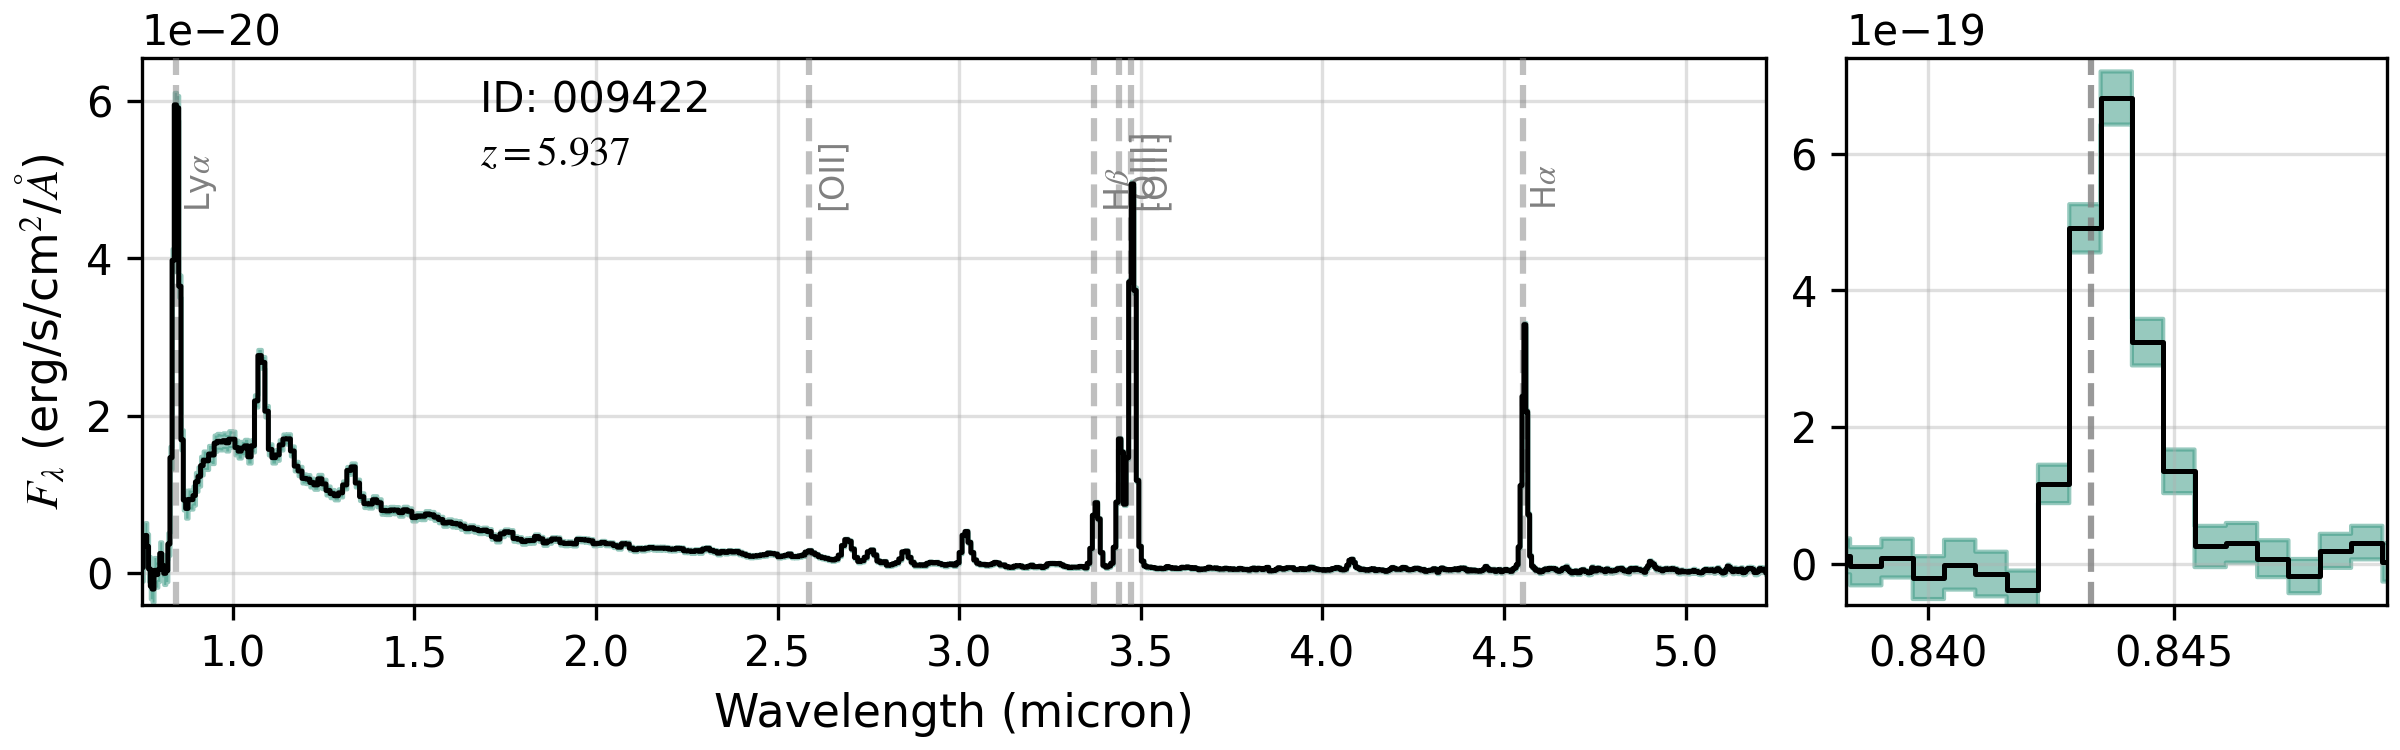
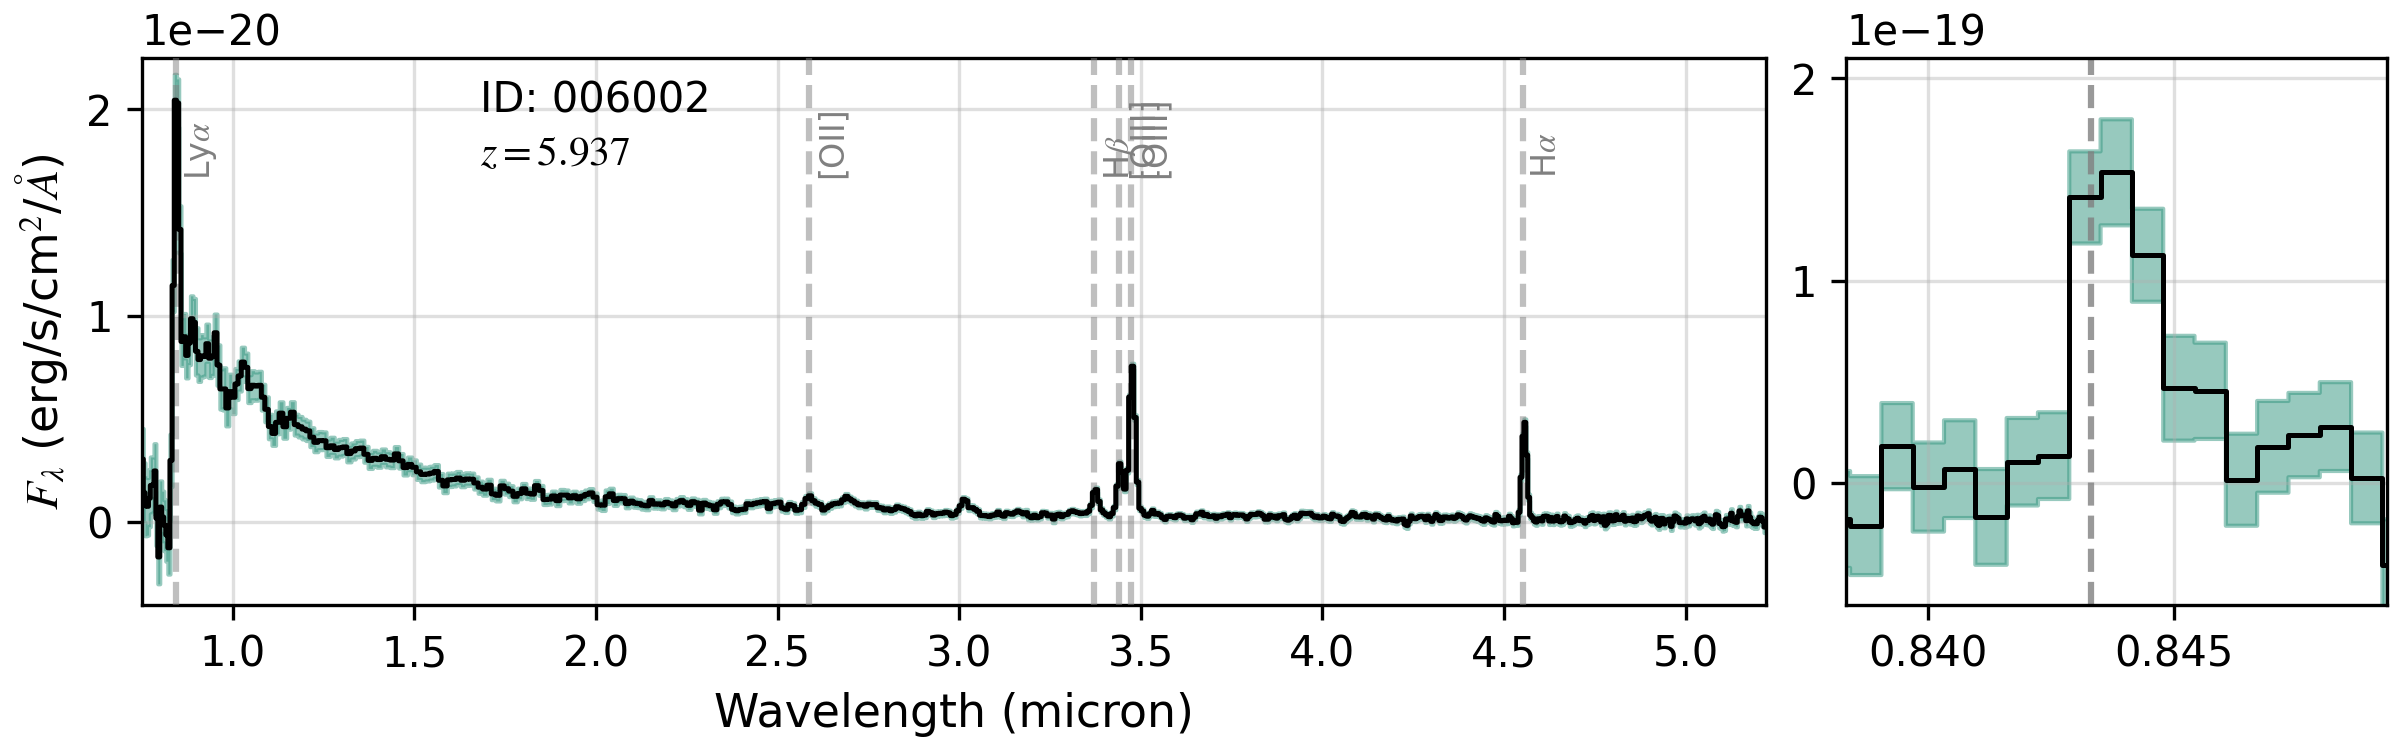
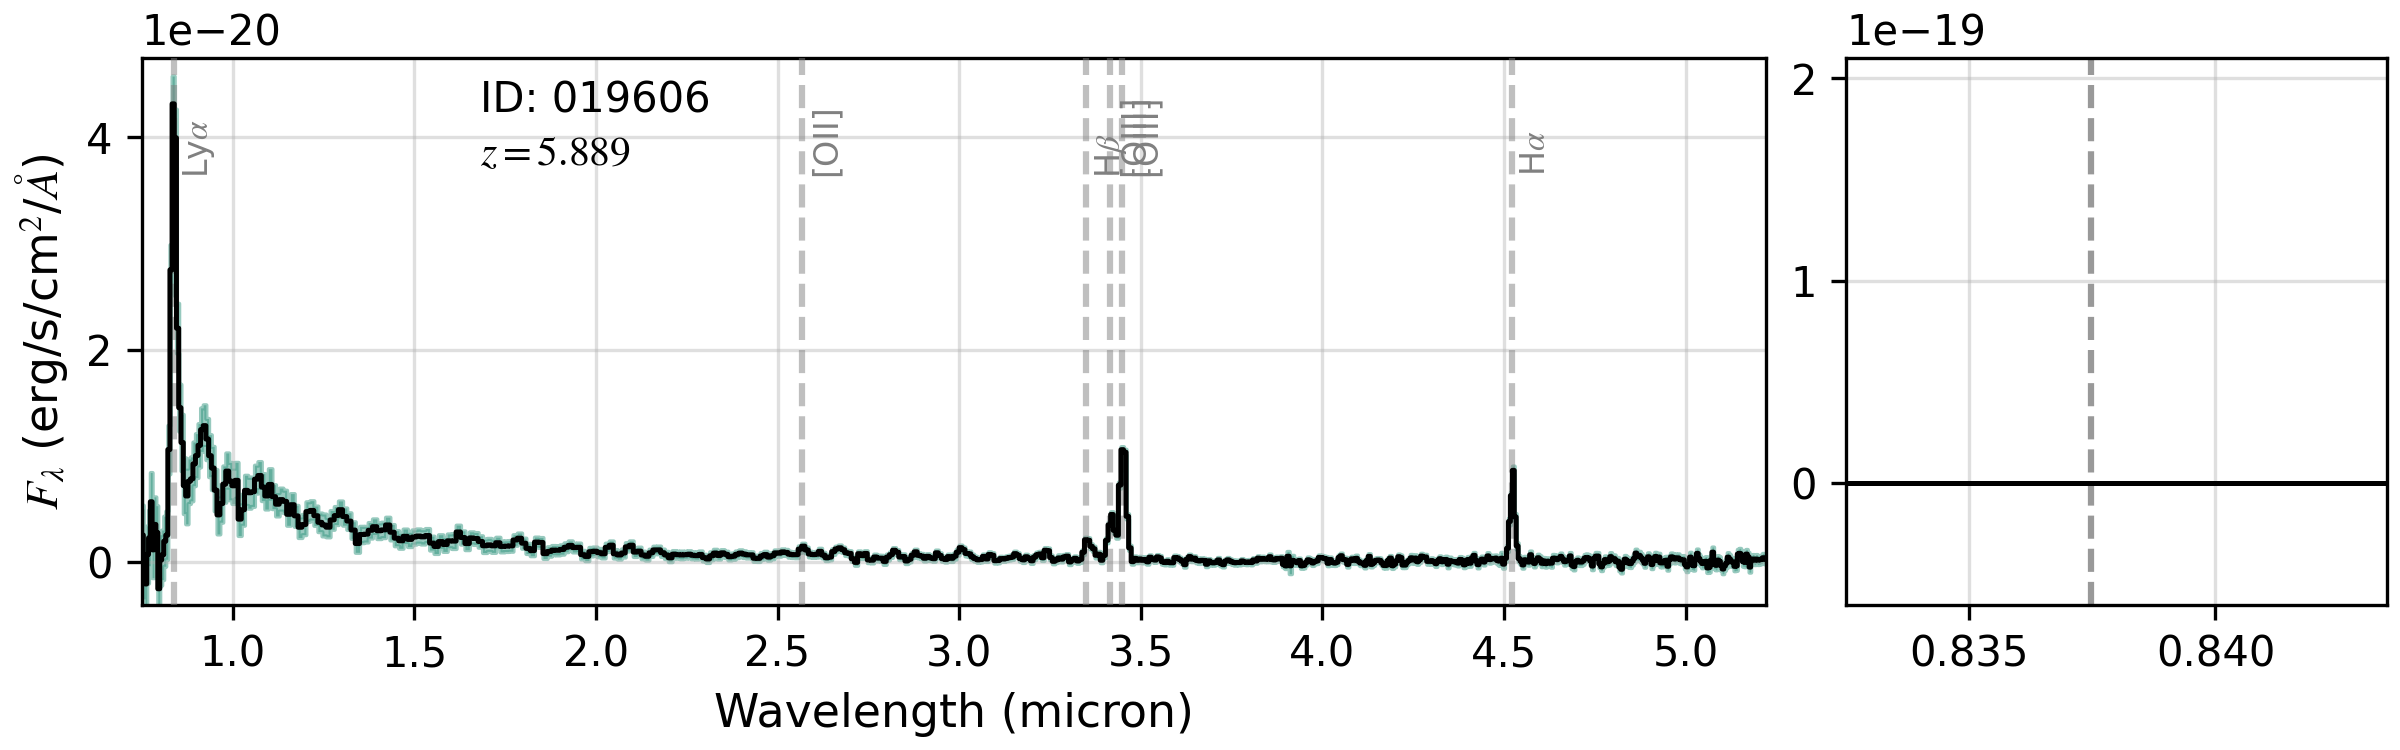
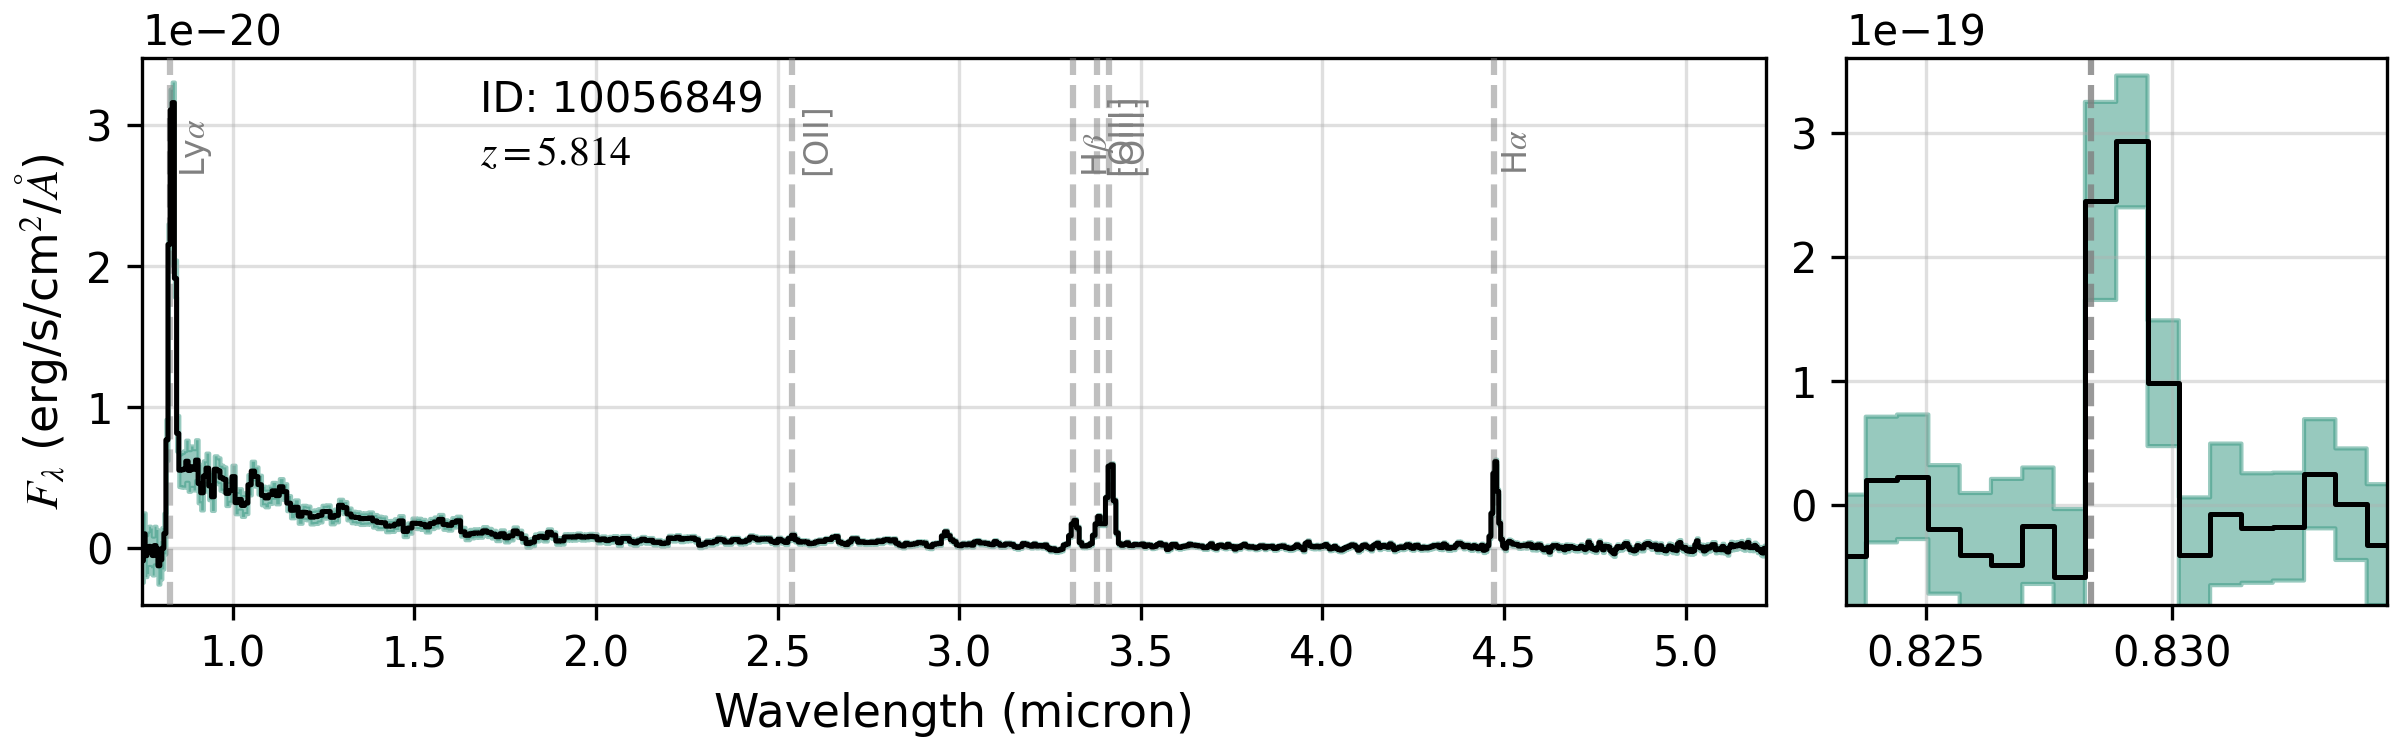
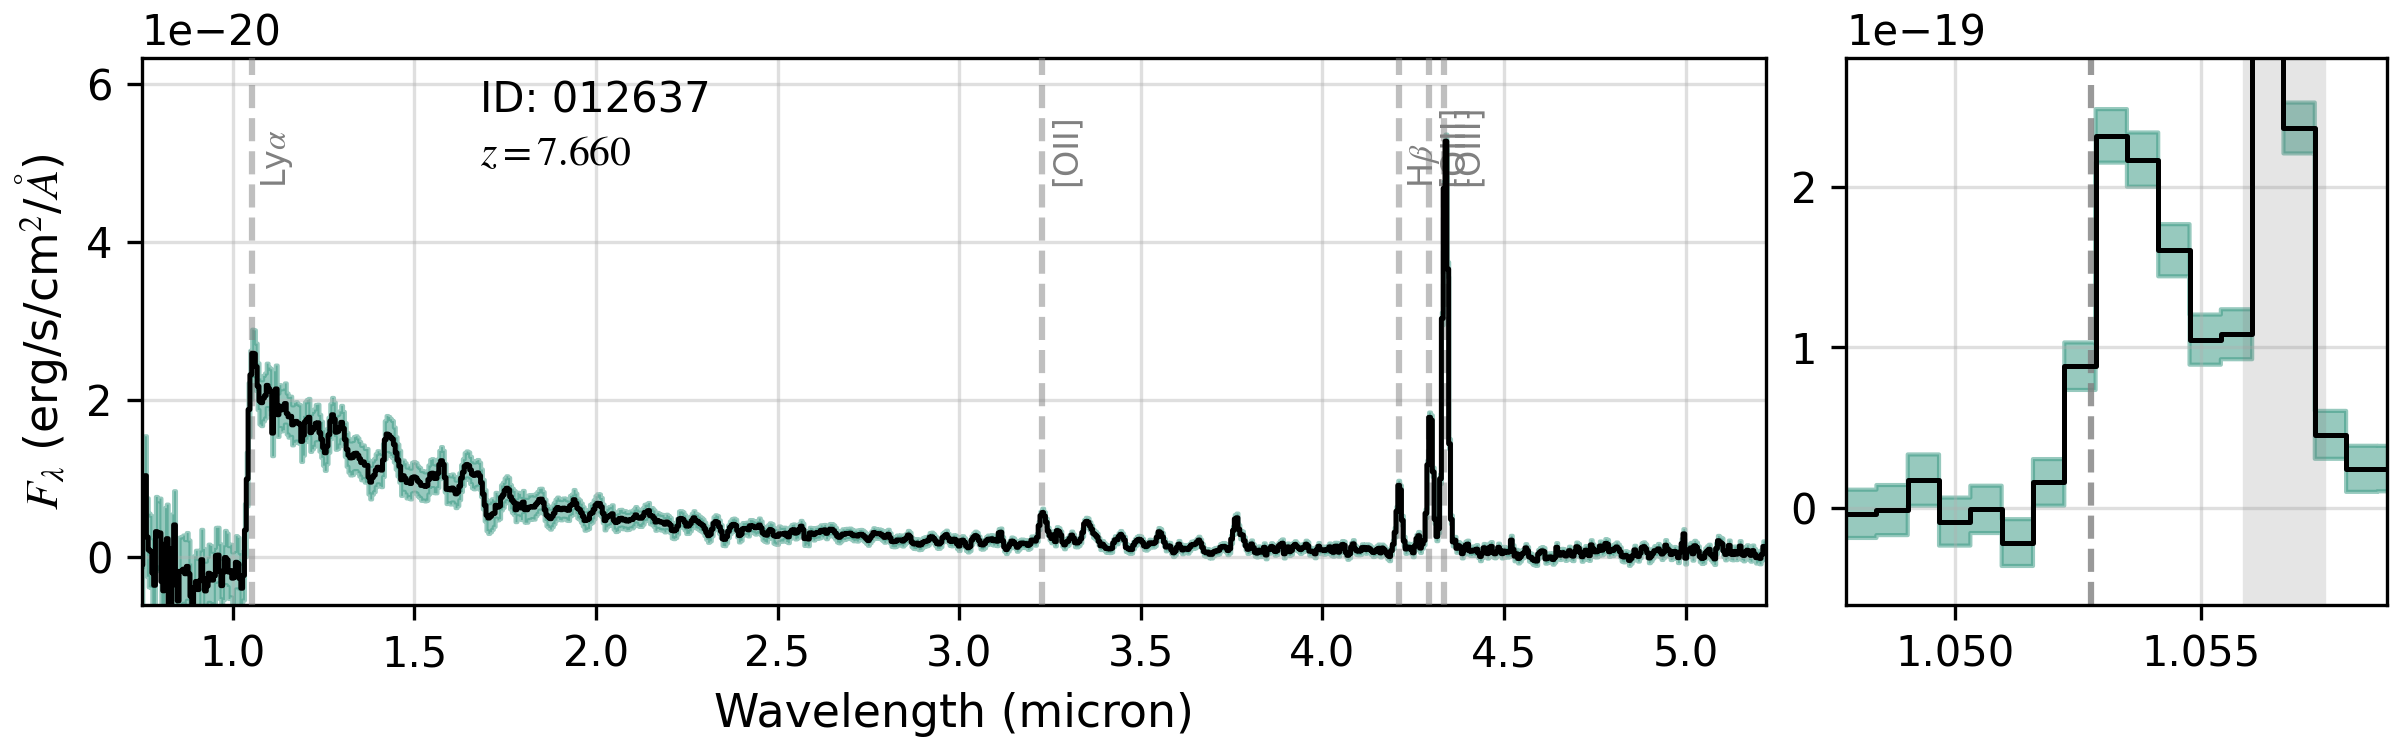
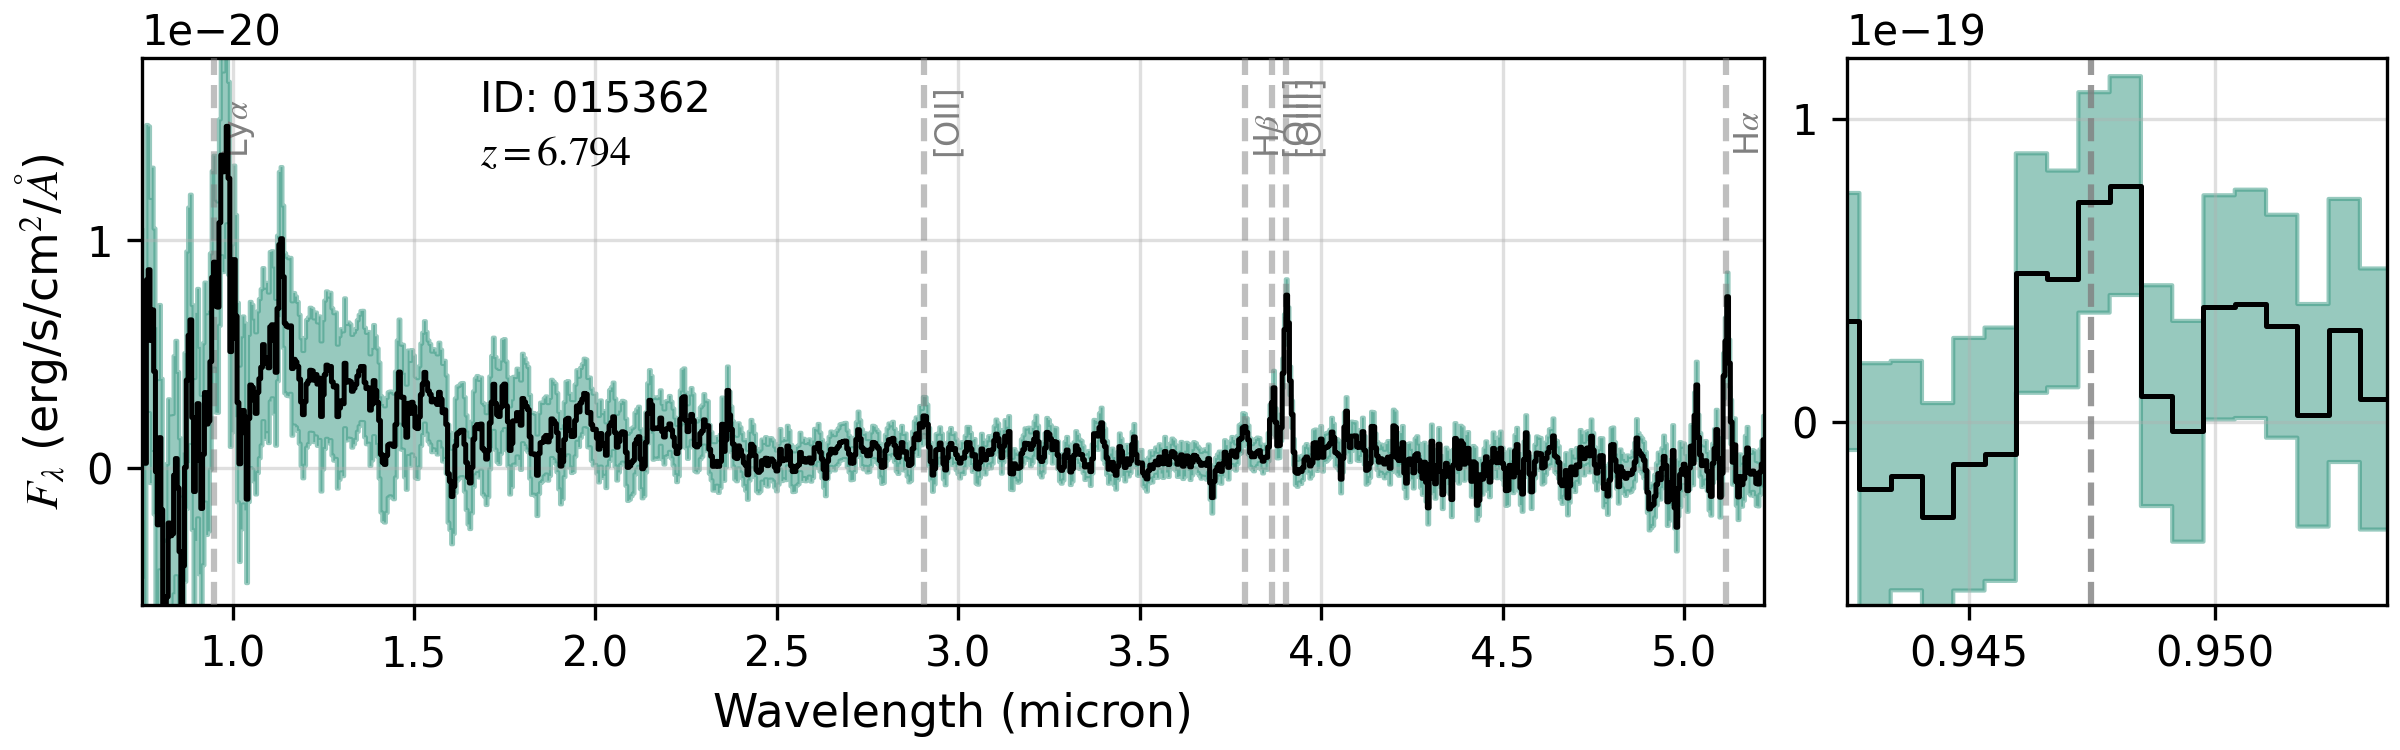
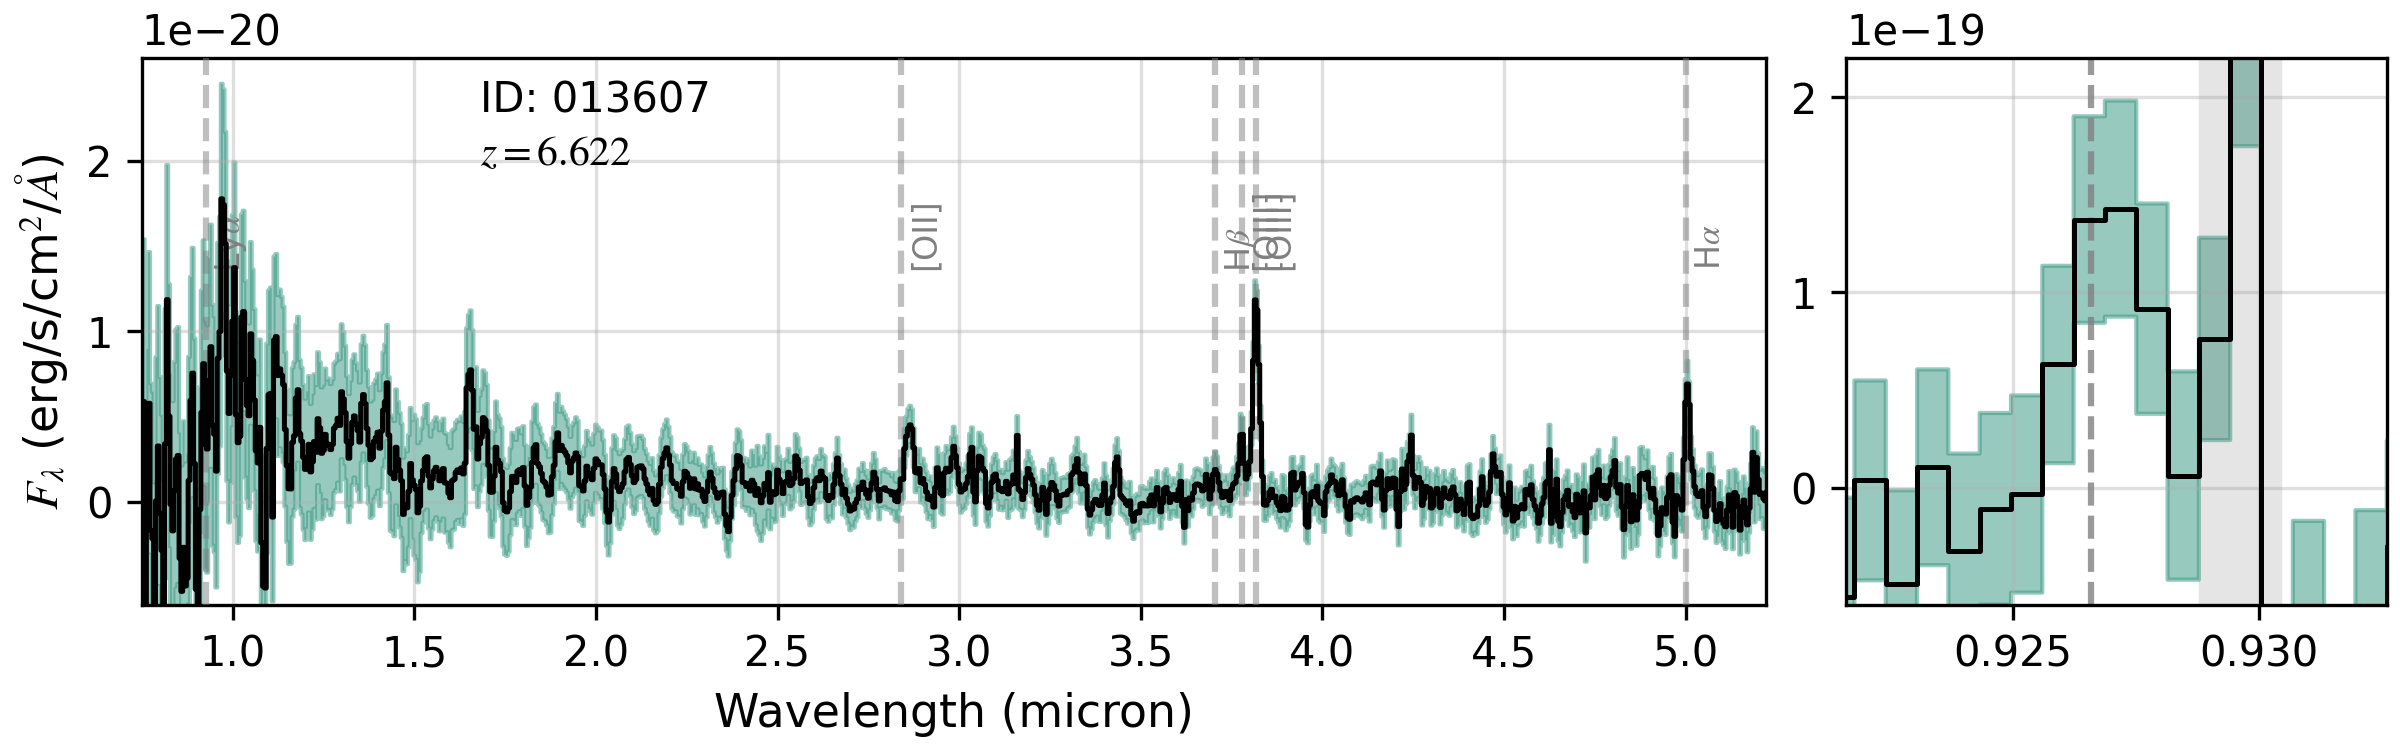
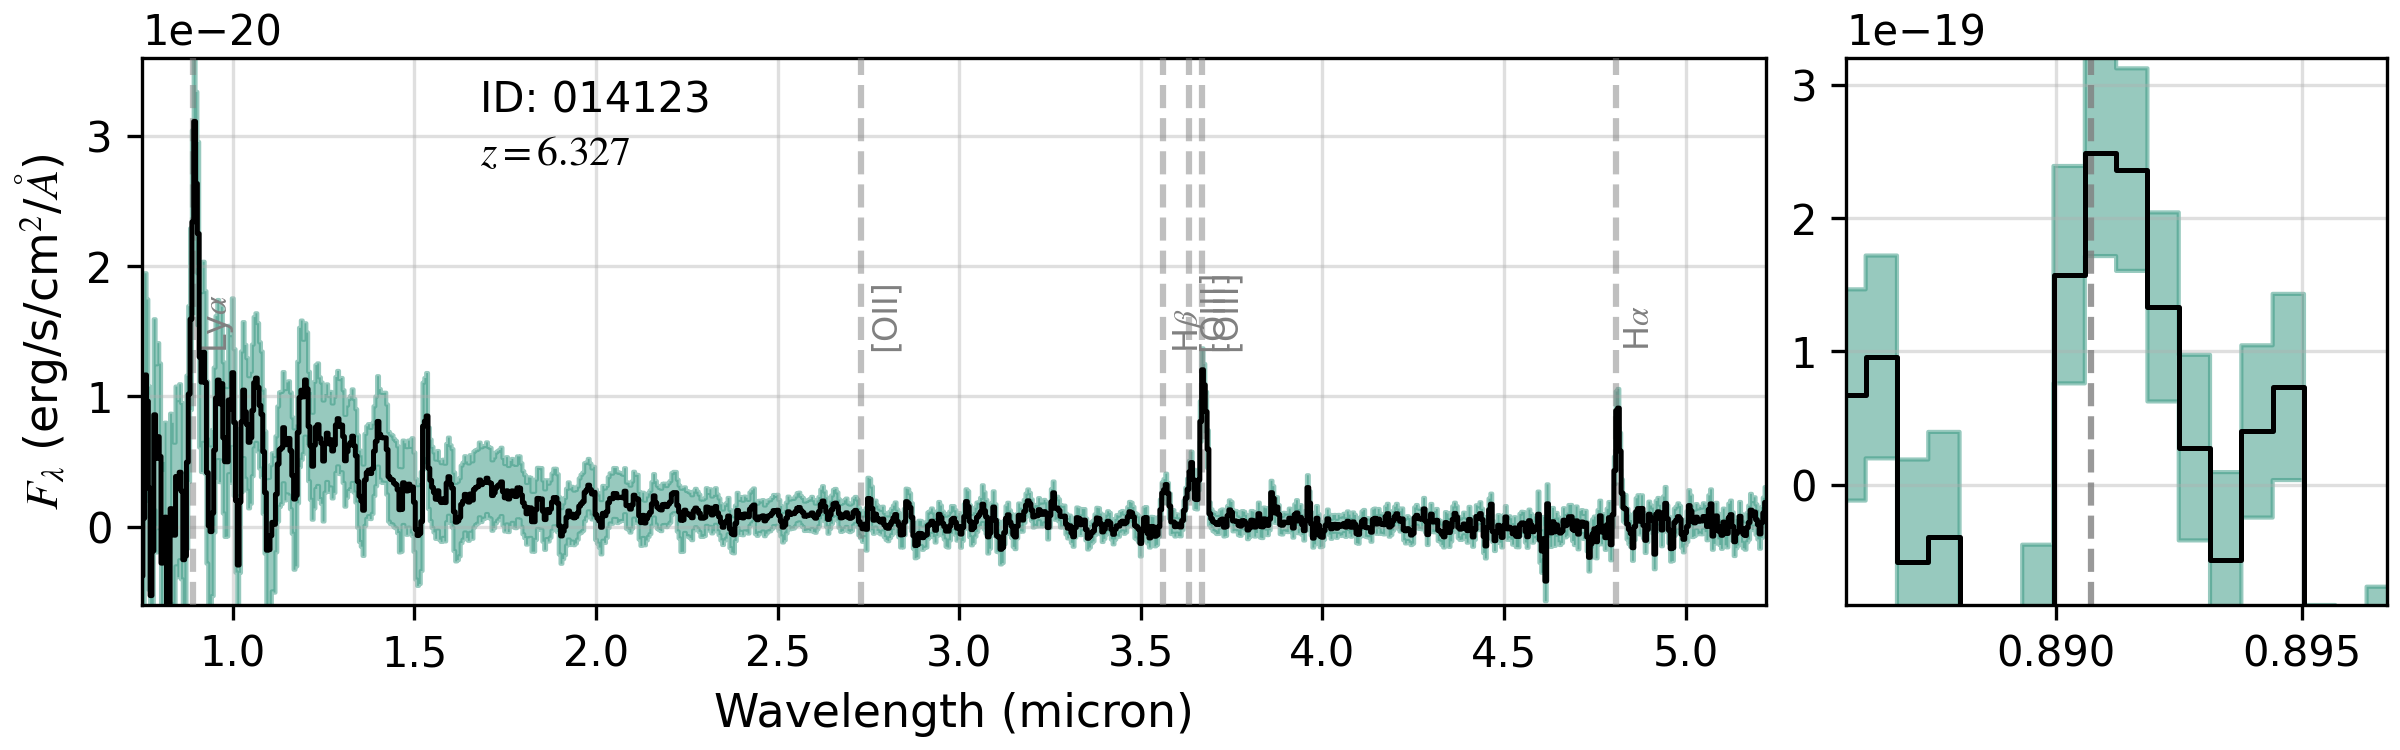
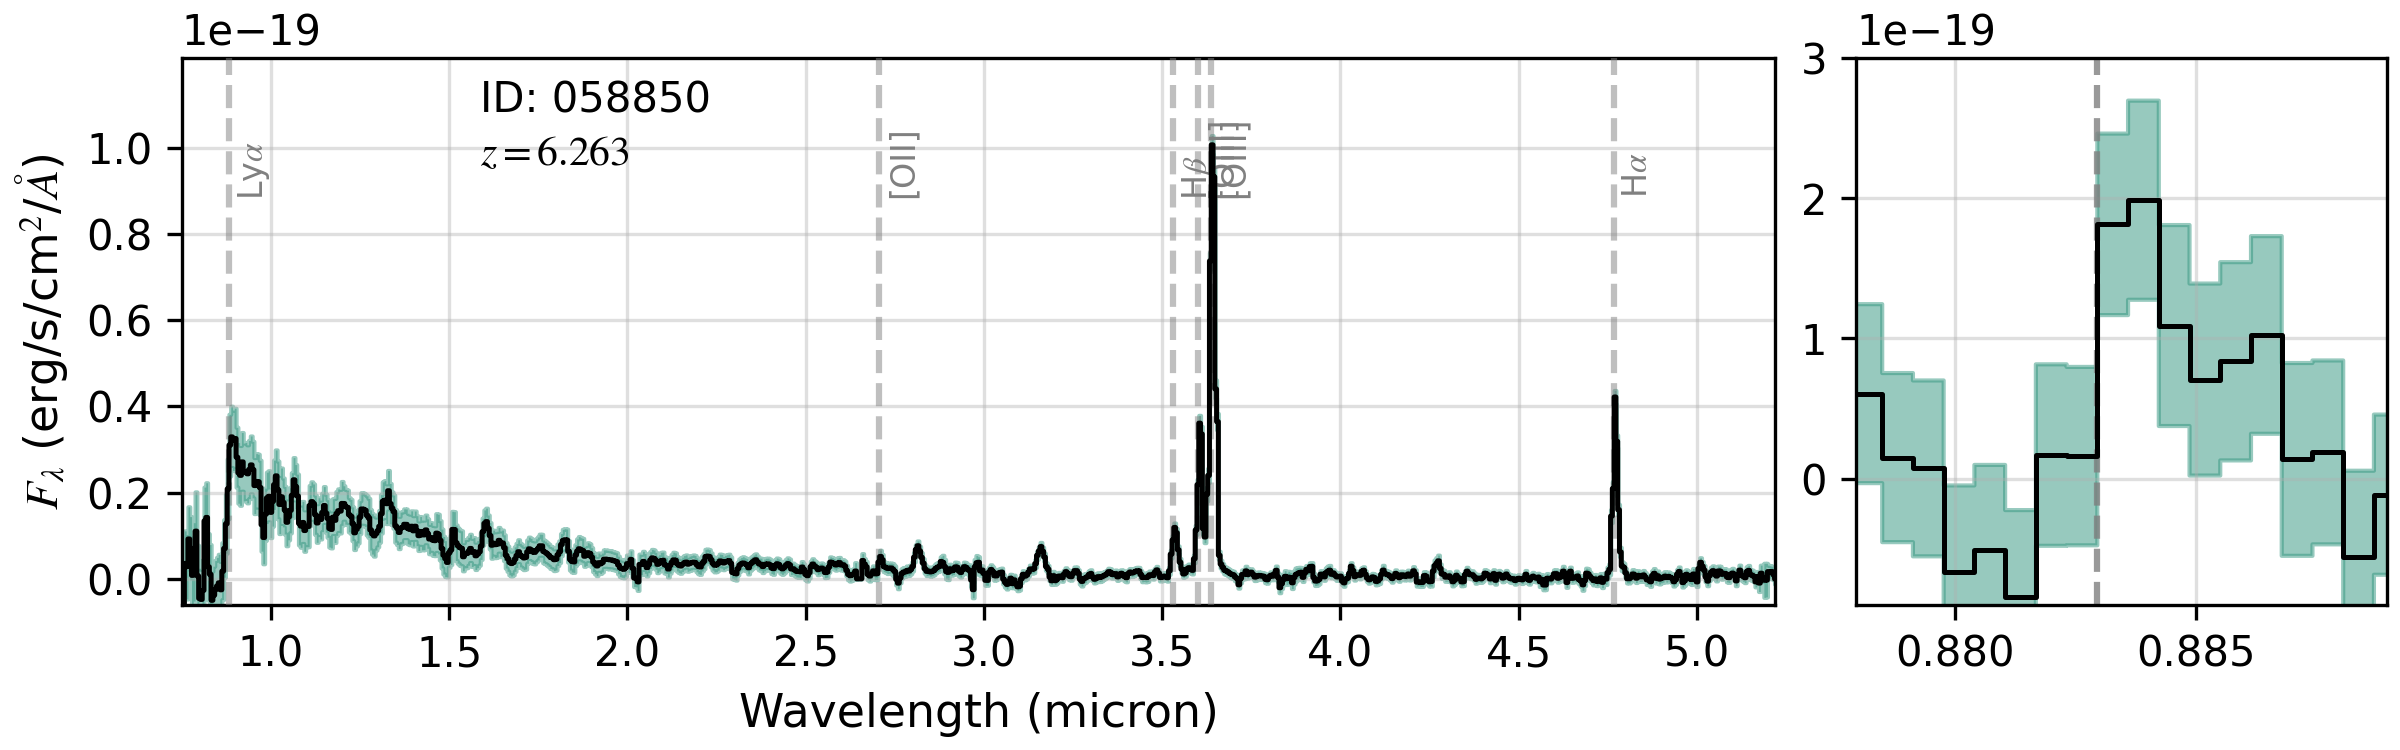
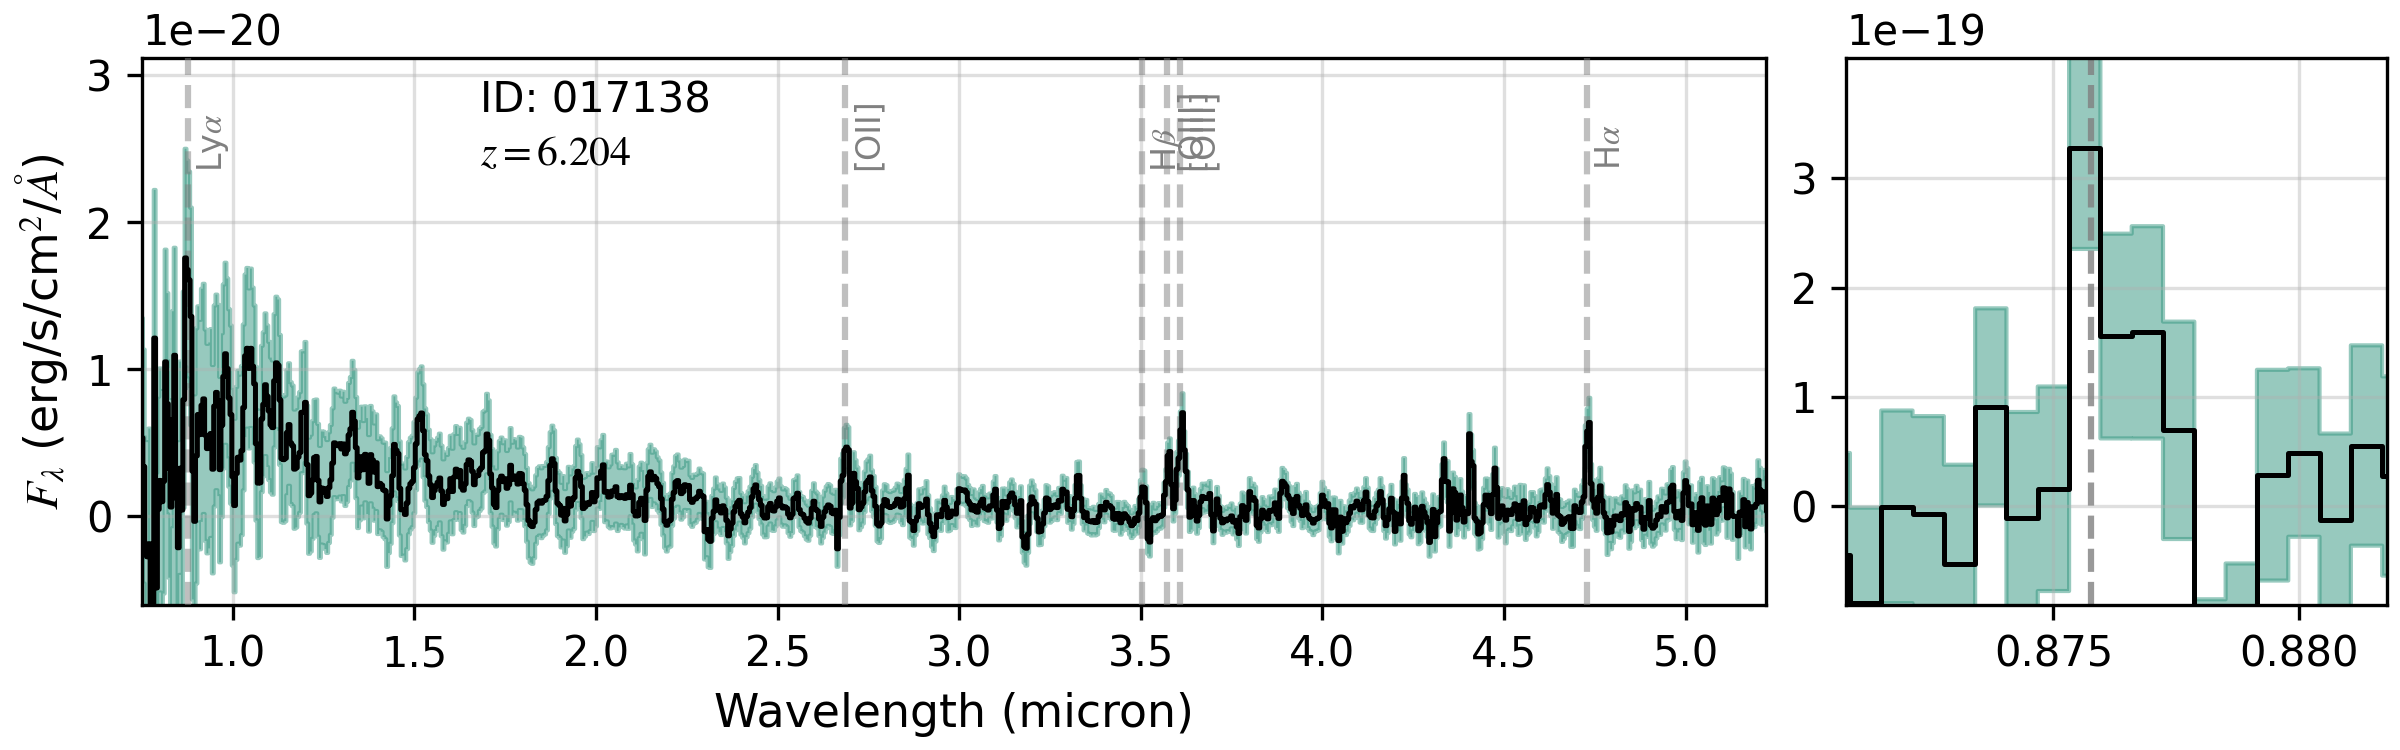
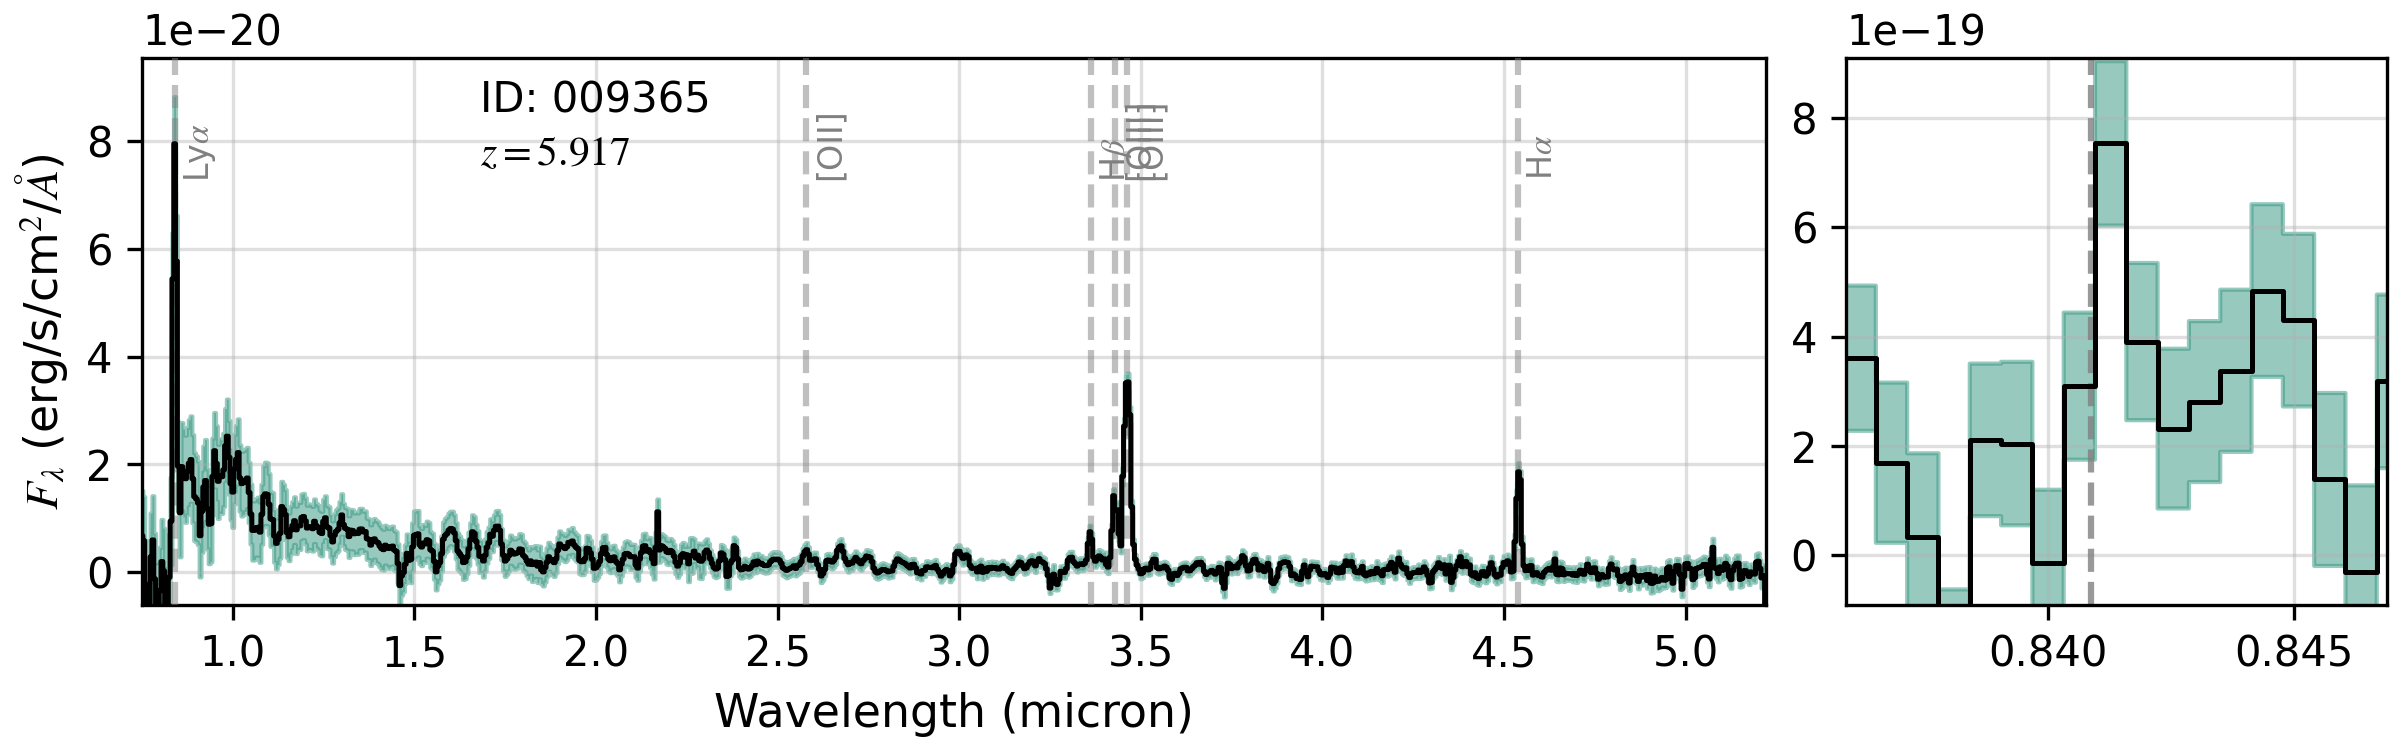
The Ly\textalpha line in one of the 16 LAEs at presented in this work fell in the detector gap in R1000. With the exception of this galaxy, all visually identified LAEs encouragingly showed clear Ly\textalpha emission both in the PRISM and in G140M spectra. In Figure 1 we show the full 1D spectrum from PRISM (R100) as well as a zoom-in on the Ly\textalpha emission identified in the G140M grating (R1000) from a selection of LAEs in our sample and the spectra of all LAEs are shown in Appendix A. In Table 1 we list the exposure times for the LAEs identified in this work and the references where the possible high redshift nature of these objects was first suggested.
Overall, we find that the line fluxes we measure from the medium resolution grating are systematically higher than the ones measured from PRISM, as can also be seen in Figure 1, which is not surprising given the degradation in spectral resolution that PRISM spectra suffer from at shorter wavelengths. Therefore, going forward we use Ly\textalpha measurements from the G140M grating, with the exception of one source for which Ly\textalpha was in the detector gap.
2.3 Systemic redshifts
Accurate ‘systemic’ redshifts were measured by identifying strong emission lines in the higher resolution Grating spectra, which generally consisted of [O ii], H\textbeta, [O iii] and H\textalpha. The redshift was derived by fitting single Gaussian functions to the strongest emission lines and using a S/N-weighted combination of the centroids of the fits to obtain the best redshift solution. For the redshift range of our sources, the H\textbeta, [O iii] and H\textalpha lines fell in the G395M grating and the [O ii] line fell in the G235M grating spectra. Vacuum wavelengths for all of these strong rest-frame optical lines were used for redshift determination.
We found that on average, the difference between the redshifts derived from R100 and R1000 spectra were of the order , but the redshifts derived from lines in the medium dispersion gratings were found to be consistent. Therefore, the redshifts that we derive and use further in the study are from the medium dispersion gratings, which also have a much narrower line-spread function (LSF) and are more sensitive to narrow emission lines. The source IDs, JADES source names, redshifts and exposure times are given in Table 1. From here on, we use the IDs to refer to the objects presented in this paper. The references for the discovery papers of these targets can be found in Bunker et al. (2023).
| ID | JADES Source name | |||
|---|---|---|---|---|
| (ks) | (ks) | |||
| Deep Tier | ||||
| 21842 | JADES-GS53.1568227.76716 | |||
| 10013682* | JADES-GS53.1674627.77201 | |||
| 16625 | JADES-GS53.1690427.77884 | |||
| 18846 | JADES-GS53.1349227.77271 | |||
| 19342 | JADES-GS53.1606227.77161 | |||
| 9422 | JADES-GS53.1217527.79763 | |||
| 6002 | JADES-GS53.1104127.80892 | |||
| 19606 | JADES-GS53.1765527.77111 | |||
| 10056849 | JADES-GS53.1135127.77284 | |||
| Medium Tier | ||||
| 12637 | JADES-GS53.1334727.76037 | |||
| 15362 | JADES-GS53.1163427.76194 | |||
| 13607 | JADES-GS53.1374327.76519 | |||
| 14123 | JADES-GS53.1783627.80098 | |||
| 58850 | JADES-GS53.0951727.76061 | |||
| 17138 | JADES-GS53.0860427.74760 | |||
| 9365 | JADES-GS53.1628027.76084 |
2.4 UV magnitudes and slopes
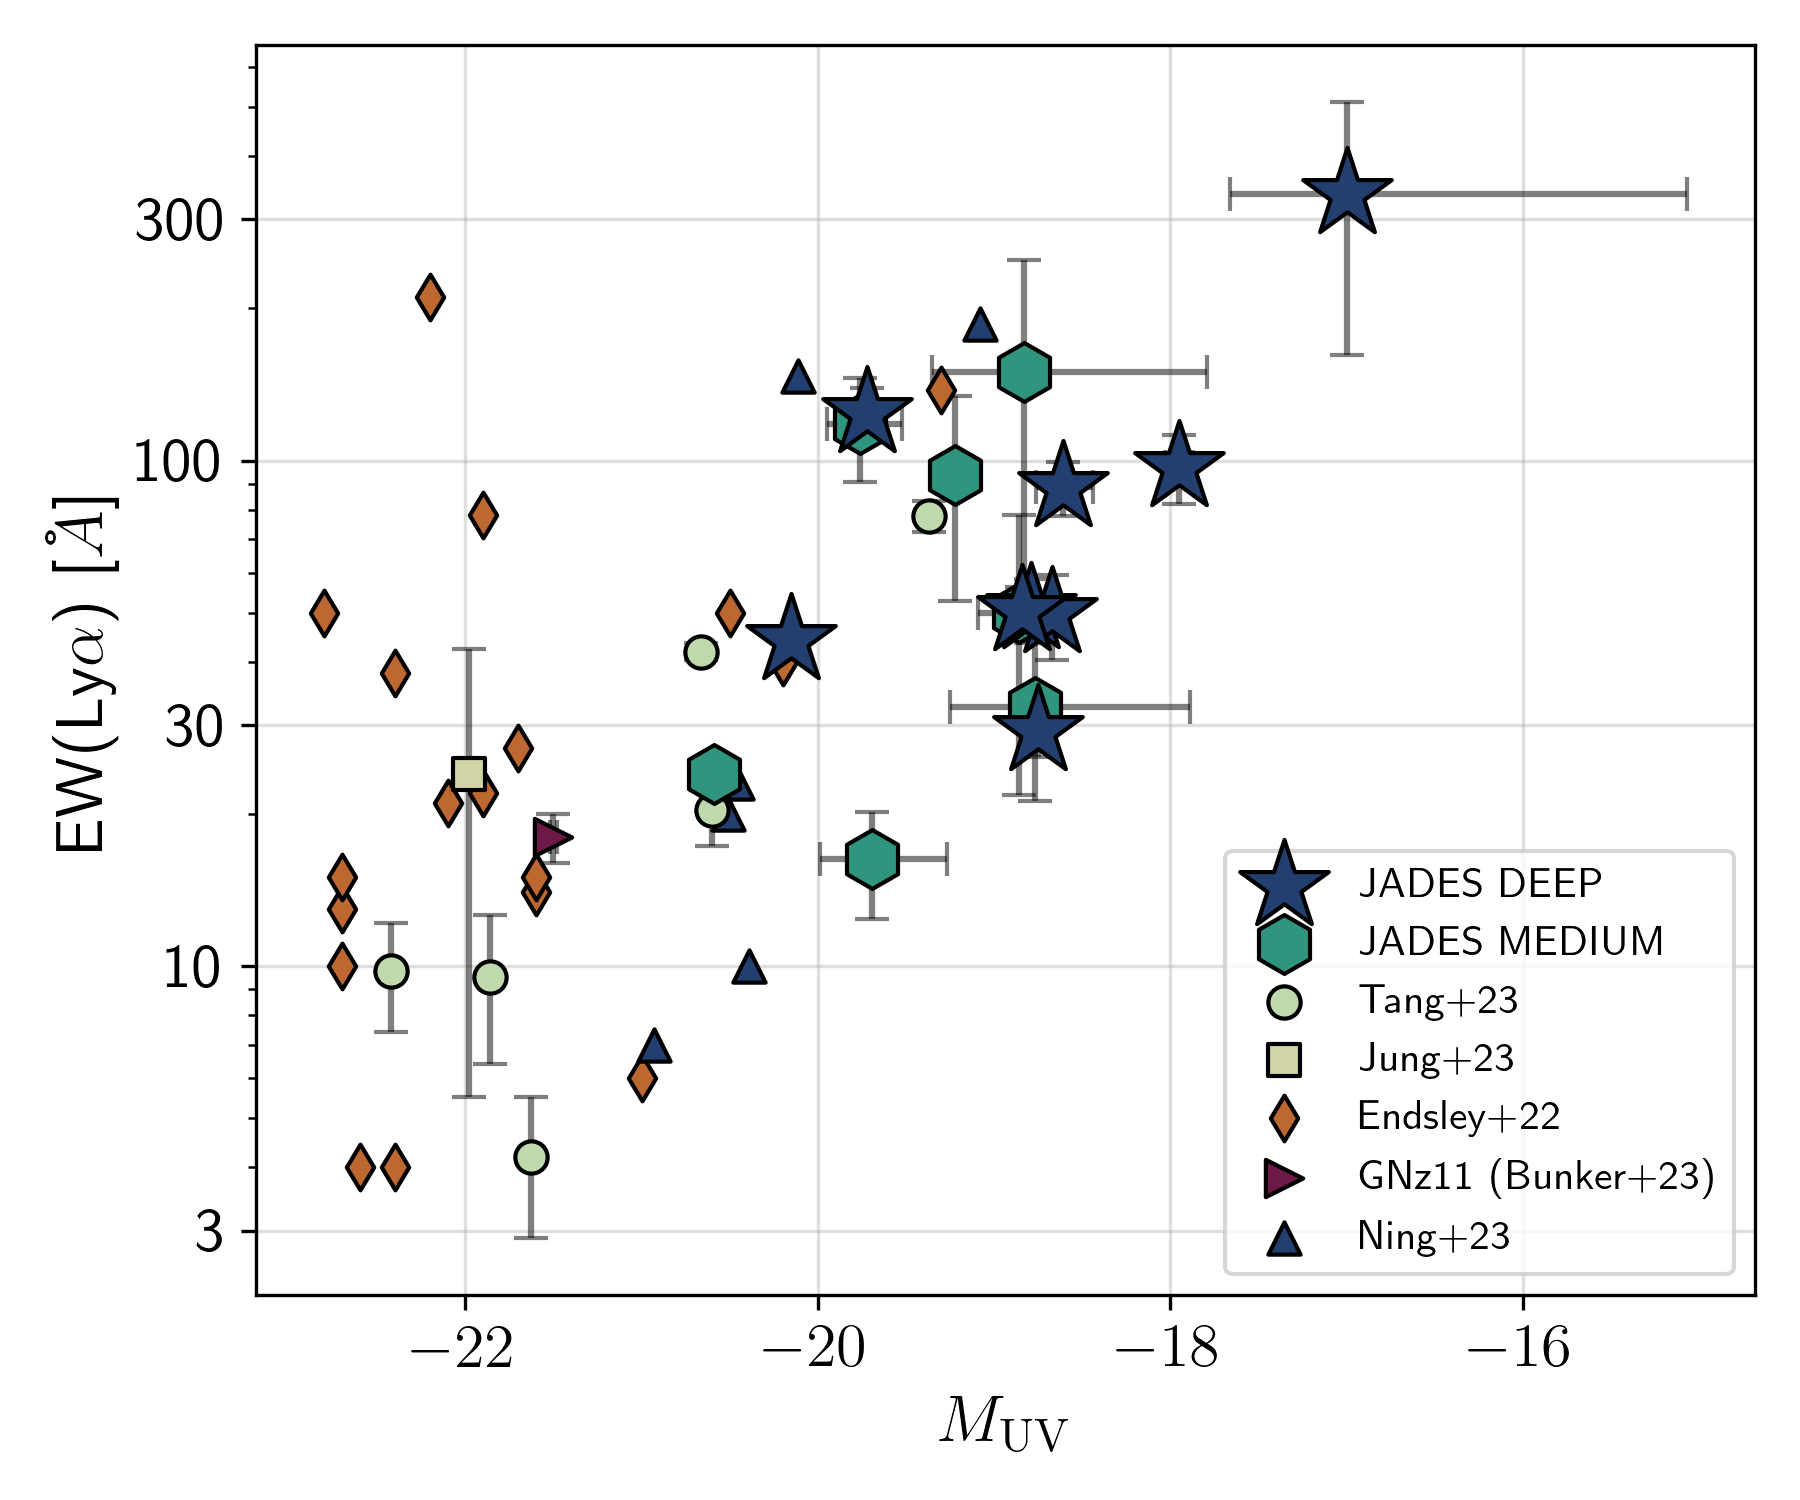
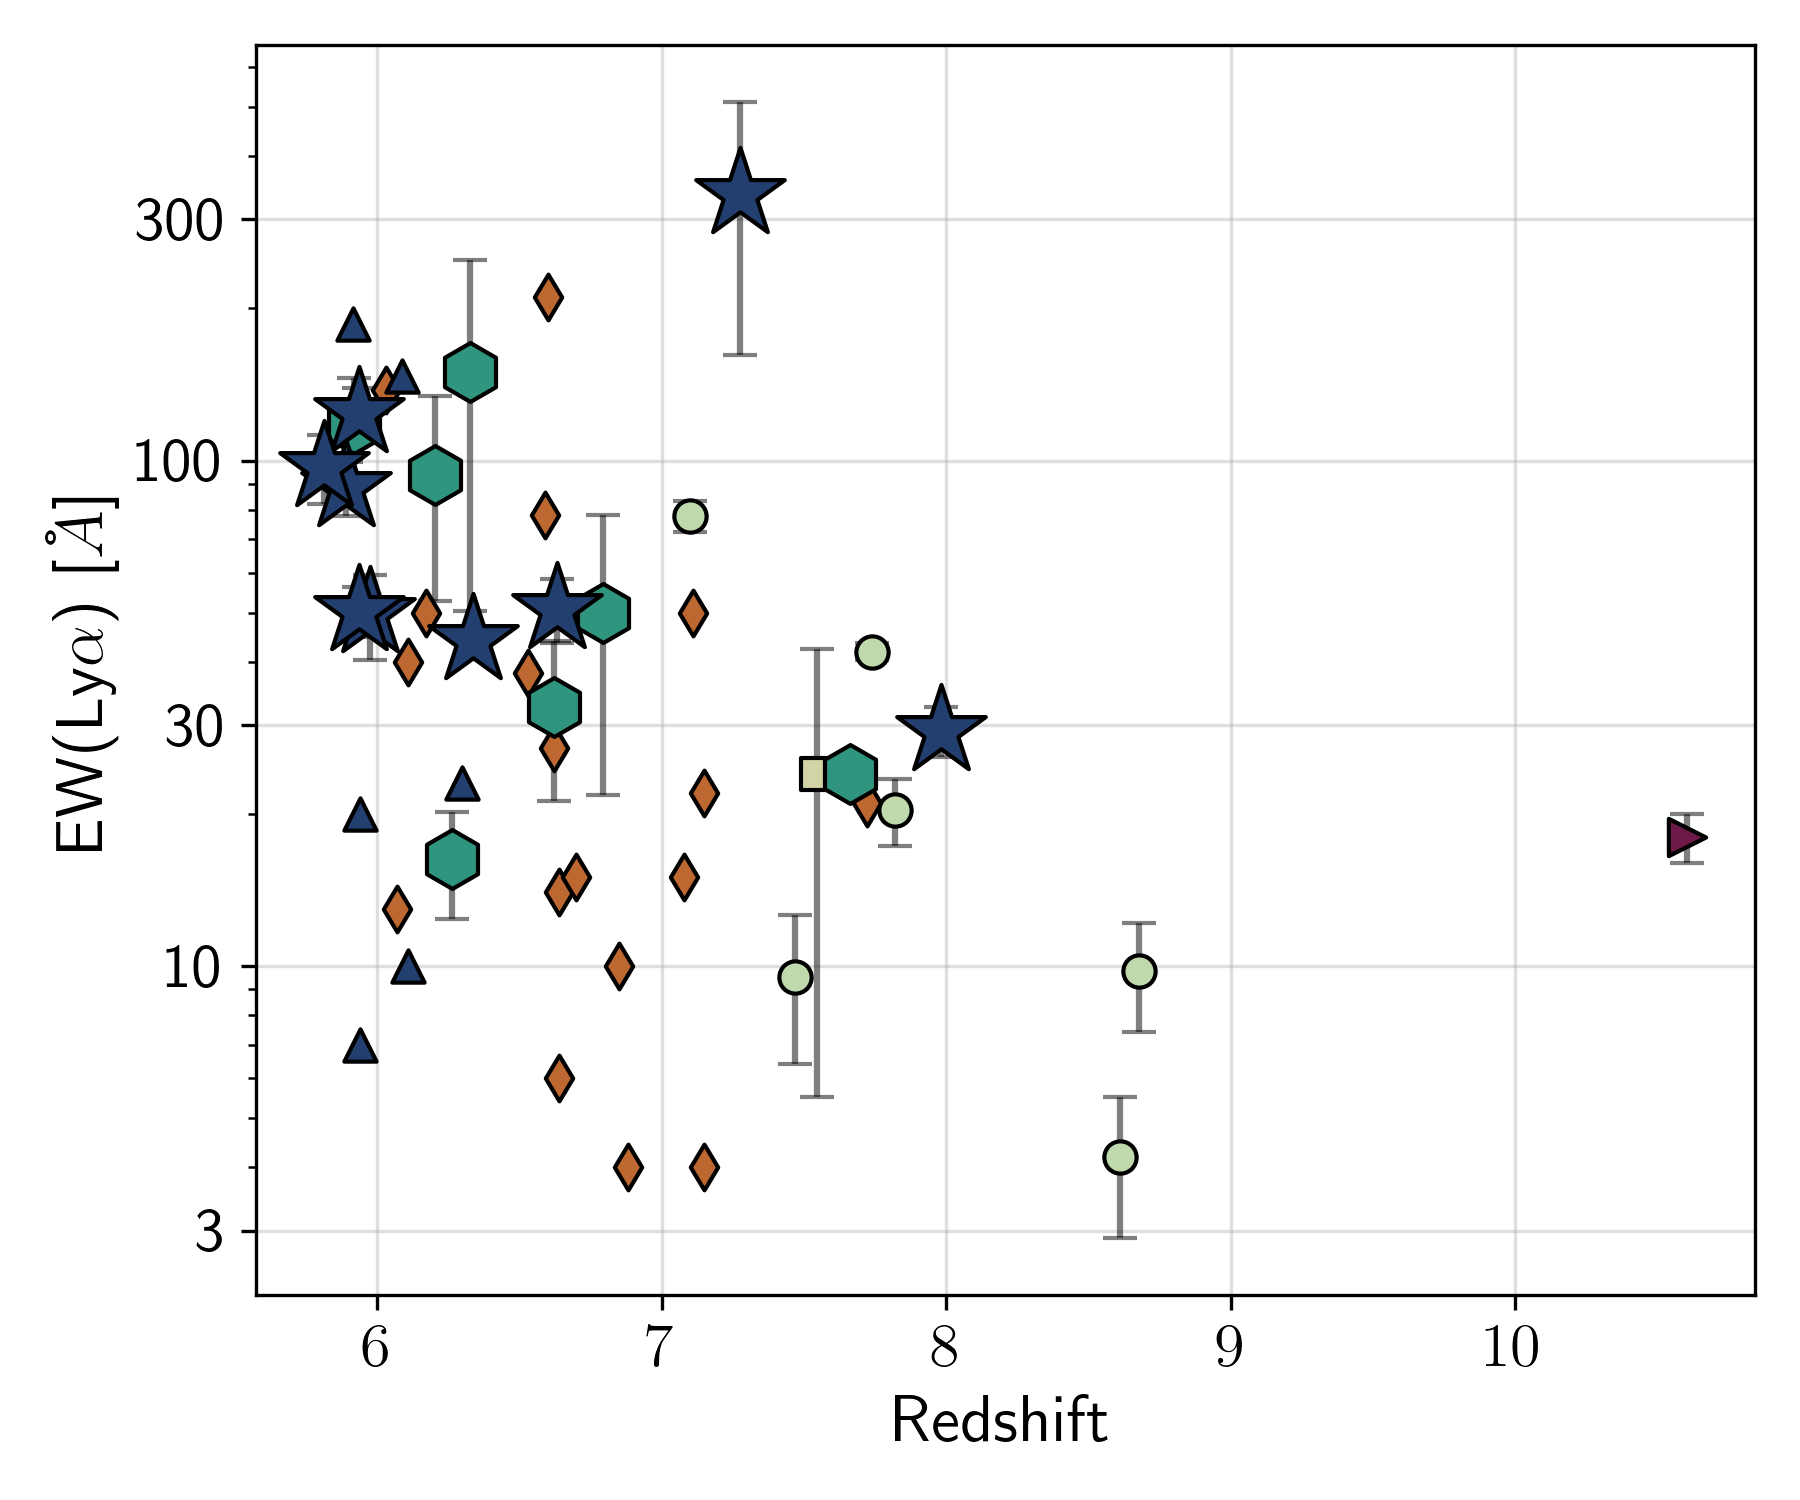
UV magnitudes at rest-frame 1500 Å () were measured directly from the R100 PRISM spectra. To do this, the spectra were shifted from observed to rest-frame using the spectroscopic redshifts and a 50 Å-wide boxcar filter centred on 1500 Å to measure the median flux and error. The measured fluxes and errors were then used to calculate absolute magnitudes and errors. The distribution of the UV magnitudes and Ly\textalpha equivalent widths from our sample of LAEs is shown in Figure 2. The UV-faint galaxies in our sample show systematically high EW(Ly\textalpha), which is likely due to the flux-limited nature of spectroscopic observations, only enabling high EW LAEs to be identified at fainter UV magnitudes.
To put our sample into perspective, we also show measurements from other LAEs at identified using JWST (Tang et al., 2023; Jung et al., 2023) or ground-based observations (Ning et al., 2023; Endsley et al., 2022b) in the Figure. Very clearly, the LAEs presented in this work have much fainter UV magnitudes compared to other LAEs at in the literature.
UV slopes (, where ) are also measured directly from the R100 spectra by fitting an exponential function using chi-squared minimization to the flux density in the wavelength range 1340 Å to 2600 Å, using the Calzetti et al. (1994) spectral windows to avoid strong emission and/or absorption features at rest-UV wavelengths. The redshifts, UV magnitudes at Å and observed UV slopes are given in Table 2.
| ID | |||
|---|---|---|---|
| Deep Tier | |||
| 21842 | |||
| 10013682* | |||
| 16625 | |||
| 18846 | |||
| 19342 | |||
| 9422 | |||
| 6002 | |||
| 19606 | |||
| 10056849 | |||
| Medium Tier | |||
| 12637 | |||
| 15362 | |||
| 13607 | |||
| 14123 | |||
| 58850 | |||
| 17138 | |||
| 9365 |
2.5 Lyman-alpha velocity offsets
Using accurate systemic redshifts from the medium resolution grating spectra, we then use the peak of the Ly\textalpha line detected in the G140M grating spectra of our LAEs to calculate velocity offsets from the expected Ly\textalpha emission (vacuum wavelength) at systemic redshift. As mentioned earlier, the wavelength calibrations between the different gratings were compared against the lower resolution PRISM spectra were noted to be slightly inconsistent, but the wavelengths across the grating spectra were all consistent with each other (see Bunker et al., 2023). Therefore, inferring the observed velocity offset of Ly\textalpha from G140M spectra should not be affected by systematic offsets.
We trialled two methods to estimate the Ly\textalpha velocity shifts and errors. The first method involved obtaining the centroid of the line emission by fitting a single Gaussian function, with the error on the centroid (which takes into account pixel-by-pixel uncertainties) giving the error on the velocity offset. However, as Ly\textalpha emission from high redshift galaxies often appears to be asymmetric due to absorption of the blue wing by both ISM and neutral IGM, the single Gaussian fit did not always accurately coincide with the observed peak of Ly\textalpha emission. Therefore, the second method we employed involved calculating the Ly\textalpha offset from the peak pixel of the Ly\textalpha emission line, with the uncertainty on this measurement being the width of the peak pixel. If the S/N of the emission line is high enough, the peak pixel should always trace the peak of the LSF-deconvolved emission line as well, thereby returning the most accurate empirical measurement of the Ly\textalpha velocity offset.
2.6 Other emission line measurements
The rest-frame optical emission line fluxes for all LAEs are measured from the higher spectral resolution grating spectra, unless the lines are not clearly detected in the grating. In that case we measure and report the line fluxes from the PRISM spectra. The main emission lines that we measure for our sample of LAEs are [O ii] (which appear to be blended), H\textbeta, [O iii] and H\textalpha.
We once again fit single Gaussian functions to all of these lines, measuring the local continuum from a wavelength region adjacent to the emission line. Using these line fluxes we also calculate line ratios such as [O iii] /[O ii] (O32) and ([O ii] + [O iii] )/H\textbeta (R23).
2.7 Dust measurements from Balmer decrements
Here we use the Balmer emission line decrements calculated from H\textalpha/H\textbeta (or H\textbeta/H\textgamma when H\textalpha is not within the spectral coverage). We calculate the intrinsic ratios of these line fluxes using pyneb (Luridiana et al., 2015), assuming a temperature of K and electron density of cm-3. We assume the dust attenuation curve for the Small Magellanic Cloud (SMC; Gordon et al. 2003), which has been shown to be the most appropriate for high redshift galaxies (e.g. Shivaei et al., 2020).
Dust attenuation, is then calculated by comparing the observed Balmer line ratios with the intrinsic. We note that the H\textalpha line is detected for all but one galaxy in our sample, and therefore, we primarily use the observed H\textalpha/H\textbeta ratios to calculate dust attenuation across our sample, but for LAEs where H\textalpha moves out of NIRSpec coverage we use H\textbeta/H\textgamma.
2.8 Ionizing photon production efficiency
We use the H\textalpha flux (or H\textbeta when H\textalpha is not within the spectral coverage) and the monochromatic luminosity at 1500 Å to calculate the ionizing photon production efficiency, or , given by
| (1) |
where is the intrinsic hydrogen ionizing photon production rate in units of s-1 and is the intrinsic (dust-corrected) luminosity density at rest-frame 1500 Å in units of erg s-1 Hz-1.
The H\textalpha line (or other Balmer lines) luminosity can be used to calculate the intrinsic ionizing photon production rate. Assuming K and cm-3,
| (2) |
where is the escape fraction of LyC photons out of the galaxy (e.g. Maseda et al., 2020; Simmonds et al., 2023). To calculate for our LAEs, we assume Case-B recombination, i.e. (LyC) (see Section 5, however, for a discussion about non-zero (LyC)).
2.9 Lyman-alpha escape fractions
We now use the strength of Balmer emission lines seen in the spectrum together with the inferred dust attenuation to derive a Ly\textalpha escape fraction for all LAEs in our sample. Assuming Case-B recombination, cm-3 and K, the intrinsic Ly\textalpha/H\textalpha ratio is (e.g. Osterbrock, 1989). We then calculate (Ly\textalpha) as the ratio of the observed (dust-corrected) Ly\textalpha to Balmer line emission to the intrinsic ratio, which for the H\textalpha emission line looks like: (Ly\textalpha) = L(Ly\textalpha)/(L(H\textalpha)).
The observed Ly\textalpha properties, which include line fluxes, equivalent widths, velocity offset from systemic redshift and the Ly\textalpha escape fraction () are given in Table 3.
| ID | EW | EW | (Ly\textalpha) | ||||
|---|---|---|---|---|---|---|---|
| ( cgs) | () | ( cgs) | () | (km s-1) | |||
| Deep Tier | |||||||
| 21842 | |||||||
| 10013682* | |||||||
| 16625 | |||||||
| 18846 | |||||||
| 19342 | |||||||
| 9422 | |||||||
| 6002 | |||||||
| 19606 | |||||||
| 10056849 | |||||||
| Medium Tier | |||||||
| 12637 | |||||||
| 15362 | |||||||
| 13607 | |||||||
| 14123 | |||||||
| 58850 | |||||||
| 17138 | |||||||
| 9365 |
2.10 Comparison samples from the literature
To put our results into a more global context while also increasing the baseline of several physical parameters that were also measured from our sample of faint LAEs, we describe here a selection of literature samples of LAEs at with which we compare our results.
Perhaps the most immediate comparison is offered by LAEs identified by Tang et al. (2023) using JWST spectroscopy through the CEERS survey (see also Fujimoto et al., 2023). We also include CEERS results from Jung et al. (2023) in this study. Since CEERS is shallower and wider than JADES, it more efficiently selects the rarer UV-bright galaxies by probing a much larger volume at high redshifts.
We also use the compilation of LAEs from Endsley et al. (2022a) that have ALMA emission line measurements, enabling robust measurements of the Ly\textalpha velocity offsets. This compilation includes LAEs from the ALMA REBELS survey (Bouwens et al., 2022) as well as other LAEs at : CLM1 (Cuby et al., 2003; Willott et al., 2015), WMH5 (Willott et al., 2015), B14-65666 (Furusawa et al., 2016; Hashimoto et al., 2019), EGS-zs8-1 (Oesch et al., 2015; Stark et al., 2017), COS-z7-1 (Pentericci et al., 2016; Laporte et al., 2017; Stark et al., 2017), COSMOS24108 (Pentericci et al., 2016, 2018b), NTTDF6345 (Pentericci et al., 2011, 2016), UDS16291 (Pentericci et al., 2016, 2018b), BDF-3299 (Vanzella et al., 2011; Maiolino et al., 2015; Carniani et al., 2017), RXJ2248-ID3 (Mainali et al., 2017), A383-5.2 (Stark et al., 2015; Knudsen et al., 2016), VR7 (Matthee et al., 2019, 2020), CR7 (Sobral et al., 2015; Matthee et al., 2017b) and Himiko (Ouchi et al., 2013; Carniani et al., 2018).
We also include Ly\textalpha and H\textalpha based measurements from Ning et al. (2023) as well as Simmonds et al. (2023), which use narrow/medium band photometry to infer H\textalpha strengths in spectroscopically confirmed LAEs at identified from MUSE data, enabling the determination of (Ly\textalpha) and .
Finally, we also use the Ly\textalpha emission measurements from GNz-11, spectroscopically confirmed to lie at with weak Ly\textalpha emission detected in the medium band NIRSpec gratings (Bunker et al., 2023).
3 Spectroscopic properties of Lyman-alpha emitters at
In this section we explore the general spectroscopic properties of LAEs identified in the JADES Deep and Medium Tier surveys, with the aim of comparing the ionization and chemical enrichment of LAEs with the general galaxy population at as well as evaluating the ionizing photon production efficiencies of LAEs across cosmic time.
3.1 Chemical enrichment and dust
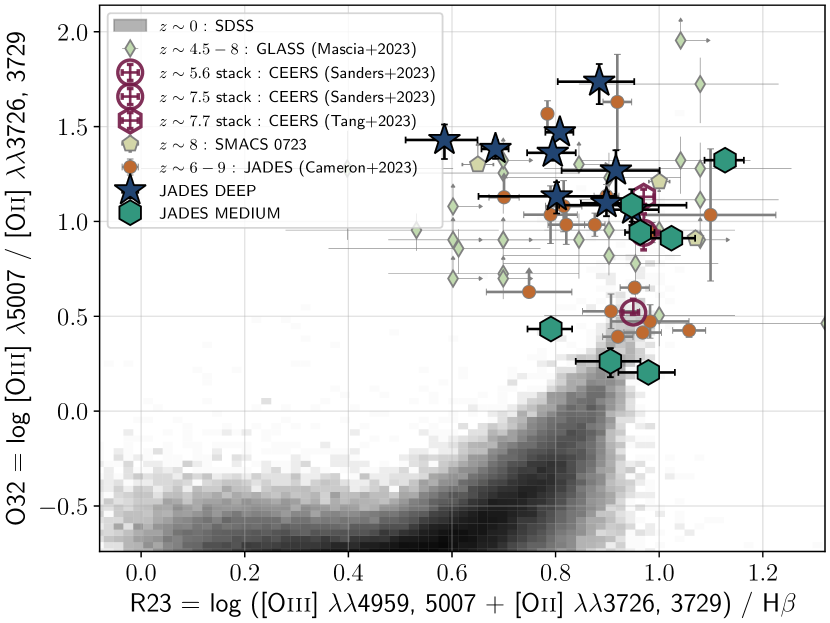
In Figure 3, we show R23 vs. O32 line ratios for our Deep- and Medium-tier samples of LAEs. These line ratios are widely used tracers of metallicity and ionisation parameter respectively, with the former forming a two-valued relation with metallicity. For comparison, we show galaxies from the SDSS MPA-JHU catalogs (Aihara et al., 2011)111https://www.sdss3.org/dr10/spectro/galaxy_mpajhu.php, as well as non-Lyman--emitting galaxies at from JADES Deep (Cameron et al. 2023), and measurements from individual and stacked galaxies at not selected on presence or otherwise of Ly\textalpha (Mascia et al., 2023; Nakajima et al., 2023; Sanders et al., 2023; Tang et al., 2023). Our LAEs on average appear to be metal poor with high ionization parameters, lying away from the locus of typical star-forming galaxies at from SDSS toward high O32 and R23. Instead, they are more similar to what has been reported for the general galaxy population at .
We do note that LAEs from our Deep Tier survey, which tend to have fainter UV magnitudes (), show slightly higher O32 ratios and lower R23 ratios compared to LAEs found in the Medium Tier survey as well as other brighter LAEs at . This is consistent with the finding in Cameron et al. (2023) that galaxies from deep JADES observations show much higher O32, and lower R23 than those measured from stacks of CEERS galaxies (Sanders et al., 2023), which are typically brighter. This is indicative of higher ionization parameters and lower chemical enrichment in fainter, less massive galaxies at .
Overall we find that the parameter space on this plot occupied by LAEs at is roughly the same as the general galaxy population at these redshifts. This suggests that the detection of Ly\textalpha emission from a galaxy in the EoR may not necessarily depend on the chemical or ionization state that is in, but may be more driven by opportune sight-lines probing sufficiently ionized regions of the Universe.
We do not measure any presence of dust from Balmer decrements derived from H\textalpha/H\textbeta ratios for our LAEs (in agreement with Sandles et al. in prep), which suggests that such systems are relatively dust-free, which is also a prerequisite for the leakage of significant fractions of Lyman continuum photons from a galaxy into the IGM.
3.2 Ionizing photon production
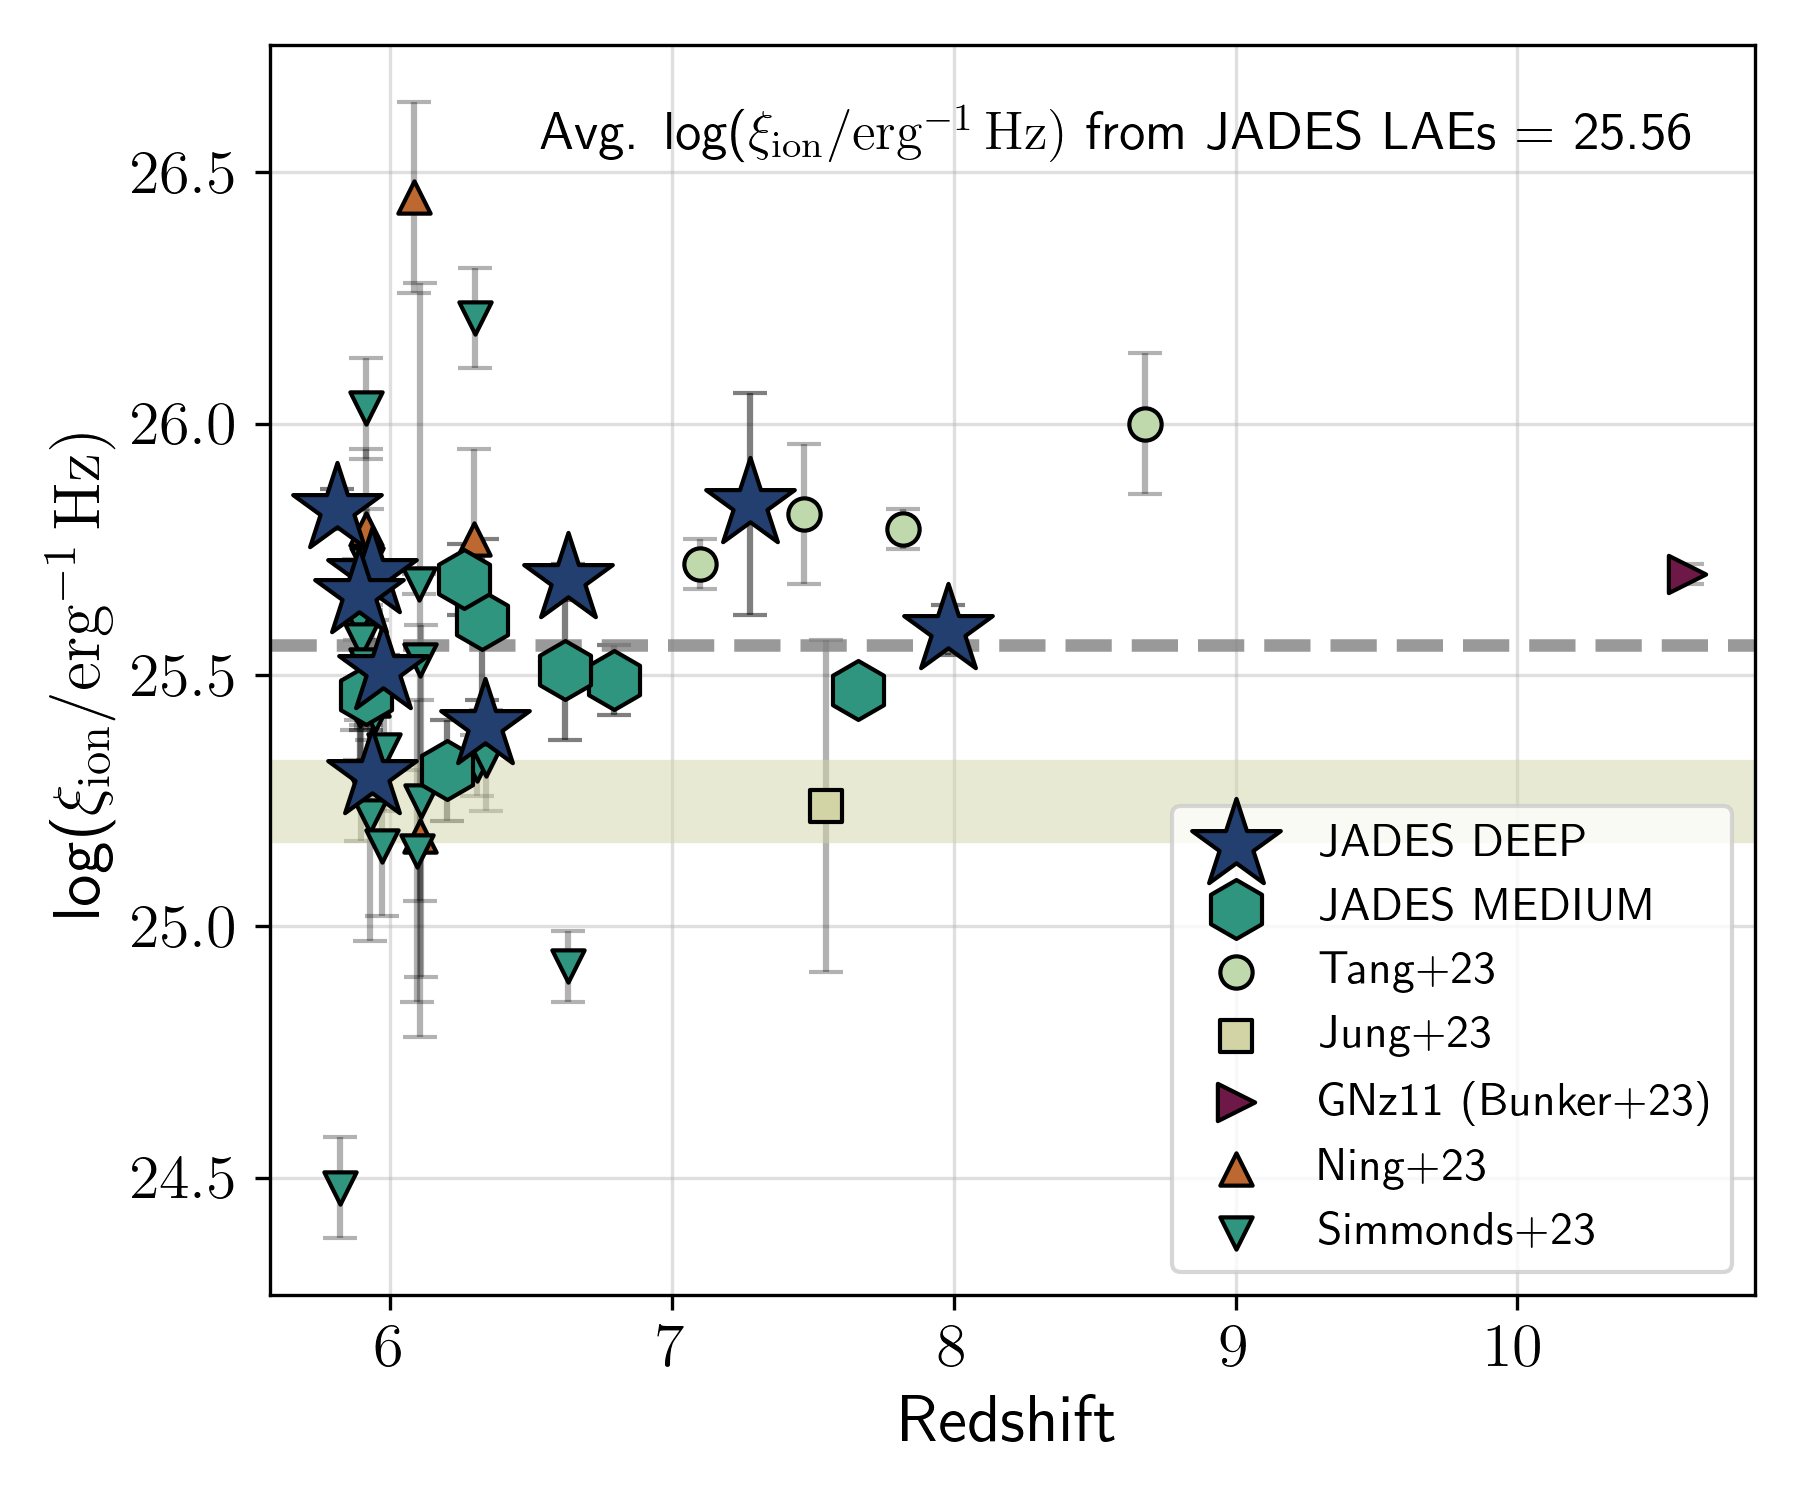
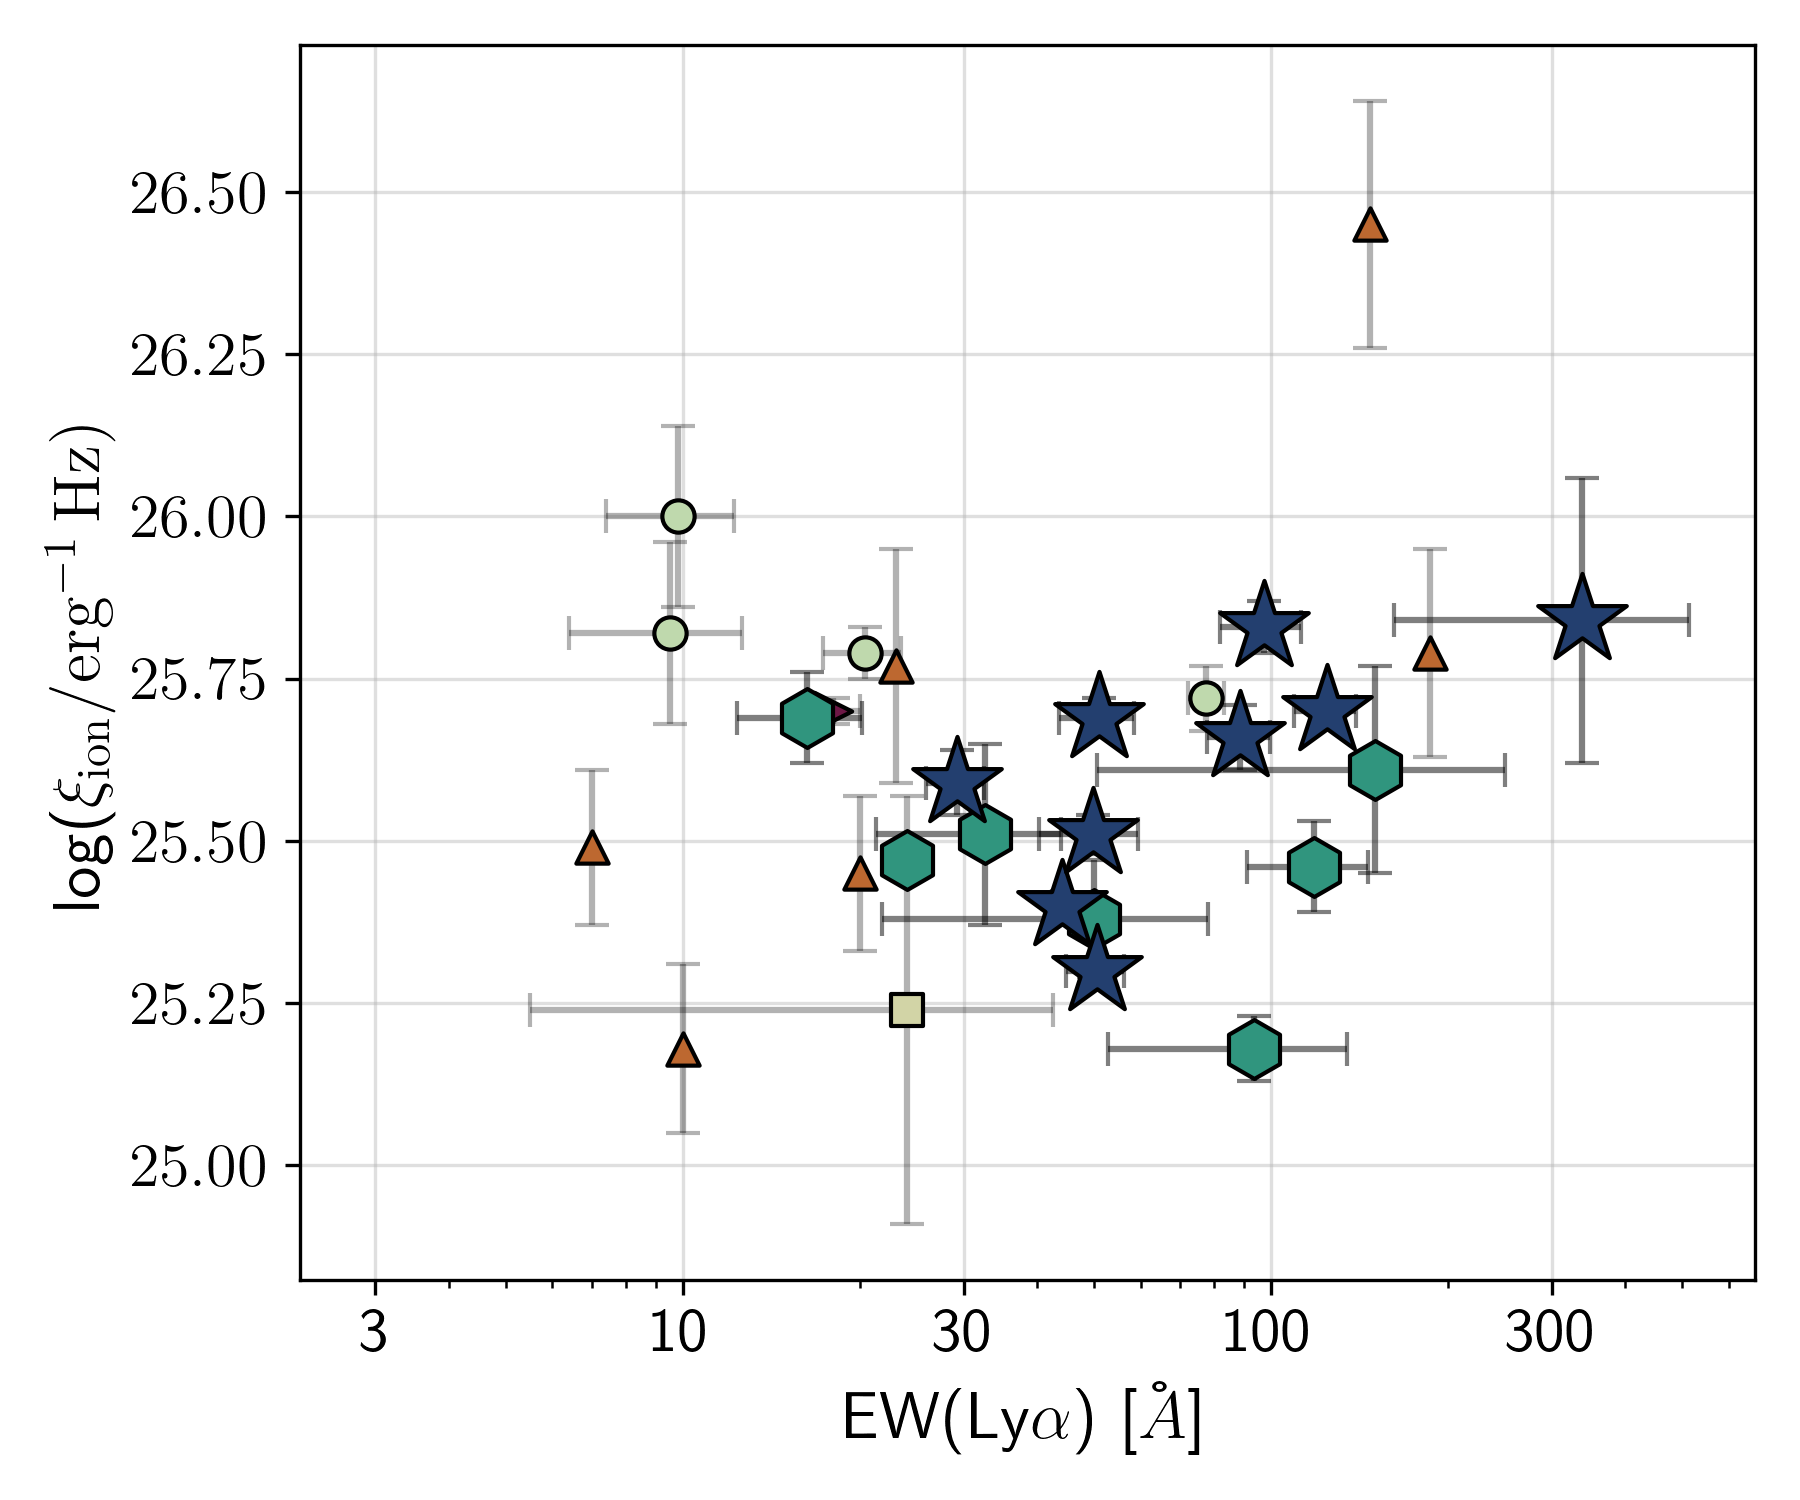
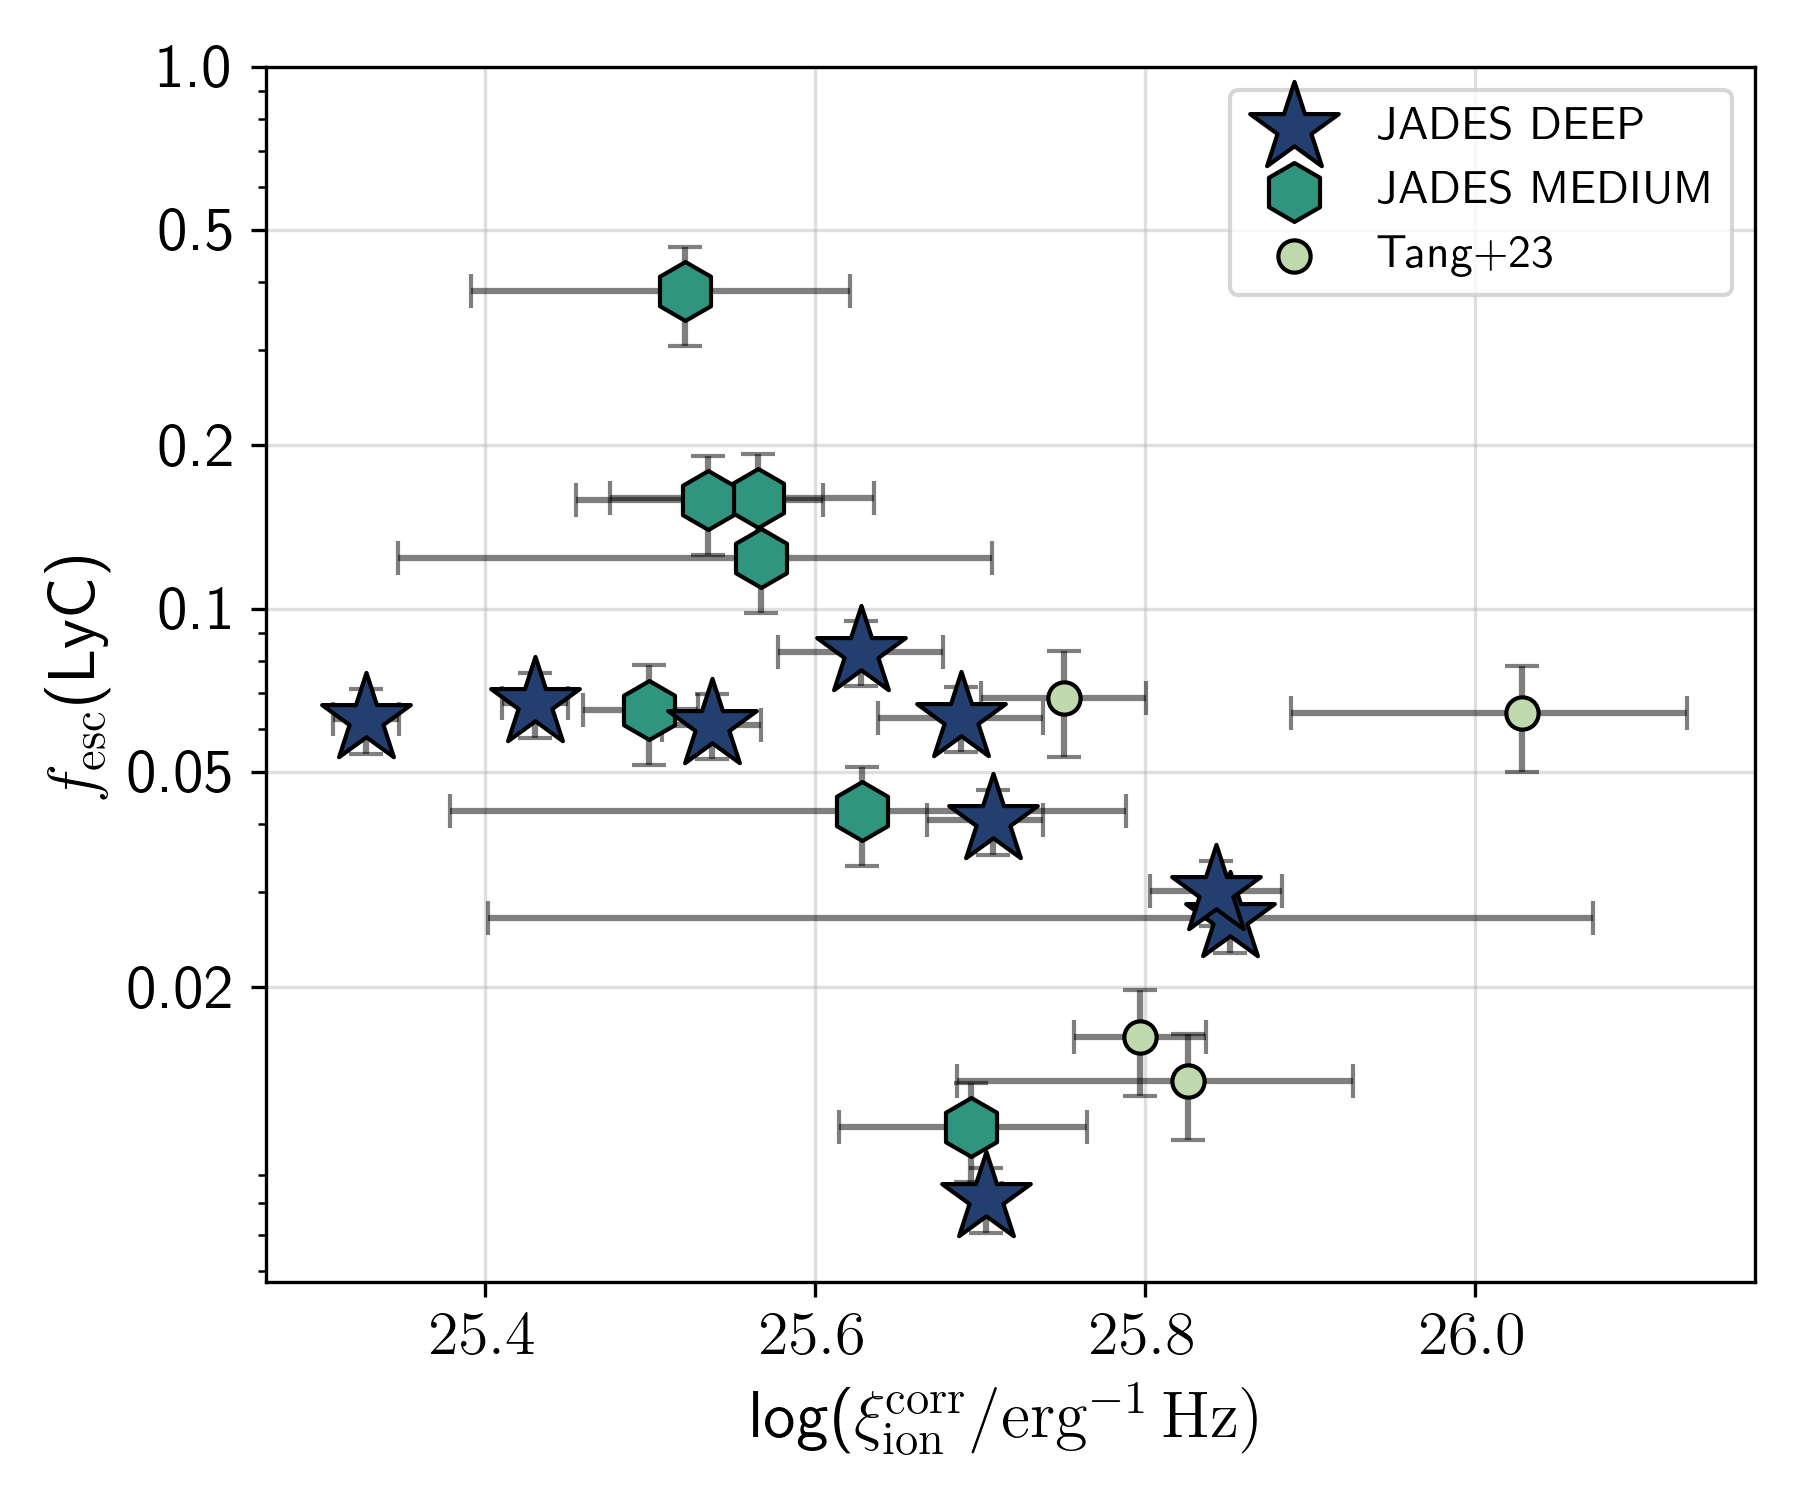
The average ionizing photon production efficiency across our sample of faint LAEs is Hz erg-1, which is shown as a dashed line in Figure 4. When comparing with other measurements for LAEs at the highest redshifts in the literature, we do not see significant evolution in as a function of redshift at .
Interestingly, there does not seem to be any strong dependence of on the equivalent width of Ly\textalpha emission either. Assuming Case B recombination and (Ly\textalpha) of unity, may be expected to increase linearly with EW(Ly\textalpha). The fact that there is no clear correlation between these two quantities across a wider sample of known LAEs at spanning orders of magnitude in brightness suggests that the mechanisms that are responsible for the production of ionizing photons in a galaxy are not the ones that also control the escape of Ly\textalpha photons from the galaxy. In other words, the neutral gas and dust content, which preferentially affects the transmission of Ly\textalpha photons, does not seem to closely depend on properties such as stellar metallicities or ages that control the production of ionizing photons.
Combined with the lack of redshift evolution in , the picture that emerges is that the ionizing photon production is not closely linked to the strength of the emergent Ly\textalpha line emission, as it is likely more dependent on the physical and chemical properties of star-forming regions that do not seem to evolve strongly between . This may have important consequences for modelling the production and escape of ionizing photons from galaxies within the reionization epoch, which we will revisit in Section 5. The chemical enrichment and ionizing properties of LAEs in this study are given in Table 4.
| ID | /Hz erg-1) | [O iii]/[O ii] | ([O ii]+[O iii])/H\textbeta | (LyC) | |||
|---|---|---|---|---|---|---|---|
| ( cgs) | ( cgs) | (O32) | (R23) | ||||
| Deep Tier | |||||||
| 21842 | |||||||
| 10013682 | |||||||
| 16625 | |||||||
| 18846 | |||||||
| 19342 | |||||||
| 9422 | |||||||
| 6002 | |||||||
| 19606 | |||||||
| 10056849 | |||||||
| Medium Tier | |||||||
| 12637 | |||||||
| 15362 | |||||||
| 13607 | |||||||
| 14123 | |||||||
| 58850 | |||||||
| 17138 | |||||||
| 9365 |
† The H\textbeta line was affected by a possible cosmic ray in the spectrum, and therefore, H\textalpha flux was used to estimate H\textbeta flux assuming no dust.
4 What governs the escape of Lyman-alpha photons?
In this section we explore which galaxy property best traces the Ly\textalpha velocity offset from the systemic redshift as well as the escape fraction of Ly\textalpha photons, (Ly\textalpha), which are widely regarded to be tracing escape channels for hydrogen ionizing LyC photons. The goal of this section is to determine the best tracer for LyC leakage when Ly\textalpha emission may not be visible from galaxies in the reionization era.
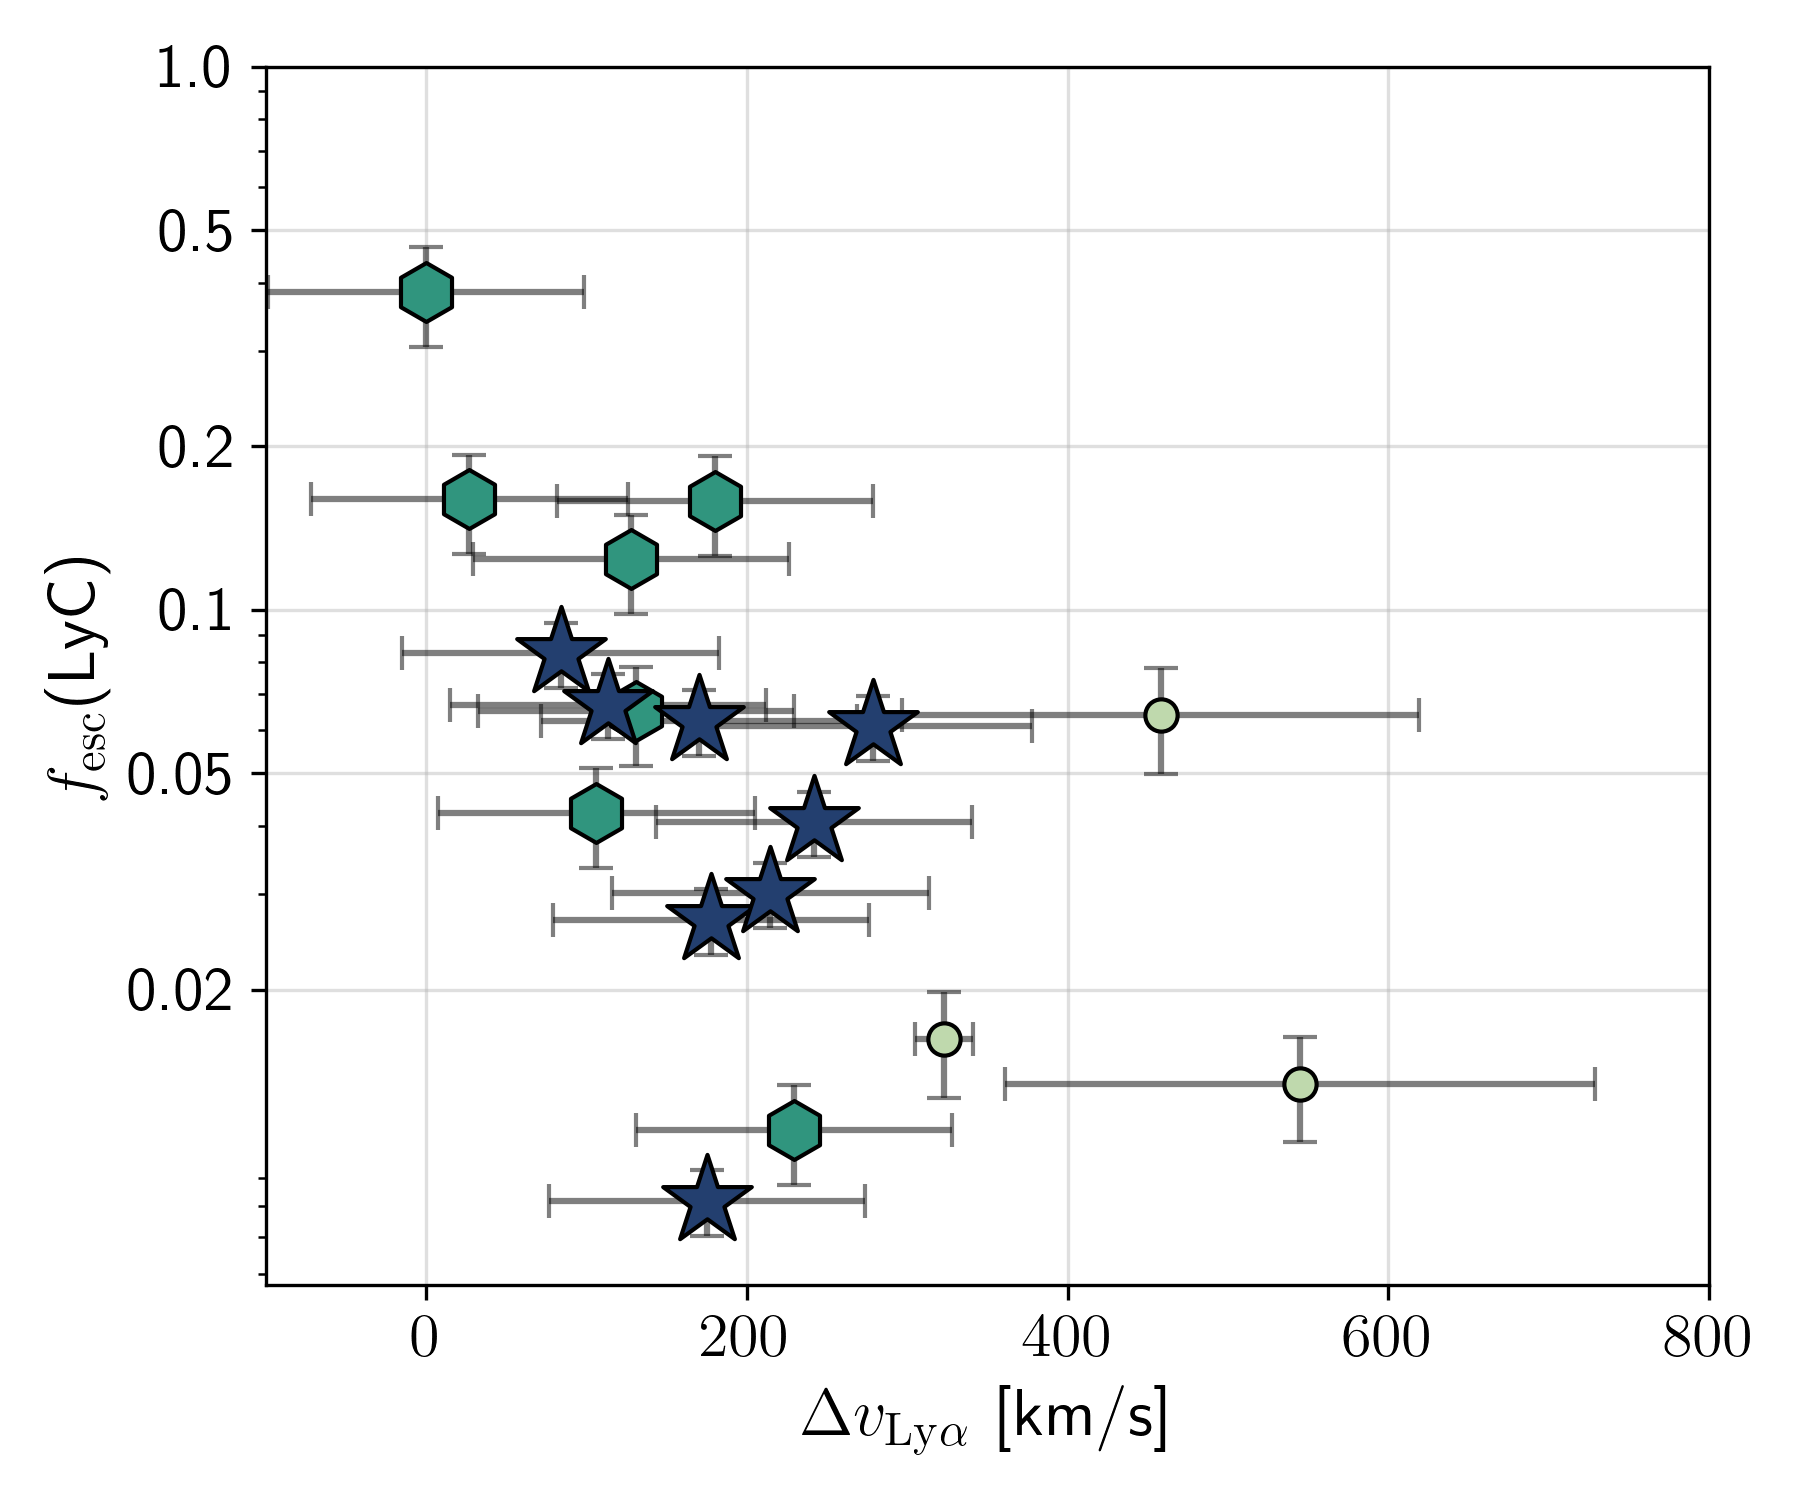
4.1 Low Lyman-alpha velocity offset leads to high Lyman-alpha escape fraction
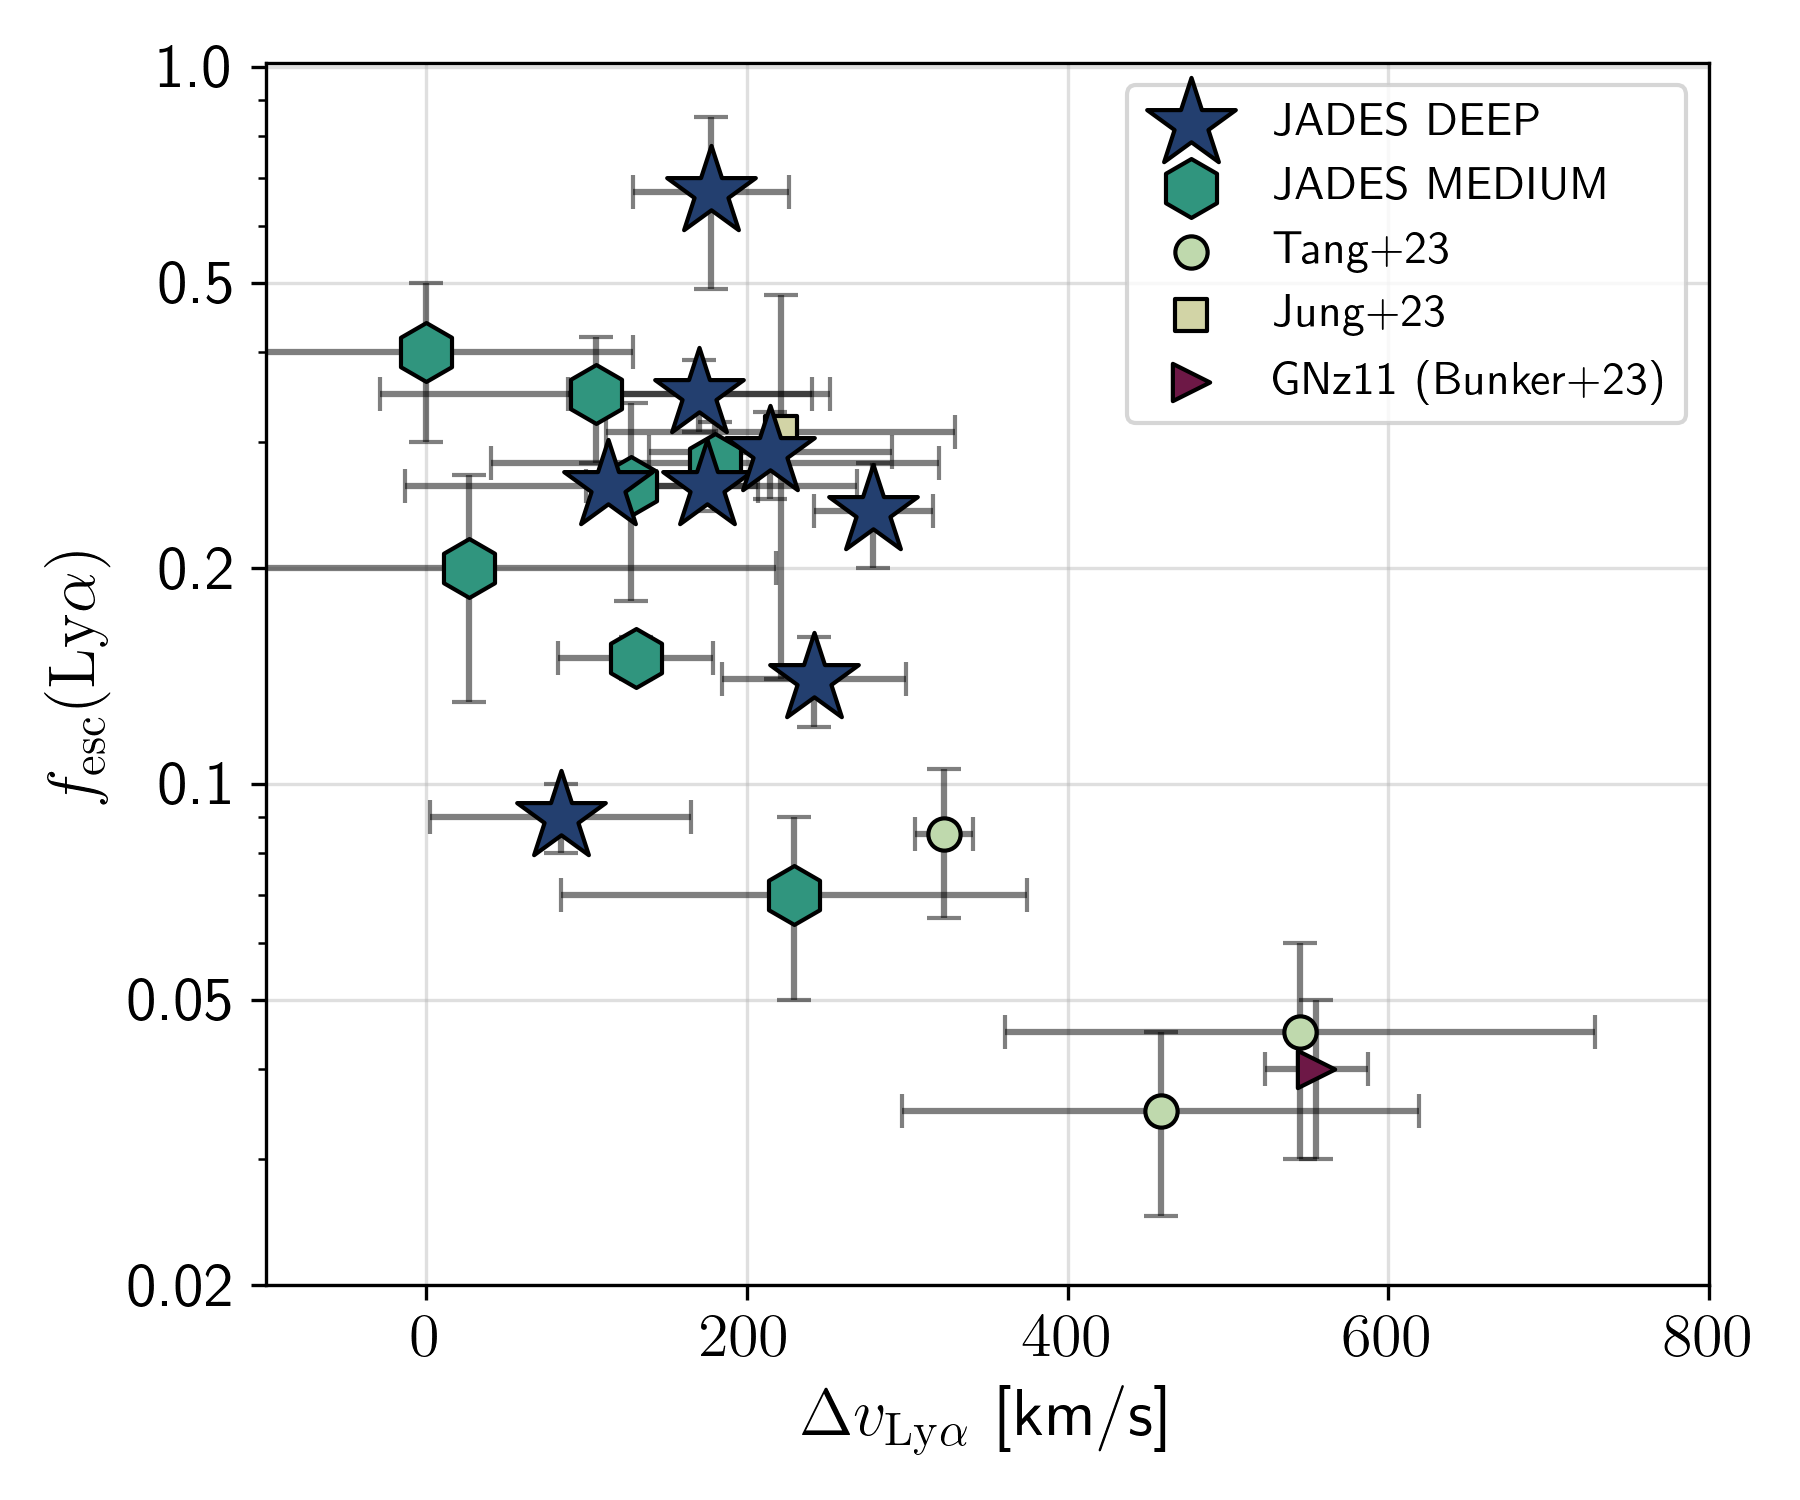
We begin by demonstrating that the escape fraction of Ly\textalpha photons is strongly anti-correlated with the velocity offset of the Ly\textalpha emission compared to the systemic redshift of a galaxy, as shown in Figure 5. This anti-correlation can be explained using neutral gas column densities – a low column density of neutral gas will lead to less scattering of Ly\textalpha photons out of the line of sight, thereby resulting in both a high observed (Ly\textalpha) as well as low velocity offsets from systemic. Low neutral gas density environments are also though to be conducive to the escape of LyC photons from a galaxy (at least along the same line of sight as Ly\textalpha). Therefore, both Ly\textalpha velocity offsets and/or escape fractions can be important to ascertain the escape of ionizing photons from galaxies that drive reionization.
In the following sections we explore correlations between various galaxy properties and each of Ly\textalpha velocity offset and (Ly\textalpha) to establish dependencies and/or observational biases that impact the Ly\textalpha strength and line profile in LAEs at .
4.2 Insights from Lyman-alpha velocity offsets
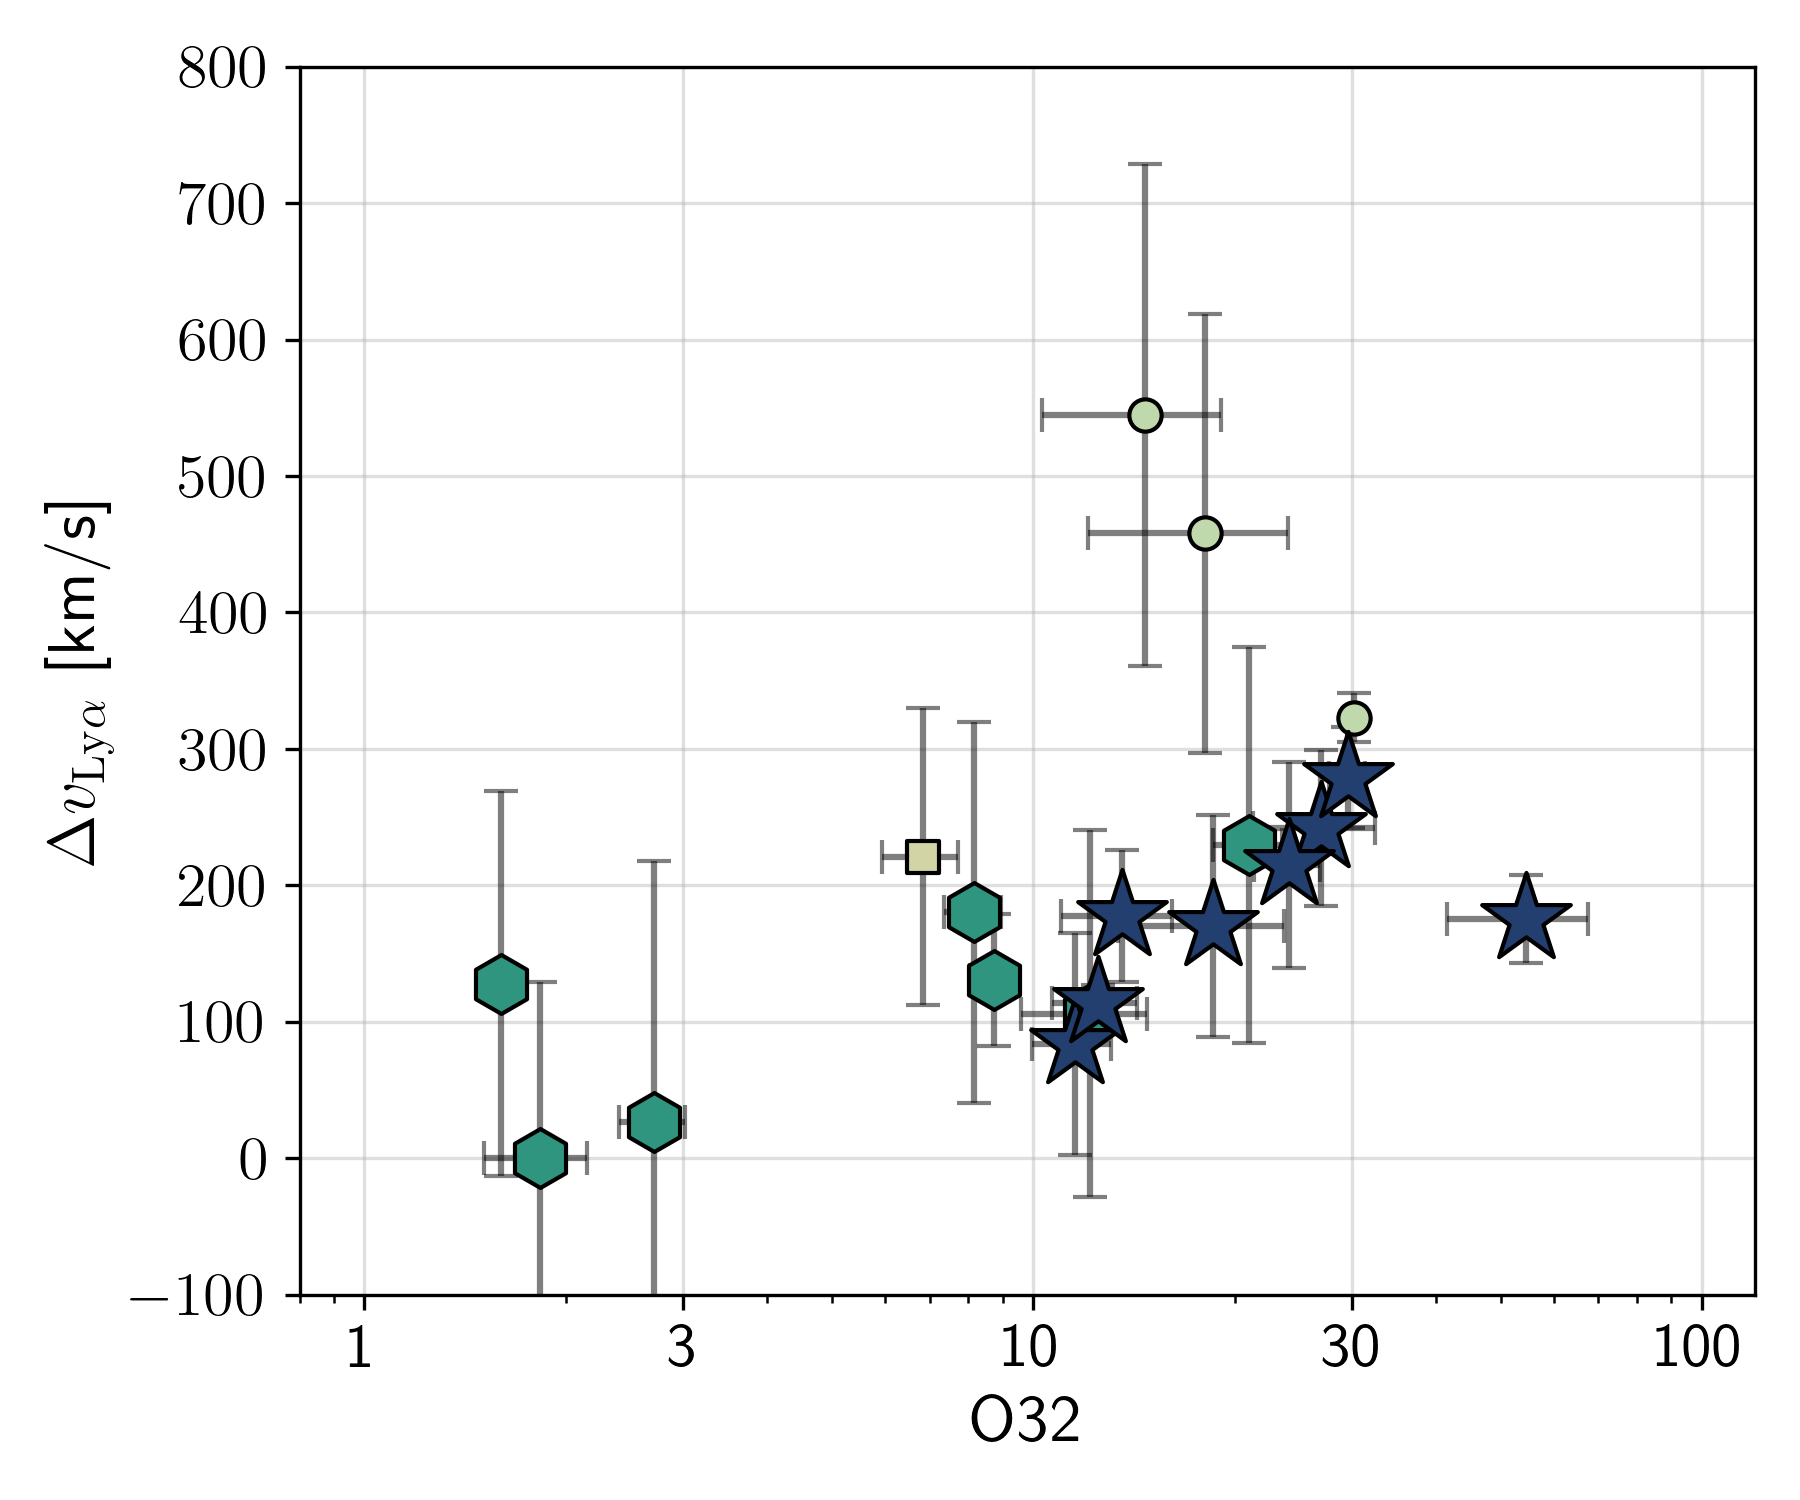
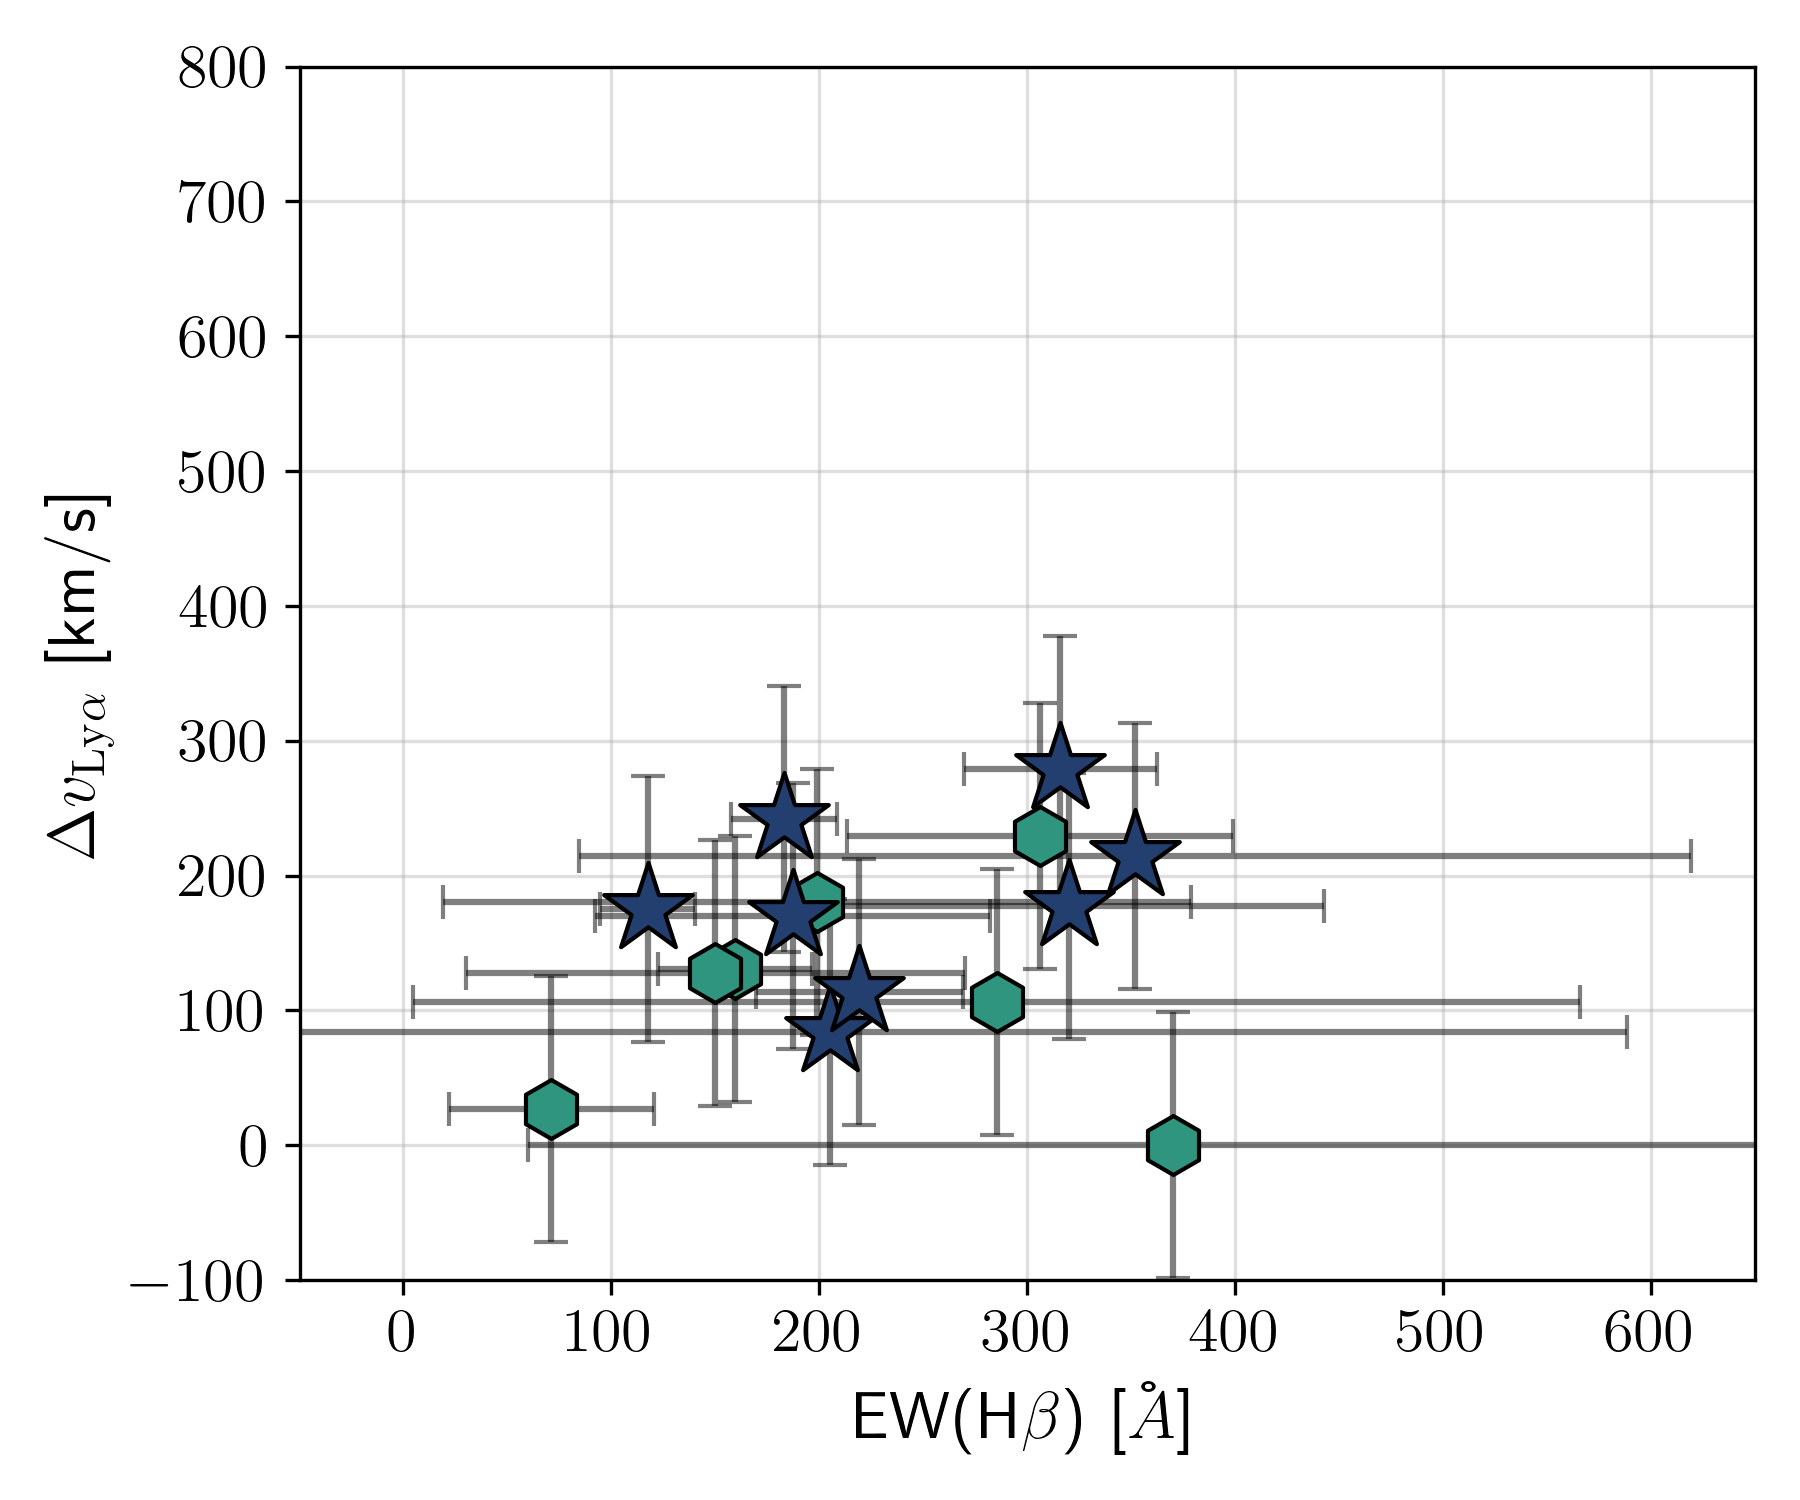
In Figure 6 we compare the Ly\textalpha velocity offsets observed for our sample of galaxies with other observables that trace both the underlying stellar populations as well as the state of the ISM. We also include measurements of brighter LAEs in the EoR from the literature to increase the baseline of any trends that may become apparent.
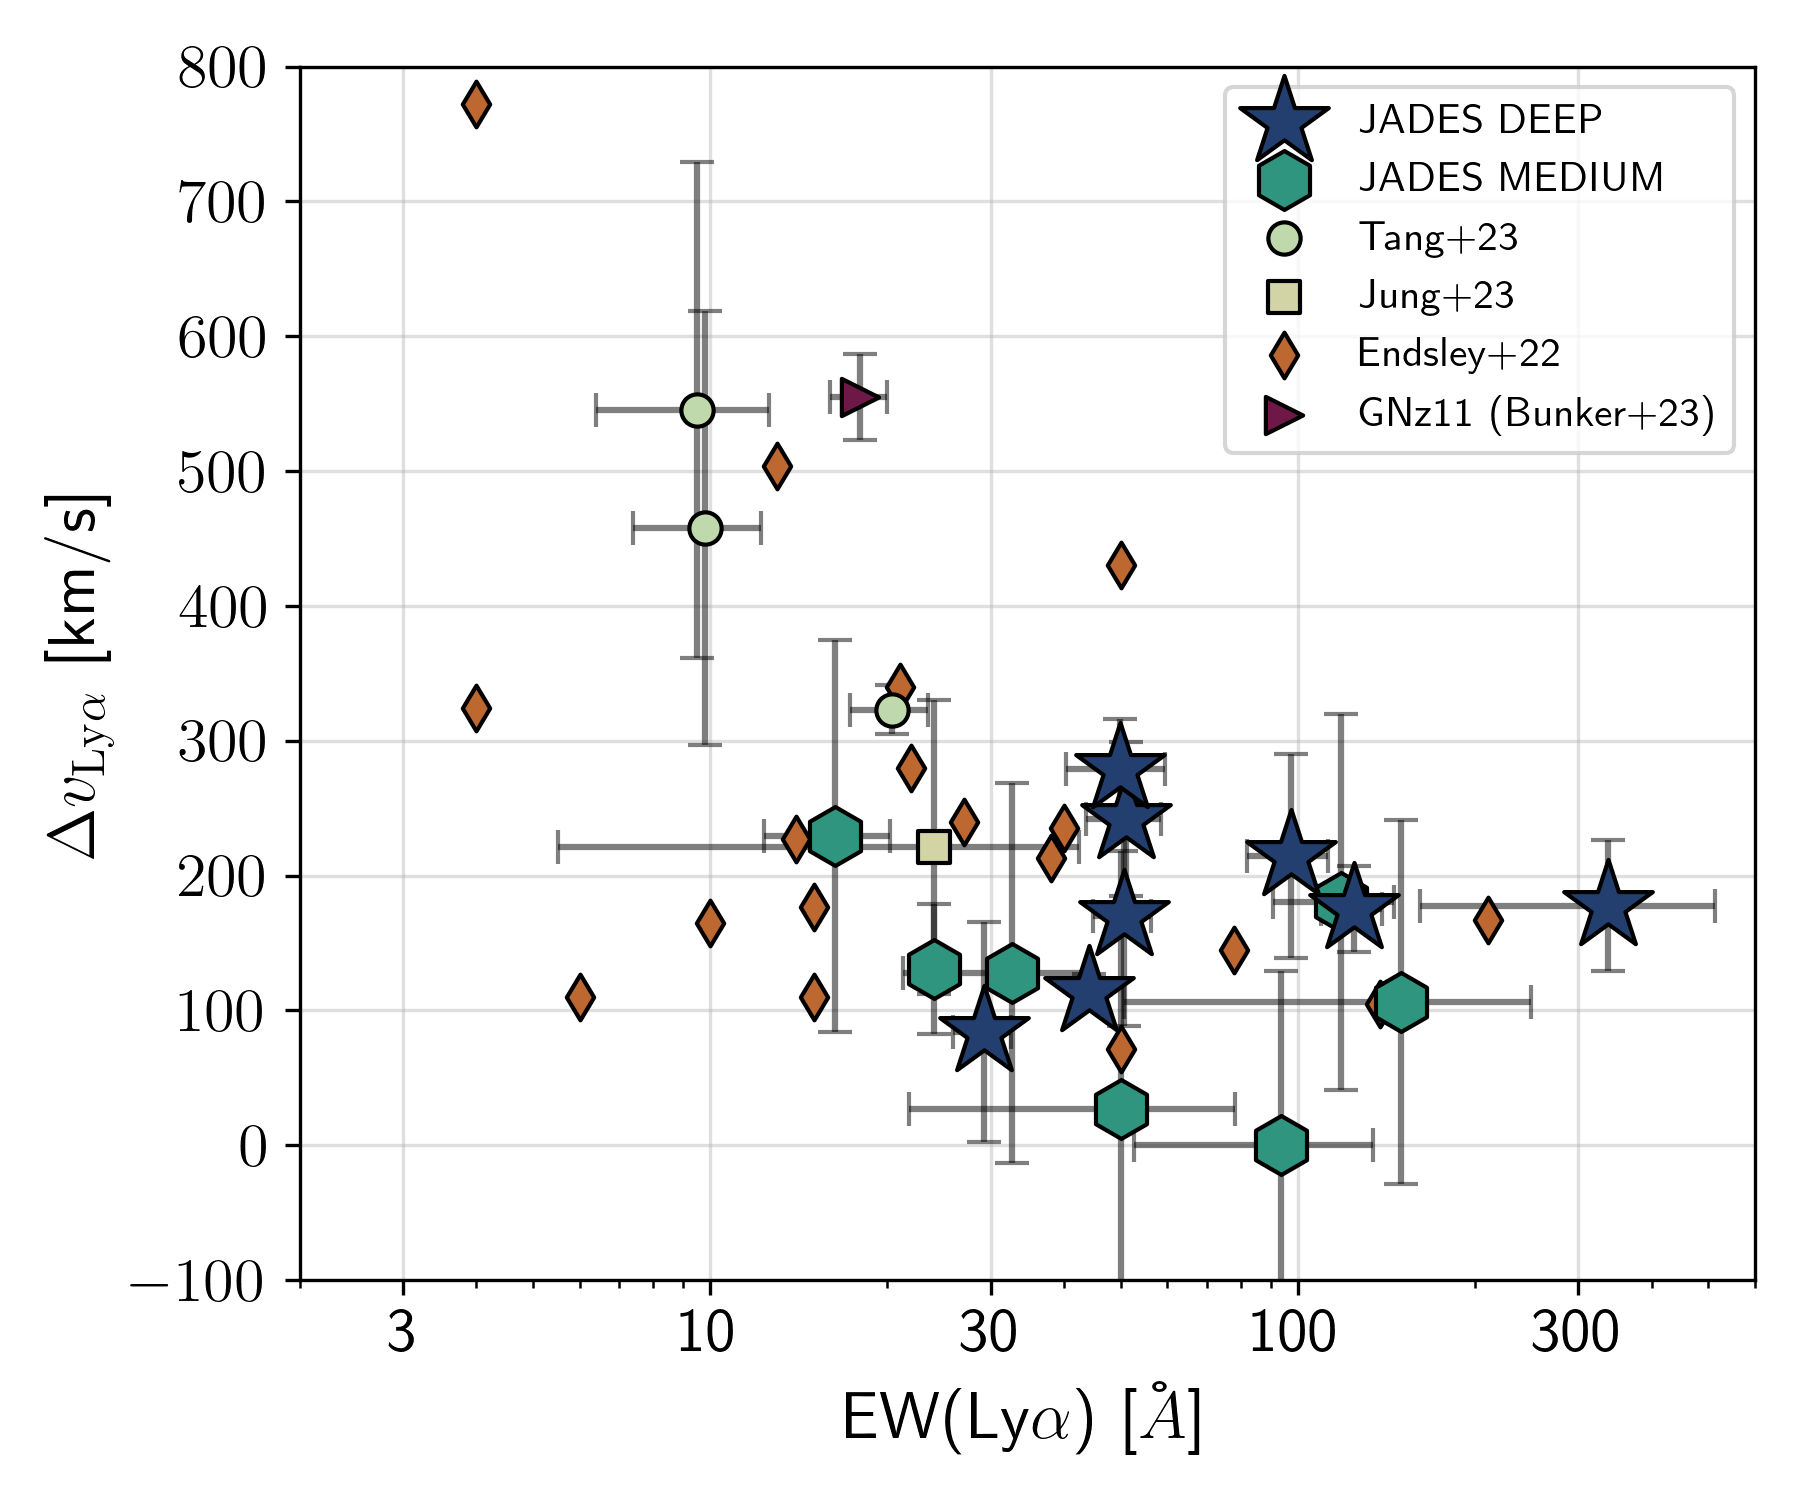
We find that the Ly\textalpha velocity offsets anti-correlate with EW(Ly\textalpha) as shown in Figure 6 (top-left), which has previously been reported in the literature across redshifts (e.g. Izotov et al., 2021). This anti-correlation mainly stems from the resonant scattering of Ly\textalpha photons by the neutral gas within the galaxies – a higher velocity offset compared to the systemic redshift is indicative of more resonant scattering of the emergent Ly\textalpha photons, which results in decreased Ly\textalpha flux observed along the line-of-sight. Therefore, the same scattering mechanism is responsible for increased offset from systemic velocity as well as the reduction of EW(Ly\textalpha) across galaxies.
With high EW Ly\textalpha emission that peaks close to the systemic redshift likely tracing low covering fractions of neutral gas, galaxies that exhibit such Ly\textalpha profiles and strengths are also likely to be leaking significant amounts of LyC photons (Verhamme et al., 2015, 2017). For the sample of UV-faint LAEs probed by the JADES sample presented in this paper, we find the equivalent widths to be higher and the velocity offsets to be lower compared to UV-bright LAEs in the literature (Figure 6, top-right), which may indicate that UV-fainter LAEs could be more likely to host conditions required for efficient Ly\textalpha as well as LyC escape, which we will explore in detail in the later sections.
Particularly within the context of ionized bubbles within which LAEs in the EoR must reside to be able to freely transmit Ly\textalpha photons along the line of sight, smaller velocity offsets are also expected to trace large ionized bubble sizes (see Mason & Gronke, 2020; Saxena et al., 2023, for example), which would lead to considerably less attenuation by the intervening IGM and therefore, higher transmission of Ly\textalpha leading to high equivalent width measurements.
Comparing the Ly\textalpha offset with spectroscopic indicators of the ionization parameter (i.e. the ratio of ionizing photons to the hydrogen density) probed by indicators like the O32 ratio, we do not find any strong correlations between the two quantities (Figure 6, bottom-left). A high O32 ratio has been proposed as an indicator for both high Ly\textalpha and LyC escape (e.g. Izotov et al., 2021) and we do find that our UV-faint LAEs with small velocity offsets on average show high O32 ratios. However, given a lack of strong correlation between O32 and Ly\textalpha velocity offset we conclude that high O32 ratios are a necessary but not a sufficient condition for efficient ionizing photon escape (see also Choustikov et al., 2023).
We similarly do not find any strong correlation between Ly\textalpha velocity offset and EW(H\textbeta), which is a good tracer for star-formation rates and consequently the production rates of Hydrogen ionizing photons (Figure 6, bottom-right) and has been proposed as a robust indicator of (LyC) (e.g. Zackrisson et al., 2013; Flury et al., 2022b). The requirement of a relatively high EW(H\textbeta) is perhaps similar in nature to the requirement of high O32 from LyC leaking galaxies, necessary but insufficient on its own to enable efficient LyC escape.
4.3 Insights from the Lyman-alpha escape fraction
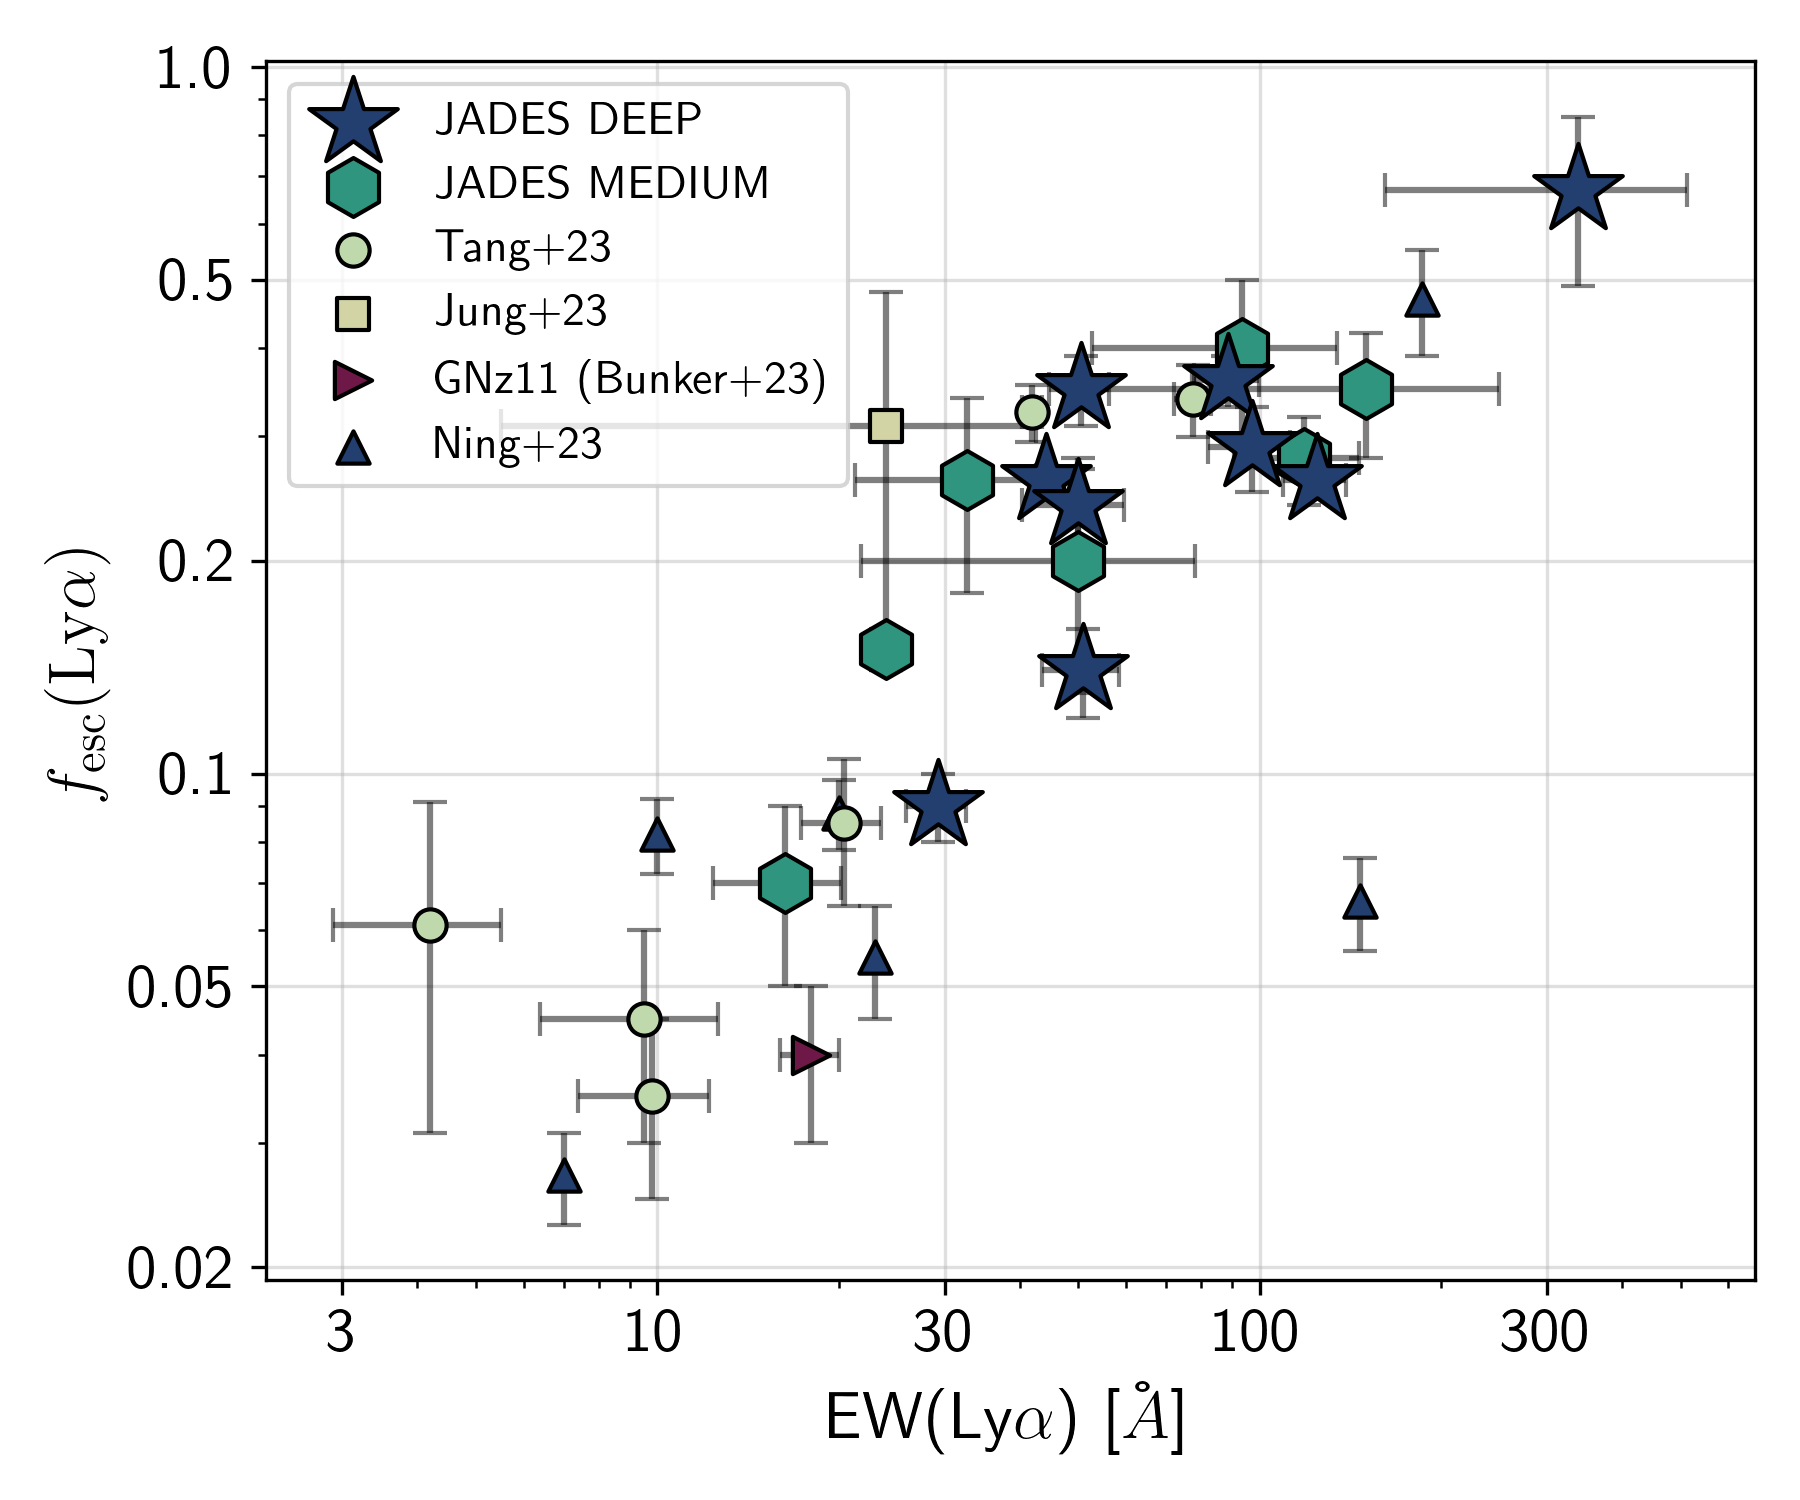
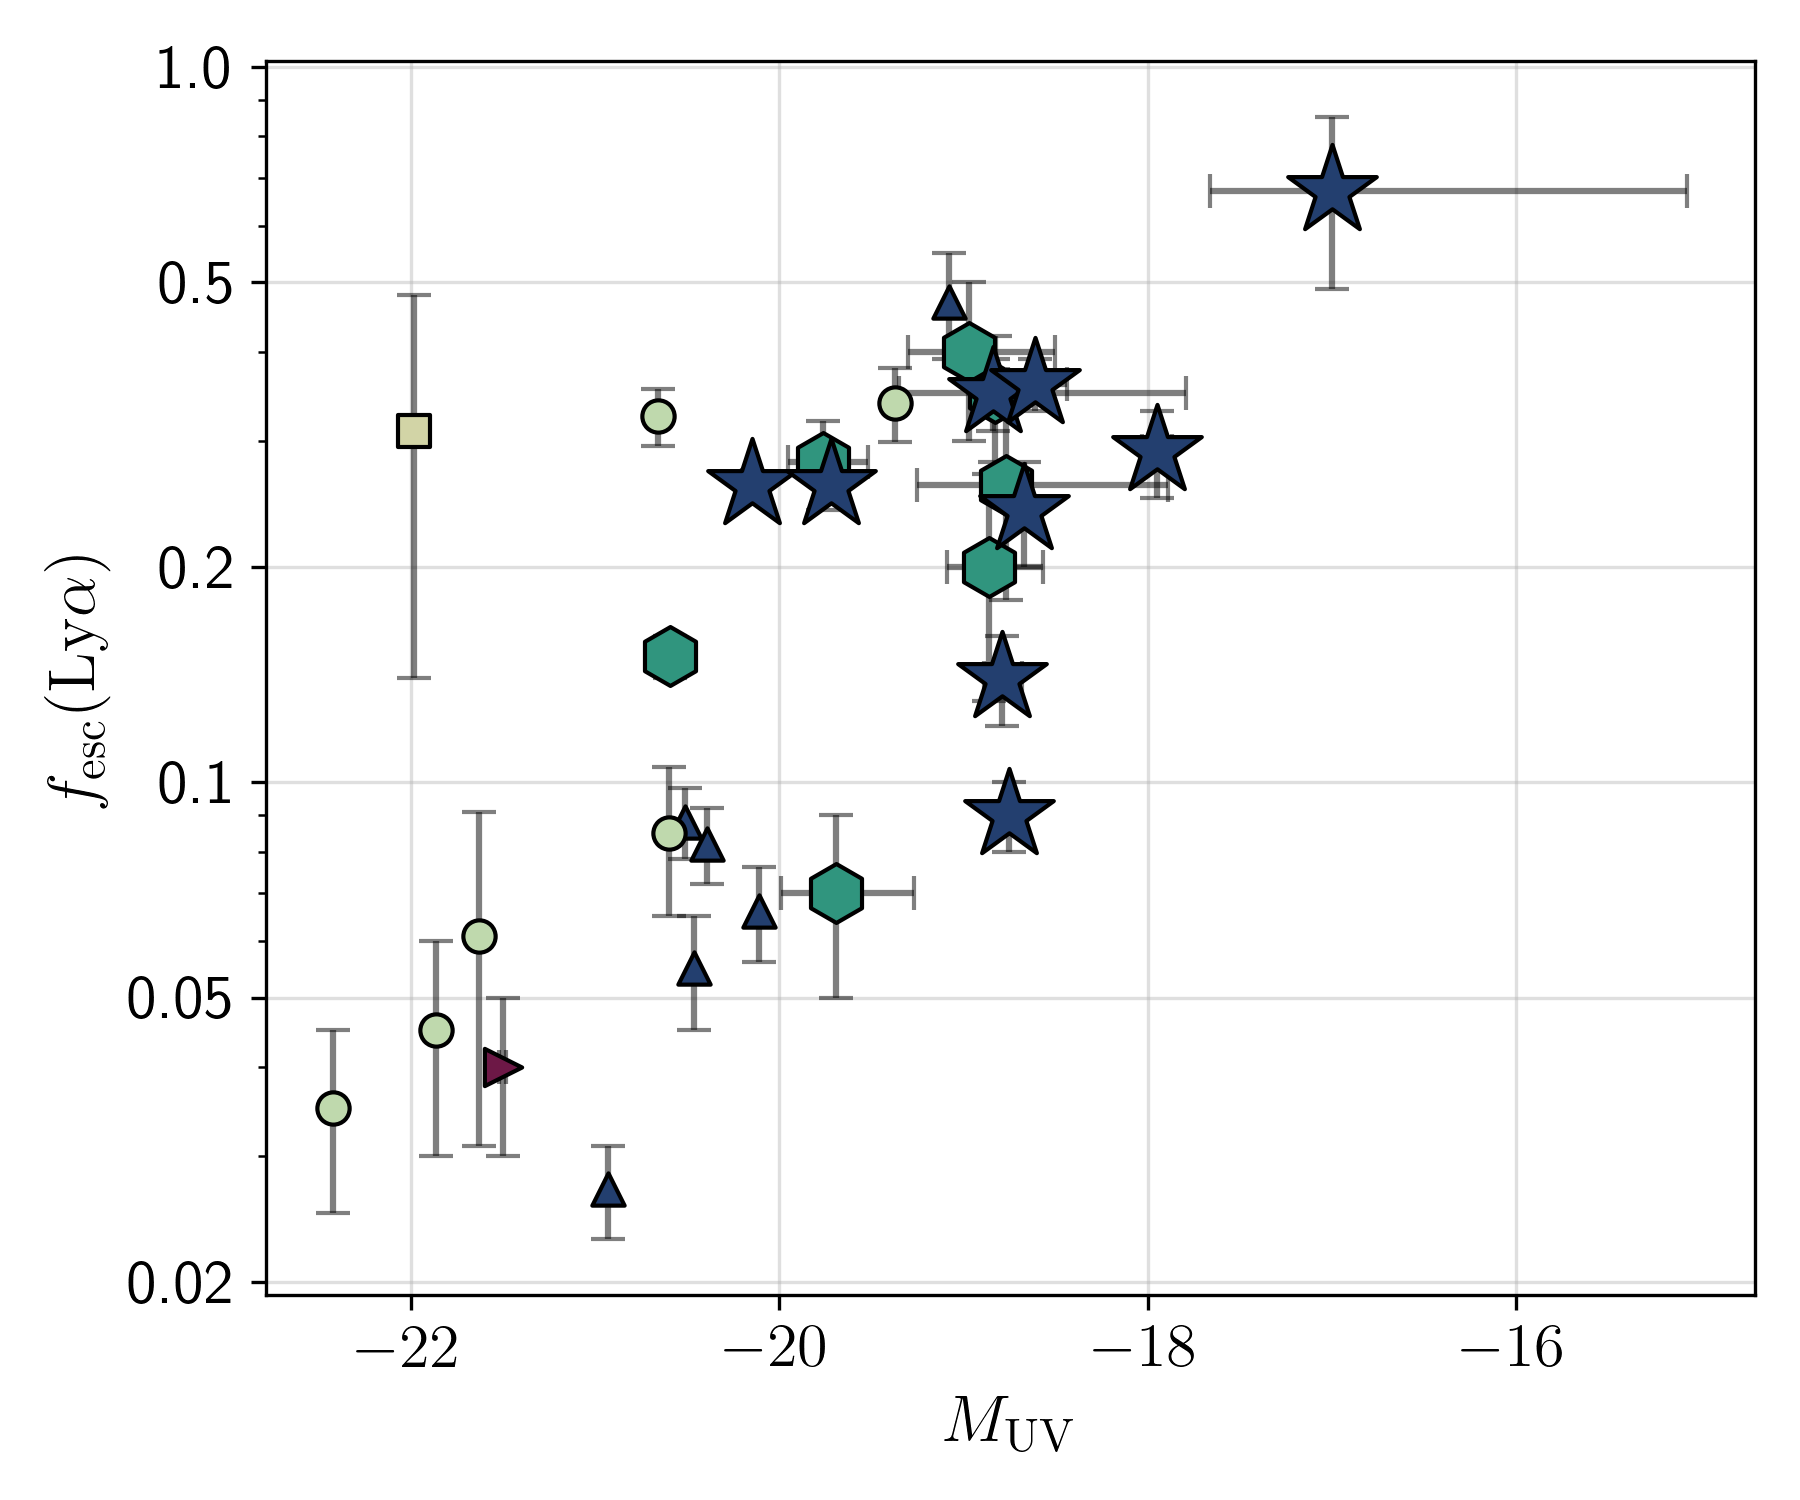

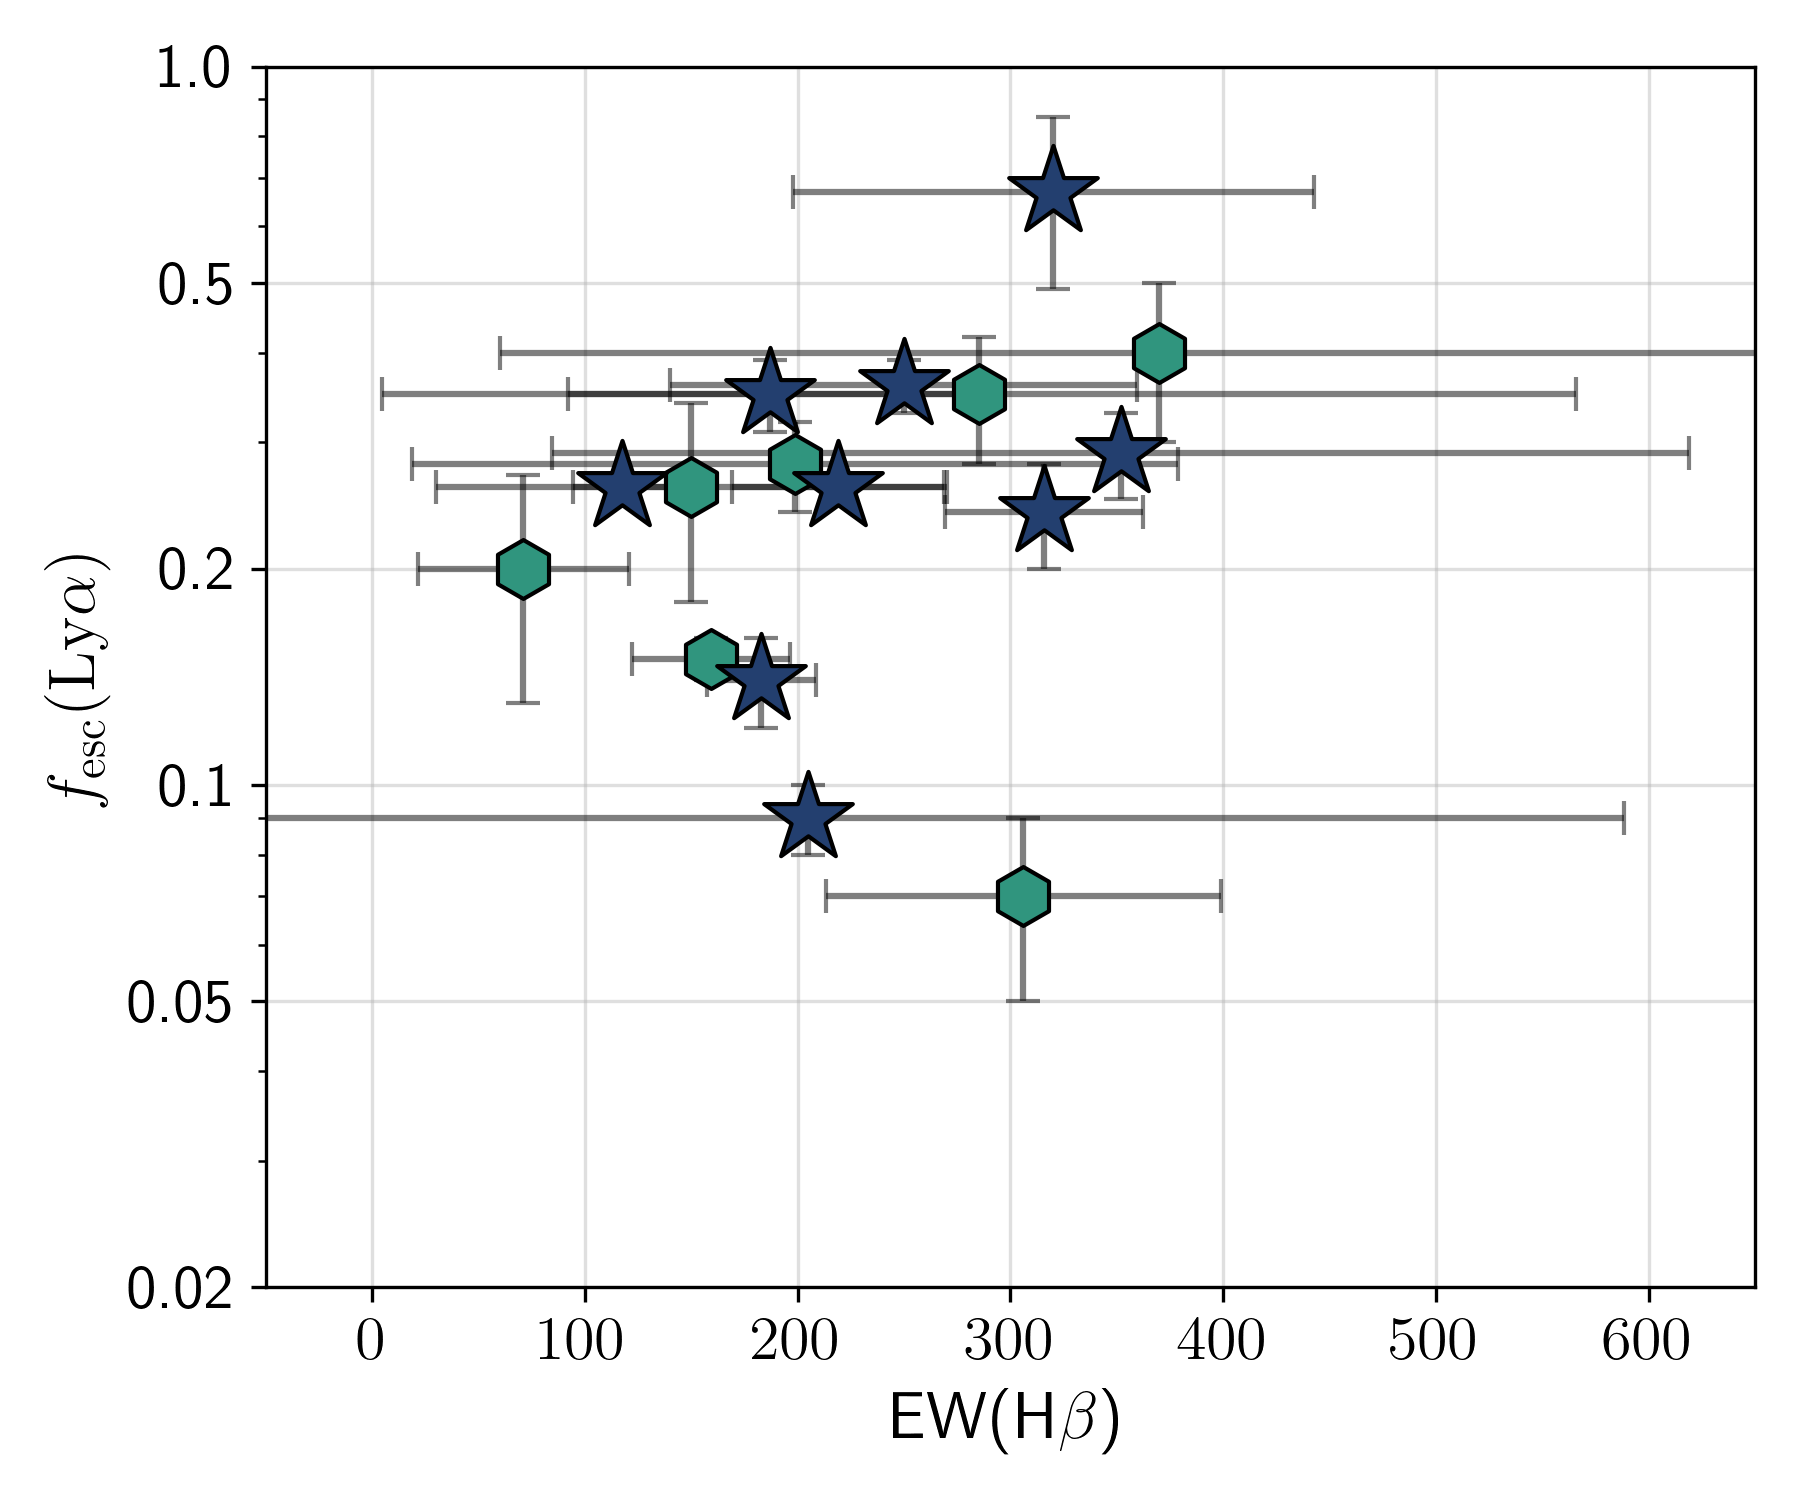
We now explore the dependence of (Ly\textalpha) measured directly from the spectra with other galaxy properties and show the dependence of (Ly\textalpha) on EW(Ly\textalpha), , O32 and EW(H\textbeta) in Figure 7.
We find a strong correlation between (Ly\textalpha) and EW(Ly\textalpha) (Figure 7, top-left). Since (Ly\textalpha) is calculated using the observed ratio of Ly\textalpha to H\textalpha (or H\textbeta) emission, this strong correlation suggests that the H\textalpha (or H\textbeta) line fluxes do not scale in proportion with the Ly\textalpha emission in LAEs with with higher EW Ly\textalpha emission.
We note that the observed (Ly\textalpha) (as well as EW) increases consistently with decreasing UV magnitudes (top-right), which may be indicative of decreasing neutral gas covering fractions that potentially play a more important role in dictating the strength of the observed Ly\textalpha emission than the intrinsic production of ionizing photons. However, We note that the lack of low (Ly\textalpha) (or low EW(Ly\textalpha)) detections from the faintest galaxies may also be a consequence of the flux limited nature of the spectroscopic data used in this study. It is also worth noting that the lack of high (Ly\textalpha) observations from the UV-brightest galaxies is once again indicative of increasing neutral gas fractions in more luminous/massive systems, which likely attenuates and/or scatters the Ly\textalpha flux along the line-of-sight.
Comparing with O32 and EW(H\textbeta), we find that neither of these quantities correlates strongly with (Ly\textalpha) across our sample. We note that high O32 ratios and/or EW(H\textbeta) are perhaps needed to have a higher chance of observing high (Ly\textalpha), but there is considerable scatter in the O32 ratios that we measure for our LAEs, with some LAEs showing O32 . Therefore, the O32 ratio may not be a good predictor of the expected (Ly\textalpha) (and consequently LyC) from galaxies in the reionization era.
4.4 Role of the IGM in attenuating Lyman-alpha emission at
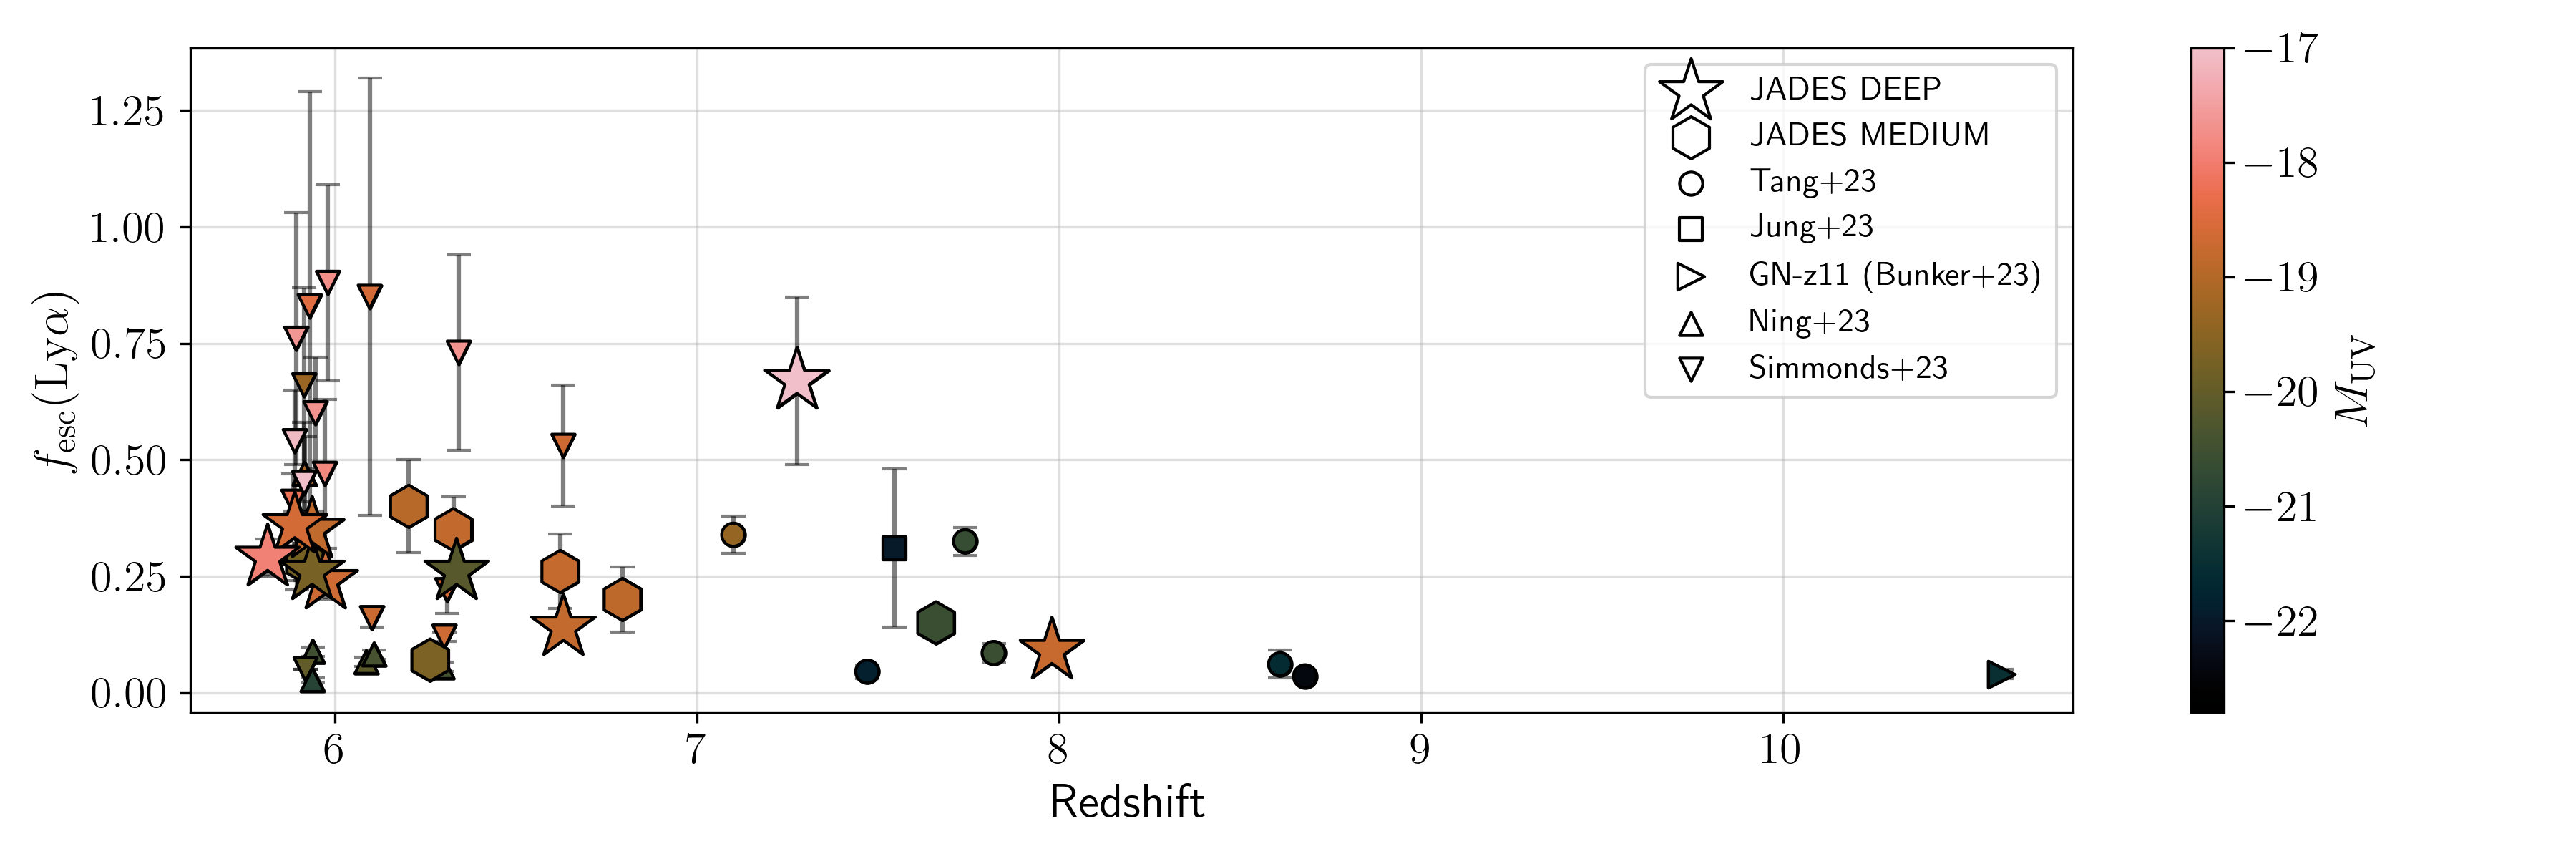
Finally in this section, we look at the evolution of (Ly\textalpha) with redshift, focusing particularly on where the IGM is expected to play a dominant role in attenuating Ly\textalpha emission, unless the LAEs live in large ionized bubbles. In Figure 8 we show (Ly\textalpha) as a function of redshift, colour-coded by for our LAEs along with others known at . A sharp decrease in the (Ly\textalpha) is clearly apparent.
It is also interesting to note that at any given redshift, UV-fainter galaxies exhibit higher (Ly\textalpha), as we had previously noted. The question that arises from this is, what is driving the decrease of (Ly\textalpha) with redshift? Is the increasing neutrality of the IGM with redshift more dominant than the observational biases associated with being able to only observe UV-bright galaxies at high redshifts from flux limited studies?
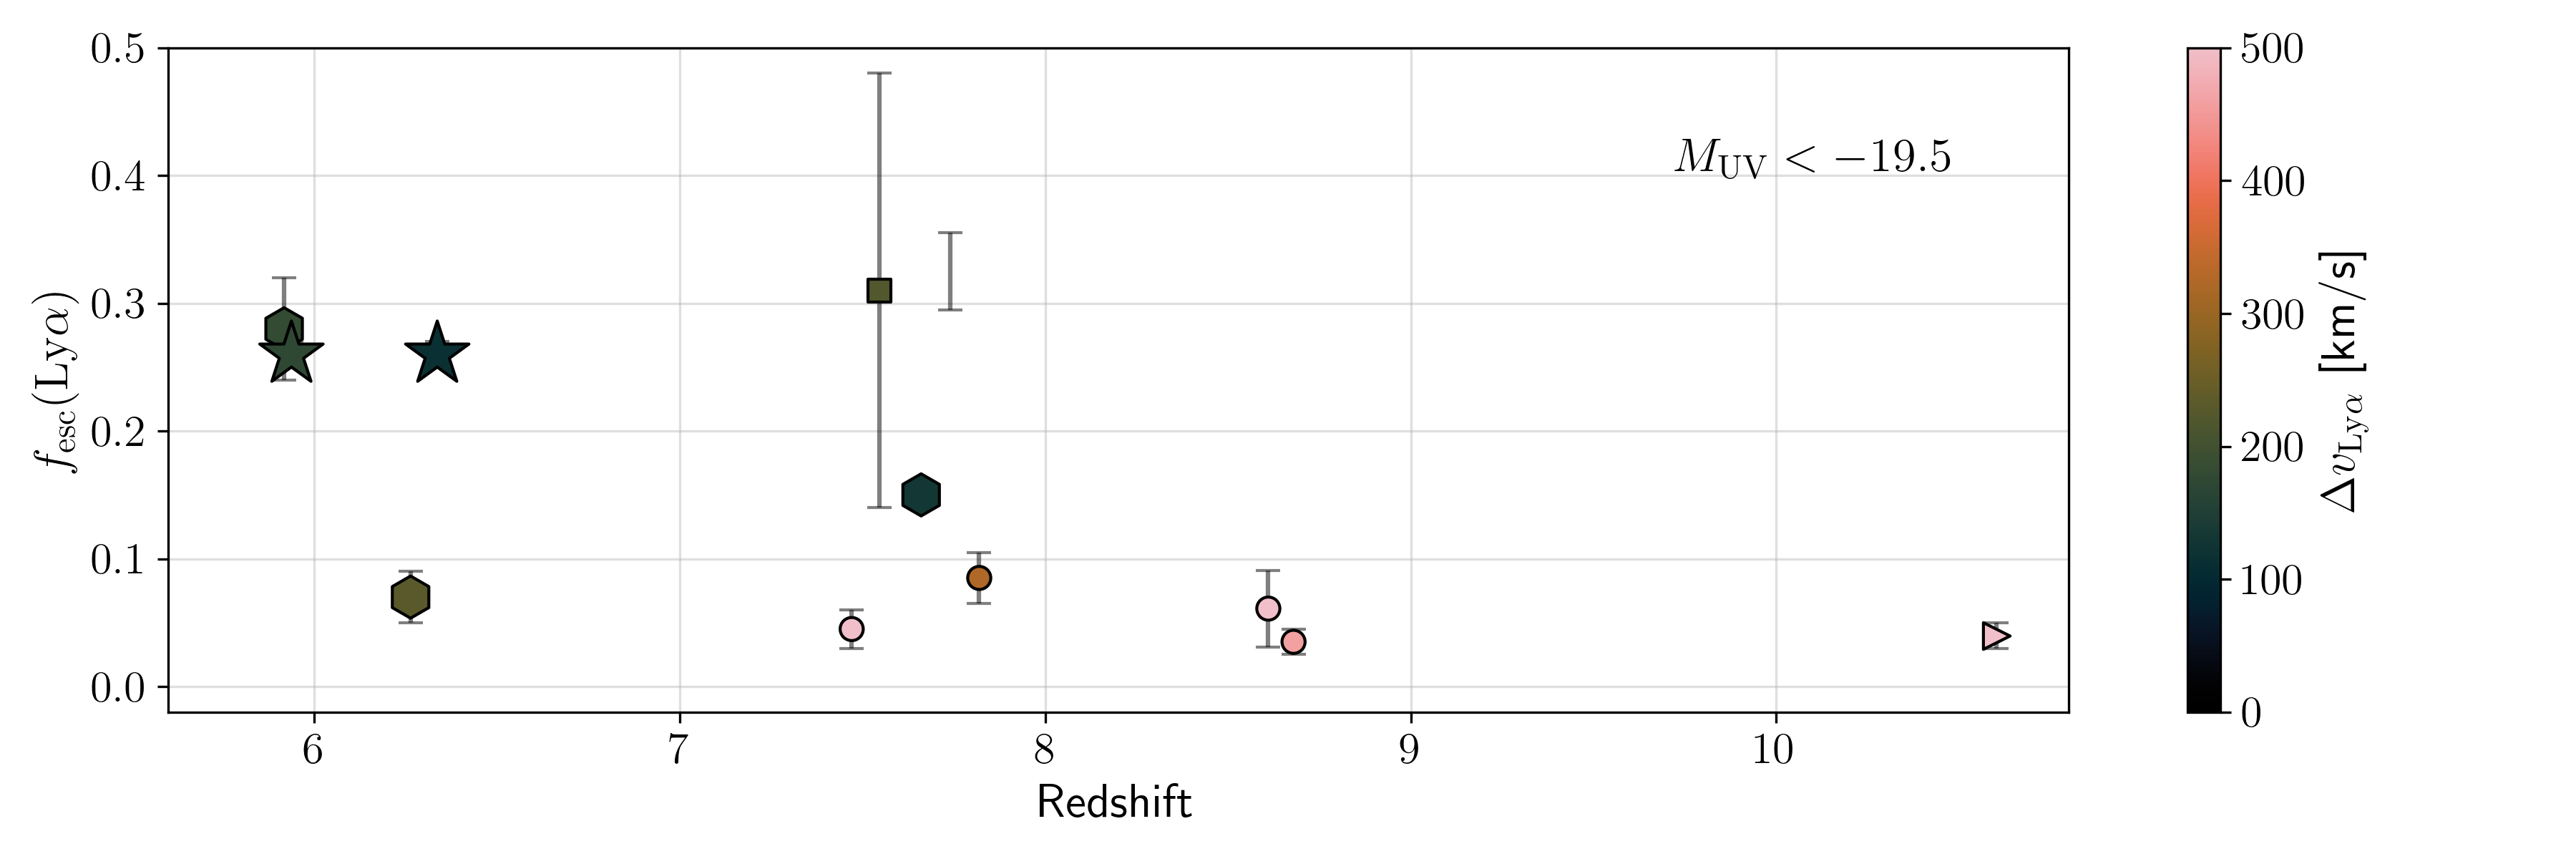
To explore this effect, in Figure 9 we show the (Ly\textalpha) as a function of redshift for only the UV-brightest galaxies with (arbitrarily chosen) to study the evolution in a more flux complete sample of LAEs across a large redshift baseline. This time around, we colour code the data points with Ly\textalpha velocity offset, which is a good proxy for the size of the ionized bubble around the LAE.
Figure 9 clearly shows that for UV-bright galaxies at , the decrease in (Ly\textalpha) is accompanied by an increasing Ly\textalpha velocity offset at the highest redshifts, indicating that the decline of EW(Ly\textalpha) seen with redshift in UV-bright LAEs is driven by the reduction in the sizes of the ionized bubbles traced by the Ly\textalpha velocity offset from systemic redshift. This demonstrates that increased IGM attenuation at the highest redshifts is playing an important role in the observed evolution of EW(Ly\textalpha), at least within the UV-brightest sample, by attenuating the emergent Ly\textalpha flux and the measured .
Therefore, a combination of selection effects as well as increasingly neutral IGM, which manifests itself as smaller ionized bubbles around LAEs at the highest redshifts play an important role in regulating (Ly\textalpha). Estimates on the sizes of ionized regions around JADES LAEs have been presented in a companion paper (Witstok et al. submitted) and offer a powerful probe of the spatial as well as temporal evolution of the IGM neutral fraction in this field.
The comparisons we have presented in this section demonstrate that to use Ly\textalpha emission to infer significant LyC photon leakage from galaxies in the reionization era, both high (Ly\textalpha) and low Ly\textalpha velocity offsets compared to systemic redshift are required. We have found that the dependence of both quantities on other spectroscopic and photometric galaxy properties are filled with complexity and are impacted by observational biases (most importantly the flux limited nature of spectroscopic observations in a field). However, the detection of Ly\textalpha emission from a galaxy is a powerful probe nonetheless at identifying LyC leakage, as has also been noted at lower redshifts (Verhamme et al., 2017; Izotov et al., 2021; Saxena et al., 2022a).
In the next section we attempt to move beyond a simple (Ly\textalpha) and use all of the available spectroscopic and photometric indicators to estimate (LyC), which is the quantity that is needed to capture the contribution of galaxies to the reionization budget of the Universe at .
5 Implications for LyC photon production, escape and reionization
Although the presence of strong Ly\textalpha emission peaking close to the systemic velocity has been used to infer high LyC escape fractions (Verhamme et al., 2015; Izotov et al., 2021; Naidu et al., 2022), the physics that control the escape of LyC photons from star-forming galaxies are much more complicated (e.g. Dijkstra, 2014; Barrow et al., 2020; Katz et al., 2020; Garel et al., 2021; Maji et al., 2022; Choustikov et al., 2023). The neutral gas content within a galaxy, in particular, can affect the Ly\textalpha and LyC photons differently, which combined with the line-of-sight dependence of both Ly\textalpha and LyC photon escape can often complicate the inference of LyC photon escape from Ly\textalpha alone. For example, one of the most well-studied LyC leakers, Ion1 at (Vanzella et al., 2012; Ji et al., 2020) actually does not show any Ly\textalpha emission, which demonstrates the complex relationship between Ly\textalpha and LyC photons.
Therefore, in this section we fold in other photometric and spectroscopic properties of our faint LAEs to make a more informed inference on the LyC escape fractions. Several observational studies as well as simulations have attempted to connect the leakage of LyC photons to spectroscopic properties. Some of the most exciting observational results linking LyC leakage to galaxy properties are being delivered by the Low-z Lyman Continuum Survey (LzLCS; Flury et al. 2022a, b). State-of-the-art high-resolution cosmological simulations like sphinx20 are also now being used to study the dependence of LyC photon escape on galaxy properties (e.g. Rosdahl et al., 2022; Katz et al., 2023b; Choustikov et al., 2023), which offers much more control on the sample sizes and selection functions when attempting to use observations of galaxy properties to predict (LyC).
Here we use the relationship between (LyC) and galaxy properties derived by Choustikov et al. (2023) to predict (LyC) for our sample of LAEs. Choustikov et al. (2023) specifically focused on observables that trace conditions within galaxies that enable both the production as well as escape of LyC photons. Briefly, these conditions mainly require the galaxies to have (i) relatively high star-formation rates (sSFR yr-1); (ii) stellar ages in the range Myr, a time long enough for the first generation of supernovae to have cleared out channels in the ISM for LyC escape, while short enough that UV photons are still being produced in abundance by the stellar population, and (iii) low dust and neutral gas content.
Using these criteria, Choustikov et al. (2023) report a six-parameter equation to predict the angle-averaged (and not sight-line dependent) (LyC) based on observed galaxy properties. These parameters include the UV slope, , dust attenuation (typically measured from the Balmer line decrement), H\textbeta line luminosity, , R23 and O32. All of these parameters have been observed for our faint LAEs from JADES, which makes predicting (LyC) using Equation (4) from Choustikov et al. (2023) relatively straightforward. We note that to predict the angle-averaged (LyC), the properties of the Ly\textalpha emission line, which can often be highly sight-line dependent, are not taken into account by Choustikov et al. (2023) when estimating (LyC) (c.f. Maji et al., 2022). The calculated (LyC) for our LAEs are given in Table 4.
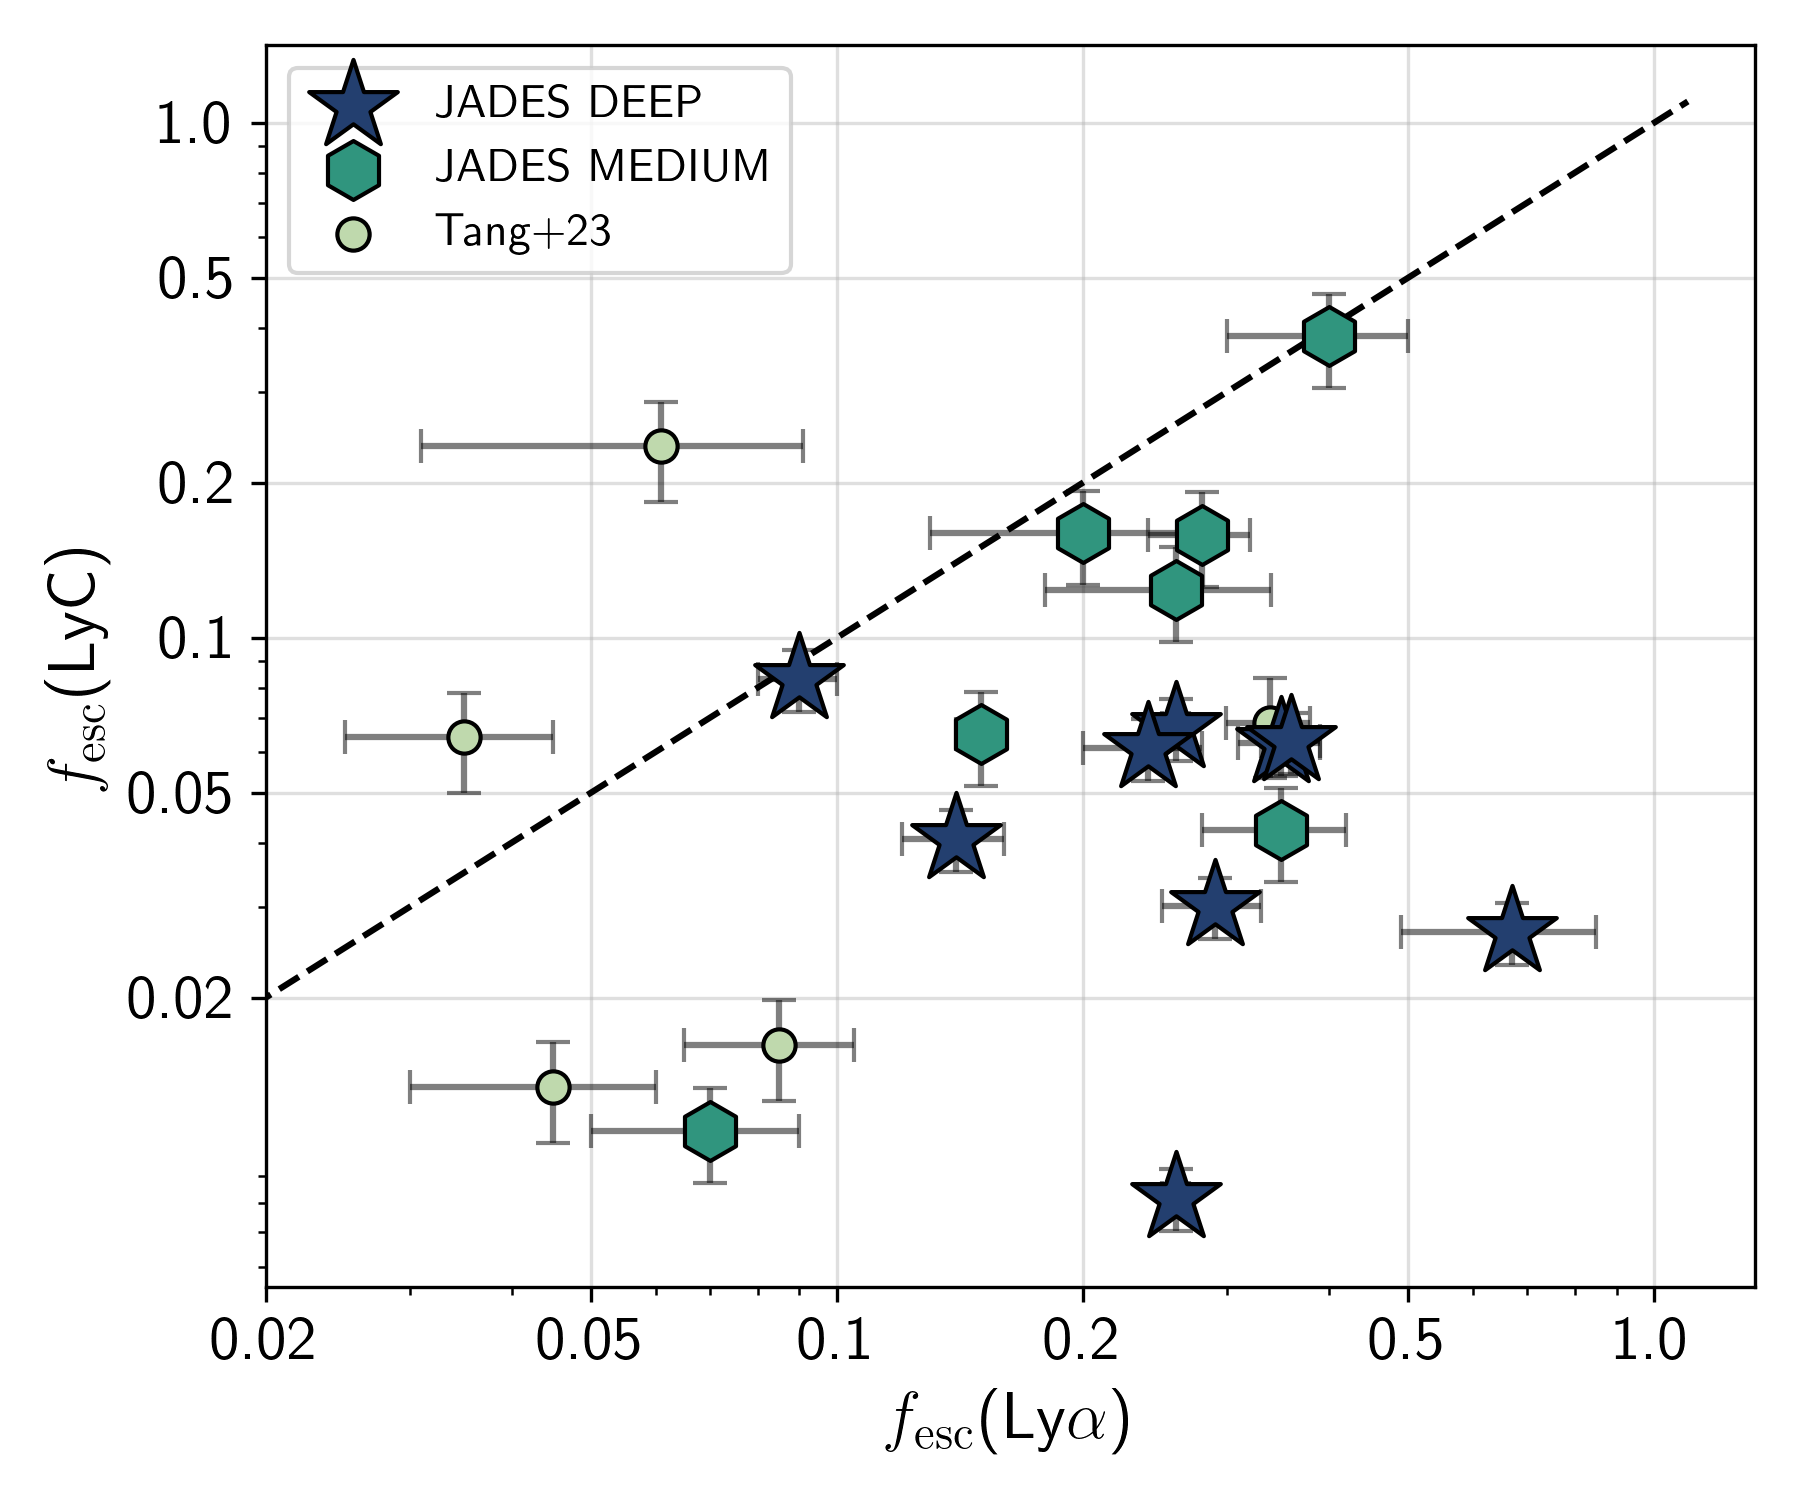
In Figure 10 we show (LyC) calculated using observed galaxy properties compared with (Ly\textalpha) measured directly from the spectra (left) and the Ly\textalpha velocity offset from the systemic (right) from our faint LAEs as well as those that we calculate using observed quantities from Tang et al. (2023). We find that the predicted (LyC) remains below (Ly\textalpha) for all our LAEs, but two LAEs from Tang et al. (2023) have higher (LyC) compared to (Ly\textalpha).
In general we do not find any strong correlation between (LyC) and (Ly\textalpha). We do find, qualitatively, that (LyC) anti-correlates with Ly\textalpha velocity offset, but we note that a low Ly\textalpha velocity offset does not guarantee a high (LyC) and that there is considerable scatter in the plot. From a sample of low redshift LyC leakers, Izotov et al. (2021) also found that (LyC) tends to always be lower than (Ly\textalpha), and that (LyC) weakly anti-correlates with Ly\textalpha velocity offset from systemic, consistent with our findings.
We do, however, note the lack of any LAE with high velocity offsets showing high (LyC), which seems to suggest that low Ly\textalpha velocity offsets are a necessary but not a sufficient condition to enable high LyC photon escape, mainly tracing the absence of high column density neutral gas, and that galaxies that show large Ly\textalpha velocity offsets compared to systemic likely trace highly dense neutral gas conditions, which may not be conducive for significant LyC escape fractions.
Before assessing the co-dependence of ionizing photon production and escape from our faint LAEs, we note that when calculating for our LAEs using Equation (2) in Section 2.8 we assumed (LyC) to be zero. However, with (LyC) predictions for our LAEs, we now calculate , which is corrected for the fraction of ionizing photons that escape out of the galaxy, thereby not contributing towards line emission. In this section going forward, we use the corrected value, .
We now explore the dependence of (LyC) on the corrected ionizing photon production efficiencies in Figure 11. Interestingly, we find that sources with the highest (LyC) do not necessarily show high values of . Interestingly there is a mild anti-correlation between the two quantities, which may be not be entirely unexpected as when non-negligible fractions of ionizing photons begin escaping from the galaxy, there are fewer photons available to produce the Balmer line (as well as strong nebular line) emission (e.g. Topping et al., 2022). This would lead to low values inferred when simply assuming Case-B recombination, which can consistently explain this observed mild anti-correlation.
Another important effect that may be driving the scatter between (LyC) and could be the expected time delays between significant production of ionizing photons and the emergence of escape channels that facilitate the escape of those photons. As noted in Choustikov et al. (2023) (but see also Barrow et al. 2020; Katz et al. 2020), for a burst of star-formation it isn’t up until Myr since the starburst is triggered that supernovae begin to clear channels in the ISM to allow significant LyC photon escape. Very early on in the starburst, there is a very high production rate of ionizing photons, but these photons are unable to escape out of the H ii regions. Therefore, the age of starburst and the time delay between the peak of ionizing photon production and the emergence of escape channels may lead to the observed scatter.
Finally, we explore the dependence of the product of the ionizing photon production efficiency and the ionizing photon escape fraction ((LyC) ), which is an important quantity needed to assess the contribution of individual star-forming galaxies to the reionization budget of the Universe. Since this study has been limited only to strong LAEs at , here we explore the dependence of the ionizing photon output into the IGM as a function of UV magnitude, EW(Ly\textalpha) and redshift, which we show in Figure 12.

We begin by assessing the dependence of log((LyC) ) on UV magnitude, finding that it increases very mildly (with a large scatter) with decreasing as shown in Figure 12 (top-left), following the linear relation:
| (3) |
This lack of strong correlation for LAEs clearly disfavours enhanced ionizing photon output from UV-fainter LAEs, and may have important consequences for models of reionization.
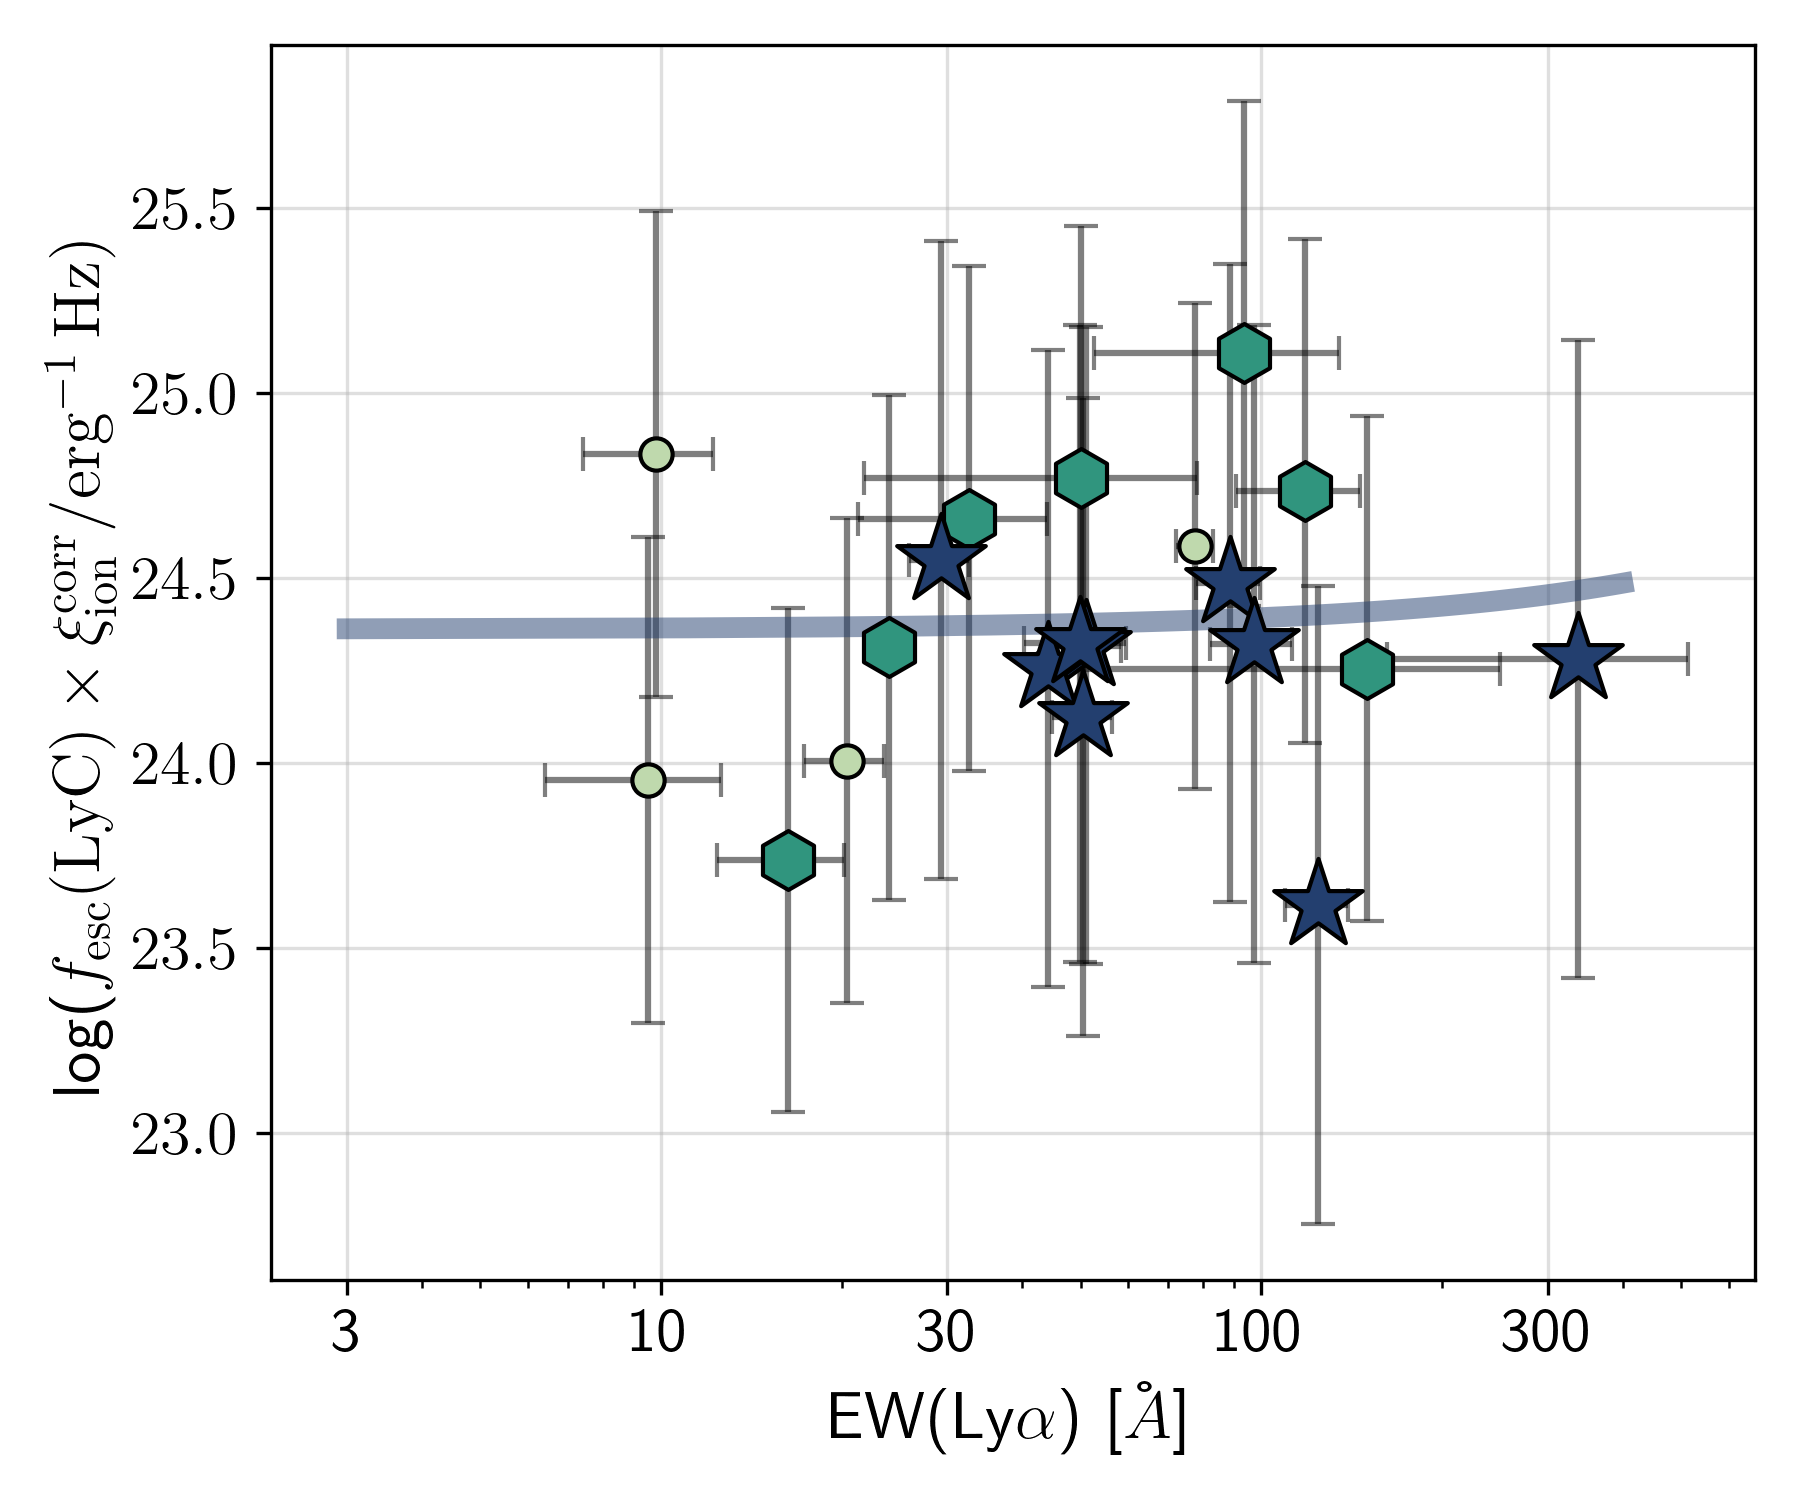
We further find that the ionizing photon output from LAEs also remains roughly constant over a range of EW(Ly\textalpha), best fit with the linear relation:
| (4) |
The little to no dependence of log( ) on the equivalent width of Ly\textalpha emission is shown in Figure 12 (top-right; note that the x-axis is in log scale), implying that purely the observed Ly\textalpha line strength is not a good independent indicator of the ionizing photon output from LAEs in the epoch of reionization.
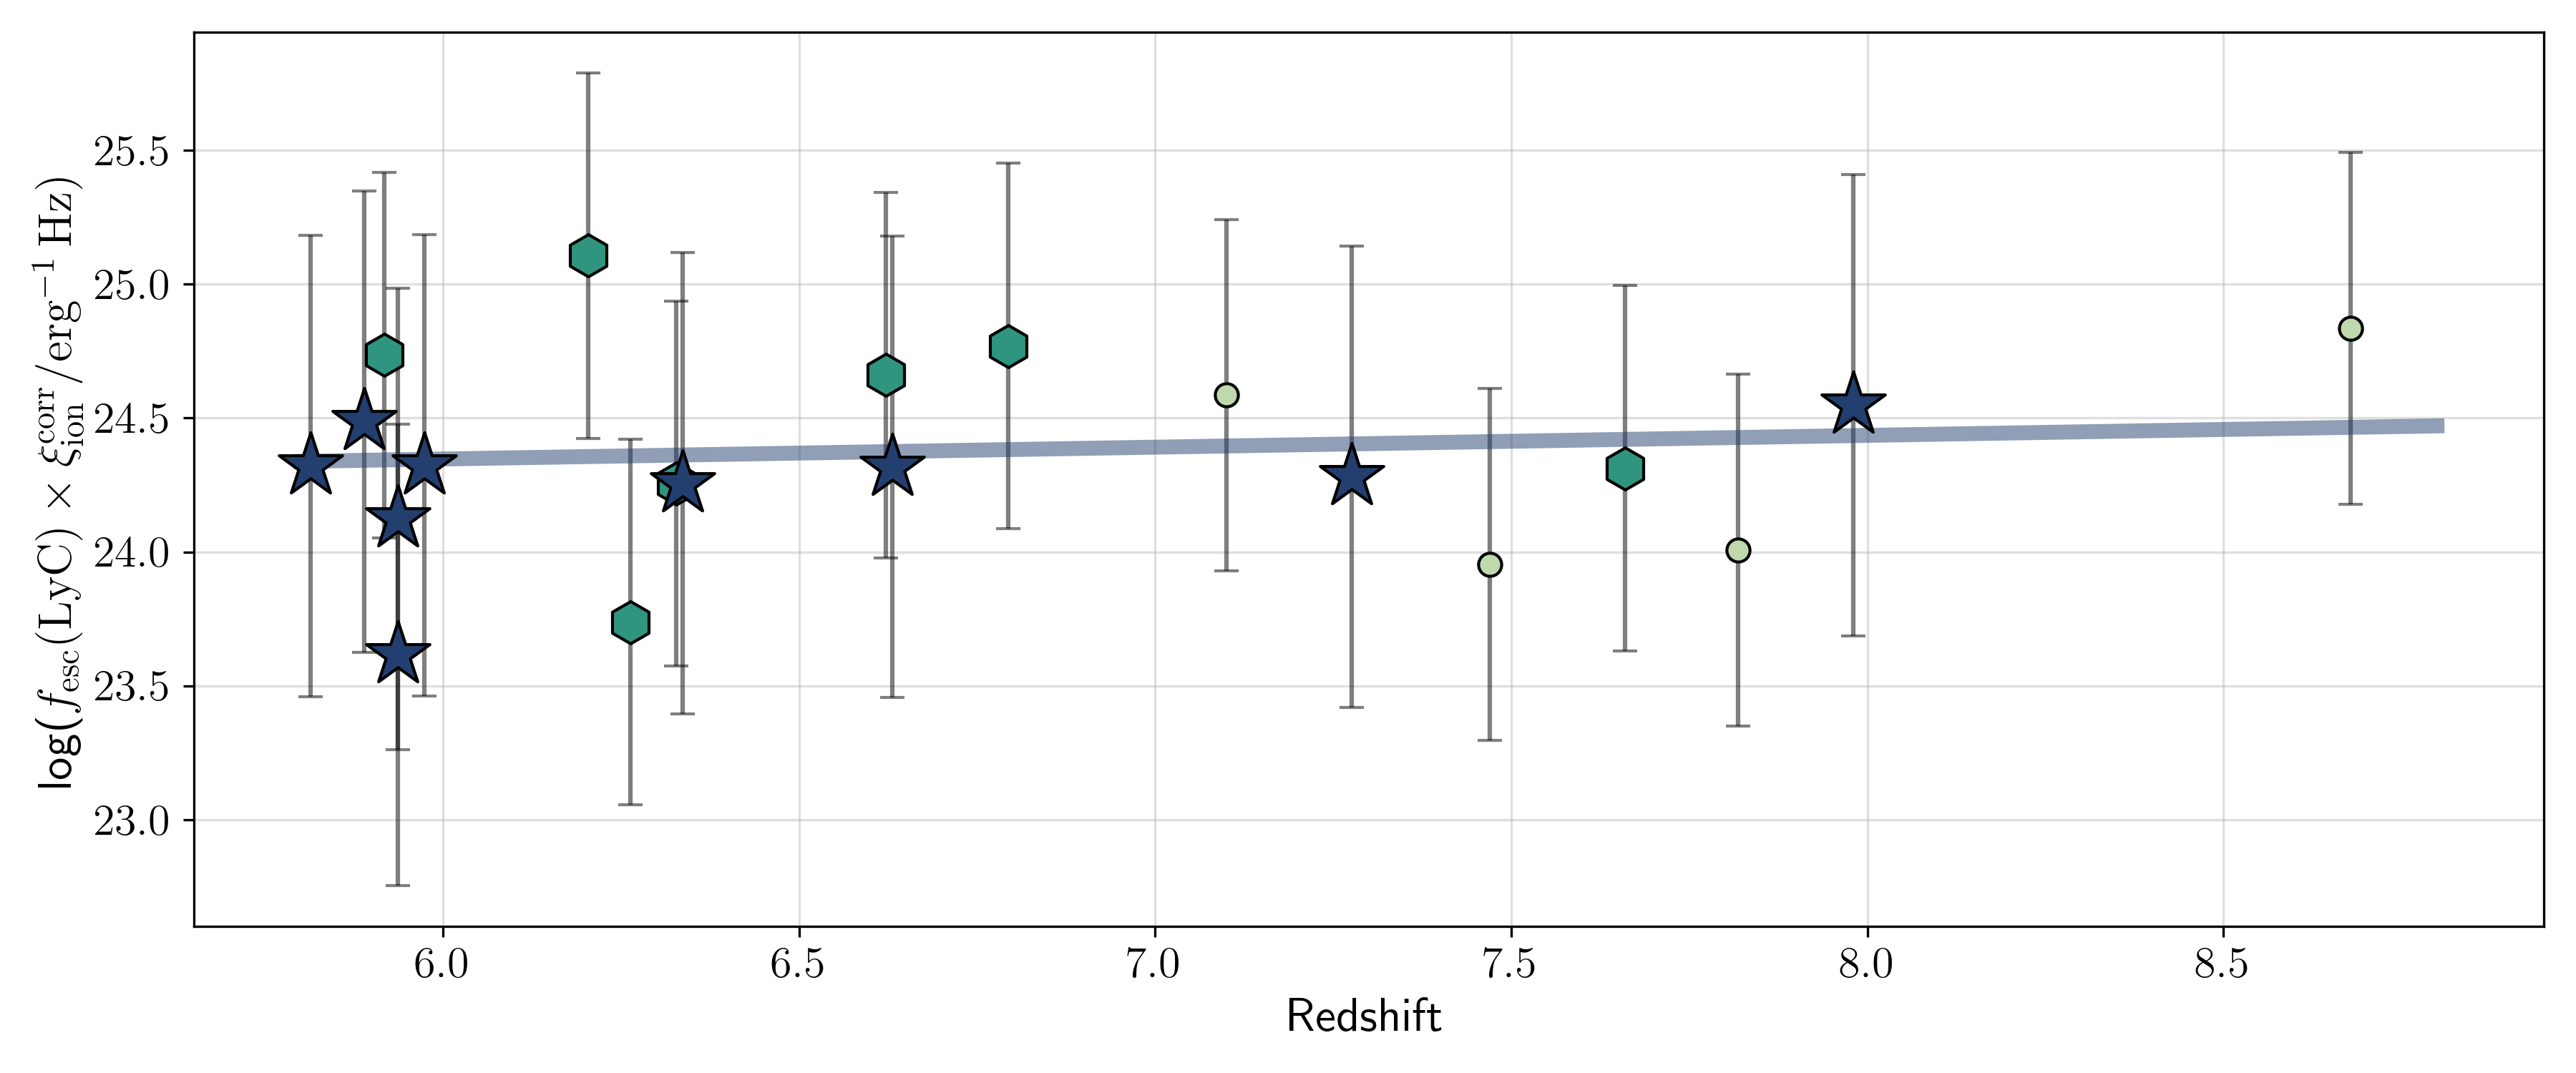
Finally, since our LAEs (combined with those from Tang et al. 2023) cover a large redshift baseline, we also derive the dependence of the ionizing photon output of LAEs with redshift, finding the best-fitting relation:
| (5) |
Once again, we find that the ionizing photon output of LAEs remains roughly constant at as shown in Figure 12 (bottom). This is consistent with a picture whereby the the production and escape of ionizing photons may be dictated by physical processes that operate on shorter timescales (i.e. intense star-formation or SNe activity).
The best-fitting relations of ionizing photon output with UV magnitude Ly\textalpha EW and redshift can be used to estimate the total number of ionizing photons contributed by LAEs at a given redshift, depending on the space density of LAEs. Since the increasing neutrality of the IGM makes it impossible to obtain a complete Ly\textalpha luminosity function at , certain assumptions about the evolution of the Ly\textalpha luminosity function may need to be made (see Matthee et al., 2022, for example).
Alternatively, if a good handle on the Ly\textalpha emitter fraction (unaffected by the IGM attenuation) can be obtained at by extrapolating from fractions measured at lower redshifts (e.g. Santos et al., 2020), then our best-fitting relations can also be used to estimate the total ionizing photon contribution towards the reionization budget from LAEs at . Any dependence of the LAE fraction on UV magnitude must also be taken into account for this calculation (see Jones et al., 2023).
6 Conclusions
In this study we have presented detailed properties of 16 faint Ly\textalpha emitting galaxies at from the JWST Advanced Deep Extragalactic Survey (JADES) Deep and Medium Tier NIRSpec MSA surveys. These new Ly\textalpha emitters, spanning absolute UV magnitudes of to , are generally fainter compared to LAEs that were previously known in or near the epoch of reionization, opening up a new window into studying the properties of faint galaxies that reside within ionized bubbles in the reionization era.
Using measurements directly from the low resolution (R100) PRISM as well as medium resolution (R1000) grating spectra, we report the detection of other rest-frame optical emission lines such as [O ii], H\textbeta, [O iii] and H\textalpha. The detection of these lines enables a reliable measure of their spectroscopic redshift against which the velocity offsets of Ly\textalpha emission can be accurately measured. In general, these LAEs have blue rest-UV spectral slopes ( to ) and little to no dust measured from Balmer decrements.
Using rest-optical line ratios, we find that our LAEs appear to be metal poor with high ionization parameters, properties that are typical of JWST-detected faint star-forming galaxies at . These properties combined with steep UV slopes and no dust indicate that all of our LAEs are young, star-forming systems. We further measure the ionizing photon production efficiencies () directly from Balmer line emission and find that our LAEs on average have log(/Hz erg, which does not seem to evolve strongly with redshift. We also do not find a strong dependence of on the strength of Ly\textalpha emission.
Using the Ly\textalpha escape fraction (calculated using Balmer line emission) and the velocity offset of the peak of the Ly\textalpha line compared to systemic redshift, we study the galaxy properties that govern the escape of Ly\textalpha photons from reionization era galaxies. We note that the escape fraction of Ly\textalpha photons is anti-correlated with the Ly\textalpha velocity offset as well as Ly\textalpha equivalent width, consistent with expectations from Ly\textalphaemission models as well as high-resolution galaxy simulations employing radiative transfer to track the escape of Ly\textalpha emission.
We also find that LAEs that are fainter in the UV show higher Ly\textalpha escape fractions, although this could be attributed to the flux limited nature of our spectroscopic surveys. We do not find strong correlations between Ly\textalpha escape fraction or velocity offset with key ISM indicators such as [O iii]/[O ii] ratios or H\textbeta equivalent widths. We conclude that the escape of Ly\textalpha emission is a complicated process, and may not necessarily depend strongly on the state of the ISM and stellar populations at any given time, especially at when the IGM attenuation also plays an important role.
We find a gradual decrease in Ly\textalpha escape fractions with redshift, indicative of increasing IGM attenuation in diminishing Ly\textalpha strengths at the highest redshifts. By making a UV cut to remove selection effects, we find that the Ly\textalpha escape fraction still evolves weakly with redshift, but the escaping Ly\textalpha emission is considerably more offset compared to systemic velocity at the highest redshifts, indicative of decreasing ionized fractions and sizes of the bubbles that must surround these LAEs.
Making use of several photometric and spectroscopic indicators for our LAEs, we then predict escape fractions of hydrogen ionizing Lyman continuum photons. We find that with the exception of one LAE in our sample, the LyC escape fraction is always lower than the Ly\textalpha escape fraction, with no significant correlations between the two. We also do not find any significant correlation between LyC escape fraction and , which can likely explained by the reduced Balmer line emission in the presence of significant ionizing photon escape or by time delays between the production and escape of ionizing photons.
By combining the production and escape of LyC photons (i.e. ), we find that the quantity that is actually responsible for delivering ionizing photons from the galaxies to the IGM remains relatively consistent across UV magnitudes and EW(Ly\textalpha), but increases gradually with redshift. Using these dependencies and assumptions about the Ly\textalpha emitter fraction at any given redshift, more realistic models of reionization can be constructed.
Deeper and wider spectroscopic surveys in the future will help expand the samples of known LAEs in the reionization era. The availability of other spectroscopic indicators tracing the nature of stellar populations, ISM ionization and chemical conditions would be key to assess the role of Ly\textalpha emitting galaxies in driving cosmic reionization, helping build more realistic models charting the reionization history of the Universe.
Acknowledgements.
AS thanks Harley Katz, Richard Ellis, Jorryt Matthee and Anne Verhamme for insightful discussions. AS, AJB, GCJ, AJC and JC acknowledge funding from the “FirstGalaxies” Advanced Grant from the European Research Council (ERC) under the European Union’s Horizon 2020 research and innovation programme (Grant agreement No. 789056). JW, RM, MC, TJL, LS & JS acknowledge support by the Science and Technology Facilities Council (STFC), ERC Advanced Grant 695671 ”QUENCH”. JW also acknowledges support from the Fondation MERAC. SA acknowledges support from the research project PID2021-127718NB- I00 of the Spanish Ministry of Science and Innovation/State Agency of Research (MICIN/AEI). RB acknowledges support from an STFC Ernest Rutherford Fellowship (ST/T003596/1). KB acknowledges support from the Australian Research Council Centre of Excellence for All Sky Astrophysics in 3 Dimensions (ASTRO 3D), through project number CE170100013. SC acknowledges support by European Union’s HE ERC Starting Grant No. 101040227 - ”WINGS”. ECL acknowledges support of an STFC Webb Fellowship (ST/W001438/1). DJE is supported as a Simons Investigator and by JWST/NIRCam contract to the University of Arizona, NAS5- 02015. BDJ, BER and MR acknowledge support from the NIRCam Science Team contract to the University of Arizona, NAS5-02015. RS acknowledges support from a STFC Ernest Rutherford Fellowship (ST/S004831/1). The work of CCW is supported by NOIR-Lab, which is managed by the Association of Universities for Research in Astronomy (AURA) under a cooperative agreement with the National Science Foundation. This work is based on observations made with the NASA/ESA/CSA James Webb Space Telescope. The data were obtained from the Mikulski Archive for Space Telescopes at the Space Telescope Science Institute, which is operated by the Association of Universities for Research in Astronomy, Inc., under NASA contract NAS 5-03127 for JWST. These observations are associated with program #1180 and #1210.References
- Aihara et al. (2011) Aihara, H., Allende Prieto, C., An, D., et al. 2011, ApJS, 193, 29
- Ajiki et al. (2003) Ajiki, M., Taniguchi, Y., Fujita, S. S., et al. 2003, AJ, 126, 2091
- Arellano-Córdova et al. (2022) Arellano-Córdova, K. Z., Berg, D. A., Chisholm, J., et al. 2022, ApJ, 940, L23
- Atek et al. (2008) Atek, H., Kunth, D., Hayes, M., Östlin, G., & Mas-Hesse, J. M. 2008, A&A, 488, 491
- Barrow et al. (2020) Barrow, K. S. S., Robertson, B. E., Ellis, R. S., et al. 2020, ApJ, 902, L39
- Böker et al. (2023) Böker, T., Beck, T. L., Birkmann, S. M., et al. 2023, arXiv e-prints, arXiv:2301.13766
- Bolan et al. (2022) Bolan, P., Lemaux, B. C., Mason, C., et al. 2022, MNRAS, 517, 3263
- Bosman et al. (2022) Bosman, S. E. I., Davies, F. B., Becker, G. D., et al. 2022, MNRAS, 514, 55
- Bouwens et al. (2022) Bouwens, R. J., Smit, R., Schouws, S., et al. 2022, ApJ, 931, 160
- Bunker et al. (2023) Bunker, A. J., Cameron, A. J., Curtis-Lake, E., et al. 2023, JADES NIRSpec Initial Data Release for the Hubble Ultra Deep Field: Redshifts and Line Fluxes of Distant Galaxies from the Deepest JWST Cycle 1 NIRSpec Multi-Object Spectroscopy
- Bunker et al. (2023) Bunker, A. J., Saxena, A., Cameron, A. J., et al. 2023, arXiv e-prints, arXiv:2302.07256
- Calzetti et al. (1994) Calzetti, D., Kinney, A. L., & Storchi-Bergmann, T. 1994, ApJ, 429, 582
- Cameron et al. (2023) Cameron, A. J., Saxena, A., Bunker, A. J., et al. 2023, arXiv e-prints, arXiv:2302.04298
- Carniani et al. (2017) Carniani, S., Maiolino, R., Pallottini, A., et al. 2017, A&A, 605, A42
- Carniani et al. (2018) Carniani, S., Maiolino, R., Smit, R., & Amorín, R. 2018, ApJ, 854, L7
- Caruana et al. (2012) Caruana, J., Bunker, A. J., Wilkins, S. M., et al. 2012, MNRAS, 427, 3055
- Caruana et al. (2014) Caruana, J., Bunker, A. J., Wilkins, S. M., et al. 2014, MNRAS, 443, 2831
- Castellano et al. (2022) Castellano, M., Pentericci, L., Cupani, G., et al. 2022, A&A, 662, A115
- Choustikov et al. (2023) Choustikov, N., Katz, H., Saxena, A., et al. 2023, arXiv e-prints, arXiv:2304.08526
- Cuby et al. (2003) Cuby, J. G., Le Fèvre, O., McCracken, H., et al. 2003, A&A, 405, L19
- Curti et al. (2023) Curti, M., D’Eugenio, F., Carniani, S., et al. 2023, MNRAS, 518, 425
- Curtis-Lake et al. (2023) Curtis-Lake, E., Carniani, S., Cameron, A., et al. 2023, Nature Astronomy [arXiv:2212.04568]
- Dayal & Ferrara (2018) Dayal, P. & Ferrara, A. 2018, Phys. Rep, 780, 1
- Dijkstra (2014) Dijkstra, M. 2014, PASA, 31, e040
- Eisenstein et al. (2023) Eisenstein, D. J., Willott, C., Alberts, S., et al. 2023, Overview of the JWST Advanced Deep Extragalactic Survey (JADES)
- Endsley et al. (2022a) Endsley, R., Stark, D. P., Bouwens, R. J., et al. 2022a, MNRAS, 517, 5642
- Endsley et al. (2022b) Endsley, R., Stark, D. P., Whitler, L., et al. 2022b, arXiv e-prints, arXiv:2208.14999
- Fan et al. (2006) Fan, X., Carilli, C. L., & Keating, B. 2006, ARA&A, 44, 415
- Feltre et al. (2020) Feltre, A., Maseda, M. V., Bacon, R., et al. 2020, A&A, 641, A118
- Ferruit et al. (2022) Ferruit, P., Jakobsen, P., Giardino, G., et al. 2022, A&A, 661, A81
- Fletcher et al. (2019) Fletcher, T. J., Tang, M., Robertson, B. E., et al. 2019, ApJ, 878, 87
- Flury et al. (2022a) Flury, S. R., Jaskot, A. E., Ferguson, H. C., et al. 2022a, ApJS, 260, 1
- Flury et al. (2022b) Flury, S. R., Jaskot, A. E., Ferguson, H. C., et al. 2022b, ApJ, 930, 126
- Fujimoto et al. (2023) Fujimoto, S., Arrabal Haro, P., Dickinson, M., et al. 2023, arXiv e-prints, arXiv:2301.09482
- Fuller et al. (2020) Fuller, S., Lemaux, B. C., Bradač, M., et al. 2020, ApJ, 896, 156
- Furlanetto et al. (2006) Furlanetto, S. R., Zaldarriaga, M., & Hernquist, L. 2006, MNRAS, 365, 1012
- Furusawa et al. (2016) Furusawa, H., Kashikawa, N., Kobayashi, M. A. R., et al. 2016, ApJ, 822, 46
- Garel et al. (2021) Garel, T., Blaizot, J., Rosdahl, J., et al. 2021, MNRAS, 504, 1902
- Giavalisco et al. (2004) Giavalisco, M., Ferguson, H. C., Koekemoer, A. M., et al. 2004, ApJ, 600, L93
- Gordon et al. (2003) Gordon, K. D., Clayton, G. C., Misselt, K. A., Landolt, A. U., & Wolff, M. J. 2003, ApJ, 594, 279
- Haiman (2002) Haiman, Z. 2002, ApJ, 576, L1
- Harikane et al. (2018) Harikane, Y., Ouchi, M., Shibuya, T., et al. 2018, ApJ, 859, 84
- Hashimoto et al. (2019) Hashimoto, T., Inoue, A. K., Mawatari, K., et al. 2019, PASJ, 71, 71
- Hayes et al. (2013) Hayes, M., Östlin, G., Schaerer, D., et al. 2013, ApJ, 765, L27
- Hayes et al. (2023) Hayes, M. J., Runnholm, A., Scarlata, C., Gronke, M., & Rivera-Thorsen, T. E. 2023, MNRAS, 520, 5903
- Hayes & Scarlata (2023) Hayes, M. J. & Scarlata, C. 2023, arXiv e-prints, arXiv:2303.03160
- Hoag et al. (2019) Hoag, A., Bradač, M., Huang, K., et al. 2019, ApJ, 878, 12
- Inoue et al. (2014) Inoue, A. K., Shimizu, I., Iwata, I., & Tanaka, M. 2014, MNRAS, 442, 1805
- Izotov et al. (2021) Izotov, Y. I., Worseck, G., Schaerer, D., et al. 2021, MNRAS, 503, 1734
- Jakobsen et al. (2022) Jakobsen, P., Ferruit, P., Alves de Oliveira, C., et al. 2022, A&A, 661, A80
- Ji et al. (2020) Ji, Z., Giavalisco, M., Vanzella, E., et al. 2020, ApJ, 888, 109
- Jones et al. (2023) Jones, G. C., Bunker, A. J., Saxena, A., et al. 2023, JADES: The emergence and evolution of Ly-alpha emission & constraints on the IGM neutral fraction
- Jung et al. (2023) Jung, I., Finkelstein, S. L., Arrabal Haro, P., et al. 2023, arXiv e-prints, arXiv:2304.05385
- Katz et al. (2023a) Katz, H., Saxena, A., Cameron, A. J., et al. 2023a, MNRAS, 518, 592
- Katz et al. (2023b) Katz, H., Saxena, A., Rosdahl, J., et al. 2023b, MNRAS, 518, 270
- Katz et al. (2020) Katz, H., Ďurovčíková, D., Kimm, T., et al. 2020, MNRAS, 498, 164
- Keating et al. (2020) Keating, L. C., Weinberger, L. H., Kulkarni, G., et al. 2020, MNRAS, 491, 1736
- Knudsen et al. (2016) Knudsen, K. K., Richard, J., Kneib, J.-P., et al. 2016, MNRAS, 462, L6
- Kuhlen & Faucher-Giguère (2012) Kuhlen, M. & Faucher-Giguère, C.-A. 2012, MNRAS, 423, 862
- Kusakabe et al. (2020) Kusakabe, H., Blaizot, J., Garel, T., et al. 2020, A&A, 638, A12
- Laporte et al. (2017) Laporte, N., Nakajima, K., Ellis, R. S., et al. 2017, ApJ, 851, 40
- Luridiana et al. (2015) Luridiana, V., Morisset, C., & Shaw, R. A. 2015, A&A, 573, A42
- Mainali et al. (2017) Mainali, R., Kollmeier, J. A., Stark, D. P., et al. 2017, ApJ, 836, L14
- Maiolino et al. (2015) Maiolino, R., Carniani, S., Fontana, A., et al. 2015, MNRAS, 452, 54
- Maji et al. (2022) Maji, M., Verhamme, A., Rosdahl, J., et al. 2022, A&A, 663, A66
- Malhotra & Rhoads (2006) Malhotra, S. & Rhoads, J. E. 2006, ApJ, 647, L95
- Mascia et al. (2023) Mascia, S., Pentericci, L., Calabro’, A., et al. 2023, arXiv e-prints, arXiv:2301.02816
- Maseda et al. (2020) Maseda, M. V., Bacon, R., Lam, D., et al. 2020, MNRAS, 493, 5120
- Mason & Gronke (2020) Mason, C. A. & Gronke, M. 2020, MNRAS, 499, 1395
- Mason et al. (2018) Mason, C. A., Treu, T., Dijkstra, M., et al. 2018, ApJ, 856, 2
- Matthee et al. (2022) Matthee, J., Naidu, R. P., Pezzulli, G., et al. 2022, MNRAS, 512, 5960
- Matthee et al. (2017a) Matthee, J., Sobral, D., Best, P., et al. 2017a, MNRAS, 471, 629
- Matthee et al. (2019) Matthee, J., Sobral, D., Boogaard, L. A., et al. 2019, ApJ, 881, 124
- Matthee et al. (2017b) Matthee, J., Sobral, D., Boone, F., et al. 2017b, ApJ, 851, 145
- Matthee et al. (2020) Matthee, J., Sobral, D., Gronke, M., et al. 2020, MNRAS, 492, 1778
- Miralda-Escudé (1998) Miralda-Escudé, J. 1998, ApJ, 501, 15
- Naidu et al. (2018) Naidu, R. P., Forrest, B., Oesch, P. A., Tran, K.-V. H., & Holden, B. P. 2018, MNRAS, 478, 791
- Naidu et al. (2022) Naidu, R. P., Matthee, J., Oesch, P. A., et al. 2022, MNRAS, 510, 4582
- Nakajima et al. (2020) Nakajima, K., Ellis, R. S., Robertson, B. E., Tang, M., & Stark, D. P. 2020, ApJ, 889, 161
- Nakajima et al. (2023) Nakajima, K., Ouchi, M., Isobe, Y., et al. 2023, arXiv e-prints, arXiv:2301.12825
- Ning et al. (2023) Ning, Y., Cai, Z., Jiang, L., et al. 2023, ApJ, 944, L1
- Oesch et al. (2015) Oesch, P. A., van Dokkum, P. G., Illingworth, G. D., et al. 2015, ApJ, 804, L30
- Oke & Gunn (1983) Oke, J. B. & Gunn, J. E. 1983, ApJ, 266, 713
- Orlitová et al. (2018) Orlitová, I., Verhamme, A., Henry, A., et al. 2018, A&A, 616, A60
- Osterbrock (1989) Osterbrock, D. E. 1989, Astrophysics of gaseous nebulae and active galactic nuclei
- Ouchi et al. (2013) Ouchi, M., Ellis, R., Ono, Y., et al. 2013, ApJ, 778, 102
- Pahl et al. (2021) Pahl, A. J., Shapley, A., Steidel, C. C., Chen, Y., & Reddy, N. A. 2021, MNRAS[arXiv:2104.02081]
- Pentericci et al. (2016) Pentericci, L., Carniani, S., Castellano, M., et al. 2016, ApJ, 829, L11
- Pentericci et al. (2011) Pentericci, L., Fontana, A., Vanzella, E., et al. 2011, ApJ, 743, 132
- Pentericci et al. (2018a) Pentericci, L., McLure, R. J., Garilli, B., et al. 2018a, A&A, 616, A174
- Pentericci et al. (2018b) Pentericci, L., Vanzella, E., Castellano, M., et al. 2018b, A&A, 619, A147
- Planck Collaboration et al. (2020) Planck Collaboration, Aghanim, N., Akrami, Y., et al. 2020, A&A, 641, A6
- Rieke & the JADES Collaboration (2023) Rieke, M. & the JADES Collaboration. 2023, JADES Initial Data Release for the Hubble Ultra Deep Field: Revealing the Faint Infrared Sky with Deep JWST NIRCam Imaging
- Rieke et al. (2022) Rieke, M. J., Kelly, D. M., Misselt, K., et al. 2022, arXiv e-prints, arXiv:2212.12069
- Roberts-Borsani et al. (2016) Roberts-Borsani, G. W., Bouwens, R. J., Oesch, P. A., et al. 2016, ApJ, 823, 143
- Robertson (2022) Robertson, B. E. 2022, ARA&A, 60, 121
- Robertson et al. (2015) Robertson, B. E., Ellis, R. S., Furlanetto, S. R., & Dunlop, J. S. 2015, ApJ, 802, L19
- Robertson et al. (2013) Robertson, B. E., Furlanetto, S. R., Schneider, E., et al. 2013, ApJ, 768, 71
- Robertson et al. (2023) Robertson, B. E., Tacchella, S., Johnson, B. D., et al. 2023, Nature Astronomy [arXiv:2212.04480]
- Rosdahl et al. (2022) Rosdahl, J., Blaizot, J., Katz, H., et al. 2022, MNRAS, 515, 2386
- Roy et al. (2023) Roy, N., Henry, A., Treu, T., et al. 2023, arXiv e-prints, arXiv:2304.01437
- Sanders et al. (2023) Sanders, R. L., Shapley, A. E., Topping, M. W., Reddy, N. A., & Brammer, G. B. 2023, arXiv e-prints, arXiv:2301.06696
- Santos et al. (2020) Santos, S., Sobral, D., Matthee, J., et al. 2020, MNRAS, 493, 141
- Saxena et al. (2022a) Saxena, A., Cryer, E., Ellis, R. S., et al. 2022a, MNRAS, 517, 1098
- Saxena et al. (2022b) Saxena, A., Pentericci, L., Ellis, R. S., et al. 2022b, MNRAS, 511, 120
- Saxena et al. (2023) Saxena, A., Robertson, B. E., Bunker, A. J., et al. 2023, arXiv e-prints, arXiv:2302.12805
- Shivaei et al. (2020) Shivaei, I., Reddy, N., Rieke, G., et al. 2020, ApJ, 899, 117
- Simmonds et al. (2023) Simmonds, C., Tacchella, S., Maseda, M. V., et al. 2023, arXiv e-prints, arXiv:2303.07931
- Smith et al. (2019) Smith, A., Ma, X., Bromm, V., et al. 2019, MNRAS, 484, 39
- Sobral et al. (2015) Sobral, D., Matthee, J., Darvish, B., et al. 2015, ApJ, 808, 139
- Stark (2016) Stark, D. P. 2016, ARA&A, 54, 761
- Stark et al. (2017) Stark, D. P., Ellis, R. S., Charlot, S., et al. 2017, MNRAS, 464, 469
- Stark et al. (2015) Stark, D. P., Richard, J., Charlot, S., et al. 2015, MNRAS, 450, 1846
- Steidel et al. (1996) Steidel, C. C., Giavalisco, M., Dickinson, M., & Adelberger, K. L. 1996, AJ, 112, 352
- Sun et al. (2022) Sun, F., Egami, E., Pirzkal, N., et al. 2022, arXiv e-prints, arXiv:2209.03374
- Tacchella et al. (2022) Tacchella, S., Johnson, B. D., Robertson, B. E., et al. 2022, arXiv e-prints, arXiv:2208.03281
- Tang et al. (2023) Tang, M., Stark, D. P., Chen, Z., et al. 2023, arXiv e-prints, arXiv:2301.07072
- Topping et al. (2022) Topping, M. W., Stark, D. P., Endsley, R., et al. 2022, ApJ, 941, 153
- Trapp et al. (2022) Trapp, A. C., Furlanetto, S. R., & Davies, F. B. 2022, arXiv e-prints, arXiv:2210.06504
- Trump et al. (2022) Trump, J. R., Arrabal Haro, P., Simons, R. C., et al. 2022, arXiv e-prints, arXiv:2207.12388
- Vanzella et al. (2012) Vanzella, E., Guo, Y., Giavalisco, M., et al. 2012, ApJ, 751, 70
- Vanzella et al. (2011) Vanzella, E., Pentericci, L., Fontana, A., et al. 2011, ApJ, 730, L35
- Verhamme et al. (2015) Verhamme, A., Orlitová, I., Schaerer, D., & Hayes, M. 2015, A&A, 578, A7
- Verhamme et al. (2017) Verhamme, A., Orlitová, I., Schaerer, D., et al. 2017, A&A, 597, A13
- Weinberger et al. (2019) Weinberger, L. H., Haehnelt, M. G., & Kulkarni, G. 2019, MNRAS, 485, 1350
- Willott et al. (2015) Willott, C. J., Carilli, C. L., Wagg, J., & Wang, R. 2015, ApJ, 807, 180
- Witten et al. (2023) Witten, C., Laporte, N., Martin-Alvarez, S., et al. 2023, arXiv e-prints, arXiv:2303.16225
- Zackrisson et al. (2013) Zackrisson, E., Inoue, A. K., & Jensen, H. 2013, ApJ, 777, 39
Appendix A 1D spectra of LAEs reported in this study