Present address: ]Université Paris Saclay, CNRS/IN2P3, IJCLab, 91405 Orsay, France Present address: ]KU Leuven, Instituut voor Kern- en Stralingsfysica, B-3001 Leuven, Belgium Present address: ]TRIUMF, 4004 Wesbrook Mall, Vancouver, British Columbia V6T 2A3, Canada
Binding energies of ground and isomeric states in neutron-rich ruthenium isotopes: measurements at JYFLTRAP and comparison to theory
Abstract
We report on precision mass measurements of 113,115,117Ru performed with the JYFLTRAP double Penning trap mass spectrometer at the Accelerator Laboratory of University of Jyväskylä. The phase-imaging ion-cyclotron-resonance technique was used to resolve the ground and isomeric states in 113,115Ru and enabled for the first time a measurement of the isomer excitation energies, Ru keV and Ru keV. The ground state of 117Ru was measured using the time-of-flight ion-cyclotron-resonance technique. The new mass-excess value for 117Ru is around 36 keV lower and 7 times more precise than the previous literature value. With the more precise ground-state mass values, the evolution of the two-neutron separation energies is further constrained and a similar trend as predicted by the BSkG1 model is obtained up to the neutron number .
I Introduction
Neutron-rich nuclei between zirconium () and tin () exhibit a variety of shapes; several of them even exhibit shape coexistence, where excited states are linked to shapes which differ from that of the nuclear ground state. The diverse manifestations of collectivity in general and nuclear shapes in particular in this region of the nuclear chart have been studied widely, both theoretically and experimentally, see e.g. Ref. [1] and references therein. The relevant nuclear configurations are not limited to shapes with a comparatively high degree of symmetry such as spheres or axially symmetric ellipsoids with prolate or oblate deformation, but also includes shapes with no remaining rotational symmetry axis: triaxial shapes. There is evidence that the ground states of neutron-rich ruthenium isotopes () fall in the latter category [1, 2], an interpretation that is further supported by different models [3, 4]. These models typically agree that the effect of triaxial deformation is largest at the mid-shell and that the effect tapers off when even more neutrons are added to the nucleus, i.e. that sufficiently neutron-rich nuclei revert to an axially symmetric or spherical shape towards the shell closure at .
Structural changes can be studied via a wide range of experimental methods, including laser- and decay-spectroscopy as well as Coulomb excitation. At the same time, Penning-trap mass spectrometry can be used to explore differences in binding energy which can reveal possible shape transitions [5, 6, 7]. With the development of the phase-imaging ion-cyclotron-resonance (PI-ICR) technique [8, 9], not only the ground-state binding energies but also the isomer excitation energies down to a few tens of keV [10, 11] can be extracted, allowing to obtain new insight into the nuclear structure.
Masses of neutron-rich ruthenium isotopes up to [12, 13] have been measured before with the JYFLTRAP double Penning trap mass spectrometer [14]. However, for the cases where long-lived isomers are present, namely 113,115Ru, the time-of-flight ion-cyclotron-resonance (TOF-ICR) [15] technique used at that time did not provide enough resolving power to separate the ground- and isomeric-states in 113Ru or to detect the isomer in 115Ru unknown at that time. Therefore these results might have suffered from a systematic shift for the reported ground-state mass-excess values [11]. More exotic ruthenium isotopes were studied using the Experimental Storage Ring at GSI [16]. However, 117Ru had the uncertainty 2.4-times increased by the Atomic Mass Evaluation 2020 (AME20) evaluators while the mass-excess value of 118Ru was rejected due to a significant 700-keV deviation from the mass trends [17].
In this work, we report on the direct mass measurement of the ground states of 113,115,117Ru and the isomeric states in 113Ru and 115Ru, the latter being the shortest-lived state ( ms) ever measured at JYFLTRAP so far. The role of deformation for the systematics of masses in this region and the nature of the isomeric state in 115Ru are analysed within the context of the recent global microscopic models BSkG1 [4] and BSkG2 [18, 19] that are based on self-consistent Hartree-Fock-Bogoliubov (HFB) calculations using a Skyrme energy density functional (EDF).
II Experimental method
The masses of neutron-rich ruthenium isotopes were studied at the Ion Guide Isotope Separator On-Line (IGISOL) facility [20] using the JYFLTRAP double Penning trap mass spectrometer [14] during two experiments. The isotopes of interest were produced in proton-induced fission by impinging a 25-MeV proton beam onto a thin target, 232Th for 113Ru and natU for 115,117Ru. First, the fission fragments were stopped in a helium gas cell operating close to 300 mbar from which they were extracted and guided using a sextupole ion guide [21]. Then, the produced ions were accelerated to keV and mass-separated based on their mass-to-charge ratio using a 55 degree dipole magnet. The continuous mass-separated beam was cooled and bunched using the helium buffer gas-filled radio-frequency quadrupole cooler-buncher [22]. Finally, the ion bunches were injected into the JYFLTRAP double Penning trap.
In the first trap of JYFLTRAP, known as the purification trap, the ion bunch was cooled, centered and the ions of interest were selected utilizing the mass-selective buffer gas cooling technique [23]. After that, the purified ion sample was sent into the second trap, called the precision trap, where the mass measurements took place.
In addition, 113Ru2+ ions were produced via the in-trap decay of 113Tc ( ms [24]). The 113Tc+ ions, produced via fission, were captured in the first trap after which, the ion motion was let to cool for ms. Then a dipolar excitation on the magnetron frequency was applied for ms. During the trapping time a fraction of the 113Tc+ ion sample -decay to 113Ru2+. Quadrupolar excitation of ms was used to select the ions of interest by matching the excitation frequency of 113Ru2+ ions. After, the 113Ru2+ ions were sent to the second trap for the precision mass measurement.
In the presence of a magnetic field of strength , the mass of an ion is related to its cyclotron frequency :
| (1) |
where is the charge-to-mass ratio of the measured ion. To determine the magnetic field strength precisely, 133Cs+ ions from the IGISOL offline surface ion source station [25] were used as a reference for the mass measurement of 113,115Ru+ ground states and 117Ru+. For the mass measurement of isomeric states in 113,115Ru, the ground-state masses were used as a reference. To account for the temporal magnetic field fluctuations, ruthenium ions and their references were measured alternately. The atomic mass is determined from the frequency ratio between the reference ions and the ions of interest:
| (2) |
where is an atomic mass of the reference, is an electron mass, and are charge states of the ion of interest and the reference ion, respectively. The isomer excitation energies were extracted as follows:
| (3) |
where is the ground-state atomic mass, is the charge state of the reference ion and the ion of interest (both either singly-charged, , or doubly-charged, in this experiment), and is the speed of light in vacuum. Contribution from electron binding energies are on the order of eV and have thus been neglected.
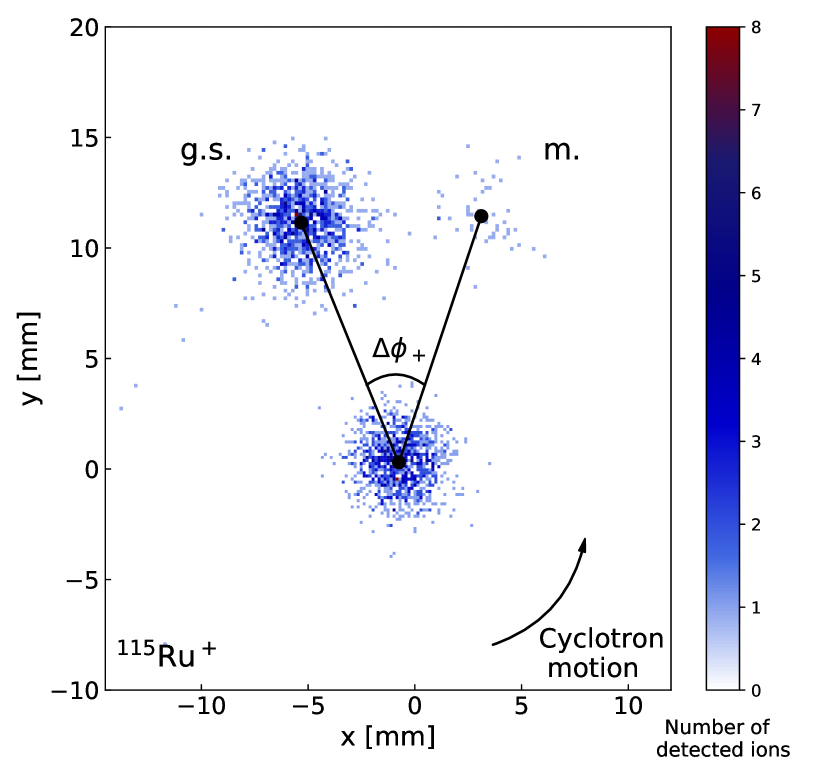
To measure the masses of the ground- and isomeric states in 113,115Ru, the PI-ICR technique [9, 26] was utilized in the precision trap. With the PI-ICR technique, the ion’s cyclotron frequency is determined by measuring the sum of the accumulated residual phases of the magnetron () and cyclotron () motions that are projected onto a position-sensitive microchannel plate (2D MCP) detector after a phase accumulation time . Using the polar angles of the cyclotron () and magnetron () phase images on the detector, the angle between the motion phases with respect to the center spot is . This can be used for the determination of the cyclotron frequency:
| (4) |
with being the sum of full revolutions performed at the magnetron and modified cyclotron frequencies during the phase accumulation time in the precision trap. We used the following accumulation times for the PI-ICR mass measurements: ms for the 113Ru+ ground and isomeric state, ms for the ions of 113Ru isomeric state, ms for the 115Ru+ ground state and 100 ms for the 115Ru+ isomer (see Fig. 1). The measurement pattern utilized at JYLFTRAP is described in more detail in Refs. [26, 27] and the PI-ICR measurement technique in Ref. [9].
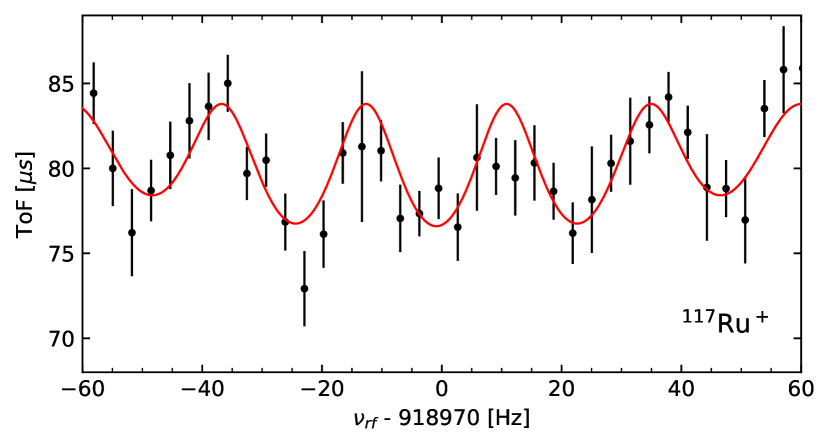
For 117Ru+, the TOF-ICR technique [28, 15] was applied. The ion’s cyclotron frequency in TOF-ICR technique is determined from a time-of-flight resonance measured with the 2D MCP detector, located outside the strong magnetic field of the trap. To enhance the resolving power, the Ramsey method of time-separated oscillatory fields [29, 30] was utilised. A short 10-30-10 ms (on-off-on) pattern was used in order to minimize the decay losses (see Fig. 2).
In the mass measurement of 113Ru and 115Ru, the ground state and the isomer were in the precision trap at the same time. It is known that when two or more ions of different masses are present in the trap simultaneously, the ion-ion interaction can cause a frequency shift [27]. To account for the ion-ion interaction, a count-rate class analysis [31, 27], i.e. analysis of the variation of the frequency ratio with the number of ions stored simultaneously in the trap, was performed for the ground state ion of 115Ru, while for other cases it was not statistically feasible. At JYFLTRAP the systematic uncertainty related to temporal magnetic field fluctuation has been determined to be min-1 [27], where is the time between the measurements. In all of the measurements the maximum systematic uncertainty related to the temporal magnetic field fluctuations was calculated but was found to be negligible compared to the statistical uncertainty. We added a further mass-dependent uncertainty of and a residual systematic uncertainty of for measurements where the for the reference and ion-of-interest were not the same, i.e. when using the 133Cs ions as reference [27]. A systematic uncertainty related to the magnetron phase advancement and systematic angle error were also accounted for in the PI-ICR measurements. A more detailed description on the systematic uncertainties and their determination at JYFLTRAP can be found in Ref. [27].
III Results
The ground- and isomeric-state mass of 113,115Ru and the ground-state mass of 117Ru are reported in detail below. The measured frequency ratios (), mass-excess values (ME) and excitation energies () are summarized in Table 1.
| Nuclide | (ms) | Ref. | ME (keV) | MElit. (keV) | (keV) | (keV) | Diff. (keV) | |||
| 113Ru | 800(50) | 133Cs | 1 | |||||||
| 113Rum | 510(30) | 113Ru | 1 | 111Measured with ions produced directly in fission. | ||||||
| 113Ru | 2 | 222Measured with ions produced in in-trap-decay of 113Tc. | ||||||||
| Final value: | 333Weighted average of the two measurements. | |||||||||
| 115Ru | 318(19) | 133Cs | 1 | |||||||
| 115Rum | 76(6) | 115Ru | 1 | |||||||
| 117Ru | 151(3) | # | 133Cs | 1 | ||||||
III.1 113Ru
The ground-state mass excess of 113Ru, keV, was determined using 133Cs+ ions as a reference. The isomer excitation energy, keV, was determined against the ground state, both as singly-charged ions produced directly in fission as well as doubly-charged ions produced via in-trap decay of 113Tc+ (for details see Sect. II). This yields a mass excess of keV for the isomer.
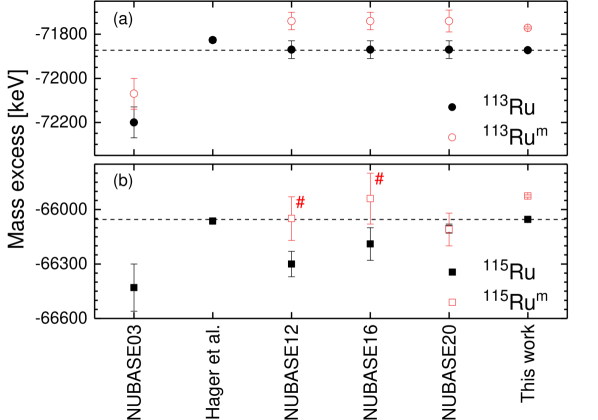
The mass of 113Ru has been previously measured at JYFLTRAP by Hager et al. [12], using the TOF-ICR technique with a 400-ms quadrupolar excitation time and 105Ru+ ions as a reference. With the AME20 [32] mass value for 105Ru, this results in a mass-excess value of keV. The revised value is in between the ground- and isomeric-state mass-excess values reported in this work (see Fig. 3.(a)) suggesting that a mixture of states was measured in Ref. [12]. A similar effect was observed in Rh isotopes, as reported in Ref. [11].
The reported mass-excess values are in agreement with the NUBASE20 evaluation [24] where it was correctly assumed that the value measured in Ref. [12] was a mixture of the ground state and an isomer at 131(33) keV. To date, the isomeric-state excitation energy was not based on direct experimental observations but on the suggestion that it has to lie in between the states at 98 and 164 keV in 113Ru [37, 38]. In this work, we have confirmed this hypothesis by determining the excitation energy for the first time and by placing the isomer just above the 98-keV state (see Fig. 4). The production of both long-lived states in 113Ru in the -decay of 113Tc is also in agreement with the work by Kurpeta et al. [37].

III.2 115Ru
The ground state mass excess, keV, was measured against a 133Cs+ reference. The isomer excitation energy, keV, was determined against the ground state resulting in a mass excess of keV for the isomer.
Our ground-state mass excess value is in agreement with the previous TOF-ICR-based JYFLTRAP measurement (ME = [12, 32]) after adjusting for the updated mass of the reference 120Sn ion. In our previous work we have observed that for nuclei with low-lying isomeric states the masses obtained with the TOF-ICR method are a weighted average of the ground state and the isomer masses [11]. In the case of 115Ru, an apparent absence of the isomer influence on the measured mass can be explained by a relatively short half-life of the isomeric state ( ms [24]) compared to the 300 ms excitation time used in Ref. [12].
Figure 3.(b) shows a comparison of our measurement with the values reported in NUBASE evaluations on nuclear and decay properties from 2003 [34], 2012 [35], 2016 [36] and 2020 [24] as well as the revised JYFLTRAP value of Ref. [12]. Changes between different editions of NUBASE can be explained as due to varying input data. In NUBASE03 [34], the only entry for 115Ru was from a -decay end-point energy study [40]. After the JYFLTRAP measurement by Hager et al. [12], a long-lived isomeric state in 115Ru was discovered [41], and the evaluators of NUBASE12 [35] applied a special procedure for mixtures of isomeric states assuming the excitation energy to be 250(100) keV. In NUBASE16 [36], the -decay end-point energy study was excluded from the global fit and the only remaining information was from Ref. [12]. Finally, in NUBASE20 [24], the energy of the isomeric state was adjusted to 82(6) keV based on the value originally proposed in Ref. [41]. However, the isomeric-state excitation energy seems not to be taken into account for the mass-excess value of the isomer but only for its uncertainty.
III.3 117Ru
The value determined in this work, keV, is in agreement with AME20 [32] and it is almost seven times more precise. The mass-excess value adopted in AME20, keV [32], is based on storage-ring measurements [42, 16] but with the uncertainty artificially increased by evaluators [17]. The only known isomeric state has a half-life of s [24] which is much shorter than the measurement cycle used in this work.
IV Discussion
In this section, we discuss the experimental results and compare them to the BSkG-family of models of nuclear structure [4, 18, 19]. This section is organised as follows: we first establish the theoretical framework in Sec. IV.1 and then proceed to study first the trends of the ground state (g.s.) binding energies of neutron-rich Ru isotopes in Sec. IV.2. Sec. IV.3 discusses the isomeric state in 115Ru as well as the implication of our measurement of its excitation energy.
IV.1 Theoretical framework
The BSkG-family of models responds to the need for reliable data on the structural properties of exotic nuclei in different fields of research and in astrophysics in particular. These models are based on an empirical Energy Density Functional (EDF) of Skyrme type that models the effective in-medium nucleon-nucleon interaction. The concept of an EDF allows for a global yet microscopic description of all relevant quantities at a reasonable computational cost. The coupling constants of the EDF are the main element of phenomenology in this type of model and have to be adjusted to experimental data. Since binding energies are crucial ingredients for the modeling of nuclear reactions, the ensemble of known nuclear masses is a key ingredient of the parameter adjustment of the BSkG models. Because of this, these models reach root-mean-square (rms) deviations better than 800 keV on the thousands of masses included in AME20 [32]. This performance is not at all competitive with the uncertainties of the measurements we report on here, but it nevertheless reflects the state-of-the-art in global mass modeling: it is only matched by some of the older BSk models that were adjusted in the same spirit [43], microscopic-macroscopic approaches [44] and empirical models [45]. The latter two types of model become particularly accurate when refined with machine learning techniques [46], but either do not extend their predictions to other observables or struggle to describe them with the same parameter values deduced from the masses.
The BSkG-family so far counts two entries: BSkG1 [4] and BSkG2 [18, 19]. Both models combine a description of many hundreds of measured charge radii and realistic predictions for the properties of infinite nuclear matter with a description of the AME20 masses with similar accuracy (rms deviations of 741 and 678 keV, respectively). Although some of the BSk models reach an rms deviation below 600 keV [43], BSkG1 and BSkG2 are better adapted to study the neutron-rich Ru isotopes as they rely on a three-dimensional representation of the nucleus, thereby accomodating naturally the triaxial deformation that is known to be particularly relevant for this region of the nuclear chart. BSkG2 incorporates a full treatment of the so-called ‘time-odd’ terms in an EDF [18] and improves systematically on the description of fission properties compared to its predecessor [19]. Since (i) the inclusion of the time-odd terms did not result in a meaningful improvement of our global description of binding energies and (ii) fission properties are not directly related to the masses, a priori we expect BSkG1 and BSkG2 to be of roughly equal quality for the task at hand and therefore we will compare experiment to both models in what follows.
Large-scale EDF-based models of nuclear structure such as the BSk- and BSkG-models describe the nucleus in terms of one single product wavefunction, typically of the Bogoliubov type. The simplicity of such an ansatz, as compared to the complexity of the many-body problem, is compensated for by allowing for spontaneous symmetry breaking in the mean fields. By considering such deformed configurations EDF-based models can account for a large part of the effects of nuclear collectivity on bulk properties such as masses while remaining at the mean-field level and thus keeping calculations tractable. Nevertheless, symmetry breaking comes at considerable computational cost. For all calculations that we report on, we employed the MOCCa code [47] to represent the single-nucleon wavefunctions on a three-dimensional coordinate mesh. All numerical parameters such as the mesh point spacing are identical to those employed in the adjustment of both BSkG models [4, 18].
In a three-dimensional calculation, the quadrupole deformation of a nucleus of mass can be described by way of the (dimensionless) deformation and the triaxiality angle , defined as
| (5) | ||||
| (6) |
where fm. The quadrupole moments and are defined in terms of integrals of the total nuclear density and spherical harmonics, see for instance Ref. [4]. Axially symmetric prolate and oblate shapes correspond to and , respectively, while intermediate values of the triaxiality angle in between those two extremes indicate triaxial shapes.
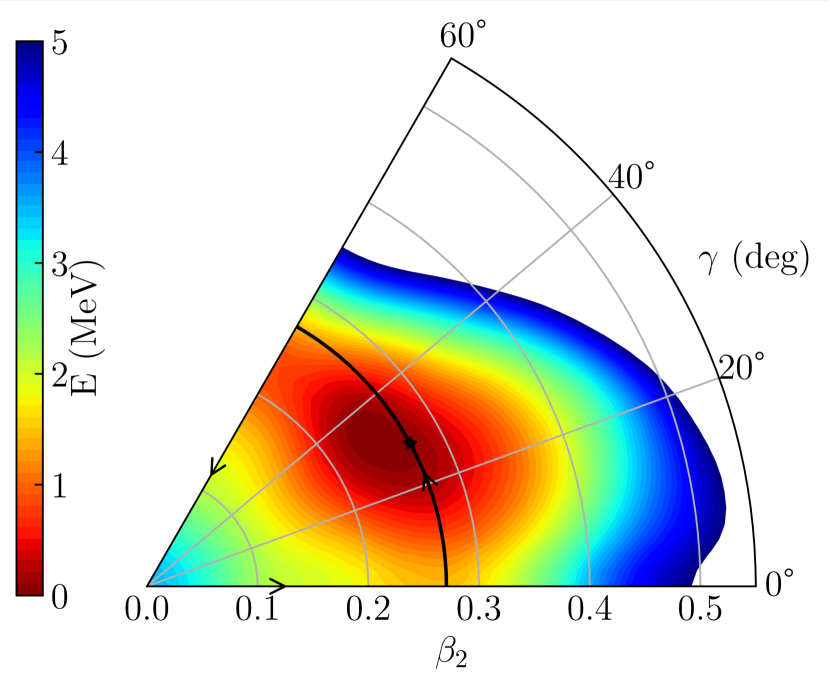
We show in Fig. 5 the potential energy surface (PES) of 115Ru in the plane as obtained with BSkG2, calculations with BSkG1 leading to a similar PES. Since 115Ru has an odd number of nucleons, Fig. 5 shows the result of so-called ‘false-vacuum’ calculations, where we constrained the expected number of neutrons to , but otherwise treated the nucleus as if it were even-even. We emphasize that all the calculations for which we report masses do not rely on this approximation: for both BSkG1 and BSkG2 our treatment of the odd-mass Ru isotopes includes self-consistent blocking of a neutron quasiparticle. For BSkG2, we also include the energy contribution of the finite spin and current densities induced by the presence of the odd neutrons. For more details on our treatment of odd-mass and odd-odd nuclei, see the discussion in Ref. [18]. A complete calculation for 115Ru that includes blocking leads to the deformation shown as a black star on Fig. 5; its offset with respect to the minimum of the false-vacuum calculations is due to the polarisation induced by the odd neutron.
Qualitatively, the false-vacuum PES of 115Ru looks similar to the PES of 112Rh that we discussed in Ref. [11]: we observe a somewhat broad triaxial minimum near of significant quadrupole deformation. Close inspection reveals some quantitative differences: is here somewhat smaller than the value obtained for 112Rh for instance. Another difference is the energy gain due to triaxiality: the difference between the oblate saddle point and the minimum on Fig. 5 is about 800 keV, while it exceeds 1 MeV for 112Rh. This can be linked to the four additional neutrons in 115Ru compared to 112Rh: as we approach the shell closure, the neutrons have less freedom to exploit quadrupole correlations and the importance of (static) quadrupole deformation in general and triaxial deformation in particular diminishes.
IV.2 The g.s. masses of Ru isotopes and their trends
For the chain of Ru isotopes between and , BSkG1 reproduces the absolute g.s. binding energies best: the deviation with respect to experiment for the absolute mass excesses averages to 360 keV and never exceeds 640 keV. The performance of BSkG2 is not as good: an average deviation of 650 keV with a deviation of up to MeV for 115Ru. Interestingly, the sign of the deviation is consistent: both models overbind these Ru isotopes and hence produce mass excesses that are too large in absolute size. As discussed before, the experimental uncertainties are several orders of magnitude beyond the accuracy of global models like BSkG1 and BSkG2: instead of comparing absolute masses in more detail, we will focus in what follows primarily on the trends of mass differences.
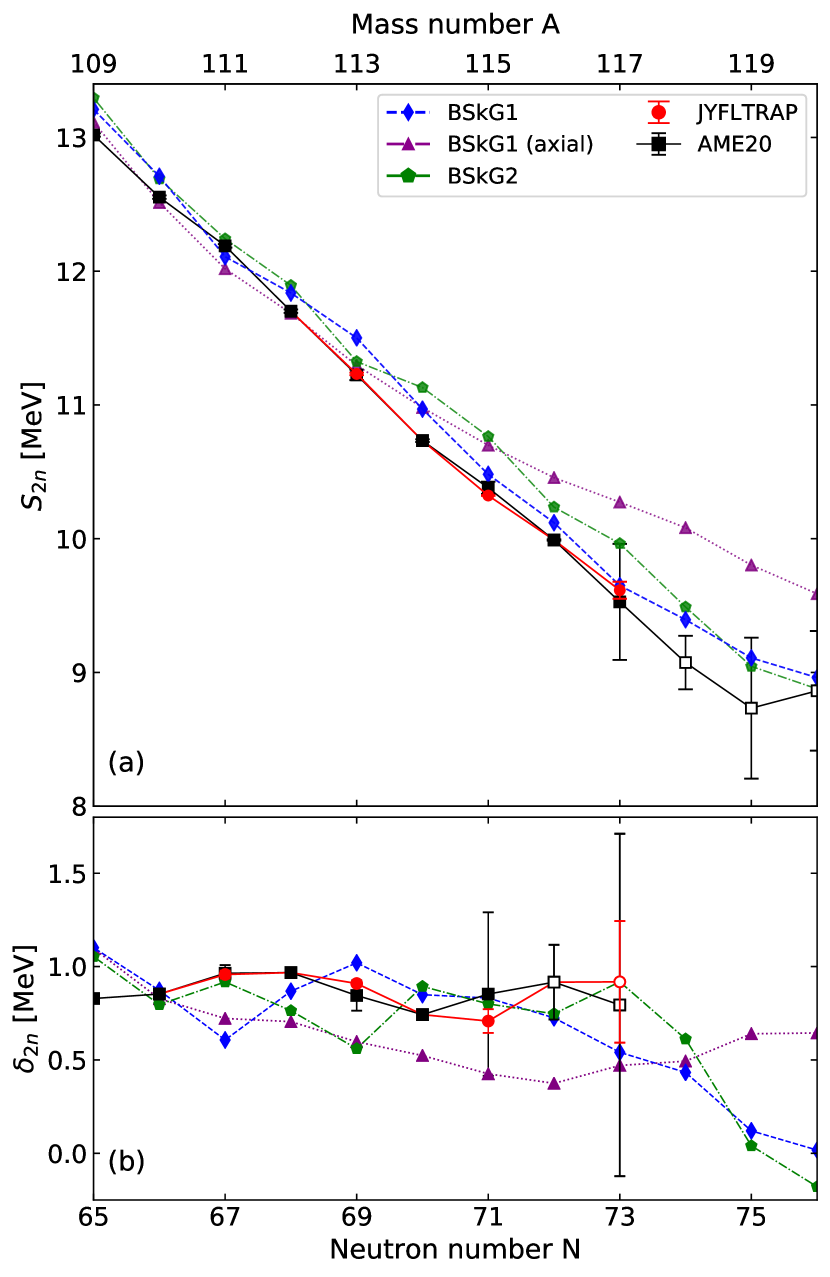
We start with the two-neutron separation energy , defined as:
| (7) |
where is the mass excess of a nucleus with protons and neutrons and is the mass excess of the neutron. The top panel of Fig. 6 compares the values derived from the newly measured masses to the values reported in the AME20 [32] evaluation and the two mass models. We also show the results of the less general calculations with BSkG1 reported on in Ref. [4, 11], which restrict the nucleus to axially symmetric configurations.
For the less exotic 109,111,113Ru, all three calculations with BSkG-models reproduce the general trend of the experimental rather well, although deviations on the order of several hundred keV are clearly visible. For the BSkG1 model, the description of the more neutron-rich isotopes follows the trend of the more stable ones, systematically overestimating the values by a small value. BSkG2 also overestimates the separation energies and describes their overall trend, but with deviations that are somewhat larger than those of its predecessor. Calculations with BSkG1 that are restricted to axial shapes, however, entirely miss the experimental trend.
We can furthermore discuss the slope of the curve by introducing the empirical two-neutron shell gaps :
| (8) |
which we show in the bottom panel of Fig. 6. The new JYFLTRAP measurement for 115Ru clearly establishes that the slope of the in this isotopic chain evolves smoothly at least until . Although the corresponding curves are less regular, the BSkG1 and BSkG2 results produce values that remain close to experiment up to . For the heavier , and isotopes, whose experimental values are at least partially based on extrapolated AME20 values, the two models predict no major change in slope either. It is only for that BSkG1 and BSkG2 predict a change in slope that is correlated with the disappearance of triaxial deformation for . For 120Ru and even more neutron-rich isotopes, the models predict axially symmetric prolate shapes with deformation that gradually diminishes towards .
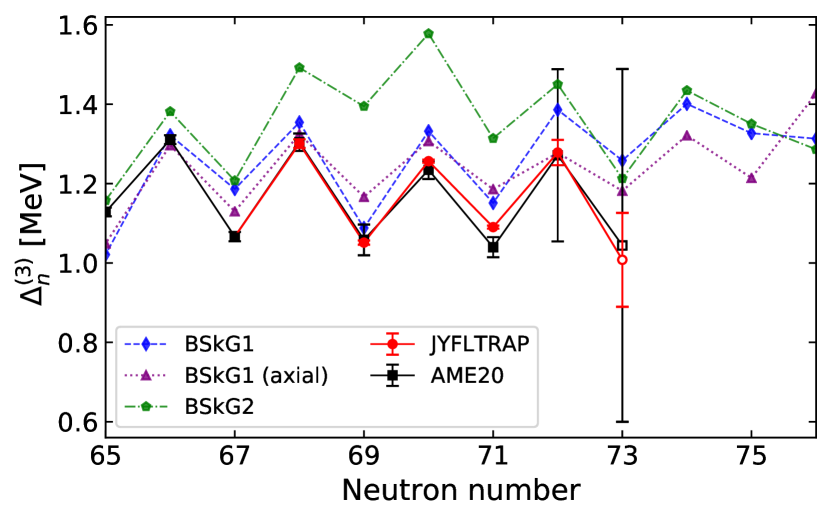
Finally, we discuss the three-point neutron gaps :
| (9) |
This quantity estimates the average distance between the curves that interpolate the masses of the even- and odd- isotopes, respectively, as a function of neutron number. It is particularly sensitive to the neutron pairing, but it can also be affected by variations in the structure of these isotopes with . The new experimental results confirm the continuation of the trend of less exotic isotopes: the three-point gaps for the even- isotopes at , , , and are all equal within error-bars. For , our new result actually brings the value more in line with this trend. The updated value of for falls significantly out of the uncertainty range of AME20, which reflects the lack of accuracy of the AME20 estimate for the excitation energy of the isomeric state of 115Ru. Nevertheless, it is not dramatically larger than the gap values for and .
The BSkG2 model generally overestimates and its curve exhibits features at , , and that are not seen in the experimental data. BSkG1 on the other hand, provides a fair description of the experimental results, whether including or not triaxial deformation. Yet even this model is clearly not without flaws: the deviation of the full calculation w.r.t. experiment grows with from onwards. In this respect, the deviation between the calculated BSkG1 value and the updated point at (which incorporates the recommended AME20 binding energy for 118Ru) seems ominous. We note in passing that both BSkG models systematically overestimate along odd- isotopic chains, which we discovered for the first time during the study of neighbouring Rh isotopes in Ref. [11]. Similarly, both models overestimate the calculated three-point proton gaps in odd- isotopic chains. The common origin of these issues is the failure of both models to account for a small amount of binding energy in odd-odd nuclei that is usually ascribed to the residual interaction between the two odd nucleons, see Ref. [18]. This issue does not affect our discussion here, but it explains why both models describe much better the three-point neutron gaps in even- Ru isotopes than in odd- Rh isotopes.
We have established that performance of BSkG2 for the Ru isotopes is worse than that of BSkG1 for absolute masses as well as all mass differences discussed. Since these models are the result of a complicated parameter adjustment which is global in scope, it is hard to pinpoint a particular source of this (local) deficiency. As we remarked in the previous section, we did not a priori expect that BSkG2 would offer an improved description of the measured masses. Although the difference we observe between models indicates BSkG1 as the tool of choice for future studies of this region, this does not imply that BSkG2 is a step backwards compared to its predecessor. The newer model presents a different compromise on the very large number of observables included in the parameter adjustment, leading to a worse description of the nuclei we study here but also to an improved description of other observables [18].
To close this section, we note again that our new measurement indicates a rather uneventful continuation to of the trends of binding energies and mass differences as established for less exotic isotopes. This can be interpreted as experimental confirmation that the structural evolution of nuclei in this isotopic chain is smooth rather than dramatic. From the point of view of the BSkG models this was expected: from onwards, the Ru isotopes exhibit triaxial deformation that smoothly evolves with neutron number until . The authors of Ref. [33] relied on the Woods-Saxon single-particle spectrum of Ref. [48] to interpret the change in (tentative) ground state spin assignment in 113-115Ru (() and (), respectively) as a sign of a shape transition from prolate to oblate deformation. The trend of masses and mass differences does not seem to support such scenario.
IV.3 The isomer in 115Ru
The isomeric state in 115Ru was reported for the first time in Ref. [41], discussing the analysis of a decay experiment. The authors observed that the 61.7-keV ray is not in coincidence with a particle or any other ray. In addition, the half-life extracted from this transition, ms, differed from the half-life obtained for the 115Ru ground-state ( ms). Consequently, it was assumed that the isomeric state de-excites via an unobserved ray having energy below Ru K x-rays ( keV), which we label , followed by an emission of the 61.7-keV ray, labeled as .
With the assumption of the energy of being below 20 keV, the observed ruthenium K x-rays were associated solely with the emission of K internal conversion electrons from the transition. This observation enabled a determination of the K-internal conversion coefficient ( [41]) by calculating the ratio of the ruthenium K x-rays and the transitions.

The new isomer excitation energy reported in this work renders previous calculations incorrect. However, if one assumes that (i) the total intensity ( rays and internal conversion electrons emission) of and is identical, (ii) has a pure character and (iii) has a pure character, the observed ratio of the ruthenium K x-rays to would be equal to 2.8(8). Any other assumptions regarding the multipolarity of both transitions would lead to a ratio that differs significantly from the experimental value of 2.7(6) [41]. Therefore, we propose and multipolarities for and , respectively. By assigning as the ground-state spin-parity as proposed in [33] from a detailed -decay spectroscopy experiment of 115Ru, a tentative isomer assignment can be adopted, see Fig. 8.
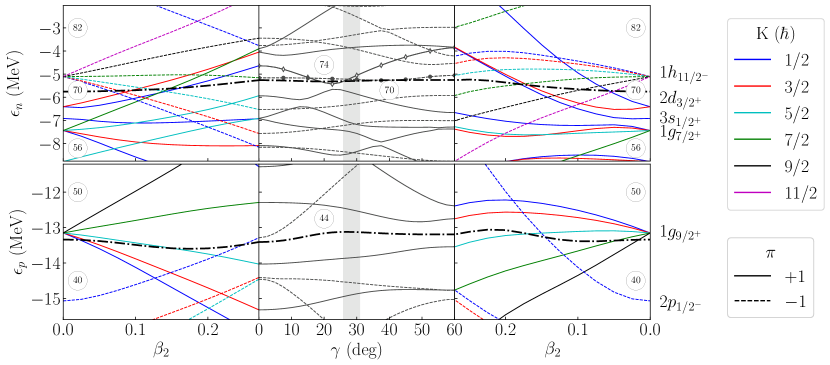
A precise description of the level scheme of 115Ru is beyond the capabilities of current large-scale models such as BSkG1 and BSkG2, but we can use them to gain a qualitative understanding of the existence of the isomeric state. To this end, we show in Fig. 9, the Fermi energy and the single-particle energies for both neutrons and protons obtained in false-vacuum calculations for 115Ru with BSkG2 along the trajectory in the plane indicated by the arrows in Fig. 5. Although symmetry-breaking allows models such as BSkG1 and BSkG2 to grasp a significant part of the effect of collectivity on nuclear structure, here is where we pay the price: we can no longer use the quantum numbers of an operator associated with a broken symmetry to label single-particle states. At the spherical point, on the utmost left and right of Fig. 9, no symmetry is broken and all single-particle levels are simultaneous eigenstates of three operators with three associated quantum numbers: the angular momentum squared with quantum number , parity with quantum number and the -component of the angular momentum with quantum number . The quantum numbers of the orbitals at the spherical point are indicated in the traditional spectroscopic notation on the right of Fig. 9. Along the first segment of the path on Fig. 5, we break rotational symmetry but conserve axial symmetry: the levels in the left-most column are no longer eigenstates of but retain the quantum number111For axially symmetric configurations, we always align the symmetry axis with the z-axis in the simulation volume., which is indicated by colors on Fig. 5. When exploring finite values of along the second segment of the path on Fig. 5 axial symmetry is broken and can no longer be used to label the single-particle states, hence the absence of colors in the middle column of Fig. 9. The final segment of the path explores oblate shapes which are axially symmetric, such that levels in the right column of Fig. 9 can again be color-coded. For all our calculations we conserve parity, such that is a good single-particle quantum number along the entire path that we can use to distinguish between levels of positive (full lines) and negative parity (dashed lines) in all columns of Fig. 9.
This loss of single-particle quantum numbers also translates to the many-body state: the BSkG-models cannot currently offer definite angular momentum assignments for calculated ground states for odd-mass and odd-odd nuclei. Doing so would require symmetry-restoration techniques [49] whose application is presently still out of the scope of global models for reasons of their numerical cost and because of formal issues with the type of EDF assumed for the BSkG models. We are however not entirely without options: we can calculate expectation values , which will not be half-integer multiples of but which nevertheless tell us something about the angular momentum of the single-particle state . In the limit of a non-interacting particle-core model of the ground states of odd-mass Ru isotopes, the angular momentum expectation value of the odd neutron will also be the expectation value of angular momentum of the many-body state.
We discussed a qualitatively similar Nilsson diagram obtained for 112Rh in Ref. [11] and repeat here a few observations that are common to both nuclei before discussing the isomer. Local minima in the PES correspond to deformations for which the single-particle level density near the Fermi energy is low: for nuclei with , , and , the protons drive the appearance of triaxial deformation since their single-particle spectrum at is very sparse. In this region of the PES only positive parity states orbital are near the Fermi energy, matching the parity assignments of all even- Tc and Rh isotopes. The single-particle level density of the neutrons on the other hand is much higher, resulting in a closely-spaced set of levels with different parities near the Fermi energy.
We interpret the close interleaving of positive and negative parity neutron states with different angular momentum content as the origin of the isomeric state in 115Ru. Two neutron states are nearly degenerate near the Fermi energy at the location of the minimum of the PES: these are highlighted in the middle column of Fig. 9 and we will refer to them by their markers: and . These levels differ in their parity, but also in their angular momentum content: near the positive parity state has an average , while that of the negative parity state is significantly larger, . Since the odd-neutron can be assigned to each of these levels, we expect the appearance of two low-lying levels with opposite parity in the spectrum of 115Ru that are close in energy yet differ substantially in their angular momentum, hence one of them being an isomer. Finally, the state in between the g.s. and the isomer on Fig. 8 could be rotational in character: taking the calculated moments of inertia of 115Ru and under the assumption of a rigid triaxial rotor, a change in total angular momentum corresponds to about keV of excitation energy.
Moving beyond simple arguments based on a non-interacting particle-core picture and the Nilsson diagram, we explicitly calculated the lowest-lying configuration of each parity in 115Ru with both BSkG1 and BSkG2. One of these is the calculated g.s. , whose binding energy figured in the previous section: for BSkG1 this is the state with positive parity and for BSkG2 this is the one with negative parity. In both cases, we find an excited state of opposite parity at low excitation energy; 33 keV and 90 keV for BSkG1 and BSkG2 respectively. For BSkG2, we have direct access to the average many-body angular momentum along the z-axis: a small value for the positive parity state and a large one, , for the negative parity state. These calculations support our conclusions drawn from the Nilsson diagram and the calculated excitation energy are very roughly comparable to the experimental isomer excitation energy. These results should not be overinterpreted: all relevant energy differences are very small and the neutron spectrum in Fig. 9 is very complicated. Small changes to any aspect of the model will affect the precise location of level crossings and therefore the ordering of levels. Our calculated excitation energies should thus not be taken as a precise prediction, but rather as a confirmation that two states of opposite parity that differ little in energy can be constructed with different angular momentum content. Predicting their ordering and energy difference with accuracy is beyond BSkG1 and BSkG2, or for that matter, any large-scale model that we are aware of.
The same mechanism can be used to interpret the isomerism in nearby isotones: isomeric states with half-lives on the order of seconds or longer have been observed in 116Rh, 118Ag and 119Cd whereas shorter-lived isomeric states are known in 114Tc and 117Pd [24]. For , one can expect from Fig. 9 triaxial deformation with a sparse proton single-particle spectrum and two low-lying states arising from neutron orbitals of different parities. The experimental systematics extend much further: in the entire range of , low-lying isomers have been observed [24]. A more in-depth study of isomerism in the isotones would certainly require more diagrams like Fig. 9 for larger proton numbers and is outside of the scope of this study. Nevertheless, we remark that both BSkG1 and BSkG2 predict triaxial deformation for almost all isotones in the range 222The only exceptions occur for BSkG1 near the shell closure: 118Ag, 119Cd, 120In and 121Sn remain axially symmetric..
V Summary
The masses of 113,115,117Ru have been measured using the Penning-trap mass spectrometry at the JYFLTRAP double Penning trap. The ground- and isomeric states in 113,115Ru have been separated and masses measured using the PI-ICR technique. The isomer excitation energies were determined directly for the first time. The high-precision measurement reported in this work place the isomeric state in 113Ru at 100.5(8) keV, just above the level at 98.4(3) keV [39], but still in agreement with the previous prediction of 133(33) keV [24]. For 115mRu, the excitation energy was found to be 129(5) keV, which is significantly larger than proposed in Ref. [41] or the value listed in the most recent NUBASE evaluation, 82(6) keV [24].
The determined ground-state masses of 113,117Ru are in excellent agreement with the atomic mass evaluation [32]. For 115Ru, we report a mass-excess value which is 50(26) keV larger than reported in AME20 [32]. However, it is in agreement with the previous JYFLTRAP mass measurement by Hager et al. [12]. With the mass values determined in this work, the trend in the two-neutron separation energies continues smoothly.
The experimental results have been compared with the global BSkG1 [4] and BSkG2 [18, 19] models, which allow for triaxially deformed shapes. Detailed calculations were performed for the structure of 115Ru. In the predicted triaxial deformation, the proton single-particle spectrum was found to be sparse and the predicted low-lying states arise from neutron orbitals with different parities. More systematic studies on the isomeric states in this triaxially deformed region would be needed to shed more light on the reasons for the isomerism in these nuclei.
Acknowledgements.
The present research benefited from computational resources made available on the Tier-1 supercomputer of the Fédération Wallonie-Bruxelles, infrastructure funded by the Walloon Region under the grant agreement No 1117545. W.R. is a Research Associate of the F.R.S.-FNRS (Belgium). Work by M.B. has been supported by the Agence Nationale de la Recherche, France, Grant No. 19-CE31-0015-01 (NEWFUN). Funding from the European Union’s Horizon 2020 research and innovation programme under grant agreements No. 771036 (ERC CoG MAIDEN) and No. 861198–LISA–H2020-MSCA-ITN-2019 are gratefully acknowledged. M.H. acknowledges financial support from the Ellen & Artturi Nyyssönen foundation. We are grateful for the mobility support from Projet International de Coopération Scientifique Manipulation of Ions in Traps and Ion sourCes for Atomic and Nuclear Spectroscopy (MITICANS) of CNRS. We acknowledge the support from the Academy of Finland projects No. 295207, 306980, 327629, and 354968. J.R. acknowledges financial support from the Vilho, Yrjö and Kalle Väisälä Foundation.References
- Garrett et al. [2022] P. E. Garrett, M. Zielińska, and E. Clément, Progress in Particle and Nuclear Physics 124, 103931 (2022), ISSN 0146-6410, URL https://www.sciencedirect.com/science/article/pii/S0146641021000922.
- Srebrny et al. [2006] J. Srebrny, T. Czosnyka, C. Droste, S. Rohoziński, L. Próchniak, K. Zaja̧c, K. Pomorski, D. Cline, C. Wu, A. Bäcklin, et al., Nuclear Physics A 766, 25 (2006), ISSN 03759474, URL https://linkinghub.elsevier.com/retrieve/pii/S0375947405012029.
- Möller et al. [2006] P. Möller, R. Bengtsson, B. Gillis Carlsson, P. Olivius, and T. Ichikawa, Phys. Rev. Lett. 97, 162502 (2006), URL https://doi.org/10.1103/PhysRevLett.97.162502.
- Scamps et al. [2021] G. Scamps, S. Goriely, E. Olsen, M. Bender, and W. Ryssens, The European Physical Journal A 57, 333 (2021), ISSN 1434-601X, URL https://doi.org/10.1140/epja/s10050-021-00642-1.
- Hager et al. [2006] U. Hager, T. Eronen, J. Hakala, A. Jokinen, V. Kolhinen, S. Kopecky, I. Moore, A. Nieminen, M. Oinonen, S. Rinta-Antila, et al., Phys. Rev. Lett. 96, 042504 (2006), URL https://doi.org/10.1103/PhysRevLett.96.042504.
- Naimi et al. [2010] S. Naimi, G. Audi, D. Beck, K. Blaum, C. Böhm, C. Borgmann, M. Breitenfeldt, S. George, F. Herfurth, A. Herlert, et al., Phys. Rev. Lett. 105, 032502 (2010), URL https://link.aps.org/doi/10.1103/PhysRevLett.105.032502.
- Chaudhuri et al. [2013] A. Chaudhuri, C. Andreoiu, T. Brunner, U. Chowdhury, S. Ettenauer, A. T. Gallant, G. Gwinner, A. A. Kwiatkowski, A. Lennarz, D. Lunney, et al., Phys. Rev. C 88, 054317 (2013), URL https://link.aps.org/doi/10.1103/PhysRevC.88.054317.
- Eliseev et al. [2013] S. Eliseev, K. Blaum, M. Block, C. Droese, M. Goncharov, E. Minaya Ramirez, D. A. Nesterenko, Y. N. Novikov, and L. Schweikhard, Phys. Rev. Lett. 110, 082501 (2013), URL https://link.aps.org/doi/10.1103/PhysRevLett.110.082501.
- Eliseev et al. [2014] S. Eliseev, K. Blaum, M. Block, A. Dörr, C. Droese, T. Eronen, M. Goncharov, M. Höcker, J. Ketter, E. Minaya Ramirez, et al., Appl. Phys. B 114, 107 (2014), URL https://doi.org/10.1007/s00340-013-5621-0.
- Nesterenko et al. [2020] D. Nesterenko, A. Kankainen, J. Kostensalo, C. Nobs, A. Bruce, O. Beliuskina, L. Canete, T. Eronen, E. Gamba, S. Geldhof, et al., Physics Letters B 808, 135642 (2020), ISSN 0370-2693, URL https://www.sciencedirect.com/science/article/pii/S0370269320304457.
- Hukkanen et al. [2023] M. Hukkanen, W. Ryssens, P. Ascher, M. Bender, T. Eronen, S. Grévy, A. Kankainen, M. Stryjczyk, L. Al Ayoubi, S. Ayet, et al., Phys. Rev. C 107, 014306 (2023), URL https://link.aps.org/doi/10.1103/PhysRevC.107.014306.
- Hager et al. [2007] U. Hager, V.-V. Elomaa, T. Eronen, J. Hakala, A. Jokinen, A. Kankainen, S. Rahaman, S. Rinta-Antila, A. Saastamoinen, T. Sonoda, et al., Phys. Rev. C 75, 064302 (2007), URL https://link.aps.org/doi/10.1103/PhysRevC.75.064302.
- Hakala et al. [2011] J. Hakala, R. Rodríguez-Guzmán, V. V. Elomaa, T. Eronen, A. Jokinen, V. S. Kolhinen, I. D. Moore, H. Penttilä, M. Reponen, J. Rissanen, et al., The European Physical Journal A 47, 129 (2011), ISSN 1434-601X, URL https://doi.org/10.1140/epja/i2011-11129-9.
- Eronen et al. [2012] T. Eronen, V. Kolhinen, V.-V. Elomaa, D. Gorelov, U. Hager, J. Hakala, A. Jokinen, A. Kankainen, P. Karvonen, S. Kopecky, et al., Eur. Phys. J. A 48, 46 (2012), URL https://doi.org/10.1140/epja/i2012-12046-1.
- König et al. [1995] M. König, G. Bollen, H.-J. Kluge, T. Otto, and J. Szerypo, Int. J. Mass Spectrom. Ion Process 142, 95 (1995), URL https://doi.org/10.1016/0168-1176(95)04146-C.
- Knöbel et al. [2016] R. Knöbel, M. Diwisch, H. Geissel, Y. A. Litvinov, Z. Patyk, W. R. Plaß, C. Scheidenberger, B. Sun, H. Weick, F. Bosch, et al., The European Physical Journal A 52, 138 (2016), ISSN 1434-601X, URL https://doi.org/10.1140/epja/i2016-16138-6.
- Huang et al. [2021] W. Huang, M. Wang, F. Kondev, G. Audi, and S. Naimi, Chinese Physics C 45, 030002 (2021), URL https://dx.doi.org/10.1088/1674-1137/abddb0.
- Ryssens et al. [2022] W. Ryssens, G. Scamps, S. Goriely, and M. Bender, The European Physical Journal A 58, 246 (2022), ISSN 1434-601X, URL https://doi.org/10.1140/epja/s10050-022-00894-5.
- Ryssens et al. [2023] W. Ryssens, G. Scamps, S. Goriely, and M. Bender, Eur. Phys. J. A 59, 96 (2023), ISSN 1434-601X, URL https://doi.org/10.1140/epja/s10050-023-01002-x.
- Moore et al. [2013] I. D. Moore, T. Eronen, D. Gorelov, J. Hakala, A. Jokinen, A. Kankainen, V. Kolhinen, J. Koponen, H. Penttilä, I. Pohjalainen, et al., Nuc. Inst. and Meth. in Physics Research Section B: Beam Interactions with Materials and Atoms 317, 208 (2013), URL https://doi.org/10.1016/j.nimb.2013.06.036.
- Karvonen et al. [2008] P. Karvonen, I. D. Moore, T. Sonoda, T. Kessler, H. Penttilä, K. Peräjärvi, P. Ronkanen, and J. Äystö, Nucl. Instrum. Meth. Phys. Res. B 266, 4794 (2008), URL https://doi.org/10.1016/j.nimb.2008.07.022.
- Nieminen et al. [2001] A. Nieminen, J. Huikari, A. Jokinen, J. Äystö, P. Campbell, and E. C. A. Cochrane, Nucl. Instrum. Meth. Phys. Res. A 469, 244 (2001), URL https://doi.org/10.1016/S0168-9002(00)00750-6.
- Savard et al. [1991] G. Savard, S. Becker, G. Bollen, H.-J. Kluge, R. B. Moore, T. Otto, L. Schweikhard, H. Stolzenberg, and U. Wiess, Phys. Lett. A 158, 247 (1991), URL https://doi.org/10.1016/0375-9601(91)91008-2.
- Kondev et al. [2021] F. Kondev, M. Wang, W. Huang, S. Naimi, and G. Audi, Chinese Physics C 45, 030001 (2021), URL https://doi.org/10.1088/1674-1137/abddae.
- Vilén et al. [2020] M. Vilén, L. Canete, B. Cheal, A. Giatzoglou, R. de Groote, A. de Roubin, T. Eronen, S. Geldhof, A. Jokinen, A. Kankainen, et al., Nuclear Instruments and Methods in Physics Research Section B: Beam Interactions with Materials and Atoms 463, 382 (2020), ISSN 0168-583X, URL https://www.sciencedirect.com/science/article/pii/S0168583X19302344.
- Nesterenko et al. [2018] D. A. Nesterenko, T. Eronen, A. Kankainen, L. Canete, A. Jokinen, I. D. Moore, H. Penttilä, S. Rinta-Antila, A. de Roubin, and M. Vilen, Eur. Phys. J. A. 54, 154 (2018), URL https://doi.org/10.1140/epja/i2018-12589-y.
- Nesterenko et al. [2021] D. Nesterenko, T. Eronen, Z. Ge, A. Kankainen, and M. Vilen, Eur. Phys. Jour. A 57, 302 (2021), URL https://doi.org/10.1140/epja/s10050-021-00608-3.
- Gräff et al. [1980] G. Gräff, H. Kalinowsky, and J. Traut, Z Physik A 297, 35 (1980), URL https://doi.org/10.1007/BF01414243.
- Kretzschmar [2007] M. Kretzschmar, Int. J. Mass Spectrom. 264, 122 (2007), URL https://doi.org/10.1016/j.ijms.2007.04.002.
- George et al. [2007] S. George, K. Blaum, F. Herfurth, A. Herlert, M. Kretzschmar, S. Nagy, S. Schwarz, L. Schweikhard, and C. Yazidjian, Int. J. Mass Spectrom. 264, 110 (2007), URL https://doi.org/10.1016/j.ijms.2007.04.003.
- Kellerbauer et al. [2003] A. Kellerbauer, K. Blaum, G. Bollen, F. Herfurth, H.-J. Kluge, M. Kuckein, E. Sauvan, C. Scheidenberger, and L. Schweikhard, Eur. Phys. J. D 22, 53 (2003), URL https://doi.org/10.1140/epjd/e2002-00222-0.
- Wang et al. [2021] M. Wang, W. Huang, F. Kondev, G. Audi, and S. Naimi, Chinese Physics C 45, 030003 (2021), URL https://doi.org/10.1088/1674-1137/abddaf.
- Rissanen et al. [2011] J. Rissanen, J. Kurpeta, A. Plochocki, V. V. Elomaa, T. Eronen, J. Hakala, A. Jokinen, A. Kankainen, P. Karvonen, I. D. Moore, et al., Eur. Phys. J. A 47, 97 (2011), URL https://doi.org/10.1140/epja/i2011-11097-0.
- Audi et al. [2003] G. Audi, O. Bersillon, J. Blachot, and A. Wapstra, Nucl. Phys. A 729, 3 (2003), ISSN 0375-9474, the 2003 NUBASE and Atomic Mass Evaluations, URL https://www.sciencedirect.com/science/article/pii/S0375947403018074.
- Audi et al. [2012] G. Audi, F. G. Kondev, M. Wang, B. Pfeiffer, X. Sun, J. Blachot, and M. MacCormick, Chin. Phys. C 36, 1157 (2012), URL https://dx.doi.org/10.1088/1674-1137/36/12/001.
- Audi et al. [2017] G. Audi, F. G. Kondev, M. Wang, W. J. Huang, and S. Naimi, Chin. Phys. C 41, 030001 (2017), URL https://dx.doi.org/10.1088/1674-1137/41/3/030001.
- J. Kurpeta et al. [1998] J. Kurpeta, G. Lhersonneau, J.C. Wang, P. Dendooven, A. Honkanen, M. Huhta, M. Oinonen, H. Penttilä, K. Peräjärvi, J.R. Persson, et al., Eur. Phys. J. A 2, 241 (1998), URL https://doi.org/10.1007/s100500050114.
- Kurpeta et al. [2007] J. Kurpeta, W. Urban, C. Droste, A. Płochocki, S. G. Rohoziński, T. Rzaca-Urban, T. Morek, L. Próchniak, K. Starosta, J. Äystö, et al., The European Physical Journal A 33, 307 (2007), ISSN 1434-601X, URL https://doi.org/10.1140/epja/i2006-10464-2.
- Blachot [2010] J. Blachot, Nucl. Data Sheets 111, 1471 (2010), ISSN 0090-3752, URL https://www.sciencedirect.com/science/article/pii/S0090375210000529.
- [40] K.-L. Kratz and B. Pfeiffer, private communication to G. Audi, June 2000.
- Kurpeta et al. [2010] J. Kurpeta, J. Rissanen, A. Płochocki, W. Urban, V.-V. Elomaa, T. Eronen, J. Hakala, A. Jokinen, A. Kankainen, P. Karvonen, et al., Phys. Rev. C 82, 064318 (2010), URL https://link.aps.org/doi/10.1103/PhysRevC.82.064318.
- Matos [2004] M. Matos, Ph.D. thesis, Justus-Liebig-Universität Giessen (2004), URL http://dx.doi.org/10.22029/jlupub-9512.
- Goriely et al. [2016] S. Goriely, N. Chamel, and J. M. Pearson, Physical Review C 93, 034337 (2016), ISSN 2469-9985, 2469-9993, URL https://link.aps.org/doi/10.1103/PhysRevC.93.034337.
- Möller et al. [2016] P. Möller, A. Sierk, T. Ichikawa, and H. Sagawa, Atomic Data and Nuclear Data Tables 109-110, 1 (2016), ISSN 0092-640X, URL https://www.sciencedirect.com/science/article/pii/S0092640X1600005X.
- Duflo and Zuker [1995] J. Duflo and A. Zuker, Physical Review C 52, R23 (1995), ISSN 0556-2813, 1089-490X, URL https://link.aps.org/doi/10.1103/PhysRevC.52.R23.
- Niu and Liang [2022] Z. M. Niu and H. Z. Liang, Physical Review C 106, L021303 (2022), URL https://link.aps.org/doi/10.1103/PhysRevC.106.L021303.
- Ryssens [2016] W. Ryssens, Ph.D. thesis, Université Libre de Bruxelles, Brussels (2016), URL https://inspirehep.net/files/3011a13e26b3c2dbf7429a4020f855bd.
- Xu et al. [2002] F. R. Xu, P. M. Walker, and R. Wyss, Phys. Rev. C 65, 021303 (2002), URL https://link.aps.org/doi/10.1103/PhysRevC.65.021303.
- Bally and Bender [2021] B. Bally and M. Bender, Phys. Rev. C 103, 024315 (2021), URL https://link.aps.org/doi/10.1103/PhysRevC.103.024315.