Observation of 2D Mott insulator and -superfluid quantum phase transition in shaking optical lattice
Abstract
The Mott insulator and superfluid phase transition is one of the most prominent phenomena in ultracold atoms. In this work, we report the observation of a novel 2D quantum phase transition between Mott insulator and superfluid in a shaking optical lattice. In the deep optical lattice regime, the lowest -band can be tuned to Mott phase, while the higher bands are itinerant for having larger bandwidth. Through a shaking technique coupling the orbital to orbital states, we experimentally observe the transition between the states of the and bands, leading to a quantum phase transition from 2D -orbital Mott phase to the -orbital superfluid which condensed at momentum. By using the band mapping method, we also observe the changes of atomic population in different energy bands during the transition, and the experimental results are well consistent with theoretical expectations.
I Introduction
The ultracold atoms loaded in optical lattices have provided a simple and controllable experimental platform for studying correlated quantum physics [1, 2, 3]. A most prominent phenomenon discovered in optical lattice is the quantum phase transition from superfluid (SF) to Mott insulator (MI). Such SF-MI transition is based on the Bose-Hubbard model proposed by Fisher [4]. This novel quantum phase transition was first observed experimentally by M. Greiner et al. in 2002, signifying a milestone progress that the study of ultracold atoms turned from the weakly interacting regime to the strongly interacting regime [5, 6]. The observation of SF-MI phase transition triggered a series of theoretical and experimental studies, such as many-body entanglement [7, 8], low-dimensional SF-MI transition [9, 10], short-range coherence in the Mott insulator [11, 12] and fermionic Mott insulator [13, 14].
While the lowest orbital physics have been mostly considered in optical lattice, the engineering of higher-orbital states has become feasible and attracted growing attention in the recent years [15, 16, 17]. Due to the presence of the orbital degeneracy, the -orbital optical lattice exhibit novel interacting effects [18, 19] including the spontaneous formation of orbital orders [20, 21, 22, 23, 24]. By applying a periodic frequency modulation to optical lattice, the coupling between and orbital states can be induced, allowing for loading and manipulation of atoms in the -band. This makes it feasible to explore in experiment the rich many-body physics for atoms excited in the bands. In particular, the 1D gliding phase [25, 26, 27], 2D -band Potts-nematic superfluidity [28, 29] and -band superfluid with chiral topological phonon excitations [30] in a hexagonal optical lattice were observed through modulation of the lattices. Moreover, the orbital states can also be applied to simulate an effective strong ferromagnetic interaction is achieved, with the ferromagnetic-antiferromagnetic phase transitions and the formation of magnetic domains being also observed [31, 32, 33, 34, 35].
When considering both the -band and -band simultaneously, the hybridization of these orbitals can be utilized to realize various forms of effective Hamiltonians [34, 36]. Particularly, the characteristics of inter-orbital resonant coupling can be employed to achieve topological structures [37, 38]. It was shown recently that the interactions between mixed orbital superfluids give rise to an unconventional type-II Nambu-Goldstone bosons with an emergent topological origin [39]. Additionally, the different orbitals can mimic different spin components [32, 40]. This provides an alternative way to simulate the synthetic spin-orbit (SO) coupling for ultracold atoms, which is the key ingredient in realizing the rich SO and topological physics [41, 42, 43, 44, 45, 46, 47, 48, 49, 50, 51, 52, 53, 54, 55]. On the other hand, due to the significantly different bandwidths, the -orbital and -orbital can be modulated separately and are simultaneously tuned into the Mott insulator phase and superfluid phase, respectively. Based on this feature, a recent experimental work has reported a novel 1D quantum phase transition between -band Mott insulator and -orbital -superfluid using Floquet modulation which couples the states [56]. Unlike the previous Mott-superfluid phase transition in pure band, the 1D Mott-SF transition is achieved by hybridizing two different obitals, i.e. the strongly interacting -orbital and the weakly interacting itinerary -band.
In this experiment, we report the observation of the first 2D quantum phase transition between Mott insulator and -superfluid by building a controllable Floquet modulation by shaking method to couple the orbital and orbitals in a square optical lattice. In the deep lattice regime, the -band is tuned into Mott phase, while the -bands are still itinerary. By shaking the optical lattice with frequency matching the energy difference between and orbitals, the hybridization between such two types of orbitals leads to the transition from Mott phase to superfluid one when the shaking strength is strong enough. The population dynamics of different bands are measured using band mapping techniques which provide a clear observation of the 2D Mott-SF transition. The experimental results are well consistent with the theoretical calculations.
II Model description and experimental setup
When the lattice is in the moving coordinate system, the one-dimensional equivalent Hamiltonian of the system can be expressed as:
| (1) | ||||
Where is the boson field operator, m is the mass, is the lattice potential of the optical lattice before adding modulation, is the equivalent interaction strength, is the inertia generated by the optical lattice displacement s(t) caused by vibration the force, where , which resonates with the energy gaps of the two lowest energy bands of Bloch, can couple these two energy bands. In the experiment, what we changed was changing the lattice vibration frequency and vibration amplitude. So when other parameters are fixed and only the lattice vibration frequency and vibration amplitude are changed, we assume that the interaction is 0, and the equivalent Hamiltonian can be written as:
| (2) | ||||
When we ignore the next-nearest neighbor and longer-distance tunneling, the two terms of and can be approximated as the energy of S band and P band. The equation 2 can be understood as the translation between the P band and the S band through term to form a hybridized energy band. is the energy gap between the S-band and P-band.
Our experimental setup is shown in Fig.1. The optical lattice is frequency-shifted by an acousto-optic modulator (AOM), and then the input fiber is transmitted to the vicinity of the vacuum cavity. We use double pass scheme in the experiment to ensure that the optical path is as unchanged as possible during the frequency modulation, thereby reducing the jitter of the optical lattice power during the modulation, so the frequency shift MHz. After being collimated and output from the optical fiber near the vacuum cavity, it is focused to the BEC position through a doublet lens with a focal length of 250 mm. The distance between the mirror and the center of the cavity is . The optical lattices in the X and Y directions have the same structure.
To verify whether the system can meet the experimental requirements in the optical lattice modulation experiment, we first modulate a one-dimensional optical lattice to determine the stability of the system. We use atoms in our experiments. We first obtain a BEC of 87Rb by evaporative cooling and the atoms number is .Then we adiabatically load the optical lattice within 80ms with a time constant of 20ms. Among them, the final well depth in the x and z directions is Er, and the well depth in the y direction is Er. Then we keep the atoms in the optical lattice for 16.6ms to ensure that the atoms are in a balanced state. The moment when the optical lattice is loaded is the zero point of time. When ms, a modulation signal is added to the optical lattice in the y direction. After the modulation is finished, all potential fields are turned off, and the atoms are allowed to fall freely under the action of gravity. Absorption imaging was performed after a TOF of 30ms. The timing diagram of modulation signal loading is shown in Figure.1(II) (III).
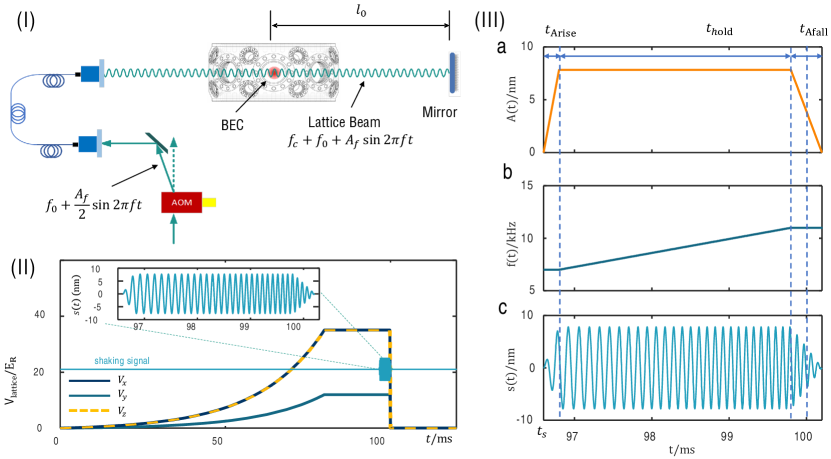
The modulation of the optical lattice is realized by adding a frequency modulation to the radio frequency signal of the optical lattice AOM, wherein the modulation frequency is . The RF signal is provided by a high-precision voltage-controlled oscillator (POS-150+ minicircuits, VCO). A voltage control is given to the VCO by a function generator (33521B, Keysight) identical to the optical lattice control, corresponding to the modulation of the frequency of the VCO. is the frequency of AOM radio frequency source before adding modulation, is the frequency of optical lattice before adding modulation, is the modulation frequency, and is the amplitude of modulation frequency oscillation. When the frequency of the optical lattice changes, the lattice will produce a shaking along the direction of the lattice, and the amplitude of the shaking can be calculated by the following method. The electric field of the optical lattice light is:
| (3) |
The light intensity of the light lattice is:
| (4) |
Where is the light wave vector. is the light wave vector of optical lattice before adding modulation. Since is within the range of the light waist of the optical lattice, , where the phase part can be re-define the starting time point to eliminate, then the longitudinal vibration range of the peak and valley of the frequency vibration is:
| (5) |
In our experiment, cm, it can be estimated that when MHz, the amplitude of the corresponding lattice vibration is nm. In the optical lattice loading stage, we maintain the modulation signal as V, corresponding to the center frequency of the AOM in the y direction as 110MHz. Then when the optical lattice is maintained in the optical trap for a period of time, when ms, a modulation signal is added to the control signal. Loading the oscillation amplitude of the modulating signal from 0 to within ms. At this time, the frequency of the modulating signal is and then within ms, linearly load the oscillation frequency from to , here During the process, the oscillation amplitude remains unchanged at . Finally, reduce the amplitude from to 0 within ms. The atoms are then imaged after TOF with all potential fields turned off.
III Observation of 1D MOTT-SF phase transition
Figure.2.(I) shows the Bloch energy bands of a one-dimensional modulated optical lattice obtained from theoretical simulations. When kHz, the ground state is a Mott insulator where all atoms are in the S band. As gradually increases, the P band of the Bloch band structure shifts down and hybridizes with the S band, resulting in a complex ground state. When continues to increase, the two bands flip and become independent, and all atoms are located in the P band, forming a superfluid phase. The position of the lowest point of the hybridized band shifts from to , where , and is the wavelength of the optical lattice, which is nm in the experiment.
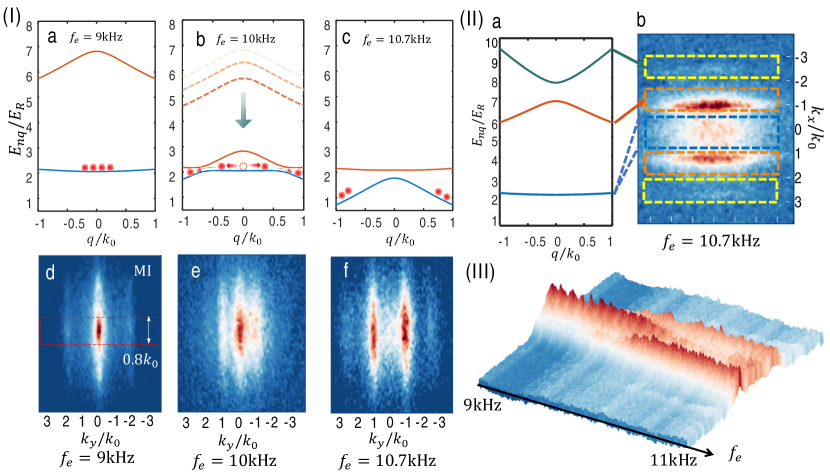
Atoms are distributed in the lowest point of the energy bands in momentum space. As the modulation frequency increases, the number of atoms located at gradually slides to both sides. When the modulation frequency reaches kHz, the atoms aggregate at . The atom number distribution after time-of-flight (TOF) is shown in Fig.2.(I)(d)-(f), which clearly shows the gradual change of atom distribution to . This change is the quantum phase transition from the Mott insulator to the superfluid phase.
In the experimental TOF diagram, we only considered the coupling between the S and P bands. In reality, there is also coupling between the P and D bands. When most of the atoms are transferred to the P band, some of the atoms will also be transferred to the D band due to the coupling between the energy bands. However, because it is difficult to distinguish between the atoms in the D and S bands in the momentum distribution plot, we cannot see the change in the number of atoms in the D band very intuitively in the TOF image.
In order to observe the distribution of atoms in the S, P, and D bands more intuitively, we use the bandmapping method to image the atoms. Bandmapping is a method that can help us determine the energy band in which a particle is located in an experiment. By adiabatically turning off the optical lattice, the Bloch function will evolve into a free electron wave function. The wave vector of the free electron plane wave is the same as the quasi-momentum wave vector of the Bloch function. Because the energy is almost unchanged during this process, the Bloch function of the nth energy band will be mapped to a plane wave with a wave vector in the nth Brillouin zone. In this case, we can infer the energy band in which the particle originally resided by observing the momentum of the plane wave. In the experimental operation, after the modulation of the optical lattice is completed, we adiabatically reduce the depth of the y-direction optical lattice from Er to 0 Er within 2 ms. The x,z direction optical lattices are still quickly turned off to 0 Er. After 30 ms of TOF, the atoms are imaged by absorption, and the imaging of the atoms using the band mapping method can be obtained, as shown in Figure.2.(II)b.
In Figure.2.(II), the corresponding optical lattice Bloch energy bands of the different momentum ranges of the atomic images can be seen. The blue region corresponds to the distribution of atoms in the S band, the orange region corresponds to the distribution of atoms in the P band, and the yellow region corresponds to the distribution of atoms in the D band. Taking the atoms at the center of the x-direction in Figure.2.(II).b with a momentum of , the variation of the momentum distribution of the atoms with can be observed, as shown in Figure.2.(III). As the modulation frequency changes, the atoms gradually transfer from the S band to the P band, and when most of the atoms transfer to the P band, some of the atoms begin to transfer to the D band due to the coupling between the energy bands. It can be seen that the atomic distribution gradually transfers from S band to P and D bands.
IV Observation of 2D MOTT-SF phase transition
When the reliability of the system is verified in a one-dimensional optical lattice, we extend the Mott-SF phase transition of one-dimensional optical lattice to two-dimensional. At this time, the Hamiltonian of the system can be expressed as:
| (6) |
Similar to the modulation of the one-dimensional optical lattice, after obtaining the BEC, we adiabatically load the optical lattice within 80 ms with a time constant of 20 ms. The final trap depth in the z direction remains Er, and the trap depth in the x and y directions is Er. Then we maintain the atoms in the optical lattice for 16.4 ms to ensure that they are in the equilibrium state. Similarly, taking the time of optical lattice loading as the time zero point, when ms, we apply modulation signals to the optical lattice in the x and y directions.
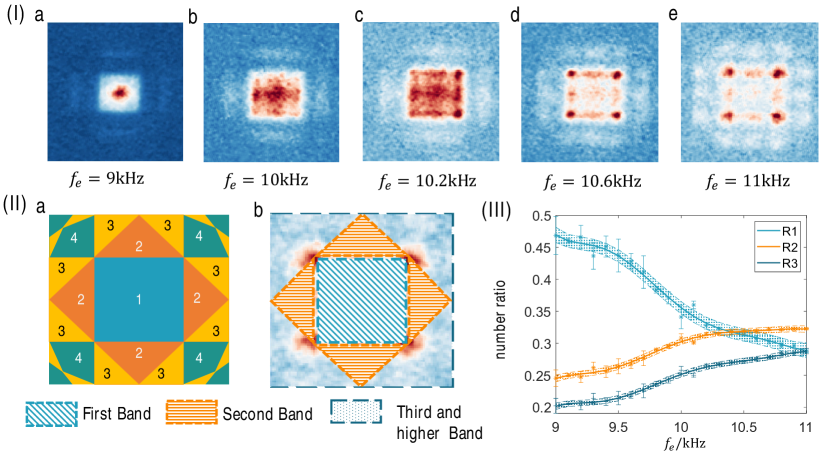
In 1D experiment, we observed that the bandmapping method can better observe the population distribution of atoms in different energy bands, making it easier to compare with theoretical simulations. Therefore, in the two-dimensional lattice experiment, we use the bandmapping imaging method. After the modulation of the lattice ends, we adiabatically reduce the depths of the optical lattice in the x and y directions, and , from Er to 0 Er within 2ms. The optical lattice in the z direction is still quickly closed to 0 Er. After 30 ms of TOF, we perform absorption imaging on the atoms. In Fig.3(I), we can observe that as the modulation frequency varies from 9 kHz to 11 kHz, the distribution of atom numbers gradually moves from the central region of in the four points of to other regions.
Since we used the bandmapping method, similar to the one-dimensional experiment, the distribution of the two-dimensional atom numbers in the imaging results can correspond to the Brillouin zone of the two-dimensional optical lattice. As shown in Fig.3.(II), the green diagonal line corresponds to the first Brillouin zone, the orange horizontal line corresponds to the second Brillouin zone, and the blue dots correspond to the third and fourth Brillouin zones. The ratio of the number of atoms in different Brillouin zones to the total number of atoms is taken as the population of atoms in that energy band. We can see that the population of atoms in different energy bands changes with the modulation frequency of the optical lattice. We can observe the transition from the Mott state to the SF state, and the phase transition point is around kHz.
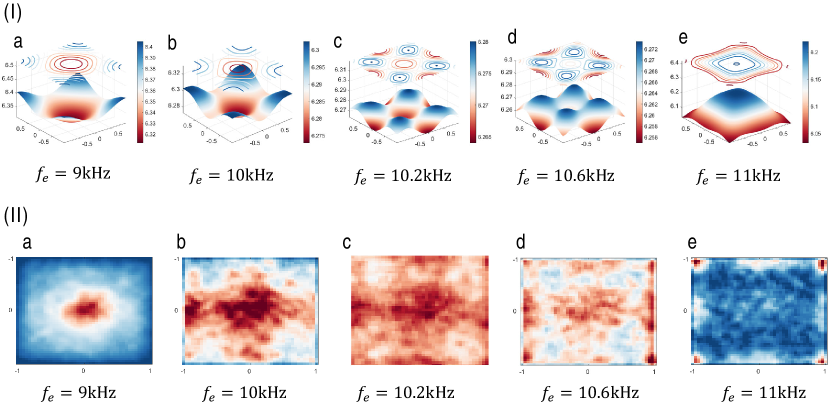
Similar to the one-dimensional optical lattice, we can theoretically simulate the Bloch bands of a two-dimensional optical lattice. As shown in Figure.4.(I), it is a theoretical simulation of the momentum distribution of the Bloch band S of a two-dimensional optical lattice. The first Brillouin zone in the Brillouin zone corresponds to the atomic momentum distribution of the Bloch band S. When we use the bandmapping method to perform absorption imaging observation of the atoms, similar to the one-dimensional optical lattice, in the imaging image, we can see a square momentum distribution with a width of , which coincides with the first Brillouin zone. In Figure.3. (I).a, we can see that the atoms are evenly distributed in the first Brillouin zone, and no atom population is detected in higher Brillouin zones. This proves that the atoms occupy the lowest energy band and no higher band is filled.
We compare the first Brillouin zone with the ground state of the theoretically simulated two-dimensional shaken optical lattice. As shown in Figure.4.(I)(II), as the modulation frequency increases from kHz to kHz, the atomic distribution gradually moves from at position (0,0) to the four points of , , , and . The data results are consistent with the theoretical simulation.
V Conclusion and outlook
In this work, we have experimentally studied a 2D quantum phase transition in square optical lattice by modulating the lattice shaking which couples the orbital and orbital states. With the band mapping technique which measures the population of atoms in different bands, we observed a novel phase transition from the orbital Mott insulator to orbital superfluid through increasing the shaking induced hybridization, with -orbital superfluid being condensed at the momentum. The observed Mott-SF phase transition agrees well with theoretical simulation.
The Mott-SF phase transition in shaking optical lattices is a novel new research topic, in which the quantum many-body physics are enriched due to the orbital degree of freedom. Future interesting issues including to explore the fundamental physical mechanisms of this phase transition, including the critical phenomena, quantum coherence, and quantum dynamics. In addition, one may study this phase transition in other systems, such as in topological quantum matter, quantum computing and quantum simulation systems. Moreover, in general the orbital ordering can be achieved in the -band. The transition between -band Mott insulator and orbital ordered -superfluid is a novel issue deserving the next study. Finally, the coupling between band and even higher bands may also bring rich quantum many-body physics.
This work is supported by the National Natural Science Foundation of China (Grants No. 11920101004, 11934002), and the National Key Research and Development Program of China (Grant No. 2021YFA1400900, 2021YFA0718300).
References
- Jaksch et al. [1998] D. Jaksch, C. Bruder, J. I. Cirac, C. W. Gardiner, and P. Zoller, Cold bosonic atoms in optical lattices, Physical Review Letters 81, 3108 (1998).
- Sherson et al. [2010] J. F. Sherson, C. Weitenberg, M. Endres, M. Cheneau, I. Bloch, and S. Kuhr, Single-atom-resolved fluorescence imaging of an atomic mott insulator, Nature 467, 68 (2010).
- Tarruell et al. [2012] L. Tarruell, D. Greif, T. Uehlinger, G. Jotzu, and T. Esslinger, Creating, moving and merging dirac points with a fermi gas in a tunable honeycomb lattice, Nature 483, 302 (2012).
- Fisher et al. [1989] M. P. Fisher, P. B. Weichman, G. Grinstein, and D. S. Fisher, Boson localization and the superfluid-insulator transition, Physical Review B 40, 546 (1989).
- Greiner et al. [2002a] M. Greiner, O. Mandel, T. Esslinger, T. W. Hänsch, and I. Bloch, Quantum phase transition from a superfluid to a mott insulator in a gas of ultracold atoms, nature 415, 39 (2002a).
- Greiner et al. [2002b] M. Greiner, O. Mandel, T. W. Hänsch, and I. Bloch, Collapse and revival of the matter wave field of a bose–einstein condensate, Nature 419, 51 (2002b).
- Briegel and Raussendorf [2001] H. J. Briegel and R. Raussendorf, Persistent entanglement in arrays of interacting particles, Physical Review Letters 86, 910 (2001).
- Mandel et al. [2003] O. Mandel, M. Greiner, A. Widera, T. Rom, T. W. Hänsch, and I. Bloch, Controlled collisions for multi-particle entanglement of optically trapped atoms, Nature 425, 937 (2003).
- Stöferle et al. [2004] T. Stöferle, H. Moritz, C. Schori, M. Köhl, and T. Esslinger, Transition from a strongly interacting 1 superfluid to a mott insulator, Physical review letters 92, 130403 (2004).
- Spielman et al. [2008] I. Spielman, W. Phillips, and J. Porto, Condensate fraction in a 2 bose gas measured across the mott-insulator transition, Physical Review Letters 100, 120402 (2008).
- Gerbier et al. [2005a] F. Gerbier, A. Widera, S. Fölling, O. Mandel, T. Gericke, and I. Bloch, Interference pattern and visibility of a mott insulator, Physical Review A 72, 053606 (2005a).
- Gerbier et al. [2005b] F. Gerbier, A. Widera, S. Fölling, O. Mandel, T. Gericke, and I. Bloch, Phase coherence of an atomic mott insulator, Physical Review Letters 95, 050404 (2005b).
- Jördens et al. [2008] R. Jördens, N. Strohmaier, K. Günter, H. Moritz, and T. Esslinger, A mott insulator of fermionic atoms in an optical lattice, Nature 455, 204 (2008).
- Schneider et al. [2008] U. Schneider, L. Hackermuller, S. Will, T. Best, I. Bloch, T. A. Costi, R. Helmes, D. Rasch, and A. Rosch, Metallic and insulating phases of repulsively interacting fermions in a 3 optical lattice, Science 322, 1520 (2008).
- Wirth et al. [2011] G. Wirth, M. Ölschläger, and A. Hemmerich, Evidence for orbital superfluidity in the p-band of a bipartite optical square lattice, Nature Physics 7, 147 (2011).
- Lewenstein and Liu [2011] M. Lewenstein and W. V. Liu, Orbital dance, Nature Physics 7, 101 (2011).
- Viebahn et al. [2021] K. Viebahn, J. Minguzzi, K. Sandholzer, A. S. Walter, M. Sajnani, F. Görg, and T. Esslinger, Suppressing dissipation in a floquet-hubbard system, Physical Review X 11, 011057 (2021).
- Isacsson and Girvin [2005] A. Isacsson and S. Girvin, Multiflavor bosonic hubbard models in the first excited bloch band of an optical lattice, Physical Review A 72, 053604 (2005).
- Kuklov [2006] A. Kuklov, Unconventional strongly interacting bose-einstein condensates in optical lattices, Physical review letters 97, 110405 (2006).
- Liu and Wu [2006] W. V. Liu and C. Wu, Atomic matter of nonzero-momentum bose-einstein condensation and orbital current order, Physical Review A 74, 013607 (2006).
- Wu [2008] C. Wu, Orbital ordering and frustration of -band mott insulators, Phys. Rev. Lett. 100, 200406 (2008).
- Li et al. [2011a] X. Li, W. V. Liu, and C. Lin, Bose-einstein supersolid phase for a type of momentum-dependent interaction, Physical Review A 83, 021602 (2011a).
- Li et al. [2011b] X. Li, E. Zhao, and W. V. Liu, Effective action approach to the p-band mott insulator and superfluid transition, Physical Review A 83, 063626 (2011b).
- Li et al. [2012] X. Li, Z. Zhang, and W. V. Liu, Time-reversal symmetry breaking of p-orbital bosons in a one-dimensional optical lattice, Physical review letters 108, 175302 (2012).
- Li and Liu [2016] X. Li and W. V. Liu, Physics of higher orbital bands in optical lattices: a review, Reports on Progress in Physics 79, 116401 (2016).
- Morimoto et al. [2017] T. Morimoto, H. C. Po, and A. Vishwanath, Floquet topological phases protected by time glide symmetry, Physical Review B 95, 195155 (2017).
- Ticco et al. [2016] S. V. P. Ticco, G. Fornasier, N. Manini, G. E. Santoro, E. Tosatti, and A. Vanossi, Subharmonic shapiro steps of sliding colloidal monolayers in optical lattices, Journal of Physics: Condensed Matter 28, 134006 (2016).
- Niu et al. [2018] L. Niu, S. Jin, X. Chen, X. Li, and X. Zhou, Observation of a dynamical sliding phase superfluid with -band bosons, Phys. Rev. Lett. 121, 265301 (2018).
- Jin et al. [2021] S. Jin, W. Zhang, X. Guo, X. Chen, X. Zhou, and X. Li, Evidence of potts-nematic superfluidity in a hexagonal optical lattice, Physical Review Letters 126, 035301 (2021).
- Wang et al. [2021a] X.-Q. Wang, G.-Q. Luo, J.-Y. Liu, W. V. Liu, A. Hemmerich, and Z.-F. Xu, Evidence for an atomic chiral superfluid with topological excitations, Nature 596, 227 (2021a).
- Clark et al. [2016] L. W. Clark, L. Feng, and C. Chin, Universal space-time scaling symmetry in the dynamics of bosons across a quantum phase transition, Science 354, 606 (2016).
- Clark et al. [2018] L. W. Clark, B. M. Anderson, L. Feng, A. Gaj, K. Levin, and C. Chin, Observation of density-dependent gauge fields in a bose-einstein condensate based on micromotion control in a shaken two-dimensional lattice, Physical review letters 121, 030402 (2018).
- Sun et al. [2023] J. Sun, R. Liao, P. Zhao, Z. Hu, Z. Wang, X.-J. Liu, X. Zhou, and X. Chen, A quantitative study of the micromotion of a p-band superfluid in a shaking lattice, Journal of Physics B: Atomic, Molecular and Optical Physics 56, 095302 (2023).
- Parker et al. [2013] C. V. Parker, L.-C. Ha, and C. Chin, Direct observation of effective ferromagnetic domains of cold atoms in a shaken optical lattice, Nature Physics 9, 769 (2013).
- Sachdeva and Busch [2017] R. Sachdeva and T. Busch, Creating superfluid vortex rings in artificial magnetic fields, Physical Review A 95, 033615 (2017).
- Ha et al. [2015] L.-C. Ha, L. W. Clark, C. V. Parker, B. M. Anderson, and C. Chin, Roton-maxon excitation spectrum of bose condensates in a shaken optical lattice, Physical review letters 114, 055301 (2015).
- Liu et al. [2010] X. J. Liu, X. Liu, C. Wu, and J. Sinova, Quantum anomalous hall effect with cold atoms trapped in a square lattice, Physical Review A 81, 033622 (2010).
- Li et al. [2013] X. Li, E. Zhao, and W. Vincent Liu, Topological states in a ladder-like optical lattice containing ultracold atoms in higher orbital bands, Nature communications 4, 1523 (2013).
- Pan et al. [2020] J.-S. Pan, W. V. Liu, and X.-J. Liu, Emergence of the unconventional type- nambu-goldstone modes with topological origin in bose superfluids, Physical Review Letters 125, 260402 (2020).
- Görg et al. [2019] F. Görg, K. Sandholzer, J. Minguzzi, R. Desbuquois, M. Messer, and T. Esslinger, Realization of density-dependent peierls phases to engineer quantized gauge fields coupled to ultracold matter, Nature Physics 15, 1161 (2019).
- Liu et al. [2009] X.-J. Liu, M. F. Borunda, X. Liu, and J. Sinova, Effect of induced spin-orbit coupling for atoms via laser fields, Physical review letters 102, 046402 (2009).
- Lin et al. [2011] Y.-J. Lin, K. Jiménez-García, and I. B. Spielman, Spin–orbit-coupled bose–einstein condensates, Nature 471, 83 (2011).
- Ando [2013] Y. Ando, Topological insulator materials, Journal of the Physical Society of Japan 82, 102001 (2013).
- Zhou et al. [2013] X. Zhou, Y. Li, Z. Cai, and C. Wu, Unconventional states of bosons with the synthetic spin–orbit coupling, Journal of Physics B: Atomic, Molecular and Optical Physics 46, 134001 (2013).
- Zhang and Zhou [2014] S.-L. Zhang and Q. Zhou, Shaping topological properties of the band structures in a shaken optical lattice, Physical Review A 90, 051601 (2014).
- Mei et al. [2014] F. Mei, J.-B. You, D.-W. Zhang, X. Yang, R. Fazio, S.-L. Zhu, and L. C. Kwek, Topological insulator and particle pumping in a one-dimensional shaken optical lattice, Physical Review A 90, 063638 (2014).
- Wu et al. [2016] Z. Wu, L. Zhang, W. Sun, X.-T. Xu, B.-Z. Wang, S.-C. Ji, Y. Deng, S. Chen, X.-J. Liu, and J.-W. Pan, Realization of two-dimensional spin-orbit coupling for bose-einstein condensates, Science 354, 83 (2016).
- Huang et al. [2016] L. Huang, Z. Meng, P. Wang, P. Peng, S.-L. Zhang, L. Chen, D. Li, Q. Zhou, and J. Zhang, Experimental realization of two-dimensional synthetic spin–orbit coupling in ultracold fermi gases, Nature Physics 12, 540 (2016).
- Zhang and Liu [2018] L. Zhang and X.-J. Liu, Spin-orbit coupling and topological phases for ultracold atoms, in Synthetic Spin-Orbit Coupling in Cold Atoms (World Scientific, 2018) pp. 1–87.
- Sun et al. [2018] W. Sun, B.-Z. Wang, X.-T. Xu, C.-R. Yi, L. Zhang, Z. Wu, Y. Deng, X.-J. Liu, S. Chen, and J.-W. Pan, Highly controllable and robust 2 spin-orbit coupling for quantum gases, Physical review letters 121, 150401 (2018).
- Cooper et al. [2019] N. Cooper, J. Dalibard, and I. Spielman, Topological bands for ultracold atoms, Reviews of modern physics 91, 015005 (2019).
- Lu et al. [2020] Y.-H. Lu, B.-Z. Wang, and X.-J. Liu, Ideal weyl semimetal with 3 spin-orbit coupled ultracold quantum gas, Science Bulletin 65, 2080 (2020).
- Yue et al. [2020] Y. Yue, C. S. de Melo, and I. Spielman, Enhanced transport of spin-orbit-coupled bose gases in disordered potentials, Physical Review A 102, 033325 (2020).
- Wang et al. [2021b] Z.-Y. Wang, X.-C. Cheng, B.-Z. Wang, J.-Y. Zhang, Y.-H. Lu, C.-R. Yi, S. Niu, Y. Deng, X.-J. Liu, S. Chen, et al., Realization of an ideal weyl semimetal band in a quantum gas with 3 spin-orbit coupling, Science 372, 271 (2021b).
- Lu et al. [2022] M. Lu, G. Reid, A. Fritsch, A. Piñeiro, and I. Spielman, Floquet engineering topological dirac bands, Physical review letters 129, 040402 (2022).
- Song et al. [2022] B. Song, S. Dutta, S. Bhave, J.-C. Yu, E. Carter, N. Cooper, and U. Schneider, Realizing discontinuous quantum phase transitions in a strongly correlated driven optical lattice, Nature Physics 18, 259 (2022).