Atrial Septal Defect Detection in Children Based on Ultrasound Video Using Multiple Instances Learning
Abstract
Purpose: Congenital heart defect (CHD) is the most common birth defect. Thoracic echocardiography (TTE) can provide sufficient cardiac structure information, evaluate hemodynamics and cardiac function, and is an effective method for atrial septal defect (ASD) examination. This paper aims to study a deep learning method based on cardiac ultrasound video to assist in ASD diagnosis. Materials and methods: We select two standard views of the atrial septum (subAS) and low parasternal four-compartment view (LPS4C) as the two views to identify ASD. We enlist data from 300 children patients as part of a double-blind experiment for five-fold cross-validation to verify the performance of our model. In addition, data from 30 children patients (15 positives and 15 negatives) are collected for clinician testing and compared to our model test results (these 30 samples do not participate in model training). We propose an echocardiography video-based atrial septal defect diagnosis system. In our model, we present a block random selection, maximal agreement decision and frame sampling strategy for training and testing respectively, resNet18 and r3D networks are used to extract the frame features and aggregate them to build a rich video-level representation. Results: We validate our model using our private dataset by five-cross validation. For ASD detection, we achieve AUC, accuracy, sensitivity, specificity and F1 score. Conclusion: The proposed model is multiple instances learning-based deep learning model for video atrial septal defect detection which effectively improves ASD detection accuracy when compared to the performances of previous networks and clinical doctors.
1 Introduction
Congenital Heart Defects (CHDs) are the most common birth defects, with an incidence rate of approximately 0.9% in live births. They are the main causes of death in children aged between 0 and 5 years old [1]. The atrial septum separates the left and right atrium during the embryonic period. The abnormal formation of this gap may lead to CHDs after birth. If the gap does not close by itself during growth and development, atrial septal defect (ASD) occurs [2]. Based on the occurrence of ASD can be classified into two categories: primary ASD and secundum ASD. The secundum ASD can be divided into four types: central defect, superior cavity defect, inferior cavity defect, and mixed defect according to the location of the defect [3]. The types of defect studied in this paper were secundum ASD. ASD in children is one of the most common CHDs, accounting for approximately 6–10% of CHDs, with an estimated occurrence rate of 1–3 per 1,000 [4]. The effect of ASD on the heart is a gradual process, starting from the right atrium volume overload to the right atrium expansion, and then to the right ventricle and pulmonary circulation system expansion, thus developing from the atrial shunt to pulmonary hypertension [2]. Most children with isolated atrial septal defects are free of symptoms, but the rates of exercise intolerance, arrhythmias, right ventricular failure, and pulmonary hypertension increase with age, and life expectancy is reduced in adults with untreated defects [5]. Therefore, accurate detection of ASD in early childhood is of great clinical importance.
Transthoracic echocardiography (TTE) can provide sufficient structural information about the heart and can be used to assess hemodynamics and cardiac function, serving as an effective method for ASD examination. The left and right atrial level shunt signals displayed by color Doppler flow imaging in echocardiography can accurately diagnose ASD [6]. The advantages of echocardiography include simplicity, non-invasiveness, low cost, repeatability, and accuracy. However, accurate diagnosis by TTE relies heavily on the accurate judgment of echocardiographers, which is time-consuming and subjective [7]. In China, especially in the regions with insufficient healthcare, there is a shortage of experienced cardiac ultrasound doctors. Meanwhile, poor-quality and noisy echocardiograms can lead to missed diagnoses and diagnostic errors as echocardiograms are affected by the machine imaging quality. It has been reported that up to 30% of ultrasound results are not very accurate [8]. Therefore, the research on the efficient and precise intelligent diagnostic of ASD is of paramount practical significance.
The development of deep learning (DL) [9][10], was soon applied to the field of image analysis [11][11][12][13]. Moreover, there has been much research work on the analysis of ultrasound [14][15] and echocardiography [16][17][18][19]. DL was recently shown to achieve exceptional performance in the realm of video understanding. The value of deep learning has been shown in 2D [20][21][22][23] and 3D networks [24][25][26]. The model we present in this paper is largely inspired by the aforementioned work in video understanding and offers improvement to it. There are some differences between the video understanding task and the video-based ASD recognition task that this article attempts to solve. Video understanding often involves providing a 3-5 second video and training the network to recognize its semantics. In such cases, the network pays more attention to the time-allowed information between video frames. In the case of video understanding, the model places more focus on the temporal information between video frames. However, during the ASD video recognition task, the video frames of most positive samples only appear for a short period of time. Therefore, how highlighting this segment is an issue that needs to address when designing ASD recognition networks. Furthermore, the review of our experimental results shows that the video classification network based on a 2D model is superior to a 3D model in terms of classification accuracy and efficiency in the case of ASD detection. One plausible reason is that, for echocardiography video, the similarity between frames is quite high, and 3D convolution networks are prone to overfitting this type of data.
In this study, we offer an atrial septal defect detection algorithm in children based on ultrasound video using multiple instance learning. We propose a block random sampling strategy and maximal agreement decision for training and testing our algorithm. Then, we use resNet18 to extract the frames feature. To enrich the temporal information between different echocardiography frames, we use 3D convolution after stage 2 in resNet18 and generate a temporal representation. Subsequently, for each frame feature, we use attention pooling to aggregate them to form a spatial representation. Finally, we combine the spatial representation and temporal representation to build a general video-level representation for ASD classification. Our novel approach contributes to work in this area in the following ways:
-
1.
To the best of our knowledge, classifying ASD based on video-level data is carried out for the first time.
-
2.
The training and testing video frame sampling techniques we proposed are shown to improve the accuracy of video-based ASD recognition. And these methods are easy to implement and apply to other video classification scenarios.
-
3.
When conducting clinical tests that compare our model’s capability to classify ASD with that of junior and senior doctors, we conclude that our model outperforms the doctors‘ results.
2 Materials and methods
2.1 Participants
The subjects of this retrospective study were pediatric patients undergoing color Doppler echocardiography at Shanghai Children’s Medical Center from March 1, 2022 to November 1, 2022. These cases included patients diagnosed with ASD (labelled as positive) and normal (labelled as negative).
2.2 Data Collection
This study was approved by the Institutional Review Board of Shanghai Children’s Medical Center (Approval No.SCMCIRB-K2022183-1) with a patient exemption applied. All patients were examined via echocardiography using GE Vivid E90 and E95 ultrasound systems with M5Sc and 6S transducers. We chose two standard views, the subcostal view of the atrial septum (subAS) and the low parasternal four-chamber view (LPS4C) and acquired their color doppler dynamic videos. All dynamic videos were blind reviewed by two senior sonographers and the videos with blurred atrial septum were excluded from the review. Standard imaging techniques were for two-dimensional, M-mode, and color doppler echocardiography in accordance with the recommendations by the American Society of Echocardiography [27]. All data was strictly de-identified to protect patient privacy. The original data was stored in the format of Digital Imaging and Communications in Medicine (DICOM) in the Picture Archiving and Communication Systems (PACS) database. For the convenience of program processing, DICOM data is converted into AVI dynamic video.
2.3 Training/Validation Dataset
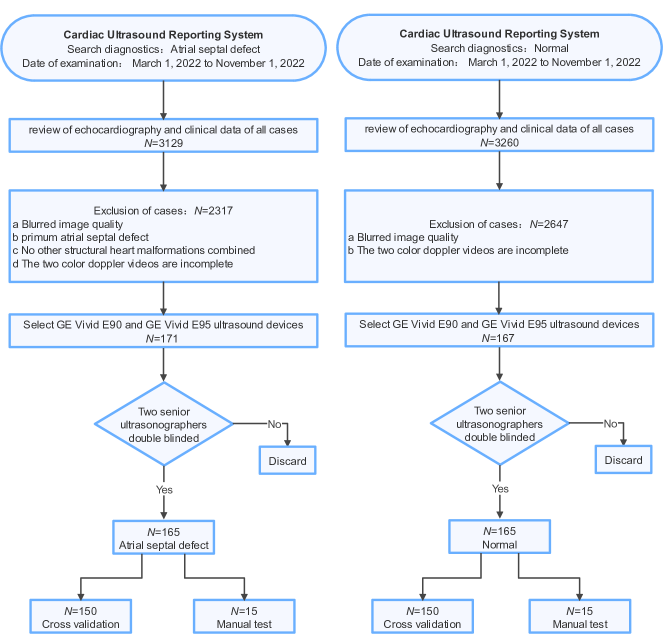
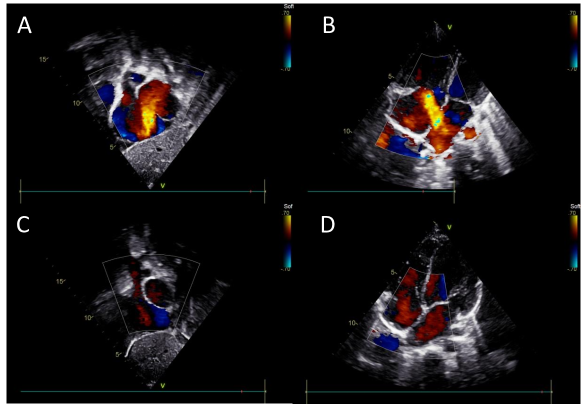
A total of 300 patients (resulting in 600 dynamic color doppler videos) are used as the training and validation set for ASD detection, as shown in Fig 1. The visualization of typical ASD and normal static images from the collected dataset is given in Fig 2. The recruitment of patients is initialized from the Ultrasound Report System of The Department of Pediatric Cardiology, Shanghai Children’s Medical Center by retrospective searching. The diagnostic keyword used is set as the “Atrial Septal Defect”, and the time of examination is set from March 1, 2022, to November 1, 2022. The obtained cases are reviewed consecutively to evaluate candidacy based on echocardiography results and clinical data. The process is given in Fig. 2. The final number of cases in ASD and normal are 165 and 165 respectively. While 150 cases in ASD and 150 cases in normal for cross-validation as well as 15 cases in ASD and 15 cases in normal for manual testing.
Specifically, the inclusion criteria for the data collection are: (1) Secundum Atrial Septal Defect; (2) the use of GE Vivid E90 and GE Vivid E95 ultrasound devices; (3) two color doppler videos of subcostal views of the atrial septum and low parasternal four-chamber view are available.
A few exclusion criteria are also in place to avoid interference with the training results of the model : (1) blurred image quality; (2) primum atrial septal defect; (3) no other structural heart malformations combined; (4) the two color doppler videos are incomplete.The demographic and clinical characteristics of the training and validation data sets are given in Table 1.
| Characteristics | ASD group ( = 150) | Normal group ( = 150) | -value |
|---|---|---|---|
| Age (years) | 2.66(1.41-4.68) | 2.23(0.91-5.23) | 0.15 |
| Female/male | 88/62 | 82/68 | 0.49 |
| Weight (kg) | 13.50(10.08-17.58) | 11.10(7.60-18.53) | 0.06 |
| Height (cm) | 80.00(93.00-110.00) | 87.50(69.75-113.25) | 0.05 |
| Size of ASD (mm) | 11.1±6.0 | - | - |
2.4 Methods
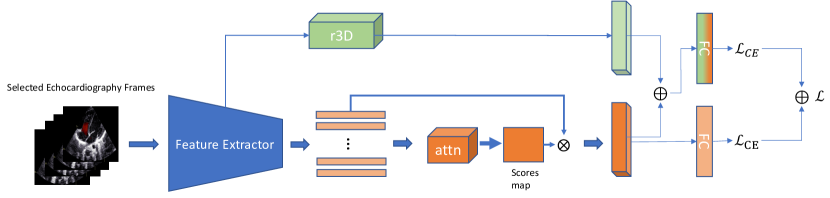
In this study, we propose an echocardiography video-based atrial septal defect diagnosis system. The overall model structure is given in Fig 3. We propose a block random frame sampling strategy for the training stage to train our model robustly. The maximum agreement decision during the testing stage is offered to refine inference prediction. Then, resNet18 is used as a feature extractor to capture the frame features. To enrich the temporal information between different echocardiography frames, we use 3D convolution after stage 2 in resNet18 and generate temporal representation. Afterwards, for each frame feature, attention pooling is used to aggregate them to form a spatial representation. Finally, we combine the spatial representation and temporal representation to build a general video-level representation for ASD classification.
2.4.1 Multiple Instance Learning
The video-based echocardiography ASD detection problem can be considered as a multiple-instance learning problem. Let denote the bag of frames in echocardiography videos. Let denote the frames in bag with a total of frame. Let denote the frame feature given by where is deep feature extractor. Let denote the video feature given by where is a feature aggregation function. Finally, let denote the label of bag , where . The aim is to establish a linear mapping function with projection .
2.4.2 Attention Aggregation
The feature aggregation function is used to represent a bag feature by aggregating all the frame features. Two common methods are and where takes the mean of all frame features to represent a video feature and takes maximum frame feature to represent a video feature. Because regardless of the feature relationship between different instances, these two methods aggregate features in a fixed manner, lacking flexibility. As a result, we use the attention aggregation module proposed in [28] to aggregate the features. Formally, we let denote a video with frames. The attention aggregation function is given by:
| (1) |
where
| (2) |
is a non-linearity activation function. is the dimension of the mapped feature. We set instead of the default value of in [28] to strengthen the capacity to model complicated data.
2.4.3 Feature Extraction
As stated earlier, there are typically two network architectures for video classification: 2D-based and 3D-based. For example, 3D convolutional networks [24][29][26] are widely used in video understanding. 3D convolution is used to model the temporal information. However, we argue that in video-based atrial septal defect detection, spatial information is not the principal factor, since a positive frame may appear within a short period of time. Hence, we build our classification model based on the 2D convolutional network. The overall model structure is depicted in Fig 3. For each frame, we use a resNet18 [9] to obtain the feature representation and concatenate them to form an general video representation where is the number of frames used for training and is the dimension of the feature. Following this, we use attention pooling to generate weights and multiply them by the general feature representation to form the final spatial representation . Although temporal information is not dominant in ASD detection, we can use 3D convolution [30] to model the temporal information of color doppler signals. Similar to [31], we extract the feature map from stage 2 of resNet18 and followed by stages 2 - 4 of r3d to capture temporal information between different training frames and generate a temporal feature representation . The final representation is given by:
| (3) |
2.4.4 Frame Sampling Strategy and Decision Rule
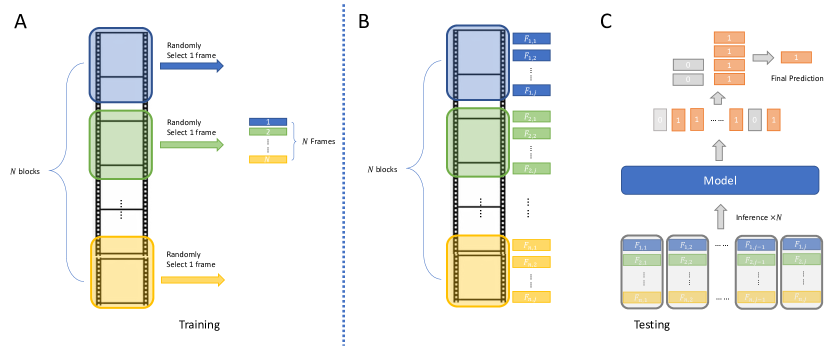
Since the video frames are computationally more expensive, using all frames in the training stage is time-consuming and inefficient. Furthermore, adjacent video clips have high similarities which may lead to overfitting. To address these, we propose two different frame selection strategies for the training stage and inference stage respectively. Fig 4 gives the overall frame sampling method. Similar to [21], we segment each video into blocks with each block containing the same number of frames. Subsequently, we randomly select one frame from the whole video to construct an -frames collection used for training. This can be regarded as data augmentation used to improve the robustness of the model. Compared to randomly sampling frames from the whole video, this method ensures the diversity of frames since we strictly divide the whole video into several blocks and sample frames from each of these blocks.
Since a positive sample of atrial septal defect may appear in any frames within the video, partially selecting frames may lead to misclassification. Hence, we utilize all frames for inference and propose a decision rule called maximal agreement decision. This decision rule is inspired by the majority rule in human society. Specifically, in the inference stage, we also split the whole video into blocks, for each block, we select frame , , where is the number of frames in a video block. is denoted as the th frames collection used for testing. We then have predictions . The final prediction for this video is determined by :
| (4) |
This decision rule mimics the difficult and severe diseases in real clinical practice. We consider as conclusions from all experts. Then, the major rule is used to obtain the final diagnosis.
3 Experiments
3.1 Experiments setup
We implement our model in PyTorch using an NVIDIA TESLA T4 GPU accelerator. The SGD optimizer is used with an initial learning rate of 1e-4. During training, we resize the video frames to 224224, we select frames from videos for training with batch size 32. In the main experiment, five-fold cross-validation is used to evaluate the performance of the proposed model. There is no data augmentation used in training.
Three hundred and thirty cases are used in this study. Specifically, three hundred cases are used to assess the performance of the proposed method. The remaining 30 cases are excluded from the training and are directly used for additional testing and their demographic and clinical characteristics of the dataset are shown in Table 2.
| Characteristics | ASD group ( = 15) | Normal group ( = 15) | -value |
|---|---|---|---|
| Age (years) | 3.33(1.33-5.74) | 3.57(1.25-5.58) | 0.96 |
| Female/male | 9/6 | 8/7 | 0.72 |
| Weight (kg) | 16.00(11.50-17.50) | 16.50(10.50-18.00) | 0.74 |
| Height (cm) | 85.00(105.00-110.00) | 86.00(106.00-112.00) | 0.86 |
| Size of ASD (mm) | 13.1±7.4 | - | - |
3.2 Evaluation protocols
We mainly evaluate our proposed model using confusion matrix analysis, described by the following metrics:
| (5) |
| (6) |
| (7) |
| (8) |
where TP is true positive, TN is true negative, FP is false positive and FN is false negative.
4 Results and Discussion
4.1 Main Results
As shown in Table 3, compared to different models including 3D CNN based, our proposed model achieves the best performance with ACU and accuracy on 5-fold cross-validation. The details of sensitivity, specificity and F1 score are given in Table 3. In addition, we compare the ASD classification accuracy with doctors‘ diagnoses of ASD. In 30 cases of testing both junior and senior doctors can achieve ASD detection accuracy of 63.66% and 71.70% respectively, while our model achieves 83.33% accuracy as shown in Table 6.
4.2 Ablation study
We also report the ablation study of our components, i.e, 3D fusion, attention aggregation, maximum agreement decision and block random selection. The results, given in Table 4 and Table 5, demonstrate the effectiveness of our proposed model for improving ASD detection accuracy.
| Model | 3D Fusion | AAM | Accuracy(%) | |
|---|---|---|---|---|
| ResNet18 | ✗ | ✗ | ||
| ✗ | ✔ | |||
| ✔ | ✗ | |||
| ✔ | ✔ |
| Model | MAD | BRS | Accuracy(%) | |
|---|---|---|---|---|
| Our model | ✗ | ✗ | ||
| ✗ | ✔ | |||
| ✔ | ✗ | |||
| ✔ | ✔ |
| Model | Accuracy(%) | PPV(%) | NPV(%) |
| Junior Doctor | 63.66 | 53.49 | 89.47 |
| Senior Doctor | 71.70 | 60.53 | |
| Ours | 81.25 |
4.3 Discussion
In Table 6, it can be seen that the accuracy for ASD detection of our proposed model is higher than that of both junior doctors and senior doctors detection rates. However, the NPV of our model is lower than that of the doctors. A similar result regarding early Alzheimer’s disease prediction using deep learning is reported in [32]. Positive Predictive Value (PPV) is an indicator to measure the ability of the model to avoid misdiagnosis and Negative Predictive Value (NPV) is used to measure the missed diagnosis ability. Higher PPV can indicate the potential of our model to use as an ASD assistance tool in clinical.
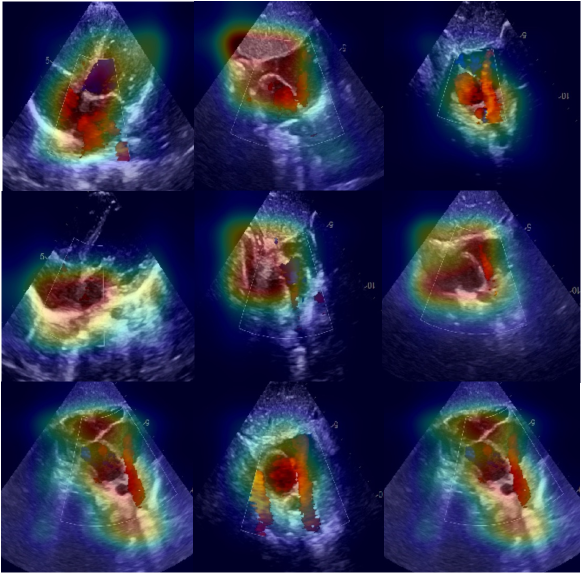
The heat map of our model is given in Fig 5. The most activated areas are shown by the color doppler signal area which indicates the blood flow signal. The importance of the color doppler signal in the diagnosis of ASD is emphasized by this finding.
In addition, we find that ASD shunt blood flow is not present in every frame of the cardiac cycle due to the systole and diastole of the heartbeat. To the best of our knowledge, this study is the first attempt to diagnose ASD in children at the ultrasound video level. It has been reported that deep learning algorithms can guide inexperienced diagnosticians to obtain echocardiograms for limited diagnosis [33]. Therefore, our design of ultrasound video diagnosis algorithm of ASD in children is of great clinical importance: for experienced doctors, it can help improve the efficiency of film review and ensure the reliability of ASD diagnosis; for less experienced doctors or even those who do not have the ability to review films, it can help provide echocardiography-based ASD diagnostic information and improve aiding the comprehensiveness of the diagnosis.
5 Conclusion
This paper proposes a multi-instance learning-based model for the diagnosis of atrial septal defects using ultrasound video that has achieved excellent results. Since atrial septal defect is a very common cardiac disease that is found in a large number of children, our method can not only help cardiac sonographers to improve the efficiency of diagnosis but also assist primary cardiac sonographers in making diagnostic decisions.
However, the limitations of our study are four-fold: First, we select ultrasound videos from using only two standard views for diagnosing atrial septal defects, while there are some other ultrasound videos from non-standard views that can diagnose atrial septal defects that are not included in our study; Second, our data sets were all secondary foramen ovale atrial septal defects and exclude primary foramen ovale atrial septal defects. In addition, the shunt direction of the defects is all left-to-right shunts from the left atrium to the right atrium; Finally, the amount of data in our article was small and single-centred. These aspects will be examined in our future work.
6 Acknowledgement
This work is supported by the National Natural Science Foundation of China (Grant No. 61975056), the Shanghai Natural Science Foundation (Grant No. 19ZR1416000), the Science and Technology Commission of Shanghai Municipality (Grant No. 20440713100) and the Key Program State Fund in XJTLU (KSF-A-22).
References
- [1] Qu-Ming Zhao et al. “Prevalence of congenital heart disease at live birth in China” In The Journal of pediatrics 204 Elsevier, 2019, pp. 53–58
- [2] Hongwei Chen et al. “Fully connected network with multi-scale dilation convolution module in evaluating atrial septal defect based on MRI segmentation” In Computer Methods and Programs in Biomedicine 215 Elsevier, 2022, pp. 106608
- [3] Jonathan Rhodes, Hitendra Patel and Ziyad M Hijazi “Effect of transcatheter closure of atrial septal defect on the cardiopulmonary response to exercise” In American Journal of Cardiology 90.7 Elsevier, 2002, pp. 803–806
- [4] Elisa A Bradley and Ali N Zaidi “Atrial septal defect” In Cardiology Clinics 38.3 Elsevier, 2020, pp. 317–324
- [5] Tal Geva, Jose D Martins and Rachel M Wald “Atrial septal defects” In The Lancet 383.9932 Elsevier, 2014, pp. 1921–1932
- [6] Su Huang et al. “An image-based comprehensive approach for automatic segmentation of left ventricle from cardiac short axis cine mr images” In Journal of digital imaging 24.4 Springer, 2011, pp. 598–608
- [7] Lanping Wu et al. “Standard echocardiographic view recognition in diagnosis of congenital heart defects in children using deep learning based on knowledge distillation” In Frontiers in Pediatrics 9 Frontiers Media SA, 2021
- [8] YingLi Lu et al. “Segmentation of left ventricle in cardiac cine MRI: An automatic image-driven method” In International Conference on Functional Imaging and Modeling of the Heart, 2009, pp. 339–347 Springer
- [9] Kaiming He, Xiangyu Zhang, Shaoqing Ren and Jian Sun “Deep residual learning for image recognition” In Proceedings of the IEEE conference on computer vision and pattern recognition, 2016, pp. 770–778
- [10] Alexey Dosovitskiy et al. “An image is worth 16x16 words: Transformers for image recognition at scale” In arXiv preprint arXiv:2010.11929, 2020
- [11] Olaf Ronneberger, Philipp Fischer and Thomas Brox “U-net: Convolutional networks for biomedical image segmentation” In Medical Image Computing and Computer-Assisted Intervention–MICCAI 2015: 18th International Conference, Munich, Germany, October 5-9, 2015, Proceedings, Part III 18, 2015, pp. 234–241 Springer
- [12] Deshraj Yadav et al. “Evalai: Towards better evaluation systems for ai agents” In arXiv preprint arXiv:1902.03570, 2019
- [13] Anjany Sekuboyina et al. “VerSe: A vertebrae labelling and segmentation benchmark for multi-detector CT images” In Medical image analysis 73 Elsevier, 2021, pp. 102166
- [14] Zhi Lin et al. “A New Dataset and a Baseline Model for Breast Lesion Detection in Ultrasound Videos” In Medical Image Computing and Computer Assisted Intervention–MICCAI 2022: 25th International Conference, Singapore, September 18–22, 2022, Proceedings, Part III, 2022, pp. 614–623 Springer
- [15] Yixiong Chen et al. “USCL: pretraining deep ultrasound image diagnosis model through video contrastive representation learning” In Medical Image Computing and Computer Assisted Intervention–MICCAI 2021: 24th International Conference, Strasbourg, France, September 27–October 1, 2021, Proceedings, Part VIII 24, 2021, pp. 627–637 Springer
- [16] Zhe Huang, Gary Long, Benjamin Wessler and Michael C Hughes “A new semi-supervised learning benchmark for classifying view and diagnosing aortic stenosis from echocardiograms” In Machine Learning for Healthcare Conference, 2021, pp. 614–647 PMLR
- [17] Sherif F Nagueh “Left ventricular diastolic function: understanding pathophysiology, diagnosis, and prognosis with echocardiography” In JACC: Cardiovascular Imaging 13.1 Part 2 American College of Cardiology Foundation Washington, DC, 2020, pp. 228–244
- [18] Andreas Østvik et al. “Myocardial function imaging in echocardiography using deep learning” In IEEE Transactions on Medical Imaging 40.5 IEEE, 2021, pp. 1340–1351
- [19] Shawn S Ahn et al. “Co-attention spatial transformer network for unsupervised motion tracking and cardiac strain analysis in 3D echocardiography” In Medical Image Analysis 84 Elsevier, 2023, pp. 102711
- [20] Karen Simonyan and Andrew Zisserman “Two-stream convolutional networks for action recognition in videos” In Advances in neural information processing systems 27, 2014
- [21] Limin Wang et al. “Temporal segment networks: Towards good practices for deep action recognition” In European conference on computer vision, 2016, pp. 20–36 Springer
- [22] Rongcheng Lin, Jing Xiao and Jianping Fan “Nextvlad: An efficient neural network to aggregate frame-level features for large-scale video classification” In Proceedings of the European Conference on Computer Vision (ECCV) Workshops, 2018, pp. 0–0
- [23] Christoph Feichtenhofer, Haoqi Fan, Jitendra Malik and Kaiming He “Slowfast networks for video recognition” In Proceedings of the IEEE/CVF international conference on computer vision, 2019, pp. 6202–6211
- [24] Du Tran et al. “Learning spatiotemporal features with 3d convolutional networks” In Proceedings of the IEEE international conference on computer vision, 2015, pp. 4489–4497
- [25] Joao Carreira and Andrew Zisserman “Quo vadis, action recognition? a new model and the kinetics dataset” In proceedings of the IEEE Conference on Computer Vision and Pattern Recognition, 2017, pp. 6299–6308
- [26] Du Tran et al. “A closer look at spatiotemporal convolutions for action recognition” In Proceedings of the IEEE conference on Computer Vision and Pattern Recognition, 2018, pp. 6450–6459
- [27] Leo Lopez et al. “Recommendations for quantification methods during the performance of a pediatric echocardiogram: a report from the Pediatric Measurements Writing Group of the American Society of Echocardiography Pediatric and Congenital Heart Disease Council” In Journal of the American Society of Echocardiography 23.5 Elsevier, 2010, pp. 465–495
- [28] Maximilian Ilse, Jakub Tomczak and Max Welling “Attention-based deep multiple instance learning” In International conference on machine learning, 2018, pp. 2127–2136 PMLR
- [29] Christoph Feichtenhofer “X3d: Expanding architectures for efficient video recognition” In Proceedings of the IEEE/CVF Conference on Computer Vision and Pattern Recognition, 2020, pp. 203–213
- [30] Kensho Hara, Hirokatsu Kataoka and Yutaka Satoh “Can spatiotemporal 3d cnns retrace the history of 2d cnns and imagenet?” In Proceedings of the IEEE conference on Computer Vision and Pattern Recognition, 2018, pp. 6546–6555
- [31] Mohammadreza Zolfaghari, Kamaljeet Singh and Thomas Brox “Eco: Efficient convolutional network for online video understanding” In Proceedings of the European conference on computer vision (ECCV), 2018, pp. 695–712
- [32] Zhentao Hu, Zheng Wang, Yong Jin and Wei Hou “VGG-TSwinformer: Transformer-based deep learning model for early Alzheimer’s disease prediction” In Computer Methods and Programs in Biomedicine 229 Elsevier, 2023, pp. 107291
- [33] Akhil Narang et al. “Utility of a deep-learning algorithm to guide novices to acquire echocardiograms for limited diagnostic use” In JAMA cardiology 6.6 American Medical Association, 2021, pp. 624–632