Financial Numeric Extreme Labelling: A Dataset and Benchmarking for XBRL Tagging
Abstract
The U.S. Securities and Exchange Commission (SEC) mandates all public companies to file periodic financial statements that should contain numerals annotated with a particular label from a taxonomy. In this paper, we formulate the task of automating the assignment of a label to a particular numeral span in a sentence from an extremely large label set. Towards this task, we release a dataset, Financial Numeric Extreme Labelling (FNXL), annotated with 2,794 labels. We benchmark the performance of the FNXL dataset by formulating the task as (a) a sequence labelling problem and (b) a pipeline with span extraction followed by Extreme Classification. Although the two approaches perform comparably, the pipeline solution provides a slight edge for the least frequent labels.
1 Introduction
In 2019, the U.S. Securities and Exchange Commission (SEC) mandated each company to use GAAP metrics111GAAP: Generally Accepted Accounting Principles, the number of metrics is continuously evolving. In 2021, the total number of metrics was 20,323. About 6K in textual content. to standardise financial reporting. These metrics are used to tag portions of SEC documents including, numerals using eXtensive Business Reporting Language (XBRL), an XML based language to facilitate the processing of financial information. The process of annotating the documents requires enormous manual effort: expert annotators from a company have to go through the document and mark each relevant detail with a relevant GAAP metric label. This necessitates the development of an automatic annotation process that may reduce the manual effort to annotate the documents. Solving this task would also help with annotation of old as well as new reports (which may not contain XBRL tags). Towards this goal, we aim to decrease the list of possible tags for annotators and provide them with a crisp list of k tags.
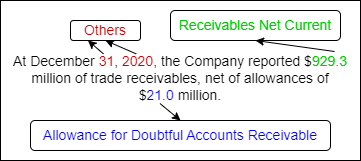
We define the problem as, given a sentence, identify the relevant numerals and assign them a particular GAAP label. An example of this annotation is provided in Figure 1 whereby each numeral is marked with a label or identified as ‘other’.
This problem has previously been tackled by FiNER Loukas et al. (2022), as a sequence labelling approach using BERT Devlin et al. (2019), where their set of labels is the 139 labels that occur the most frequently. However, we find that in the real-world setting, a much larger number of labels are used to annotate the text found in these documents. Thus, to evaluate the real world context, we painstakingly prepare a dataset, FNXL that contains a total of 2,794 tags. We realize that given the sheer number of labels, extreme classification is an ideal methodology that can be followed. Subsequently, we find that the AttentionXML method You et al. (2019) from the Extreme Classification (XC) repository Bhatia et al. (2016) can be modified to suit our problem setting. Consequently, we use the dataset, FNXL to benchmark both the FiNER based sequence labelling approach and the AttentionXML method. We find that XC methods give a comparable performance (better in certain situations) as FiNER. Specifically, XC performs better in tagging infrequent labels.
2 Dataset Description
2.1 Data Sources
To promote transparency, the government body, SEC (U.S. Securities And Exchange Commission) mandates publicly reporting companies to publish reports in order to disclose information at various intervals. For example, domestic companies must submit annual reports on Form 10-K, quarterly reports on Form 10-Q, and current reports on Form 8-K for a number of specified events, and must comply with a variety of other disclosure requirements. We use the publicly available222https://www.sec.gov/ annual 10-K reports from 2019-2021 for 2,339 companies as the source of our FNXL dataset. Annual reports are mandated by SEC to be annotated using XBRL (eXtensible Business Reporting Language) which is a freely available and global framework for exchanging business information. XBRL contains an ontology of metrics that include the GAAP: Generally Accepted Accounting Principles metrics. The number of metrics are continuously evolving and in 2021, the total number of metrics stood at 20,323. Out of these, about 6K were found in textual content.
Every annual report333https://bit.ly/example-10k contains 4 parts and 15 schedules out of which typically only 3 schedules contain XBRL metric annotated data: (a) Item 7. Management’s Discussion and Analysis of Financial Condition and Results of Operations. (b) Item 8. Financial Statements and Supplementary Data, and (c) Item 9. Changes in and Disagreements with Accountants on Accounting and Financial Disclosure.
2.2 FNXL Dataset
In this work, we focus only on annotated textual data and discard annotated tables. We analyse the fillings for the 2,339 companies and find that 160K sentences are annotated across these fillings, we filter out sentences with less than 50 characters and annotated data that is alphabetic; we only retain numeric annotated data. We also perform some manual cleaning on the dataset to remove some noisy datapoints. However, companies might annotate some numerals in the document with a self-defined taxonomy; consequently, we filter out all labels that are not US-GAAP labels. Finally, our Financial Numerical Extreme Labelling (FNXL) dataset444Code and Dataset available at: Github Link, contains a total of 79,088 sentences containing 142,922 annotated numerals with a label set of size 2,794.
| - | # sentences | # companies | # data points | # labels |
|---|---|---|---|---|
| Train | 62,782 | 798 | 111,493 | 2,692 |
| Dev | 6,823 | 756 | 13,191 | 1,273 |
| Test | 9,483 | 794 | 18,238 | 1,374 |
| Total | 79,088 | 840 | 142,922 | 2,794 |
To avoid data leakage, we divide the sentences according to the companies they belong to and create the train, validation and test set. We ensure that the companies in train set do not contribute to the validation or test set and vice-versa. This results in a approximately 78:9:13 percentage division between the train, validation and test set. We present the exact numbers in Table 1. The sentences have an average length of 37.83 tokens, stdev of 20.37 tokens and a maximum length of 590 tokens.
The validation and the test set also contain 40 and 69 labels not seen in the training data corresponding to 76 and 119 numerals, respectively. Similar to the entire dataset, these zero-shot data points also come from unseen documents and unseen companies in train set.
2.3 Label Set Details
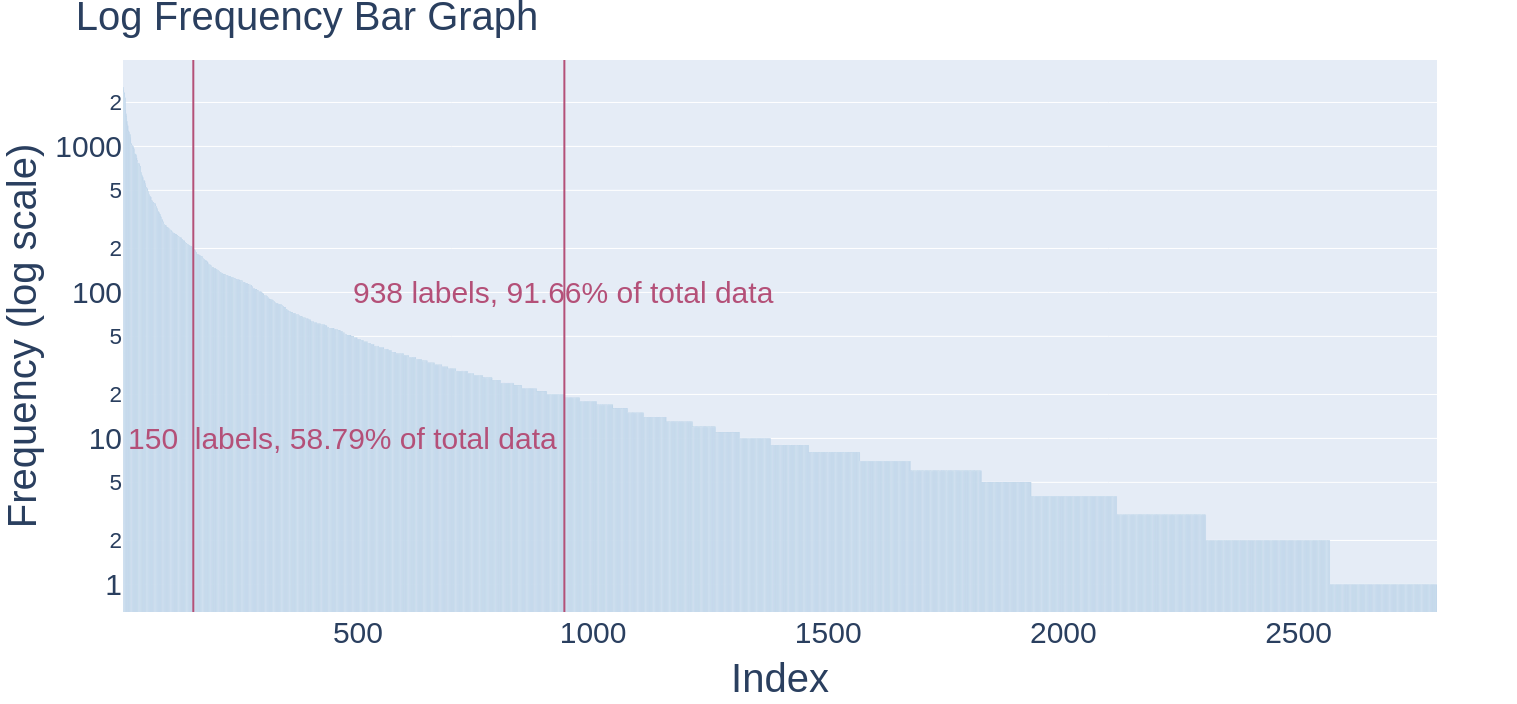
While in the FiNER-139 dataset Loukas et al. (2022), only the 139 most frequent XBRL tags with at least 1,000 appearances in the dataset are selected, we keep our data label set unfiltered and obtain a set of 2,794 labels. We find that 100 labels from the FiNER-139 dataset are part of our label set. We showcase the frequency distribution of our dataset in Figure 2.
| Max | Min | Avg ( Std dev) | |
|---|---|---|---|
| Data points per label | 2,529 | 1 | 51.15 ( 168.07) |
| Label density per sentence | 17 | 0 | 1.81 ( 1.04) |
| Unique label density per sentence | 8 | 0 | 1.18 ( 0.51) |
| Number of tokens in label name | 23 | 1 | 7.67 ( 3.79) |
In our FNXL dataset, we see that the top 150 frequently occurring labels (each containing more than 200 data points) out of 2,794 correspond to 58.79% of our total data points and the least 1,856 frequently occurring labels (each containing less than 20 data points) constitute 8.34% of our total data points. Some label specific statistics are given in Table 2.
We also analyse the cosine similarity of BERT representations of the names of the labels. We find that the average cosine similarity for the 5th most similar tag is 71.73% and maximum is 99.02%. One example of this is where the label "Other Comprehensive Income Loss Derivative Excluded Component Increase Decrease Before Adjustments After Tax" is very close to "Other … Decrease After Adjustments Before Tax ", "Other … Decrease Adjustments After Tax", "Other … Decrease Before Adjustments Tax".
3 Benchmarking
We extensively benchmark the dataset using two broad class of algorithms, the named-entity based FiNER model and Extreme Classification (XC) based AttentionXML model. We briefly describe these models and the different variations tried.
3.1 FiNER
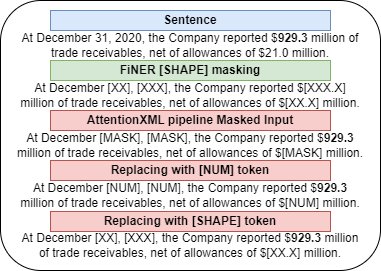
The Fine-Grained Named Entity Recognition (FiNER) approaches the task as a named entity recognition task, aiming to assign a label to each subword within a sentence. FiNER utilizes contextualized subword embeddings from fine-tuned BERT and a logistic regression layer to accurately classify named entities in text. FiNER identified an issue with over-fragmentation of numerals by the BERT tokenizer, which negatively impacts the performance of subword-based models. To overcome this problem, FiNER introduced two pseudo-tokens: [NUM], representing an entire numeral token, and [SHAPE], representing the shape of a numeral (e.g., 54.3 would be replaced by [XX.X]). They also additionally release SEC-BERT based models which are BERT-BASE models pre-trained on the EDGAR-CORPUS Loukas et al. (2021).
We showcase the results for six FiNER based models: three each of BERT-BASE and SEC-BASE, respectively. For each, the three models are no-masking, [NUM] and [SHAPE].
3.2 AttentionXML
Extreme Classification (XC) methods have shown to be effective on real-world datasets where the distribution of data points is extremely skewed and many tail labels often have very few data points to be trained on. Due to the similarity of our dataset with the XC datasets, we adapt an XC method to our use-case. In particular, we benchmark using AttentionXML which focuses on the entire input and not a particular span; we use a two-step approach to identify and label numerals in a sentence. The first step is to identify the relevant numerals in a sentence and the second step is to label the numerals with their corresponding label. We describe the two steps in detail below.
Binary Classifier: We use a BERT-based sequence tagger to identify the relevant numerals in a sentence. This tagger marks each numeral of a sentence with a label indicating whether it is a relevant numeral or not.
AttentionXML Model: It is a deep learning approach for multi-label text classification, consisting of five layers: a word representation layer, a bidirectional Long Short-Term Memory (BiLSTM) layer, a multi-label attention layer, a fully connected layer, and an output layer. GloVe word embeddings of tokenized text is fed as input to the the BiLSTM layer. The output is then passed through a multi-label attention mechanism introduced in You et al. (2019), which allows to capture the important parts of texts most relevant to each label. The model also includes one or two fully connected layers and an output layer, with shared parameters across all labels to reduce the risk of overfitting and keep the model scale small. The binary cross-entropy loss function is used to train the model.
While FiNER uses masking strategies to mask all numerals in a sentence, here we only mask the irrelevant numerals to psuedo-focus on the relevant numeral span. A relevant numeral here means the numeral for which we want the model to assign a label. We experiment with different masking strategies such as [MASK], [NUM] and [SHAPE] and showcase an example in Figure 3.
3.3 Evaluation Metrics
To evaluate the setting fairly we use the following metrics: 1) Macro-Precision 2) Macro-Recall 3) Macro-F1 4) Micro-Precision 5) Micro-Recall 6) Micro-F1. The macro-averaged F1 score is computed using the arithmetic mean of all the per-class F1 scores. For financial numeral labelling, all the tags are equally important. So using the macro average is a good choice as it treats all classes equally regardless of their frequency.
4 Results
| Model | Masking Token | Macro-Precision | Macro-Recall | Macro-F1 | Micro-Precision | Micro-Recall | Micro-F1 |
| FiNER (BERT-base) | no-masking | 49.17 | 49.71 | 47.13 | 76.493 | 75.21 | 75.84 |
| FiNER (BERT-base) | [NUM] | 48.86 | 48.01 | 46.16 | 76.51 | 74.68 | 75.58 |
| FiNER (BERT-base) | [SHAPE] | 42.74 | 43.93 | 40.62 | 72.13 | 72.56 | 72.35 |
| FiNER (SEC-base) | no-masking | 47.76 | 48.87 | 46.20 | 75.84 | 75.84 | 75.84 |
| FiNER (SEC-num) | [NUM] | 44.62 | 45.80 | 42.74 | 74.32 | 74.59 | 74.45 |
| FiNER (SEC-shape) | [SHAPE] | 45.53 | 45.34 | 42.93 | 75.15 | 73.33 | 74.23 |
| AttentionXML Pipeline | [MASK] | 49.83 | 47.99 | 46.58 | 73.91 | 74.37 | 74.14 |
| AttentionXML Pipeline | [NUM] | 49.01 | 48.25 | 46.49 | 73.57 | 74.03 | 73.8 |
| AttentionXML Pipeline | [SHAPE] | 50.69 | 48.51 | 47.54 | 74.5 | 74.96 | 74.74 |
We report the results for 9 experiments in total, 6 FiNER based models and 3 AttentionXML based models as showcased in Table 3.
We observe that the AttentionXML pipeline performs better in Macro scores than the FiNER model. The best performing AttentionXML pipeline uses the [SHAPE] masking token and achieves a 47.54% Macro-F1 vis-a-vis 47.13% Macro-F1 for best the FiNER model with no-masking. However, FiNER performs better in the Micro values achieving a 75.84% Micro-F1 vis-a-vis 74.74% Micro-F1 for AttentionXML pipeline. The superior performance of FiNER in Micro metrics can be attributed to its better performance with popular labels as the frequency distribution of labels follow a long-tail distribution. This is elaborated in Section 4.1.
We also observe that the masking technique does not help the FiNER model as can be seen in the case of BERT-base FiNER models. We note that the BERT-base models perform better than the SEC based models in terms of Macro-F1 and comparable in terms of Micro-F1. The adapted masking technique is beneficial in case of AttentionXML pipeline. We theorize that since AttentionXML uses GloVe word embeddings, it does not face the problem of defragmentation. Also, unlike FiNER, in AttentionXML masking is done on irrelevant numerals which helps the model focus on the context of the relevant numeral. From the results we can establish that the [NUM] and [SHAPE] psuedo-tokens help AttentionXML model successfully generalize over numeric expressions.
4.1 Bucket Analysis
Table 5 shows the average performance across FiNER and AttentionXML pipeline models for top-100 and bottom-1000 frequent occurring classes (for both we consider the best performing model. Exhaustive model wise results are shown in Appendix A). The performance of FiNER is superior for frequently occurring labels while it is vice-versa for infrequent tokens. This confirms the reason behind AttentionXML pipelines’ better performance in the Macro related metric where each class (label) is giving the same importance. Due to space constraints, we give the top frequently occurring label analysis in Appendix A.
| Model | Masking Token | Macro-Precision | Macro-Recall | Macro-F1 |
| FiNER (BERT-base) | no-masking | 43.28 | 38.88 | 40.03 |
| FiNER (BERT-base) | [NUM] | 45.54 | 40.24 | 41.76 |
| FiNER (BERT-base) | [SHAPE] | 38.97 | 34.22 | 35.70 |
| FiNER avg. | 42.601 | 37.783 | 39.166 | |
| AttentionXML Pipeline | [MASK] | 45.33 | 40.79 | 42.12 |
| AttentionXML Pipeline | [NUM] | 45.87 | 41.48 | 42.77 |
| AttentionXML Pipeline | [SHAPE] | 45.33 | 40.44 | 41.83 |
| AttentionXML Pipeline avg. | 45.513 | 40.91 | 42.245 |
Least frequently occurring labels: We observe that that masking with [NUM] token provides the best performance for both the models with FiNER with [NUM] token masking showcasing a 41.76% Macro-F1 and AttentionXML pipeline with [NUM] token masking showcasing a 42.77% Macro-F1. On average, AttentionXML pipeline performs better than FiNER.
| Model | Macro-Precision | Macro-Recall | Macro-F1 |
| Top 100 frequently occurring labels | |||
| FiNER avg. | 90.28 | 77.94 | 82.52 |
| AttentionXML Pipeline avg. | 88.81 | 77.87 | 81.97 |
| Least 1000 frequent labels | |||
| FiNER avg. | 42.60 | 37.78 | 39.17 |
| AttentionXML Pipeline avg. | 45.51 | 40.91 | 42.25 |
4.2 Hits@k
Although we have evaluated based on exact match, the system may in practical setting recommend the top k tags to subject matter experts (SME) for a particular numeral which she may use to quickly produce the correct annotation. We evaluate the AttentionXML pipeline for this step and report the results in Table 6. We observe that 90% Hits@5 and 92% Hits@10 is achieved for all the AttentionXML pipeline models. This would mean that in more than 90% of the cases the annotator would only have to inspect 5-10 labels.
| Model | Masking Token | Hits@1 | Hits@3 | Hits@5 | Hits@10 |
| AttentionXML Pipeline | [MASK] | 76.09 | 87.54 | 90.14 | 92.36 |
| AttentionXML Pipeline | [NUM] | 75.89 | 87.24 | 89.96 | 92.06 |
| AttentionXML Pipeline | [SHAPE] | 76.76 | 87.49 | 89.84 | 92.15 |
However, we need to inspect whether the task really becomes easier. We first check the average cosine similarity between the top 5 labels predicted by the AttentionXML pipeline and found it to be very high ( Figure 7) which can easily confuse SMEs. We next carry out a human experiments with SMEs which is reported next.
4.3 Evaluation by Financial Domain Experts
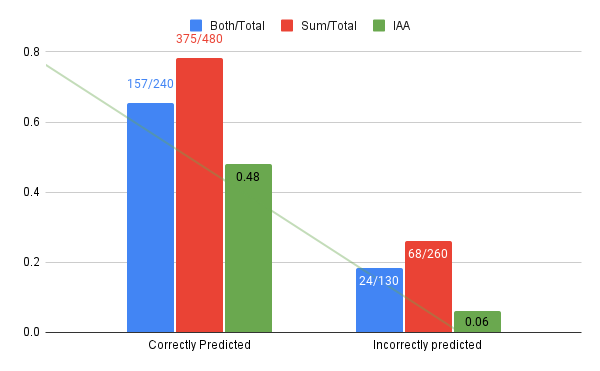
We recruited a team of 6 financial SME who were asked to select the correct label for a numeral in a sentence from a list of top-5 ranked labels by the AttentionXML [SHAPE] pipeline model. The experts are of Indian origin and non-native English speakers. They have been working in the industry for an average of 5 years (ranging from 2-10 years). The participants were remunerated equivalent to their half-a-day pay for their involvement in the task. The participants report that they could complete about 30 annotations per hour. It is worth noting that while the team members have an experience of 5 years in the industry on average, they have only a generic knowledge on XBRL annotation. We ensure that the correct label was in the top 5 and this information was revealed to the participants. In total, 305 datapoints were divided into 3 parts and each part was annotated by 2 SMEs.
The results, shown in Figure 4, show that the annotators performed best when AttentionXML has been able to predict correctly. Not only maximum labels were predicted correctly by either both or one of the annotators but the inter-annotator agreement was also high. The performance of humans deteriorated a lot for cases where machine has also failed.
5 Conclusion
The paper provides a detailed idea about the challenges faced in tagging numerals with labels when the number of labels is large (2,794 tags) and follow a long-tail distribution. We have rigorously collected an extensive set of labels, done an extensive bench-marking and executed a very specialized human experiment. We believe the scope to include more information about the US-GAAP metrics label in the annotation model and a method to automate human-AI feedback loop would be the way forward to improve the performance of this difficult task. The dataset and codes are publicly available.
6 Limitations
This work has only focussed on numerals from 10-K documents mandated by SEC. Our dataset, at present, does not include any annotated words as we focus only on numerals. It also does not include any tabular data. We also find that companies often annotate text with their custom labels which are not included in our dataset. We also find that often, it is difficult to label a numeral based on just the text of the sentence; the context might depend on surrounding paragraph, associated tables, etc. To this end, we have not benchmarked the performance using this information. However, we provide certain metadata along with the data points, including the company name, the year document was published, and the surrounding text which may be used to develop improved models.
7 Ethics Statement
Given the impact of our proposed contributions on the financial community in particular, and wider research community in general, our dataset and codes are publicly available. Our labels are derived from public/open domain. Still, we may ask users, intending to access our data, to provide a self declaration that the data is to be used solely for research purposes.
References
- Akhtar et al. (2017) Md Shad Akhtar, Abhishek Kumar, Deepanway Ghosal, Asif Ekbal, and Pushpak Bhattacharyya. 2017. A multilayer perceptron based ensemble technique for fine-grained financial sentiment analysis. In Proceedings of the 2017 conference on empirical methods in natural language processing, pages 540–546.
- Bhatia et al. (2016) K. Bhatia, K. Dahiya, H. Jain, P. Kar, A. Mittal, Y. Prabhu, and M. Varma. 2016. The extreme classification repository: Multi-label datasets and code.
- Chen et al. (2020) Chung-Chi Chen, Hen-Hsen Huang, Hiroya Takamura, and Hsin-Hsi Chen, editors. 2020. Proceedings of the Second Workshop on Financial Technology and Natural Language Processing. -, Kyoto, Japan.
- Chen et al. (2019) Deli Chen, Shuming Ma, Keiko Harimoto, Ruihan Bao, Qi Su, and Xu Sun. 2019. Group, extract and aggregate: Summarizing a large amount of finance news for forex movement prediction. In Proceedings of the Second Workshop on Economics and Natural Language Processing, pages 41–50.
- Daudert and Ahmadi (2019) Tobias Daudert and Sina Ahmadi. 2019. CoFiF: A corpus of financial reports in French language. In Proceedings of the First Workshop on Financial Technology and Natural Language Processing, pages 21–26, Macao, China.
- Devlin et al. (2019) Jacob Devlin, Ming-Wei Chang, Kenton Lee, and Kristina Toutanova. 2019. Bert: Pre-training of deep bidirectional transformers for language understanding. In Proceedings of the 2019 Conference of the North American Chapter of the Association for Computational Linguistics: Human Language Technologies, Volume 1 (Long and Short Papers), pages 4171–4186.
- Dor et al. (2019) Liat Ein Dor, Ariel Gera, Orith Toledo-Ronen, Alon Halfon, Benjamin Sznajder, Lena Dankin, Yonatan Bilu, Yoav Katz, and Noam Slonim. 2019. Financial event extraction using wikipedia-based weak supervision. In Proceedings of the Second Workshop on Economics and Natural Language Processing, pages 10–15.
- El-Haj et al. (2020) Dr Mahmoud El-Haj, Dr Vasiliki Athanasakou, Dr Sira Ferradans, Dr Catherine Salzedo, Dr Ans Elhag, Dr Houda Bouamor, Dr Marina Litvak, Dr Paul Rayson, Dr George Giannakopoulos, and Nikiforos Pittaras, editors. 2020. Proceedings of the 1st Joint Workshop on Financial Narrative Processing and MultiLing Financial Summarisation. COLING, Barcelona, Spain (Online).
- Francis et al. (2019) Sumam Francis, Jordy Van Landeghem, and Marie-Francine Moens. 2019. Transfer learning for named entity recognition in financial and biomedical documents. Information, 10(8).
- Gandhi et al. (2019) Priyank Gandhi, Tim Loughran, and Bill McDonald. 2019. Using annual report sentiment as a proxy for financial distress in us banks. Journal of Behavioral Finance, 20(4):424–436.
- Hahn et al. (2019) Udo Hahn, Véronique Hoste, and Zhu Zhang, editors. 2019. Proceedings of the Second Workshop on Economics and Natural Language Processing. Association for Computational Linguistics, Hong Kong.
- Händschke et al. (2018) Sebastian GM Händschke, Sven Buechel, Jan Goldenstein, Philipp Poschmann, Tinghui Duan, Peter Walgenbach, and Udo Hahn. 2018. A corpus of corporate annual and social responsibility reports: 280 million tokens of balanced organizational writing. In Proceedings of the first workshop on economics and natural language processing, pages 20–31.
- Izumi and Sakaji (2019) Kiyoshi Izumi and Hiroki Sakaji. 2019. Economic causal-chain search using text mining technology. In International Joint Conference on Artificial Intelligence, pages 23–35. Springer.
- Jacobs et al. (2018) Gilles Jacobs, Els Lefever, and Veronique Hoste. 2018. Economic event detection in company-specific news text. In Proceedings of the First Workshop on Economics and Natural Language Processing, pages 1–10.
- Katsafados et al. (2021) Apostolos G Katsafados, Ion Androutsopoulos, Ilias Chalkidis, Emmanouel Fergadiotis, George N Leledakis, and Emmanouil G Pyrgiotakis. 2021. Using textual analysis to identify merger participants: Evidence from the us banking industry. Finance Research Letters, 42:101949.
- Kogan et al. (2009) Shimon Kogan, Dimitry Levin, Bryan R Routledge, Jacob S Sagi, and Noah A Smith. 2009. Predicting risk from financial reports with regression. In Proceedings of human language technologies: the 2009 annual conference of the North American Chapter of the Association for Computational Linguistics, pages 272–280.
- Lee et al. (2014) Heeyoung Lee, Mihai Surdeanu, Bill MacCartney, and Dan Jurafsky. 2014. On the importance of text analysis for stock price prediction. In LREC, volume 2014, pages 1170–1175.
- Loukas et al. (2021) Lefteris Loukas, Manos Fergadiotis, Ion Androutsopoulos, and Prodromos Malakasiotis. 2021. Edgar-corpus: Billions of tokens make the world go round. In Proceedings of the Third Workshop on Economics and Natural Language Processing, pages 13–18.
- Loukas et al. (2022) Lefteris Loukas, Manos Fergadiotis, Ilias Chalkidis, Eirini Spyropoulou, Prodromos Malakasiotis, Ion Androutsopoulos, and Georgios Paliouras. 2022. Finer: Financial numeric entity recognition for xbrl tagging. In Proceedings of the 60th Annual Meeting of the Association for Computational Linguistics (Volume 1: Long Papers), pages 4419–4431.
- Malo et al. (2014) Pekka Malo, Ankur Sinha, Pekka Korhonen, Jyrki Wallenius, and Pyry Takala. 2014. Good debt or bad debt: Detecting semantic orientations in economic texts. Journal of the Association for Information Science and Technology, 65(4):782–796.
- Mukherjee et al. (2022) Rajdeep Mukherjee, Abhinav Bohra, Akash Banerjee, Soumya Sharma, Manjunath Hegde, Afreen Shaikh, Shivani Shrivastava, Koustuv Dasgupta, Niloy Ganguly, and Pawan Goyal. 2022. Ectsum: A new benchmark dataset for bullet point summarization of long earnings call transcripts. Proceedings of the 2022 Conference on Empirical Methods in Natural Language Processing, pages 10893–10906.
- Nayak et al. (2022) Tapas Nayak, Soumya Sharma, Yash Butala, K. Dasgupta, Pawan Goyal, and Niloy Ganguly. 2022. A generative approach for financial causality extraction. Companion Proceedings of the Web Conference 2022.
- Sharma et al. (2022) Soumya Sharma, Tapas Nayak, Arusarka Bose, Ajay Kumar Meena, K. Dasgupta, Niloy Ganguly, and Pawan Goyal. 2022. Finred: A dataset for relation extraction in financial domain. Companion Proceedings of the Web Conference 2022.
- Tabari et al. (2018) Narges Tabari, Piyusha Biswas, Bhanu Praneeth, Armin Seyeditabari, Mirsad Hadzikadic, and Wlodek Zadrozny. 2018. Causality analysis of twitter sentiments and stock market returns. In Proceedings of the first workshop on economics and natural language processing, pages 11–19.
- Wang et al. (2013) Chuan-Ju Wang, Ming-Feng Tsai, Tse Liu, and Chin-Ting Chang. 2013. Financial sentiment analysis for risk prediction. In IJCNLP.
- Yang et al. (2019) Linyi Yang, Ruihai Dong, Tin Lok James Ng, and Yang Xu. 2019. Leveraging bert to improve the fears index for stock forecasting. In Proceedings of the First Workshop on Financial Technology and Natural Language Processing, pages 54–60.
- You et al. (2019) Ronghui You, Zihan Zhang, Ziye Wang, Suyang Dai, Hiroshi Mamitsuka, and Shanfeng Zhu. 2019. Attentionxml: Label tree-based attention-aware deep model for high-performance extreme multi-label text classification. Advances in Neural Information Processing Systems, 32.
- Zhai and Zhang (2019) Shuang Sophie Zhai and Zhu Drew Zhang. 2019. Forecasting firm material events from 8-k reports. In Proceedings of the Second Workshop on Economics and Natural Language Processing, pages 22–30.
Appendix A Appendix
A.1 Formats of the dataset
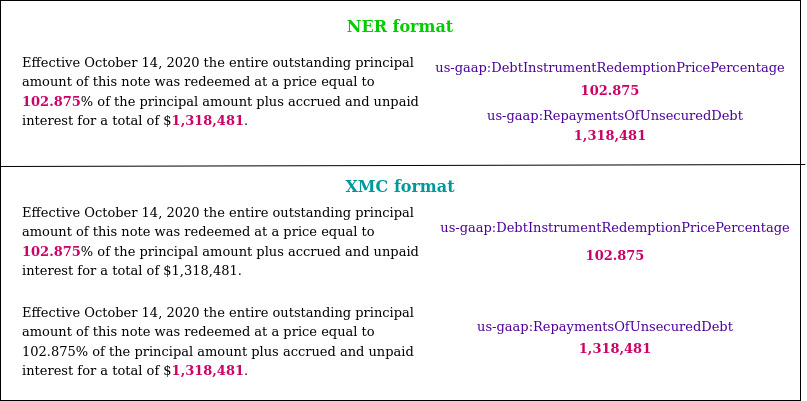
We release two formats of the FNXL dataset. An example of this has been provided in Figure 5
-
1.
The first format contains a sentence and all the associated numericals and its corresponding labels as NER tags.
-
2.
The second format contains a sentence and one of its corresponding numerical and its label. We structure the dataset in this format to adapt it to the Extreme Classification problem. In this format, we treat one numerical in a sentence as a single data point.
A.2 AttentionXML pipeline
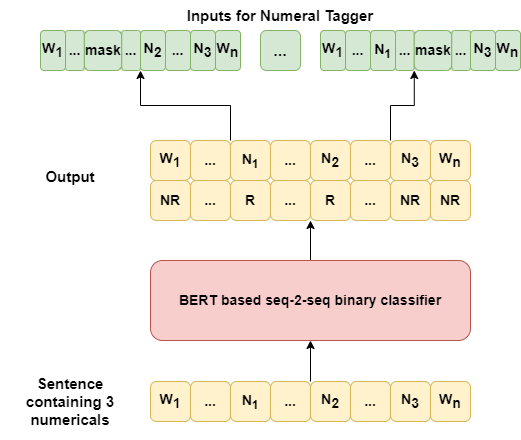
In Figure 6, we showcase the pipeline method which uses AttentionXML model. In this example, there are 3 numericals out of which 2 are classified as being relevant. For each relevant numerical, a new data point is created where the relevant numerical is left unmasked and the other numericals are masked using either the [MASK], [NUM] or [SHAPE] token.
A.3 Model Hyperparameters
For AttentionXML model, we performed training for 30 epochs with batch size of 40, hidden size 256 and a dropout rate of 0.5. We trained binary tagger for 20 epochs with batch of 16 instances , learning rate 1e-5 and dropout of 0.1. For FiNER we use a learning rate of 10**-4, 20 epochs, 32 batch size, 0.1 dropout rate. We use a single Tesla P100-PCIE (16GB) GPU. AttentionXML model is trained in approximately 8 hours whereas FiNER takes approximately 10-12 hours to train.
A.4 Bucket Analysis
In Table 7 and Table 4 we showcase the model performance for Top 100 frequently occurring labels and 1000 least frequently occurring labels.
| Model | Masking Token | Macro-Precision | Macro-Recall | Macro-F1 |
| FiNER (bert-base) | no-masking | 91.33 | 79.22 | 83.79 |
| FiNER (bert-base) | [NUM] | 90.33 | 78.59 | 83.35 |
| FiNER (bert-base) | [SHAPE] | 89.34 | 76.61 | 80.75 |
| FiNER avg. | 90.28 | 77.94 | 82.52 | |
| AttentionXML Pipeline | [MASK] | 88.06 | 77.89 | 81.76 |
| AttentionXML Pipeline | [NUM] | 88.86 | 77.25 | 81.5 |
| AttentionXML Pipeline | [SHAPE] | 89.50 | 78.45 | 82.62 |
| AttentionXML Pipeline avg. | 88.81 | 77.87 | 81.97 |
Top Frequently occurring labels: We observe that FiNER models perform better than AttentionXML pipeline models. BERT-BASE FiNER model with no masking achieves a 83.79% Macro-F1 score whereas the best performing AttentionXML pipeline model uses the [SHAPE] masking token and achieves a slightly lesser 82.62%.
We also find that in the case of multi-numeral instances, FiNER has a misclassification rate of 26.98%, but AttentionXML pipeline performs better with a misclassification rate of 28.94%. While we also included zero-shot labels in the test and dev set, we find that both FiNER and the AttentionXML pipeline are not able to perform for zero-shot scenarios.
A.5 Binary Tagger vs FiNER
While the model structures for Binary Tagger in the AttentionXML pipeline and FiNER are the same, we observe that there are differences in their performance in tagging relevant numericals. We find that while FiNER incorrectly tags a token in 1660 cases, the Binary Tagger only makes a mistake in cases. We also observe that for examples, FiNER incorrectly tagged a non-numerical as being relevant. For example, for the sentence "In March 2017, we issued $350.0 million in aggregate principal amount of 1.25% Senior Convertible Debentures due in 2025 (the ’1.25% 2025 Debentures’) in a private placement.", while both models tag the numerical as relevant, FiNER also identifies the two as being relevant. We attribute this difference in tagging between Binary Tagger and FiNER to ease of task. While FiNER has to decide between 2974 labels, Binary Tagger only has to make a binary decision, making the task easier for the model.
A.6 Top-k tag similarity
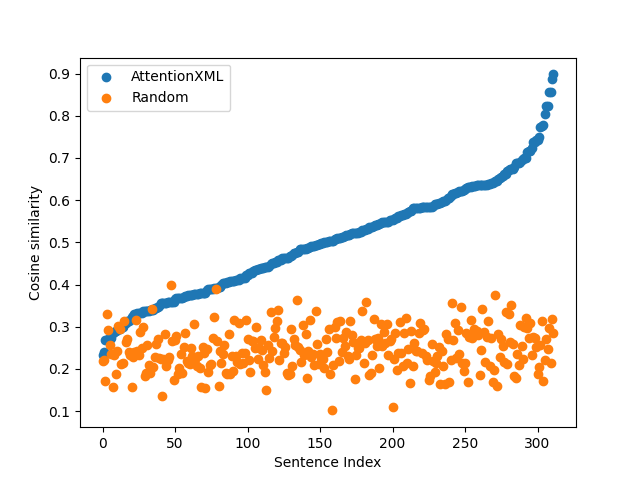
In Figure 7, we showcase the average cosine similarity between the top 5 labels predicted by the AttentionXML pipeline best performing model and compare it to the cosine similarity between the ground truth and randomly chosen 5 tags. We find that across all data points, the average similarity between the top 5 predicted tags is 0.5038 and the average similarity between the ground truth and randomly chosen 5 tags is 0.24.
Appendix B Related Works
Financial Resources and Applications: While there has been a great deal of work on Natural language processing (NLP) for finance, it is still a relatively new field of study Hahn et al. (2019); Chen et al. (2020); El-Haj et al. (2020). There are few textual financial resources in the NLP literature. Loukas et al. (2021) published a corpus of all the US annual reports (10-K filings) from 1993-2020. Händschke et al. (2018) released JOCo, a corpus of non-SEC annual and social responsibility reports for the top 270 US, UK and German companies. Daudert and Ahmadi (2019) released CoFiF, the first financial corpus in the French language, comprising of annual, semestrial, trimestrial, and reference business documents. Lee et al. (2014) released a collection of 8-K reports from EDGAR, which announce significant company events such as acquisitions or director resignations, from 2002-2012.
Financial documents have been used for a variety of tasks such as stock price prediction Lee et al. (2014); Chen et al. (2019); Yang et al. (2019), risk analysis Kogan et al. (2009), financial distress prediction Gandhi et al. (2019), merger participants detection Katsafados et al. (2021), financial relation extraction Sharma et al. (2022), financial sentiment analysis Malo et al. (2014); Wang et al. (2013); Akhtar et al. (2017), summarization Mukherjee et al. (2022), economic event detection Dor et al. (2019); Jacobs et al. (2018); Zhai and Zhang (2019) and causality analysis Tabari et al. (2018); Izumi and Sakaji (2019); Nayak et al. (2022).
Entity Extraction: XBRL tagging differs from NER task and other previous entity extraction tasks (Table 8 ). In xbrl tagging there is a much larger set of entity types (6k in full xbrl, 139 in finer-139, FNXL-2930) and the correct tag for numerical values highly depends on financial context.
| Dataset | Domain | Entity Types |
|---|---|---|
| conll-2003 | Generic | 4 |
| ontonotes-v5 | Generic | 18 |
| ace-2005 | Generic | 7 |
| genia | Biomedical | 36 |
| Francis et al. (2019) | Financial | 9 |
| finer-139 | Financial | 139 |
| FNXL | Financial | 2794 |