Exploring the Impact of Galactic Interactions and Mergers on the Central Star Formation of APEX/EDGE-CALIFA Galaxies
Abstract
Galactic interactions and subsequent mergers are a paramount channel for galaxy evolution. In this work, we use the data from 236 star forming CALIFA galaxies with integrated molecular gas observations in their central region (approximately within an effective radius) – from the APEX millimeter telescope and the CARMA millimeter telescope array. This sample includes isolated (126 galaxies) and interacting galaxies in different merging stages (110 galaxies; from pairs, merging and post-merger galaxies). We show that the impact of interactions and mergers in the center of galaxies is revealed as an increase in the fraction of molecular gas (compared to isolated galaxies). Furthermore, our results suggest that the change in star formation efficiency is the main driver for both an enhancement and/or suppression of the central star formation – except in merging galaxies where the enhanced star formation appears to be driven by an increase of molecular gas. We suggest that gravitational torques due to the interaction and subsequent merger transport cold molecular gas inwards, increasing the gas fraction without necessarily increasing star formation.
1 Introduction
The evolutionary processes that a galaxy goes through affect its internal properties. Among the most significant processes are: star formation, gas recycling, metallicity enrichment, and the energy produced by supernovae or in active nuclei (Kormendy & Kennicutt, 2004; Kormendy, 2013). An external and fast process that significantly affects the evolution of galaxies on a large scale is galactic interactions/mergers (Toomre, 1977; Conselice et al., 2003; Christensen et al., 2009; Kormendy, 2013). A large number of observational and numerical studies have suggested an enhancement of star formation in galactic centres, related to the increase in molecular gas in these objects due to the tidal forces exerted by the galaxies that undergo this merger (e.g., Patton et al., 1997, 2005; Smith et al., 2007; Li et al., 2008; Ellison et al., 2008, 2010; Patton et al., 2011; Ellison et al., 2011; Scudder et al., 2012; Patton et al., 2013; Ellison et al., 2013; Pan et al., 2018; Moreno et al., 2021; Ueda et al., 2021). However, recent studies using sub-millimeter observations have suggested that rather than an enhancement in the central star formation rate (SFR), the interaction tend to increase the molecular gas fraction, i.e. the molecular gas mass-over-stellar mass ratio (e.g., Kaneko et al., 2022). Given the lack of a statistically robust sample with homogeneous observations at both optical and sub-millimeter wavelengths, it has been difficult to reliably quantify the impact of the merging process in shaping the central star formation in galaxies.
In this study, we explore how the specific star formation rate (sSFR), molecular gas fraction (), and star formation efficiency (SFE) behave in the centre of 236 Calar Alto Legacy Integral Field Area (CALIFA) survey (Sánchez, S. F. et al., 2012) star-forming galaxies at different merging stages compared to isolated galaxies. Our sample includes 140 galaxies from the Atacama Pathfinder EXperiment (APEX) submillimeter telescope (Güsten et al., 2006), first presented by Colombo et al. (2020), and 96 galaxies with observations obtained by the Combined Array for Research in Millimeter-wave Astronomy (CARMA) (Bock et al., 2006), encompassed by the Extragalactic Database for Galaxy Evolution (EDGE-CALIFA) survey (Bolatto et al., 2017). These observations provide integrated measurements from the central region covering approximately one effective radius (1 ). This is the largest CO database with optical Integral Field Spectroscopy (IFS) data so far. This article has the following structure: in Sec. 2 we describe the data and sample, while in Sec. 3 we present our results of the analyzes carried out at each merger stage sample. In Sec. 4 we present discussion of our results. Finally, we summarize our study and present the conclusions of the results in Sec. 5. For the derived data, we use a cosmology with the parameters: , , .
2 Data, Sample and Analysis
2.1 CALIFA data
In this study, we use galaxies included in the Calar Alto Legacy Integral Field Area (CALIFA) sample (Sánchez, S. F. et al., 2012). This survey observed more than 600 galaxies in the local Universe () using Integral-Field Spectroscopy (IFS). CALIFA used the Integral Field Unit (IFU) PPAK (Kelz et al., 2006), which was attached to the 3.5 m telescope, with 74 64 arcsec of Field of View (FoV) of the Calar Alto Observatory in Spain. For each observed galaxy, this FoV covers with a typical spatial physical resolution of 1 kpc. The spectrograph used was the PMAS (Potsdam Multi Aperture Spectrograph) (Roth et al., 2005). This spectrograph has two superimposed grid configurations: V500 (3750-7000 Å) with a (low) spectral resolution of 6 Å; and V1200 (3700-4700 Å) with an (intermediate) spectral resolution of 2.7 Å. The raw data cube obtained from PMAS/PPAK was reduced with a specialized pipeline for the CALIFA survey (Sánchez et al., 2016a). The reduced data cubes were analyzed with PIPE3D (Sánchez et al., 2016b, c) to derive physical parameters of the stellar populations and emission lines of each spaxel for a galaxy. The reduced data cubes of 667 galaxies are publicly available (CALIFA DR3 111https://califa.caha.es/). Below we present the integrated derived parameters from these data cubes.
2.2 Molecular gas mass
We used one of the largest databases of CO observations available for galaxies with IFS data in order to derive the central molecular gas mass (). Our sample includes measurements made by the Atacama Pathfinder EXperiment (APEX) submillimetre telescope (Güsten et al., 2006) and Combined Array for Research in Millimeter-wave Astronomy (CARMA) (Bock et al., 2006). This data and its calibration are described in detail in Colombo et al. (2020) and Bolatto et al. (2017), respectively; here, we summarize their main features.
Colombo et al. (2020) presented APEX measurements of the (2-1) line ( GHz) for a sample of 296 galaxies included in the CALIFA survey. These objects were selected to have an inclination angle below . Furthermore, all galaxies have central measurements and 39 of these objects also have off center measurements. The APEX beam coverage is 26.3 arcsec, so the APEX beam coverage is approximate 1.12 for this sample of galaxies.
On the other hand, the Extragalactic Database for Galaxy Evolution (EDGE) survey (Bolatto et al., 2017) is observed a sample of galaxies drawn from the CALIFA survey using the CARMA interferometer. EDGE provides CO maps with a sensitivity of (before tilt correction) and a physical resolution of kpc. The EDGE-CALIFA survey was aimed to complement the optical information derived from the CALIFA survey with CO maps observed by CARMA. The CO observations at the transitions of (1-0) at 115.3 GHz and (1-0) at 110.2 GHz, in the same coverage as the FoV of CALIFA (74 x 64 arcsec) (Bolatto et al., 2017).
2.3 Derived parameters
For this study, we use the SFR, the , and the estimated within the APEX beam aperture, both for APEX and CARMA galaxies. The parameters are convoluted by a function before being integrated (Colombo et al., 2020). The optical parameters are integrated from their angular-resolved properties (i.e., the SFR and stellar mass surface density).
We derive the intensive properties by dividing each extensive property (SFR, , ) by the area of the beam, thus correcting for the inclination angle of each galaxy. This correction is based on the ellipticity and position angle derivations of the CALIFA galaxies made by López-Cobá et al. (2018); Lacerda et al. (2020); Sánchez et al. (2021). Using this correction, we obtained the , , and for each galaxy in our sample. The intensive properties of both APEX-CALIFA and EDGE-CALIFA are presented in Sánchez et al. (2021).
Since we are interested only in star-forming galaxies, we select those galaxies with an H equivalent width () larger than 6 Å (measured within the beam) (see Sánchez, 2020, for more details). Furthermore, using the emission line ratio diagnostics (also known as BPT diagram) (Baldwin et al., 1981), we select galaxies that fall below the Kewley demarcation line (Kewley et al., 2001). Finally, we also consider galaxies with central reliable measurements of the CO flux, these are measurements with a signal-to-noise ratio greater than 3. These selection criteria yield a final sample of 236 galaxies. It consists mostly of Sa to Sd galaxies and few Irr, E, and S0 (230 and 6 galaxies respectively). Also, this sample covers a wide range of stellar masses (), SFRs () and molecular mass () within the APEX beam coverage.
2.4 Classification of the merger stages
To gauge the interaction/merging stage, we use the classification scheme introduced by Veilleux et al. (2002). This scheme was based on numerical simulations of a spiral-spiral merger, tracing different snapshots of that merger (Surace, 1998). This classification has been successfully used to characterize the merging stage for a sub-sample of CALIFA galaxies (Barrera-Ballesteros et al., 2015). Following this study, here we classify galaxies according to their features observed in the -band Sloan Digital Sky Survey (SDSS, York et al., 2000) at each merging stage. Below we briefly describe the main morphological feature to classify a galaxy in a given interacting/merging stage:
Pre-merger stage (pre): The galaxy has a companion, each of the galaxies presents an unperturbed morphology (i.e., they can be associated to either a spiral or an elliptical). We further use the following criteria:
-
•
The projected separation between each companion is (Barrera-Ballesteros et al., 2015). The above is based on the results of Patton et al. (2013), who found (in observations and simulations) that in galaxy pair with a mass ratio of 2.5:1, an increase in star formation up to projected separations of 150 kpc.
- •
-
•
difference in magnitudes in the -band (Barrera-Ballesteros et al., 2015).
Merging stage (mer): merging galaxies with features such as tidal tails, bridges, plumes but with a nucleus well defined in each companion.
Post-merger stage (post): galaxies with their nuclei merged and prominent tidal tails. The emission in the core can be spread out and narrowed by dust lanes.
Merger remnant stage (rem): remnant with features such as weak tidal tails, shell shapes, and ripples but fused cores.
For our interacting sample we classify 70, 17, 13, and 10 galaxies in the pre-merger, merging, post-merger, and merger remnant stage, respectively.
2.5 Characterizing the physical properties of Star-Forming Galaxies
One of the main goals of this study is to shed light on how the properties related to the star-formation in the center of galaxies are affected by the merger sequence. To achieve it, we explore in this section three of the most important scaling relations related to the variation of star-formation in galaxies: (1) the Star Formation Main Sequence (SFMS) (e.g., Cano-Díaz et al., 2016, 2019; Lin et al., 2019; Sánchez, 2020; Ellison et al., 2021; Sánchez et al., 2021), (2) the Schmidt-Kennicutt law (SK) (e.g., Kennicutt & Evans, 2012; Sánchez, 2020; Ellison et al., 2020; Lin et al., 2020; Morokuma-Matsui et al., 2020; Ellison et al., 2021; Sánchez et al., 2021; Kaneko et al., 2022), and (3) the Molecular Gas Main Sequence (MGMS) (e.g., Lin et al., 2019; Sánchez, 2020; Barrera-Ballesteros et al., 2020; Ellison et al., 2021; Sánchez et al., 2021).
Following Lin et al. (2019); Ellison et al. (2020); Barrera-Ballesteros et al. (2020); Sánchez et al. (2021); Ellison et al. (2021), we use intensive central properties, i.e., normalized to the physical area of the observed aperture (see Sect. 2.3 for more details) to derive these scaling relations for our sample. To characterize these scaling relations we follow a similar procedure described in Sánchez et al. (2021). In a nutshell, for each of the scaling relations we perform a linear fit (in logarithm scales) to the data. These scaling relations, as well as their fits, are presented in Appendix A. The best fit parameters of these three scaling relations are in excellent agreement with those derived by Sánchez et al. (2021).
Using those best fits, we define the residuals for each of the explored scaling relations: , , and for the SFMS, SK, and MGMS relations, respectively222The , and best-fitted parameters are different depending on the explored scaling relation, see Appendix A.. To account for individual errors, we performed a Monte Carlo (MC) iteration by perturbing the original data within the error range and repeating the complete analysis 1000 times. The reported results in this study are the average of all MC iterations. For each of these scaling relations, the ratio of the two parameters corresponds to another physical property (i.e., the specific SFR, sSFR = /; the star-formation efficiency, SFE = /; and the gas fraction, = /). We find a significant good correlation between the ratio derived from the parameters and the residuals from the best fit ( for the three scaling relations). This suggests that intensive properties are less prone to be affected by distance effects as they are normalized to the physical area. Our results indicate that exploring the residuals of the scaling relations using intensive properties is equivalent to explore their corresponding ratios. In Sect. 3 we use these residuals to quantify the impact of the merger sequence in the central star-forming properties. In the next section we use the best fit parameters to replicate the observed scaling relations using a sample of randomly distributed data.
2.6 Scaling relations using random data
As we mention in the previous section, we use the residuals of the aforementioned scaling relations to explore the impact of the merger sequence on the star formation stage in the central region of galaxies. Recently, the exploration of these residuals has been used to estimate the drivers of star-formation in galaxies (e.g., Ellison et al., 2020; Lin et al., 2020). On the other hand, using large samples of galaxies, different studies have also cautioned on the use of these relations between residuals or ratios as they may not have a physical but rather statistical origin (e.g., Sánchez et al., 2021; Barrera-Ballesteros et al., 2021). To account for the scenario in which the correlations between residuals could have a statistical origin, we derive them using a set of mock data based on the best fit of each scaling relation provided in the previous section.
We follow a similar procedure as the one described in Sánchez et al. (2021). First, we generate a distribution of for 5000 targets. This distribution is designed to be similar as the one presented by the observed galaxies and is randomly populated. Then, using the best-parameters of the SFMS presented in Sect. 2.5 we derive an estimation of . In a similar way, we estimated using the best fit of the MGMS. Using these estimations of we also derive the from the best fit of the SK law. In order to include the uncertainty given by the systematic error of the observations, we perturb these estimations of by their typical uncertainties (i.e., 0.2 dex). A similar procedure applies to the and with typical uncertainties of 0.15 dex and 0.28 dex, respectively (see, Barrera-Ballesteros et al., 2021).
As expected, the mock-data are closely distributed around the best fit from the observed data set. However, these have a slightly smaller spread than the observed data, which may be due to the uncertainties assumed to create the synthetic data. Using these mock data, we perform the same procedure as in Sect. 2.5 to derive the best-fit parameters for each of the scaling relations. Finally, as for the observed data set, we derive the residuals of the mock data using their best-fit relations. In the next section we used the distributions derived between the residuals of this mock data to compare them with those derived from observations. These comparisons provide us with a measurement on how similar (or different) is the distribution of the residual for galaxies in different interaction/merger stages with those expected from a statistical origin.
3 Results
3.1 The diagram
The residuals of the explored scaling relations quantify either the relative enhancement or diminish of an explored property (e.g., the variation of the with respect to both and , or the variation of with respect to ). Using these residuals, we want to explore the actual impact of the merging process in the star formation activity as well as what could be the main drivers of this activity.
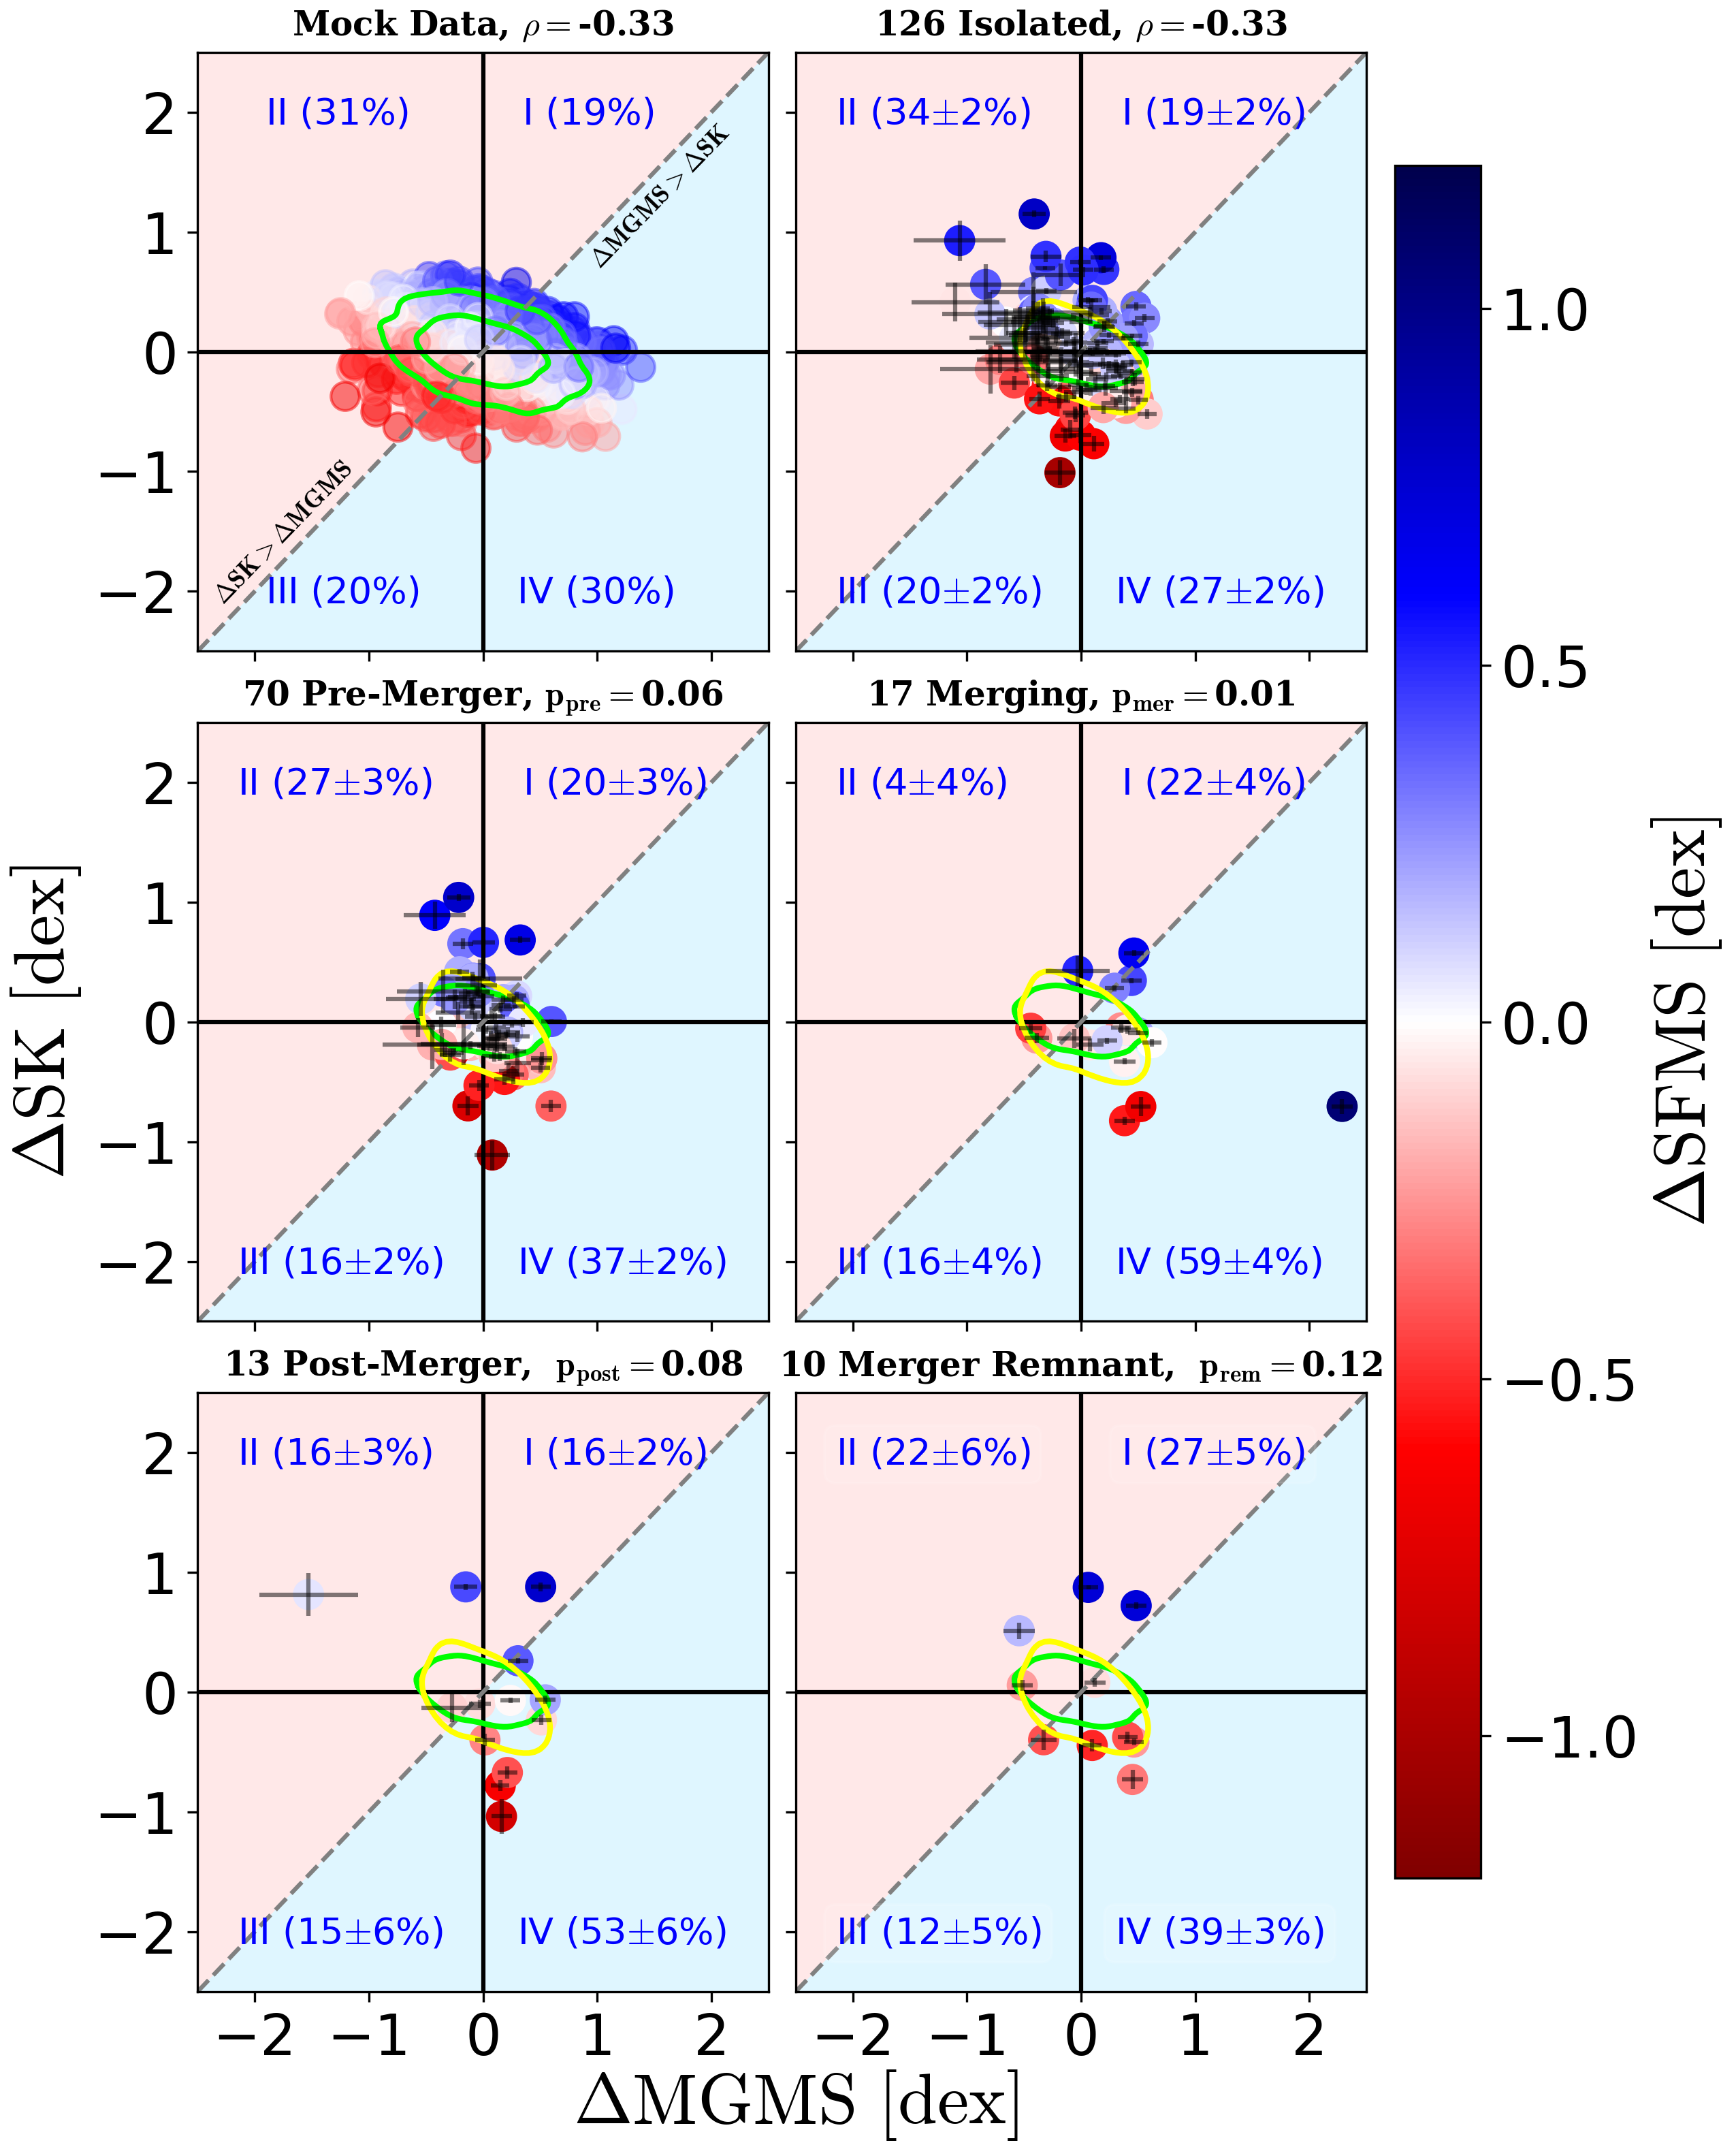
In Fig. 1 we plot the residuals of the SK relation () against the residuals of the MGMS () color coded by the residuals of the SFMS (). In each panel, we plot the different merger stages explored in this study. Top-left panel shows the mock-data sample whereas the top-right panel shows the results from the isolated sample. From left to right and from top to bottom, the other panels show the galaxies in different interaction/merging stages in plane. We divide each panel into 4 quadrants (indicated by: I, II, III, IV). The goal of this division is to compare the fraction of the different samples into each of those quadrants (denoted by the fractions in parenthesis).
The green (yellow) contours enclose and of the distribution of the mock (isolated) sample. When we compare the green and yellow contours encircling , we find that both samples cover a similar area in the diagram. We also find that both samples, mock and isolated, show similar Spearman correlation coefficient for these two parameters (, and , respectively). In addition, the Pearson’s chi-squared (applied to the mock data) and Fisher’s exact tests (applied for the isolated sample) for contingency tables resulted in -values of 0 and 0.01, respectively. In contrast to previous studies (Ellison et al., 2020), this suggests that the relations between and may not have a physical origin (e.g., Sánchez et al., 2021). In other words, these relations between residuals could be induced by the stochasticity of the data rather than a physical driver. We further quantified the similarity due to between the mock and isolated distributions by deriving the two-dimensional Kolmogorov-Smirnov test (KS test) -value (p=0). Although this value suggests that these two samples are not drawn from a parent sample, we find that the isolated sample has similar fractions for each of the quadrants. This is further evidence that these two samples are similar to each other. We also note that there are significant outliers in the isolated sample in comparison to the mock data. For instance NGC 3773 (located at -0.4, 1.1) and NGC 5630 (located at -0.9, 0.9) show an increase in their SFE and in their sSFR, but a decrease in their . Using the two-dimensional -value we compare each interacting/merging sample with the isolated one. We find the highest -value for the merger remnant galaxies () suggesting that both samples may be extracted from a single two-dimensional distribution. For the other samples, we find that exhibits lower -values, close to zero (, and for the pre-merger, merging and post-merger samples, respectively). This indicates that such samples are significantly different from the isolated sample. Regarding the location of the interacting/merging galaxies in each of the quadrants, we find that, unlike the control sample, a significant fraction of galaxies have a diminished in their SFE traced by their (i.e., most of the galaxies are located in the quadrants III and IV). This is significantly evident for the merger and post-merger samples ( and , respectively). From these galaxies in these two quadrants, we also find that a significant fraction of galaxies (in comparison to the isolated sample) is located in the quadrant IV (i.e., where galaxies having a diminish in SFE but an increase in ). It is interesting to note that in our sample we find a few outliers. For example, the interacting galaxy NGC 7253B located in the quadrant IV. This galaxy, although has a negative value of , shows both the largest and from the entire sample. This interacting galaxy and its pair (NGC 7253A), show evident dust lines in their center as well as blue tails and plumbs. From this analysis, we find that interacting galaxies, in comparison to the isolated sample, tend to have a diminish of their SFE in their centers, traced by the negative values of . However, we find a significant enhancement in their gas fraction, traced by their . This analysis suggests that rather than having an impact in the increment of the central star-formation, the interaction/merging mechanisms affect the amount of central molecular gas in galaxies.
3.2 Main drivers of the excess/deficit of SFR
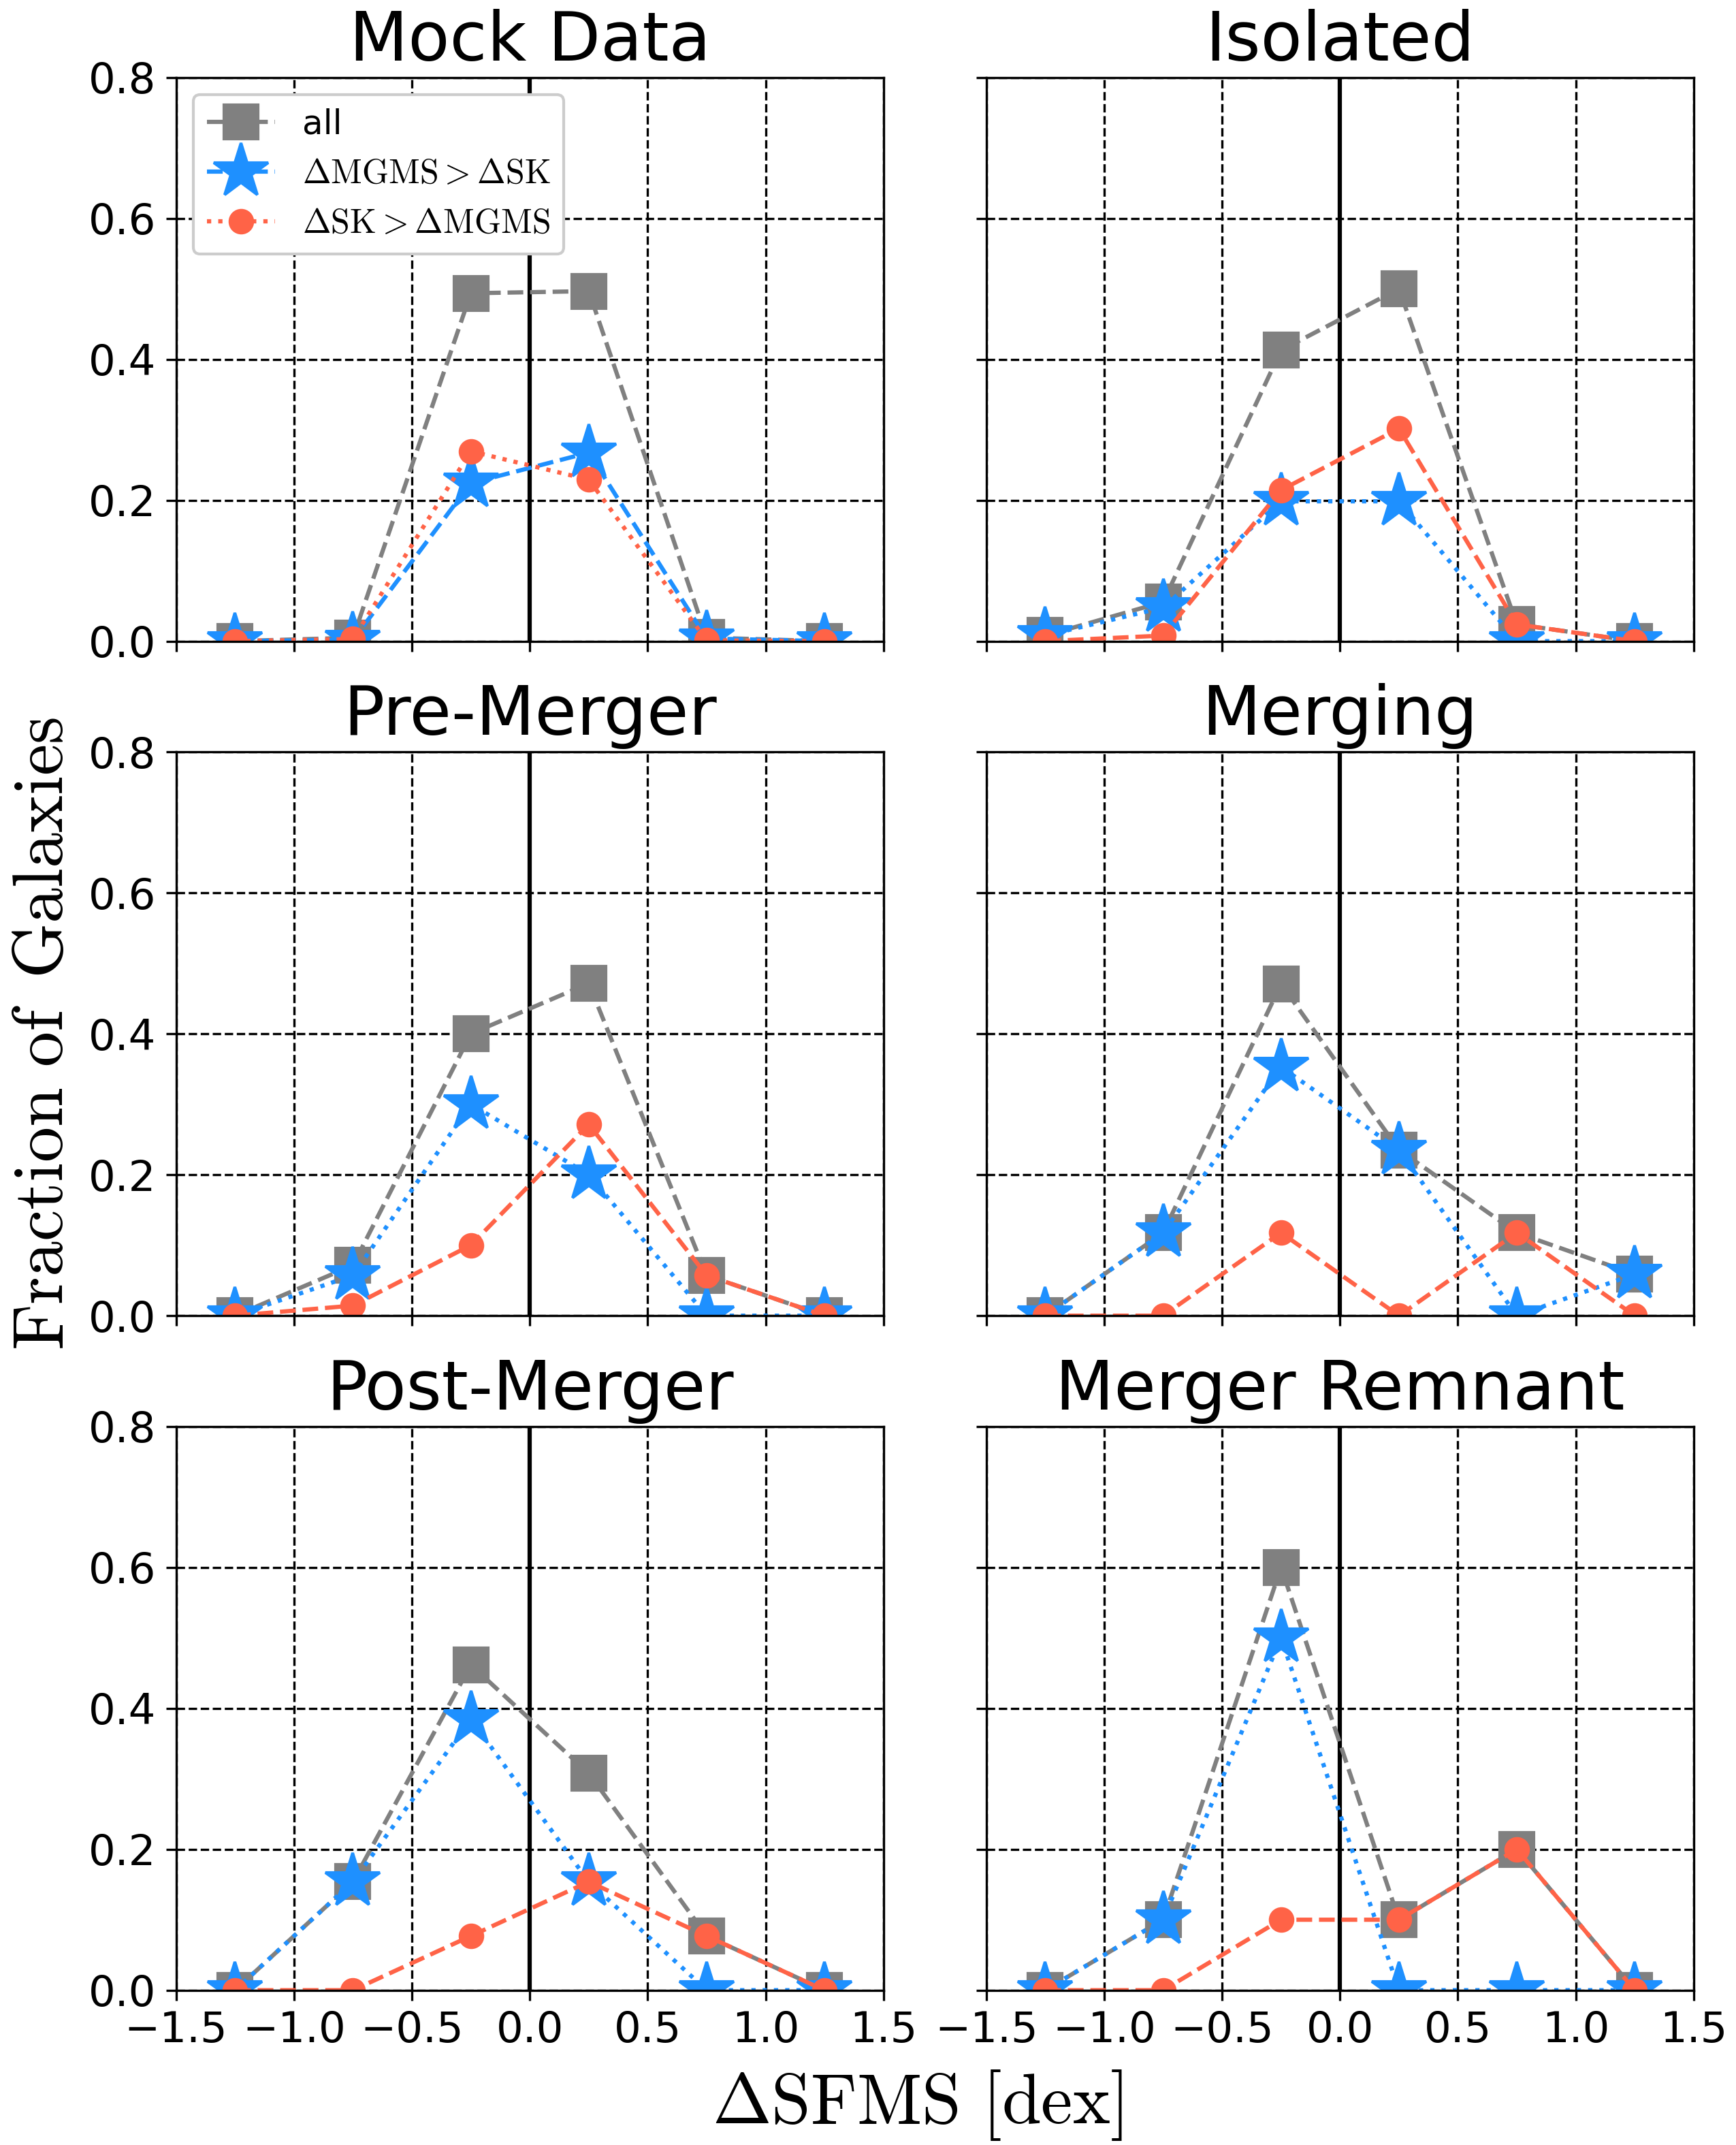
In the previous section, we explore how the merging event affects the SFE, and , traced by the and , respectively. In this section we explore the dependency of the excess/deficit in SFR for a given stellar mass (gauged by ) with a possible excess/deficit on the other two explored parameters for the different merging stages. To achieve this, we compare the fraction of galaxies in different bins of , segregated into two groups: () those galaxies with an excess of with respect to SFE (i.e., ), and () those galaxies with an excess of SFE with respect to (i.e., ). Following Moreno et al. (2021), comparing the fraction of galaxies between () and (), for a given bin of , we could suggest a possible main driver for that variation of SFR. Thus, if the fraction of galaxies in () is larger than the fraction in (), we suggest that the main driver for that enhancement (deficit) of SFR is fuel (efficiency) driven. On the contrary, if the fraction () is smaller than the fraction () we consider than the SFR enhancement (deficit) is efficiency (fuel) driven.
In each panel of Fig. 2 we show the fraction of galaxies at different bins of (gray squares) for each merging stage (including the mock data). In each of these bins, we also show the fraction of galaxies with , and (blue stars and red circles, respectively). For the mock-data, we find that of the sample has an increase in their . Furthermore, for this fraction of the sample we find that half of it has . Given the fact that we build this mock sample by adding random values to the best scaling relations, it is expected to find similar fractions of galaxies for groups () and (). Thus, in the central region of these simulated galaxies it is not possible to distinguish whether star formation enhancements are mainly driven by efficiency (a large fraction of ) or by the amount of molecular gas (a large fraction of ). In other words, both parameters are equally important in setting the star-formation activity. In comparison to the mock sample, we observe a similar behavior in the isolated sample (top middle panel of Fig. 2). of the control sample has an increase in their . For these galaxies, more than half of them present a (). Although this could indicate that the enhancement in SFR for the isolated galaxies is efficiency-driven (see the scheme above), we acknowledge that the fraction of galaxies with is similar (), preventing us to significantly constrain the main driver of SFR enhancement in this sample. Similar conclusions can be drawn from isolated galaxies with negative values of . These results suggest that for the sample of isolated galaxies it is not evident what parameter drives the diminishment or enhancement of star formation activity. These results suggest that these three parameters may not strongly correlate to each other for isolated star-forming galaxies (Sánchez et al., 2021; Barrera-Ballesteros et al., 2021).
In the pre-merger sample (top right panel of Fig. 2), we find a similar fraction of galaxies with an enhancement in sSFR ( with ) in comparison to the control sample. Furthermore, these galaxies with have a similar fraction of galaxies with () in comparison to the isolated sample. For galaxies with (), we find that, unlike the isolated sample, the fraction of galaxies with is significantly larger (). Thus, for galaxies in pairs, our results suggest that there is no significant increase in the fraction of galaxies with an enhancement in their SFR in comparison to the isolated sample. Furthermore, for companions with an enhancement in their SFR, we are not able to clearly disentangle the possible driver of these enhancements as we find that those galaxies present a similar fraction of galaxies with and . This is similar to what we find in isolated galaxies. However, for companions with a diminish of SFR, we find a large fraction of galaxies with suggesting that the lack of star formation is efficiency-driven. This is that, even though there is a large fraction of galaxies with an increment in their gas fraction there is no enhancement in their star formation.
For the other merging stages (merging, post-merger and merger remnant) we find that a large fraction of galaxies have a deficit of SFR, in contrast to isolated and pre-merger stages where the samples have a similar fraction of galaxies with an enhanced and deficit of SFR (, and , respectively). For these galaxies with , the fraction of galaxies with a is greater than for isolated galaxies, and this fraction increases at each stage (, , for the merging, post-merger and merger remnant, respectively). These results derived from the samples at different interaction/merging stages suggest that the merger event induces a decrement (rather than an increase) in the central star formation activity in comparison to the isolated sample. Furthermore, for those galaxies with a decrement in the star-formation activity we find that the majority of those have an excess in their gas fraction in comparison to their efficiency. According to the scheme presented above, this indicates an efficiency-driven halt of the star formation due to the merging process.
In general, our results suggest that for interacting/merging galaxies, the decrease (increase) in star formation, traced by , is driven by the inability (ability) of the molecular gas to be efficiently transformed into new stars, rather than the amount of raw material available to form those stars. In other words, the efficiency seems to be a significant driver in shaping the star formation activity across the interaction/merger event.
4 Discussion
In this study, we explore the impact of galactic interactions/mergers on the specific star formation rate (sSFR), molecular gas fraction () and star formation efficiency (SFE), as well as the possible driving mechanism of star formation, in the central region of CALIFA galaxies. Similar studies with smaller samples and/or heterogeneous data set, have been previously carried out. Pan et al. (2018) studied a sample of 58 interacting galaxies in pairs () with measurements of molecular gas from four different surveys (and different beam coverage): JCMT PI, JINGLE, JINGLE and xCOLD GASS (see Pan et al., 2018). They used the global SFR and estimations taken from the MPA-JHU DR7 catalog. Assuming a Schmidt-Kennicutt relation between the global SFR and the expected CO emission Leroy et al. (2009); Saintonge et al. (2012), they re-calibrated the observed CO measurements (for a given beam coverage) to a global CO estimation. They found that a significant fraction of galaxies in pairs exhibit an increase in their SFR and gas fraction in comparison to a control sample. Although we find that mergers and post-merger galaxies indeed show an increase in their gas fractions in comparison to our sample of isolated galaxies, we do not find significant differences in our sample of pre-merger (pairs) galaxies. We also note that, contrary to this study, we do not find a significant increment in the SFE (traced by ) between our interacting/merger sample at different stages and the control sample. These differences between our results and those provided by Pan et al. (2018), could be due to different factors. On the one hand, our CO measurements come from homogeneous observations (i.e., the same beam coverage) provided by both the resolved CARMA and integrated APEX observations. Furthermore, thanks to the IFU CALIFA data set, we are able to provide direct measurements of the flux at the same aperture of the CO observations. Thus, different assumptions in the estimations of the CO values and SFR could lead to increments of the SFE and the gas fraction as presented by Pan et al. (2018). On the other hand, combining our pre-merger and merging stages as interacting galaxies in pairs (following the classification by Pan et al., 2018), we have a larger sample of galaxies ( 61% more, 87 vs. 54 galaxies in pairs). This could also lead to differences in the main conclusion of our results in comparison to those reported by Pan et al. (2018).
Using a sample of 11 interacting galaxies drawn from the xCOLD-GASS (Saintonge et al., 2016) survey, Violino et al. (2018) also studied the variations between the SFR and the gas fraction. As a control sample they used a set of non-interacting galaxies also drawn from this survey. Although they used the optical properties derived from the MPA-JHU catalogue, unlike Pan et al. (2018), they corrected the SFR to match the aperture of the IRAM millimeter telescope data. Violino et al. (2018) found that for their interacting sample with , (in our classification pre-merger and merging galaxies), the variations in SFR and gas fraction are similar to those derived from the control sample. They suggest that both interactions and internal processes can lead to variation in molecular gas and SFR in the center of galaxies. Although we find similar results for our sample of pairs of galaxies, we find a significant increment in the gas fraction for our sample of merging galaxies. These differences may be due to the differences in samples and measurements as those described above. On the one hand we use a homogeneous data set and on the other hand, our sample is significantly larger than the one presented by Violino et al. (2018).
Using spatially resolved data, Kaneko et al. (2022) studied the behavior of these properties in 4 pairs of galaxies (ARP 84, VV 219, VV 254, and the Antennae Galaxies), that corresponds to merging galaxies in our classification scheme. They compare these measurements to 11 non-interacting galaxies. The CO maps for these samples were obtained using the Nobeyama radio telescope observations, whereas the SFRs were derived using data from GALEX observations. They found that for integrated properties, neither the sSFR nor the SFE, exhibit significant increments in comparison to the global measurements of isolated galaxies. Although their sample is smaller compared to ours, the results from this study agree with those presented here.
Besides observational studies (e.g. Ellison et al., 2020; Thorp et al., 2022), there has been simulations to exploring star formation in interacting galaxies, the aim is to investigate whether the enhancement of star formation is due to the amount of cold gas or to efficiency. For example, Moreno et al. (2021) conducted high-resolution hydrodynamical simulations focused on the central kiloparsec of Milky-Way like galaxies in pairs (with mass ratios from 2.5:1 to 1:1) with projected separations of . We should remark that, strictly speaking, it is very difficult to compare quantitatively our results with these simulations. On the one hand, our sample has a wide range of morphologies (furthermore, we are unaware of the morphology of the progenitors of post-merger and merger remnants). On the other hand, in contrast to simulations, we are not able to have a rigorously mass ratio selection for our sample of pairs and merging sample. Furthermore, the physical area used to measure the properties in those simulations is fixed (1 kpc) whereas the area used in this study varies depending on the APEX beam coverage (). Therefore, the possible discrepancies between our results could be due to these limitations. In particular, we consider that the different spatial coverages in these studies could induce a major discrepancy. Despite these, qualitative comparisons can provide guidelines on what to expect in terms of the numerical simulations on merging galaxies. In these simulations, Moreno et al. (2021) found that the percentage of primary galaxies showing an increase in their amount of molecular gas is . This is in agreement with our results; in our pre-merger and merging samples and present an increase in their , respectively. However, we should also note that in our samples the percentage of galaxies with increases in their sSFR ( and ) is lower compared to the results from these simulations ().
Furthermore, Moreno et al. (2021) found that for those galaxies with an increment in their SFR (in comparison to the isolated galaxies) the fraction of these with an increment in the amount of gas is larger in comparison to those exhibit an increase in their star formation efficiency, suggesting that the enhancement in the SFR for interacting galaxies is driven by the amount of gas in the central kpc (so called fuel driven enhanced star-formation). In comparison to the analysis from Moreno et al. (2021), we find mixed results. On the one hand, those simulations show that for those galaxies with enhanced SFR in the pre-merger stage the fraction of galaxies with an enhancement in the is larger in comparison to the fraction with an enhancement of SFE. Contrary to the results from the simulations, our analysis suggests, that the enhancement in the SFR for galaxies in pairs is efficiency driven, rather than fuel driven (see top-right panel in Fig 2). We also note that a similar, but reduced effect, is observed in the isolated sample: for those galaxies with an enhancement in sSFR the fraction of galaxies with enhanced SFE is slightly larger than those with a enhancement. On the other hand, for the merging galaxies, we find that for some bins of positive the enhancement in sSFR is fuel-driven. Although not explored in those simulations, we should note that the observed enhancements in sSFR for the remaining stages of interaction are seem to be driven by efficiency instead of the excess of molecular gas. Regarding galaxies with a decrement in their SFR, Moreno et al. (2021) found that the fraction of these with an increment in the amount of gas is larger in comparison to those exhibit an increase in their SFE, suggesting that the suppressed in the SFR by interacting galaxies is efficiency driven. In this study, we agree with these simulations for the suppressed star formation. These results suggest that the primary effect of interactions and mergers rather than increase the amount of gas to enhance the SFR in the center of galaxies is efficiency that drives either an enhancement or a suppression in star formation, although there is an increase in the amount of molecular gas. More research is needed to try to understand in detail which processes govern the level of SFE to enhance or suppress star formation. For example, there are studies that conclude that the SFR is primarily controlled by interstellar turbulence and magnetic fields (Federrath & Klessen, 2012; Federrath et al., 2016).
Including this study, most of the explored properties of interacting galaxies are derived from integrated measurements (either from the central or entire target). However, as spatially-resolved entities, the impact of the interacting and merger can be different at different locations in the galaxy. Thus, spatially resolved observations are necessary to analyze the gas distribution and compare it in galaxies interacting with isolated galaxies. Unfortunately, the studies available using IFS in this field are scarce. Using a sample of 31 galaxies (17 pairs and 14 post-merger galaxies) including in the ALMaQUEST sample333ALMA MaNGA QUEnching and STar formation (ALMaQUEST) survey includes optical IFS observations from the MaNGA survey and sub-millimeter interferometric observations from ALMA (Ellison et al., 2020), Thorp et al. (2022) explored how the interaction and merger affects the drivers of the enhancement of star-formation at both integrated and spatially resolved measurements. Their results suggest that for a given interacting galaxy, even though at global scales a given driver (either fuel or efficiency) dominates the star formation, it may no be the same dominant driver at kpc scales. Furthermore, they found that even within a given galaxy different regions could exhibit a different driver for the enhancement of star-formation, and this is also independent on the interaction stage. Although our results are not directly comparable with spatially-resolved measurements, they suggest that at the central region of interacting/merging, galaxies the efficiency appears to be the most significant driver of both the enhancement and diminish of star-formation. In a future study we explore how our explored parameters (, and ) vary at kpc in a sample of interacting/merging EDGE galaxies.
Finally, we also note that our findings align well with the observations and simulations of the Central Molecular Zone (CMZ) of the Milky Way (Morris & Serabyn, 1996). The CMZ presents a lower star formation rate than expected based on its amount of molecular gas content (e.g. Immer et al., 2012; Longmore et al., 2013; Barnes et al., 2017). The reasons for this lower SFR are currently being intensely investigated. For example, Henshaw et al. (2022) propose that star formation in the CMZ may be linked to the overall macroscopic evolution of the system, which could be driven by discrete episodes of feedback (and/or accretion), and/or by local interstellar medium conditions that raise the critical density for star formation. Consequently, studying the CMZ will provide insight into the physical mechanisms that result in a reduced SFR, allowing us to extrapolate to the extragalactic context and better understand how interactions and mergers affect the evolution of galaxies in the central region.
5 Summary and conclusions
In this study, we explore the impact of galactic interactions/mergers on the star formation using a sample of 236 star-forming galaxies with homogeneous measurements of the optical and molecular gas properties across their central region (at 1 , i.e., the APEX beam coverage, arcsec) from the APEX-CALIFA survey. We segregate our sample of interacting galaxies (110 targets) into different merger stages (from pre-mergers to merger-remnant). For the entire sample, we derive the best fits of scaling relations using their intensive properties (i.e., normalizing by the APEX beam area): the star formation main sequence (SFMS), the Schmidt-Kennicutt relation (SK) and the molecular gas main sequence (MGMS). These fits are shown in Appendix A. We also generate a mock data set using the best fit of these scaling relations (SFMS, SK, MGMS). Using the best fits of these scaling relations, we obtain the residuals for each of these (, and ). As expected, these residuals are similar to the usual ratios that characterize these three scaling relations: the specific star formation rate (sSFR), the star formation efficiency (SFE), and the gas fraction (). Based on these residuals, we explore how the variation (excess or deficit) for the different interacting stage compare with the control sample (see Fig. 1). Furthermore, to explore what drives the star formation enhancement or suppression at different interaction/merging stages, we plot in Fig. 2 the fraction of galaxies with , and for different bins of . Based on the analysis presented in the previous sections, compared to isolated sample, we conclude the following:
-
•
In comparison to the control sample, we do not find a significant fraction of interacting/merging galaxies with an enhancement on their sSFR and SFE. However, we do find that interacting/merging galaxies tend to have a large fraction of galaxies with large central molecular gas fraction (see Fig. 1).
-
•
Although we are not able to fully identify the main mechanism that modulates the star-formation activity in isolated galaxies (i.e., efficiency vs. fuel driven star formation), we find that, in general, for interacting and merging galaxies both suppression and enhancement of star formation appear to be efficiency driven (see Fig. 2).
Our results indicate that the effect of tidal forces due to the interaction/merger increases the amount of molecular gas in the center of the galaxies, gravitational torques reduced the angular momentum of the molecular gas in the galaxies, moving it inwards. Despite this, in contrast to previous results, we do not find a significant increase in the central star formation for interacting galaxies in comparison to the control sample. We suggest that a possible cause on why the central molecular gas has not been yet transformed into new star could be that it still is in a turbulent stage preventing it to cool down. Further studies using homogeneous spatially-resolved data (such as the EDGE data set) will allow us to better constrain the role of mergers in shaping the star formation across the optical extension of galaxies in the nearby universe.
Acknowledgements
Y.G.S. thanks C. Espinosa-Ponce for his support and comments throughout the development of this work. Y.G.S, and J.B.B. acknowledge support from the grant IA-101522 (DGAPA-PAPIIT, UNAM) and funding from the CONACYT grant CF19-39578.
Data Availability
The optical parameters used in this study are taken from the CALIFA survey. These parameters are publicly available. Part of the molecular gas mass has been presented in Colombo et al. (2020). An updated version of that data set will be presented elsewhere and it will be publicly available.
Appendix A Intensive scaling relations
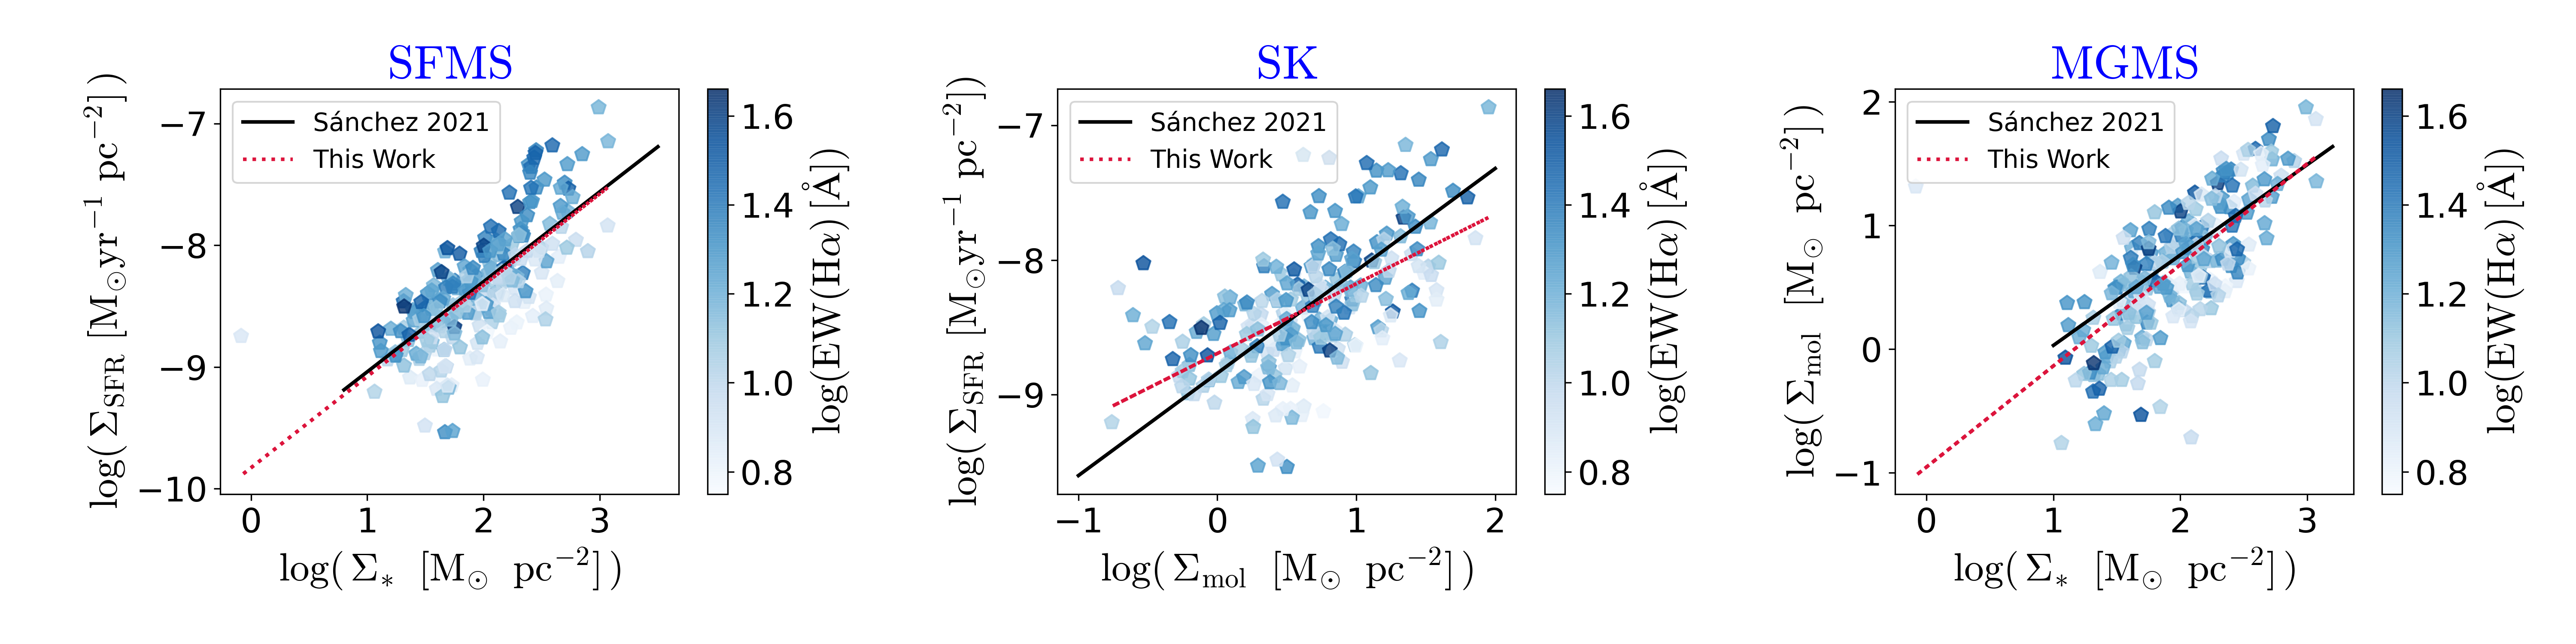
As mentioned in Sect. 2.5 of this study, we use the residuals of the scaling relations of the intensive properties (i.e., intensive scaling relations) to quantify the impact of interactions and mergers on central star formation. These intensive properties are obtained by dividing each extensive property (SFR, , ) by the beam area, as described in Sect. 2.3. Furthermore the scaling relations for these properties are quite similar regardless the observed angular scale (i.e., either integrated or spatially-resolved properties, Sánchez et al., 2021). In each panel of Fig. 3 we show the scaling relations used in this: the star formation main sequence (SFMS), the Schmidt-Kennicutt relation (SK), and the molecular gas main sequence (MGMS). Our best fits (red-dashed lines) are in good agreement with those presented previously with a similar data set (solid black lines Sánchez et al., 2021). In Table 1 we present the parameters of those best fits.
| Relation | |||
|---|---|---|---|
| SFMS | |||
| SK | |||
| MGMS |
References
- Baldwin et al. (1981) Baldwin, J. A., Phillips, M. M., & Terlevich, R. 1981, PASP, 93, 5, doi: 10.1086/130766
- Barnes et al. (2017) Barnes, A. T., Longmore, S. N., Battersby, C., et al. 2017, MNRAS, 469, 2263, doi: 10.1093/mnras/stx941
- Barrera-Ballesteros et al. (2015) Barrera-Ballesteros, J. K., García-Lorenzo, B., Falcón-Barroso, J., et al. 2015, A&A, 582, A21, doi: 10.1051/0004-6361/201424935
- Barrera-Ballesteros et al. (2020) Barrera-Ballesteros, J. K., Utomo, D., Bolatto, A. D., et al. 2020, MNRAS, 492, 2651, doi: 10.1093/mnras/stz3553
- Barrera-Ballesteros et al. (2021) Barrera-Ballesteros, J. K., Sánchez, S. F., Heckman, T., et al. 2021, MNRAS, 503, 3643, doi: 10.1093/mnras/stab755
- Bock et al. (2006) Bock, D. C.-J., Bolatto, A. D., Hawkins, D. W., et al. 2006, in Ground-based and Airborne Telescopes, ed. L. M. Stepp, Vol. 6267, International Society for Optics and Photonics (SPIE), 379 – 388, doi: 10.1117/12.674051
- Bolatto et al. (2017) Bolatto, A. D., Wong, T., Utomo, D., et al. 2017, ApJ, 846, 159, doi: 10.3847/1538-4357/aa86aa
- Cano-Díaz et al. (2016) Cano-Díaz, M., Sánchez, S. F., Zibetti, S., et al. 2016, ApJ, 821, L26, doi: 10.3847/2041-8205/821/2/L26
- Cano-Díaz et al. (2019) Cano-Díaz, M., Ávila Reese, V., Sánchez, S. F., et al. 2019, MNRAS, 488, 3929, doi: 10.1093/mnras/stz1894
- Christensen et al. (2009) Christensen, L., Shida, R., & Martin, D. 2009, Cosmic Collisions: The Hubble Atlas of Merging Galaxies. (Springer). https://search.ebscohost.com/login.aspx?direct=true&db=cat02025a&AN=lib.MX001001488432&lang=es&site=eds-live.
- Colombo et al. (2020) Colombo, D., Sanchez, S. F., Bolatto, A. D., et al. 2020, A&A, 644, A97, doi: 10.1051/0004-6361/202039005
- Conselice et al. (2003) Conselice, C. J., Bershady, M. A., Dickinson, M., & Papovich, C. 2003, AJ, 126, 1183, doi: 10.1086/377318
- Ellison et al. (2021) Ellison, S. L., Lin, L., Thorp, M. D., et al. 2021, MNRAS, 501, 4777, doi: 10.1093/mnras/staa3822
- Ellison et al. (2013) Ellison, S. L., Mendel, J. T., Patton, D. R., & Scudder, J. M. 2013, MNRAS, 435, 3627, doi: 10.1093/mnras/stt1562
- Ellison et al. (2011) Ellison, S. L., Patton, D. R., Mendel, J. T., & Scudder, J. M. 2011, MNRAS, 418, 2043, doi: 10.1111/j.1365-2966.2011.19624.x
- Ellison et al. (2008) Ellison, S. L., Patton, D. R., Simard, L., & McConnachie, A. W. 2008, The Astronomical Journal, 135, 1877, doi: 10.1088/0004-6256/135/5/1877
- Ellison et al. (2010) Ellison, S. L., Patton, D. R., Simard, L., et al. 2010, MNRAS, 407, 1514, doi: 10.1111/j.1365-2966.2010.17076.x
- Ellison et al. (2020) Ellison, S. L., Thorp, M. D., Pan, H.-A., et al. 2020, MNRAS, 492, 6027, doi: 10.1093/mnras/staa001
- Ellison et al. (2020) Ellison, S. L., Thorp, M. D., Pan, H.-A., et al. 2020, Monthly Notices of the Royal Astronomical Society, 492, 6027, doi: 10.1093/mnras/staa001
- Federrath & Klessen (2012) Federrath, C., & Klessen, R. S. 2012, The Astrophysical Journal, 761, 156, doi: 10.1088/0004-637X/761/2/156
- Federrath et al. (2016) Federrath, C., Rathborne, J. M., Longmore, S. N., et al. 2016, The Astrophysical Journal, 832, 143, doi: 10.3847/0004-637X/832/2/143
- Güsten et al. (2006) Güsten, R., Nyman, L. Å., Schilke, P., et al. 2006, A&A, 454, L13, doi: 10.1051/0004-6361:20065420
- Henshaw et al. (2022) Henshaw, J. D., Barnes, A. T., Battersby, C., et al. 2022, arXiv e-prints, arXiv:2203.11223, doi: 10.48550/arXiv.2203.11223
- Immer et al. (2012) Immer, K., Schuller, F., Omont, A., & Menten, K. M. 2012, A&A, 537, A121, doi: 10.1051/0004-6361/201117857
- Kaneko et al. (2022) Kaneko, H., Kuno, N., Iono, D., et al. 2022, arXiv e-prints, arXiv:2201.02270. https://arxiv.org/abs/2201.02270
- Kelz et al. (2006) Kelz, A., Verheijen, M. A. W., Roth, M. M., et al. 2006, PASP, 118, 129, doi: 10.1086/497455
- Kennicutt & Evans (2012) Kennicutt, R. C., & Evans, N. J. 2012, ARA&A, 50, 531, doi: 10.1146/annurev-astro-081811-125610
- Kewley et al. (2001) Kewley, L. J., Dopita, M. A., Sutherland, R. S., Heisler, C. A., & Trevena, J. 2001, The Astrophysical Journal, 556, 121, doi: 10.1086/321545
- Kormendy (2013) Kormendy, J. 2013, in Secular Evolution of Galaxies, ed. J. Falcón-Barroso & J. H. Knapen (Cambridge University Press), 1, doi: 10.48550/arXiv.1311.2609
- Kormendy & Kennicutt (2004) Kormendy, J., & Kennicutt, Robert C., J. 2004, ARA&A, 42, 603, doi: 10.1146/annurev.astro.42.053102.134024
- Lacerda et al. (2020) Lacerda, E. A. D., Sánchez, S. F., Cid Fernandes, R., et al. 2020, MNRAS, 492, 3073, doi: 10.1093/mnras/staa008
- Leroy et al. (2009) Leroy, A. K., Walter, F., Bigiel, F., et al. 2009, The Astronomical Journal, 137, 4670, doi: 10.1088/0004-6256/137/6/4670
- Li et al. (2008) Li, C., Kauffmann, G., Heckman, T. M., Jing, Y. P., & White, S. D. M. 2008, MNRAS, 385, 1903, doi: 10.1111/j.1365-2966.2008.13000.x
- Lin et al. (2019) Lin, L., Pan, H.-A., Ellison, S. L., et al. 2019, ApJ, 884, L33, doi: 10.3847/2041-8213/ab4815
- Lin et al. (2020) Lin, L., Ellison, S. L., Pan, H.-A., et al. 2020, ApJ, 903, 145, doi: 10.3847/1538-4357/abba3a
- Longmore et al. (2013) Longmore, S. N., Bally, J., Testi, L., et al. 2013, MNRAS, 429, 987, doi: 10.1093/mnras/sts376
- López-Cobá et al. (2018) López-Cobá, C., Sánchez, S. F., Bland-Hawthorn, J., et al. 2018, MNRAS, 482, 4032, doi: 10.1093/mnras/sty2960
- Moreno et al. (2021) Moreno, J., Torrey, P., Ellison, S. L., et al. 2021, MNRAS, 503, 3113, doi: 10.1093/mnras/staa2952
- Morokuma-Matsui et al. (2020) Morokuma-Matsui, K., Sorai, K., Sato, Y., et al. 2020, PASJ, 72, 90, doi: 10.1093/pasj/psaa084
- Morris & Serabyn (1996) Morris, M., & Serabyn, E. 1996, ARA&A, 34, 645, doi: 10.1146/annurev.astro.34.1.645
- Pan et al. (2018) Pan, H.-A., Lin, L., Hsieh, B.-C., et al. 2018, ApJ, 868, 132, doi: 10.3847/1538-4357/aaeb92
- Patton et al. (2011) Patton, D. R., Ellison, S. L., Simard, L., McConnachie, A. W., & Mendel, J. T. 2011, MNRAS, 412, 591, doi: 10.1111/j.1365-2966.2010.17932.x
- Patton et al. (2005) Patton, D. R., Grant, J. K., Simard, L., et al. 2005, AJ, 130, 2043, doi: 10.1086/491672
- Patton et al. (1997) Patton, D. R., Pritchet, C. J., Yee, H. K. C., Ellingson, E., & Carlberg, R. G. 1997, ApJ, 475, 29, doi: 10.1086/303535
- Patton et al. (2013) Patton, D. R., Torrey, P., Ellison, S. L., Mendel, J. T., & Scudder, J. M. 2013, MNRAS, 433, L59, doi: 10.1093/mnrasl/slt058
- Roth et al. (2005) Roth, M. M., Kelz, A., Fechner, T., et al. 2005, PASP, 117, 620, doi: 10.1086/429877
- Saintonge et al. (2012) Saintonge, A., Tacconi, L. J., Fabello, S., et al. 2012, The Astrophysical Journal, 758, 73, doi: 10.1088/0004-637X/758/2/73
- Saintonge et al. (2016) Saintonge, A., Catinella, B., Cortese, L., et al. 2016, MNRAS, 462, 1749, doi: 10.1093/mnras/stw1715
- Sánchez (2020) Sánchez, S. F. 2020, Annual Review of Astronomy and Astrophysics, 58, 99, doi: 10.1146/annurev-astro-012120-013326
- Sánchez et al. (2016a) Sánchez, S. F., García-Benito, R., Zibetti, S., et al. 2016a, A&A, 594, A36, doi: 10.1051/0004-6361/201628661
- Sánchez et al. (2016b) Sánchez, S. F., Pérez, E., Sánchez-Blázquez, P., et al. 2016b, Rev. Mexicana Astron. Astrofis., 52, 21. https://arxiv.org/abs/1509.08552
- Sánchez et al. (2016c) —. 2016c, Rev. Mexicana Astron. Astrofis., 52, 171. https://arxiv.org/abs/1602.01830
- Sánchez et al. (2021) Sánchez, S. F., Barrera-Ballesteros, J. K., Colombo, D., et al. 2021, MNRAS, 503, 1615, doi: 10.1093/mnras/stab442
- Sánchez, S. F. et al. (2012) Sánchez, S. F., Kennicutt, R. C., Gil de Paz, A., et al. 2012, A&A, 538, A8, doi: 10.1051/0004-6361/201117353
- Scudder et al. (2012) Scudder, J. M., Ellison, S. L., Torrey, P., Patton, D. R., & Mendel, J. T. 2012, MNRAS, 426, 549, doi: 10.1111/j.1365-2966.2012.21749.x
- Smith et al. (2007) Smith, B. J., Struck, C., Hancock, M., et al. 2007, AJ, 133, 791, doi: 10.1086/510350
- Surace (1998) Surace, J. A. 1998, PhD thesis, University of Hawaii, Manoa, Institute for Astronomy
- Thorp et al. (2022) Thorp, M. D., Ellison, S. L., Pan, H.-A., et al. 2022, MNRAS, doi: 10.1093/mnras/stac2288
- Toomre (1977) Toomre, A. 1977, in Evolution of Galaxies and Stellar Populations, ed. B. M. Tinsley & D. C. Larson, Richard B. Gehret, 401
- Ueda et al. (2021) Ueda, J., Iono, D., Yun, M. S., et al. 2021, ApJS, 257, 57, doi: 10.3847/1538-4365/ac257a
- Veilleux et al. (2002) Veilleux, S., Kim, D. C., & Sanders, D. B. 2002, ApJS, 143, 315, doi: 10.1086/343844
- Violino et al. (2018) Violino, G., Ellison, S. L., Sargent, M., et al. 2018, MNRAS, 476, 2591, doi: 10.1093/mnras/sty345
- York et al. (2000) York, D. G., Adelman, J., John E. Anderson, J., et al. 2000, The Astronomical Journal, 120, 1579, doi: 10.1086/301513