2.5D FRADO model in BAL QSOs \righttitleProceedings of the International Astronomical Union: LaTeX Guidelines for authors
17 \jnlDoiYr2023 \doival10.1017/xxxxx
Proceedings IAU Symposium
BAL effect in quasars due to source orientation
Abstract
We investigated a scenario where the presence of a broad absorption line (BAL) feature in quasars (QSOs) is contingent upon the line of sight being situated within an outflow cone emanating from the source. We examined the mechanism of dust-driven winds based on the failed radiatively accelerated dusty outflow (FRADO) model proposed by Czerny & Hryniewicz, letting it be responsible for the formation of massive outflow. We calculated the probability of observing the BAL effect from the geometry of outflow which is a function of global parameters of black hole mass (), Eddington ratio (), and metallicity (Z). We then compared the results with prevalence of BAL QSOs in a sample of observational data from SDSS. The consistency of our model with the data supports the interpretation of the BAL phenomenon as a result of source orientation, rather than a transitory stage in AGN evolution.
keywords:
Active Galaxies, Broad Absorption Lines, Quasars, Dust, Radiation Pressure1 Introduction
BAL QSOs represent a unique and enigmatic class of quasars that exhibit prominent blue-shifted absorption features in their spectra (Lynds, 1967; Trump et al., 2006) which evidence the presence of strong and massive outflows from the source (Allen et al., 2011; Hamann et al., 2013). They exhibit a continuous and wide absorption trough encompassing velocities reaching several times km/s (Risaliti et al., 2005; Gibson et al., 2009). The study of BAL QSOs holds significant importance in understanding the intricate interplay between the accretion disk, black hole, and surrounding environment (Hopkins et al., 2009; Hamann et al., 2019).
BAL QSOs are divided into three types based on the absorption lines present in the spectrum (Hall et al., 2002). High-ionization BAL quasars (HBAL QSOs), constituting approximately 85% of BAL quasars, exhibit absorption features only from highly ionised atoms. Low-ionization BAL quasars (LBAL QSOs) have high-ionization absorption plus displaying absorption troughs in low-ionisation ions, making up approximately 15% of the entire BAL population. FeLBAL QSOs, the rarest subtype among BAL QSOs, exhibit absorption from both high- and low-ionization species, as well as absorption from Iron excited states.
Observationally, a comparison of multiple wavelengths reveals minimal intrinsic distinctions between BALs and non-BALs, except for the tendency of BAL QSOs to exhibit redder ultraviolet continua compared to non-BAL QSOs (Weymann et al., 1991; Lewis et al., 2003). BALs are commonly associated with outflows from the accretion disk of active galactic nuclei (AGNs) (Murray et al., 1995). The origin of BALs in quasars is subject to two theoretical scenarios. The first suggests that BAL QSOs are essentially normal QSOs observed from a line of sight that passes through the outflowing gas (Elvis, 2000). The second scenario involves an evolutionary process (Williams et al., 1999) which is no longer preferred (Turnshek, 1988). The first scenario relies on the massive outflow of gas due to line-driving mechanism (Elvis, 2000; Risaliti et al., 2011). However, there are shreds of evidence in the spectra of BAL sources hinting at the presence of dust (Dunn et al., 2010; Borguet et al., 2013). We, therefore, aimed at testing whether there is any consistency or correlation between the properties of a dust-driven outflow and the probability of observing BAL feature in a given source. For the comprehensive version of this study, see Naddaf et al. (2023).
2 Methodology
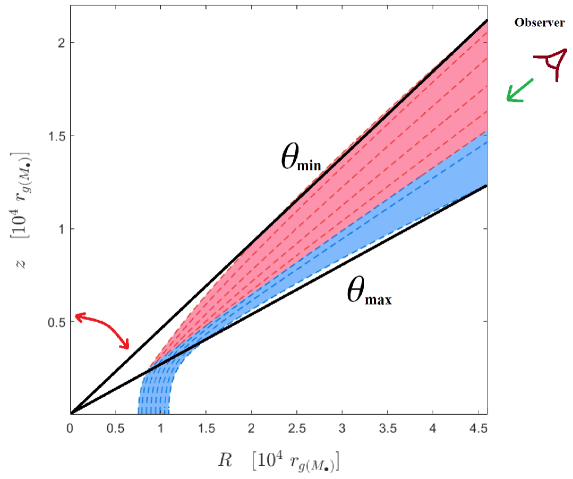
We use the enhanced 2.5D version of the failed radiatively accelerated dusty outflow model (FRADO) (Czerny & Hryniewicz, 2011; Naddaf & Czerny, 2022). FRADO model predicts that radiation pressure acting on dust lifts the clumps of dusty material from the surface of an accretion disk. Depending on the launching location and the global parameters, i.e. black hole mass (), Eddington ratio (), and metallicity (), the material may then come back to the disk surface or it may escape from the gravitational potential. Also, the launched material may or may not lose the dust content depending on the trajectory (for more details of the 2.5D model, see Naddaf et al., 2021; Naddaf & Czerny, 2022). An example of the outflow in the 2.5D FRADO model is shown in figure 1 which in this case includes both highly- and lowly-ionized regions shaded in red (dustless) and blue (dusty), respectively. The geometry of the outflow is a function of , , and . We calculate the probability of observing BAL feature as
| (1) |
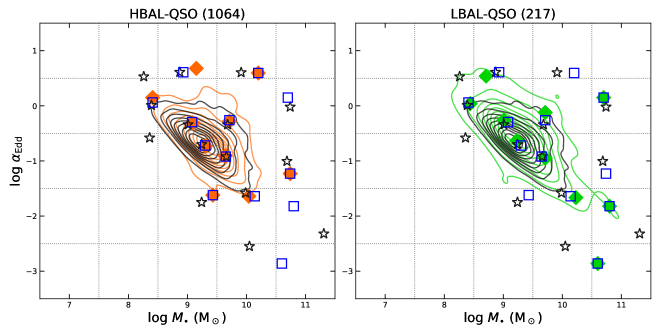
As for the observational data, we collected a sample from the quasar catalogue of the Sloan Digital Sky Survey DR7 (Shen et al., 2011). The selected sample consists of sources with a median SN per pixel in the rest-frame 2700-2900Å region in which the black hole masses are estimated from Mgii 2800 . The full sample contains 42,349 objects that 3% of which are detected as BAL QSOs. Black hole masses and Eddington ratios for Mgii were obtained from the SDSS catalog. Dividing the parameter space of black hole mass and Eddington ratio, -, into bins centered at integer values of and with the step size of one in log scale, the median values for the distribution of HBAL and LBAL sources of the sample in each bin are presented in Figure 2. The value from the sample of observational data which can be compared with from 2.5D FRADO is the prevalence ratio, , defined as
| (2) |
where stands for the corresponding number of sources in each bin.
3 Result & Discussion
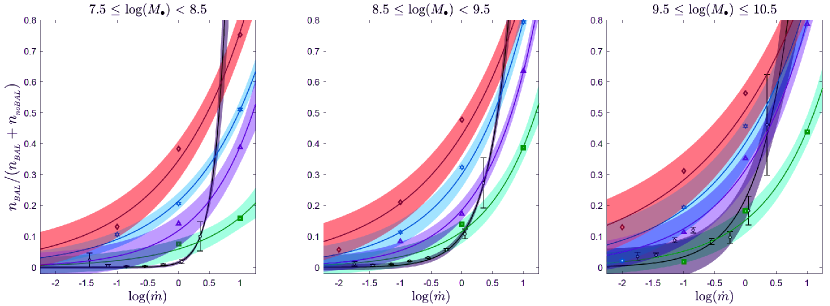
Utilizing the 2.5D FRADO model, we obtained the geometry of outflow for a range of global parameters of , , and . We then quantified the associated parameter . Concurrently, we analyzed an observational sample to extract the corresponding . The figure 3 presents a comparative analysis between the simulation results generated by 2.5D FRADO (colored data points) and observational data (black data points). Remarkably, exponential functions emerged as optimal fits that effectively captured the trends exhibited by the data points in all cases. This striking correlation between theoretical predictions and observational data lends substantial support to the hypothesis that the BAL effect is not a temporary phenomenon but rather arises from the inherent orientation of the source relative to the observer. Specifically, our findings indicate that the BAL effect, both in our model and in the empirical data, is predominantly associated with sources possessing exceeding , and also the effect gets amplified as the accretion rate of the source rises. Here we presented a subset of our results in which the presence of torus is not taken into account for computing the . In this particular scenario, characterized by the absence of a torus, our analysis reveals a preference for lower metallicities, as evident from the observed trends in the empirical data. However, through further investigations incorporating the torus (see Naddaf et al., 2023, for details), we found that higher metallicities are more favored especially when the accretion rate of the source is also higher, as frequently concluded in other studies (see e.g. Martínez-Aldama et al., 2018; Panda et al., 2019, 2020; Panda, 2021; Śniegowska et al., 2021; Panda, 2022; Garnica et al., 2022).
References
- Allen et al. (2011) Allen, J. T., et al., MNRAS 410, 2, 860 (2011)
- Borguet et al. (2013) Borguet, B. C. J., et al., ApJ 762, 1, 49 (2013)
- Czerny & Hryniewicz (2011) Czerny, B., Hryniewicz, K., A&A 525, L8 (2011)
- Dunn et al. (2010) Dunn, J. P., et al., ApJ 709, 2, 611 (2010)
- Elvis (2000) Elvis, M., ApJ 545, 1, 63 (2000)
- Garnica et al. (2022) Garnica, K., et al., A&A 667, A105 (2022)
- Gibson et al. (2009) Gibson, R. R., et al., ApJ 692, 1, 758 (2009)
- Hall et al. (2002) Hall, P. B., et al., ApJS 141, 2, 267 (2002)
- Hamann et al. (2019) Hamann, F., Herbst, H., Paris, I., Capellupo, D., MNRAS 483, 2, 1808 (2019)
- Hamann et al. (2013) Hamann, F., et al., MNRAS 435, 1, 133 (2013)
- Hopkins et al. (2009) Hopkins, P. F., Murray, N., Thompson, T. A., MNRAS 398, 1, 303 (2009)
- Lewis et al. (2003) Lewis, G. F., Chapman, S. C., Kuncic, Z., ApJL 596, 1, L35 (2003)
- Lynds (1967) Lynds, C. R., ApJ 147, 396 (1967)
- Martínez-Aldama et al. (2018) Martínez-Aldama, M. L., et al., A&A 618, A179 (2018)
- Murray et al. (1995) Murray, N., Chiang, J., Grossman, S. A., Voit, G. M., ApJ 451, 498 (1995)
- Naddaf & Czerny (2022) Naddaf, M. H., Czerny, B., A&A 663, A77 (2022)
- Naddaf et al. (2021) Naddaf, M. H., Czerny, B., Szczerba, R., ApJ 920, 1, 30 (2021)
- Naddaf et al. (2023) Naddaf, M. H., et al., A&A (2023)
- Panda (2021) Panda, S., A&A 650, A154 (2021)
- Panda (2022) Panda, S., Frontiers in Astronomy and Space Sciences 9, 850409 (2022)
- Panda et al. (2019) Panda, S., Marziani, P., Czerny, B., ApJ 882, 2, 79 (2019)
- Panda et al. (2020) Panda, S., Marziani, P., Czerny, B., Contributions of the Astronomical Observatory Skalnate Pleso 50, 1, 293 (2020)
- Risaliti et al. (2005) Risaliti, G., et al., ApJL 630, 2, L129 (2005)
- Risaliti et al. (2011) Risaliti, G., et al., MNRAS 410, 2, 1027 (2011)
- Shen et al. (2011) Shen, Y., et al., ApJS 194, 2, 45 (2011)
- Śniegowska et al. (2021) Śniegowska, M., et al., ApJ 910, 2, 115 (2021)
- Trump et al. (2006) Trump, J. R., et al., ApJS 165, 1, 1 (2006)
- Turnshek (1988) Turnshek, D. A., QSO Absorption Lines, Cambridge Uni. Press (1988)
- Weymann et al. (1991) Weymann, R. J., Morris, S. L., Foltz, C. B., Hewett, P. C., ApJ 373, 23 (1991)
- Williams et al. (1999) Williams, R. J. R., Baker, A. C., Perry, J. J., MNRAS 310, 4, 913 (1999)