Observation of time-reversal symmetry breaking in the band structure of altermagnetic RuO2
Abstract
Altermagnets are an emerging third elementary class of magnets. Unlike ferromagnets, their distinct crystal symmetries inhibit magnetization while, unlike antiferromagnets, they promote strong spin polarization in the band structure. The corresponding unconventional mechanism of time-reversal symmetry breaking without magnetization in the electronic spectra has been regarded as a primary signature of altermagnetism, but has not been experimentally visualized to date. We directly observe strong time-reversal symmetry breaking in the band structure of altermagnetic RuO2 by detecting magnetic circular dichroism in angle-resolved photoemission spectra. Our experimental results, supported by ab initio calculations, establish the microscopic electronic-structure basis for a family of novel phenomena and functionalities in fields ranging from topological matter to spintronics, that are based on the unconventional time-reversal symmetry breaking in altermagnets.
I Introduction
Conventionally, two elementary classes of crystals with collinear magnetic order have been considered - ferromagnetic and antiferromagnetic. The ferromagnetic exchange interaction generates strong magnetization and spin-polarization in electronic bands that break time-reversal () symmetry. Non-dissipative Hall currents, including their topological quantum variants Nagaosa et al. (2010); Tokura et al. (2019); Šmejkal et al. (2022a), as well as spin-polarized currents, vital in modern ferromagnetic information technologies Chappert et al. (2007); Ralph and Stiles (2008); Bader and Parkin (2010); Bhatti et al. (2017), are all based on the strong symmetry breaking in the electronic structure. However, ferromagnetic and topological-insulating phases are poorly compatible, and the inherent magnetization of ferromagnets limits the capacity and speed of ferromagnetic spintronic devices. In the second conventional class, the antiferromagnetic exchange generates compensated collinear order with no magnetization. The resulting absence in antiferromagnets of strong symmetry-breaking linear responses akin to ferromagnets has forced the antiferromagnetic spintronic research to exploit comparatively weak phenomena relying on relativistic spin-orbit coupling Jungwirth et al. (2016); Manchon et al. (2019). On the one hand, the weak responses represent a roadblock. On the other hand, the zero magnetization is well compatible with materials ranging from superconductors to insulators, and it enables breakthroughs towards information technologies with ultra-high capacity and speed Jungwirth et al. (2018); Baltz et al. (2018); Kimel and Li (2019).
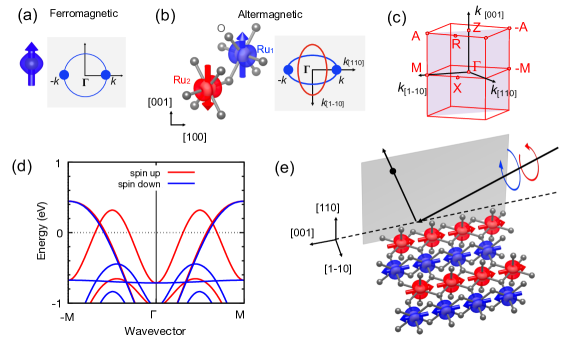
The above examples illustrate why discoveries of magnetic quantum matter with unconventional characteristics and functionalities remain central to the frontier research in condensed-matter physics, and to the development of ultra-scalable low-power technologies. Recently, a symmetry classification and description, focused within the hierarchy of interactions on the strong exchange, has led to the identification of a third elementary class of crystals with a collinear magnetic order, dubbed altermagnets Šmejkal et al. (2022b, c). As illustrated in Fig. 1, altermagnets have a symmetry-protected compensated antiparallel magnetic order on a crystal that generates an unconventional alternating spin-polarization and symmetry breaking in the band structure without magnetization Šmejkal et al. (2020). Altermagnets have been thus predicted to combine merits of ferromagnets and antiferromagnets, that were regarded as principally incompatible, and to have merits unparalleled in either of the two conventional magnetic classes Šmejkal et al. (2022b, c). While unconventional anomalous Hall and spin-polarized currents have been predicted Šmejkal et al. (2022a, c, 2020); Samanta et al. (2020); Naka et al. (2020); Hayami and Kusunose (2021); Mazin et al. (2021); Gonzalez Betancourt et al. (2023); Naka et al. (2022, 2019); González-Hernández et al. (2021); Naka et al. (2021); Ma et al. (2021); Šmejkal et al. (2022d, b) and recently observed in experiment Feng et al. (2022a); Gonzalez Betancourt et al. (2023); Bose et al. (2022); Bai et al. (2022); Karube et al. (2022), so far there has not been a direct measurement of the underlying symmetry breaking in the altermagnetic band structure.
A suitable microscopic tool is based on magnetic circular dichroism (MCD) which is an optical counterpart of the symmetry breaking anomalous Hall effect. The presence of MCD in altermagnets over the full spectral range up to X-rays has been confirmed by ab initio calculations Samanta et al. (2020); Hariki et al. (2023). MCD combined with angle-resolved photoemission spectroscopy then allows for the microscopic visualization of the symmetry breaking in the electronic-structure in momentum space. In the past, this technique has been successfully used in the investigation of ferromagnetic materials Schneider et al. (1991); Bansmann et al. (1992); Stöhr et al. (1993); van der Laan and Thole (1993); Braun (1996); Ebert and Schwitalla (1997); Henk et al. (1996); Yokoyama et al. (2008); Hild et al. (2009).
Our experimental study focuses on epitaxial RuO2, a workhorse material of the altermagnetic class Šmejkal et al. (2022b, c). The rutile crystal structure of metallic RuO2 has been shown to have a collinear compensated magnetic order Berlijn et al. (2017a); Zhu et al. (2019), and predicted to be an altermagnet Šmejkal et al. (2022b); Ahn et al. (2019) with a strong (order eV) symmetry breaking spin-splitting in momentum space, as shown in Fig. 1(b) and (d). This rutile crystal family is predicted to show topological properties as well, with prior spin-integrated angle-resolved photoemission studies reporting two Dirac nodal lines and pronounced topological interface states Jovic et al. (2018). More recently, the predictions of strong anomalous Hall and spin currents in combination with vanishing magnetization Šmejkal et al. (2020); González-Hernández et al. (2021) have also been experimentally verified Feng et al. (2022a); Bose et al. (2022); Bai et al. (2022); Karube et al. (2022) in this altermagnet.
Here we present direct evidence for a strong symmetry breaking in the band structure of epitaxial altermagnetic RuO2 films by detecting MCD in the angular distribution of photoelectrons, both for soft X-ray and ultraviolet photon excitation. We compare the experimental results to the corresponding calculations based on density functional theory.
Experimental Methods – We have grown epitaxial RuO2(110) films with a thickness of 34 nm by pulsed laser deposition on TiO2(110) substrates that were heated during deposition to 400 oC. The samples show no detectable remanent magnetization, consistent with the earlier magnetometry studies of analogous RuO2/TiO2 thin films Feng et al. (2022a). For growth and sample characterization details see Supplementary Materials.
For the photoemission measurements, photoelectrons were excited by circularly-polarized soft X-rays (beamline P04, PETRA III, DESY, Hamburg). For these experiments we used the time-of-flight momentum microscope DRUMSOX installed at the open port I of the beamline P04 with an energy resolution of 60 meV at a sample temperature of 70 K. In addition, circularly polarized ultraviolet light by a pulsed laser (6.4 eV, 80 MHz repetition rate, APE) was used. The photoemission experiments with laser excitation have been conducted using a time-of-flight momentum microscope (ToFMM, Surface Concept GmbH) with the resolution set to 40 meV Medjanik et al. (2017) and at 20 K.
The circular-dichroism photoemission experiments described below have been performed with the incidence angle of the photon beam at 22∘ with respect to the sample surface and the azimuthal orientation of the sample has been adjusted so that the photon incidence plane coincides with the easy spin axis of RuO2, i.e., the [001] c-axis Berlijn et al. (2017b); Šmejkal et al. (2020); Feng et al. (2022b).
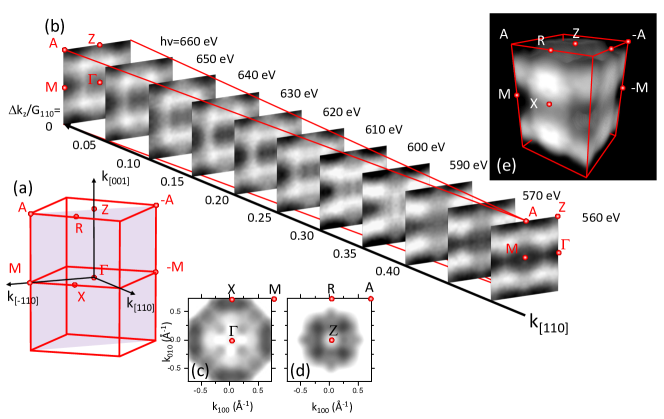
The coordinate system for the photoelectron momentum () is set to along the crystallographic [110] direction, i.e. surface normal, along [001] and along in-plane directions, respectively. A sketch of the experimental geometry is shown in Fig. 1 (e).
Results with soft X-ray excitation – Using soft X-ray excitation, we can measure the intensity distribution of the direct transitions in four-dimensional energy-momentum space , which is the spectral density function modulated by matrix elements accounting for the photo-excitation probability for a given initial and final state . As described in detail in the Supplementary Materials, for a given photon energy and binding energy , the final photoelectron states are located on a spherical shell with radius (for units Å-1 and eV)
| (1) |
Here the inner potential eV is referenced to the Fermi energy and the transferred photon momentum leads to a rigid shift of the free-electron final state sphere by the vector with absolute value along the photon beam Medjanik et al. (2017). The kinetic energy of the emitted photoelectrons is recorded by their time of flight and the Fermi edge serves as reference for . The photon energy range used in these experiments is 560 to 660 eV (see Supplementary Material for details).
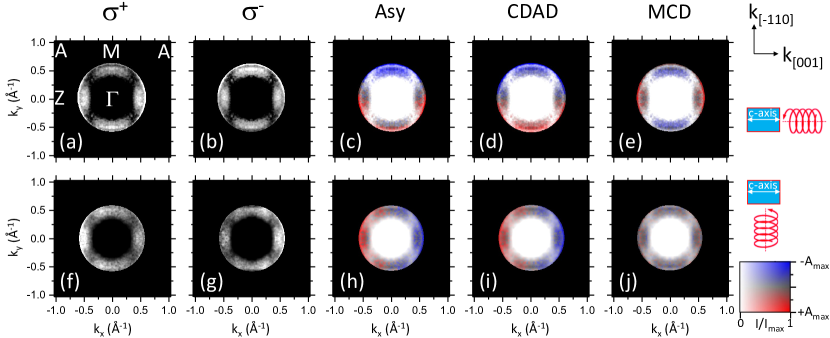
In our measurements, is the intensity averaged between the two light polarizations. The intensity asymmetry, which contains the dichroism information, is calculated pixel-by-pixel as , with and denoting the intensity measured at circular right and left polarization. This intensity asymmetry contains a well known dichroism component related to the measurement geometry and a component connected to the magnetic ordering. The geometry related component is the so-called circular dichroism in the angular distribution (CDAD) Westphal et al. (1989); Daimon et al. (1995), which is included in the asymmetric component of with respect to the line coinciding with the direction. CDAD is observed for a dissymmetric (handed) spatial arrangement of the quantization axis of initial state orbital momenta (), the photon impact direction () and the photoelectron momentum (). Thus, CDAD from non-magnetic targets requires a handedness in the experimental geometry. It is therefore strictly antisymmetric with respect to the plane of photon incidence spanned by and the surface normal ([110] direction). To isolate the CDAD in the experimental data we calculate the corresponding asymmetry as .
In contrast to non-magnetic systems, magnetic systems can provide an additional asymmetry mechanism if the light polarization vector is parallel or antiparallel to the spin axis, which gives rise to MCD Schneider et al. (1991). We can eliminate the contribution from the in the experimental asymmetry data, and hence extract the MCD contribution in the remaining asymmetry, by calculating .
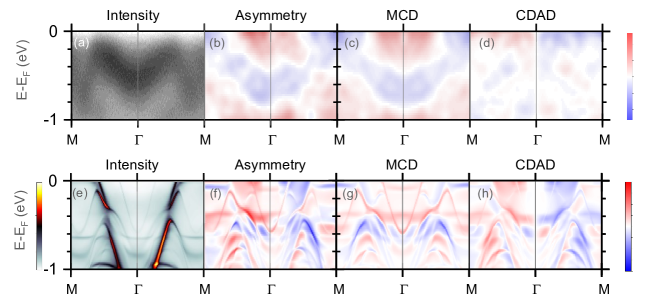
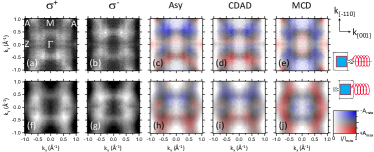
We present next the key results of our studies in Fig. 2. We show the measured intensity along the M--M line (see Fig. 1(c)), the intensity asymmetry , the MCD , and the CDAD in Fig. 2 (a)-(d), and their corresponding ab-initio based calculations for the specific experimental geometry in Fig. 2 (e)-(h). The theoretical DFT+U calculations are based on the one-step formulation of the photoemission process, using the Korringa–Kohn–Rostoker ab-initio approach that represents the electronic structure of a system directly and efficiently in terms of its single-particle Green’s function Ebert et al. (2011); Braun et al. (2018). The parameters used in the calculations correspond to those in Ref. Šmejkal et al., 2022e. We also note that the MCD spectra is not a direct map of the ground state polarization, as shown in Ref. Scholz et al., 2013, due to the final state effects. The calculations take into account the free electron like final state at the corresponding (e.g. photon energy of 680eV) and the matrix element of the induced transition. As it is directly seen in Fig. 2 (c) and (g), the experimentally measured and theoretically calculated MCD spectra show a very strong symmetry breaking whose magnitude is consistent with the exchange dominated mechanism as predicted by the theory of altermagnetism Šmejkal et al. (2022b). It is also important to contrast the MCD and CDAD data, which shows a dominance of the MCD contribution to the intensity asymmetry, confirming its direct observation beyond any experimental artefact that may have originated from the CDAD signal.
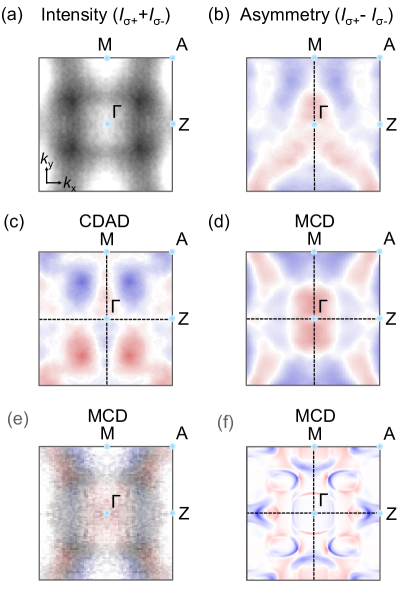
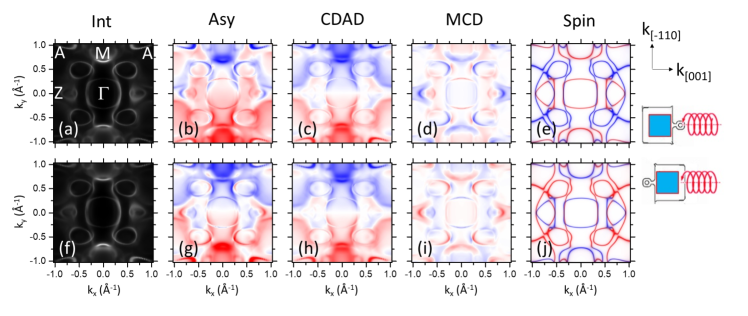
In Fig. 3 we present the measured intensity and asymmetry at the Fermi energy in the -M-A-Z plane. The asymmetry is shown in Fig. 3 (b) and the corresponding CDAD and MCD components in Fig. 3 (c) and (d). The convolution of the MCD with the average intensity plots is shown in Fig. 3 (e). It reveals the relevant parts of the MCD spectra, since some seemingly prominent features in Fig. 3(d) have very low intensity and hence are not directly reliably measured. For comparison, Fig. 3 (f) shows the theoretical MCD (not convoluted with the intensity) at the Fermi energy.
We have confirmed the magnetic origin of the observed spectra by repeating the experiment after rotating the sample around the surface normal by 180∘, which effectively rotates the magnetic order. We present the experimental results and the corresponding theoretical calculations for both orientations in the Supplementary Material (see Figs. SM-3 and SM-4). The distribution of is similar to the results for the non-rotated sample. This can be expected because the (,) plane represents a crystal mirror plane. In contrast, reversed its sign as expected. The spectra do not match exactly since due to the experimental set-up limitations the area illuminated is not exactly the same, but even at this semi-quantitive level the conclusion remains the same. This result also confirms that the geometry of the experiment points to a spin quantization axis along , corresponding to the c-axis of the RuO2 crystal structure.
Results with ultraviolet excitation – We have further confirmed the results by performing ultraviolet excitation experiments with a photon energy of 6.4 eV using an infrared fibre laser with quadrupled photon energy. The results are restricted to a field of view limited to an area near the zone center [see Supplementary Material Fig. SM-6(b)]. We present the circular dichroism results obtained for 6.4 eV photon energy in the Supplementary Material Fig. SM-7. The asymmetries and decomposition in CDAD and MCD are calculated in the same way as for the soft X-ray results. The ultraviolet excitation results are fully consistent with the X-ray results depicted above.
In addition, as a control test, we also performed the ultraviolet excitation photoemission experiment with the c-axis orientated perpendicular to the incident light beam (see Supplementary Material Fig. SM-7(f-j)). In this case, [Fig. SM-7(j)] vanishes within error limits. This observation indicates that the spin axis points perpendicular to the light polarization vector and hence parallel to the c-axis [001], in agreement with the results obtained with the soft X-ray excitation.
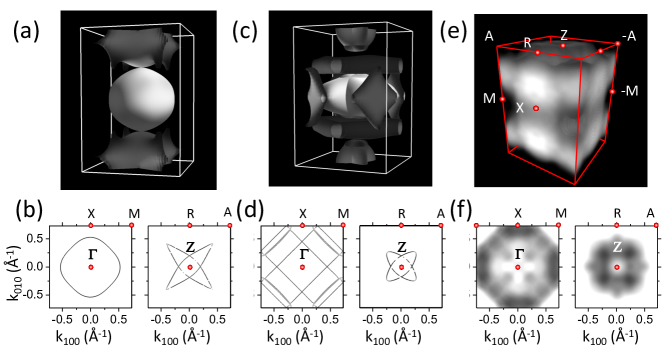
In order to verify the altermagnetic phase of RuO2, we can compare the experimental results with key theoretically predicted features for the paramagnetic vs. the altermagnetic phase. The theoretical calculations for the paramagnetic phase are shown in Fig. 4(a), together with the Fermi surface cuts for the plane perpendicular to the c-axis [110] at the -X-M plane and the Z-A-R plane in Fig. 4(b). We show the corresponding Fermi surface and cuts for the altermagnetic phase in Fig. 4(c),(d). The comparison to experiment is obtained by a tomographic mapping of the three-dimensional Brillouin zone [Fig. 1(c)], obtained by varying the photon energy in the range of 560 - 660 eV. According to Eq. 1 this variation results in values ranging from to , i.e., from the center to the rim of a Brillouin zone [see Supplementary Material Fig. SM-5(b)]. Here is the magnitude of the [110] reciprocal lattice vector. Exploiting the translational symmetry in momentum space, the intensity distributions map a complete Brillouin zone. The Fermi energy intensity distribution shown along the same cuts and the overall shape of the reconstructed Fermi surface in Fig. 4 (e),(f) match directly with the theoretical calculations of the collinear compensated altermagnetic phase in Fig. 4 (c),(d).
Conclusion – We have experimentally established the key signature of the recently predicted Šmejkal et al. (2022b, c) altermagnetic phase by directly detecting -symmetry breaking in the band structure of the collinear compensated magnet RuO2. Supported by ab initio calculations, our experimental results underpin on the microscopic electronic-structure level the recently reported unconventional macroscopic responses, namely the anomalous Hall and spin-polarized currents accompanied by vanishing magnetization Feng et al. (2022a); Gonzalez Betancourt et al. (2023); Bose et al. (2022); Bai et al. (2022); Karube et al. (2022), in this workhorse altermagnetic material. In general, our results microscopically establish the grounds for the exploration and exploitation of envisaged Šmejkal et al. (2022b, c) phenomena and functionalities based on the altermagnetic -symmetry breaking that are beyond the reach of the conventional magnetic phases in fields ranging from spintronics, ultrafast magnetism, magneto-electrics, and magnonics, to topological matter and superconductivity.
Sincere thanks are due to M. Kallmayer and A. Oelsner (Surface Concept GmbH) and T. Grunske, T. Kauerhof, and K. von Volkmann (APE GmbH) for continuous support. This work was funded by the Deutsche Forschungsgemeinschaft (DFG) Grant No. TRR 173 268565370 (projects A02, A03, A05, and B02), by the BMBF (projects 05K22UM1 and 05K19UM2), by JGU TopDyn initiative, by the EU FET Open RIA Grant no. 766566, and by the Grant Agency of the Czech Republic grant no. 19-28375X. J.M. and S.W.DS would like to thank CEDAMNF project financed by the Ministry of Education, Youth and Sports of Czech Republic, Project No. CZ.02.1.01/0.0/0.0/15003/0000358. Q.N. acknowledges support by the Q-FARM Bloch Fellowship and U.S. DOE (DE-AC02–76SF00515).
References
- Nagaosa et al. (2010) N. Nagaosa, J. Sinova, S. Onoda, A. H. MacDonald, and N. P. Ong, Reviews of Modern Physics 82, 1539 (2010), arXiv:0904.4154 .
- Tokura et al. (2019) Y. Tokura, K. Yasuda, and A. Tsukazaki, Nature Reviews Physics 1, 126 (2019).
- Šmejkal et al. (2022a) L. Šmejkal, A. H. MacDonald, J. Sinova, S. Nakatsuji, and T. Jungwirth, Nature Reviews Materials 7, 482 (2022a), arXiv:2107.03321 .
- Chappert et al. (2007) C. Chappert, A. Fert, and F. N. Van Dau, Nature Materials 6, 813 (2007), arXiv:1003.4058 .
- Ralph and Stiles (2008) D. C. Ralph and M. D. Stiles, Journal of Magnetism and Magnetic Materials 320, 1190 (2008), arXiv:0711.4608 .
- Bader and Parkin (2010) S. D. Bader and S. Parkin, Annual Review of Condensed Matter Physics 1, 71 (2010).
- Bhatti et al. (2017) S. Bhatti, R. Sbiaa, A. Hirohata, H. Ohno, S. Fukami, and S. Piramanayagam, Materials Today 20, 530 (2017).
- Jungwirth et al. (2016) T. Jungwirth, X. Marti, P. Wadley, and J. Wunderlich, Nat. Nanotech. 11, 231 (2016).
- Manchon et al. (2019) A. Manchon, J. Železný, I. M. Miron, T. Jungwirth, J. Sinova, A. Thiaville, K. Garello, and P. Gambardella, Reviews of Modern Physics 91, 035004 (2019), arXiv:1801.09636 .
- Jungwirth et al. (2018) T. Jungwirth, J. Sinova, A. Manchon, X. Marti, J. Wunderlich, and C. Felser, Nature Physics 14, 200 (2018).
- Baltz et al. (2018) V. Baltz, A. Manchon, M. Tsoi, T. Moriyama, T. Ono, and Y. Tserkovnyak, Rev. Mod. Phys. 90, 015005 (2018).
- Kimel and Li (2019) A. V. Kimel and M. Li, Nature Reviews Materials 4, 189 (2019).
- Šmejkal et al. (2022b) L. Šmejkal, J. Sinova, and T. Jungwirth, Physical Review X 12, 031042 (2022b).
- Šmejkal et al. (2022c) L. Šmejkal, J. Sinova, and T. Jungwirth, Physical Review X 12, 040501 (2022c), arXiv:2204.10844 .
- Šmejkal et al. (2020) L. Šmejkal, R. González-Hernández, T. Jungwirth, and J. Sinova, Science Advances 6, eaaz8809 (2020), arXiv:1901.00445 .
- Samanta et al. (2020) K. Samanta, M. Ležaić, M. Merte, F. Freimuth, S. Blügel, and Y. Mokrousov, Journal of Applied Physics 127, 213904 (2020).
- Naka et al. (2020) M. Naka, S. Hayami, H. Kusunose, Y. Yanagi, Y. Motome, and H. Seo, Physical Review B 102, 075112 (2020).
- Hayami and Kusunose (2021) S. Hayami and H. Kusunose, Physical Review B 103, L180407 (2021).
- Mazin et al. (2021) I. I. Mazin, K. Koepernik, M. D. Johannes, R. González-Hernández, and L. Šmejkal, Proceedings of the National Academy of Sciences 118 (2021), 10.1073/pnas.2108924118.
- Gonzalez Betancourt et al. (2023) R. D. Gonzalez Betancourt, J. Zubáč, R. Gonzalez-Hernandez, K. Geishendorf, Z. Šobáň, G. Springholz, K. Olejník, L. Šmejkal, J. Sinova, T. Jungwirth, S. T. B. Goennenwein, A. Thomas, H. Reichlová, J. Železný, and D. Kriegner, Physical Review Letters 130, 036702 (2023), arXiv:2112.06805 .
- Naka et al. (2022) M. Naka, Y. Motome, and H. Seo, , 1 (2022), arXiv:2208.11823 .
- Naka et al. (2019) M. Naka, S. Hayami, H. Kusunose, Y. Yanagi, Y. Motome, and H. Seo, Nature Communications 10, 4305 (2019), arXiv:1902.02506 .
- González-Hernández et al. (2021) R. González-Hernández, L. Šmejkal, K. Výborný, Y. Yahagi, J. Sinova, T. Jungwirth, and J. Železný, Physical Review Letters 126, 127701 (2021), arXiv:2002.07073 .
- Naka et al. (2021) M. Naka, Y. Motome, and H. Seo, Physical Review B 103, 125114 (2021), arXiv:2011.12459 .
- Ma et al. (2021) H.-Y. Ma, M. Hu, N. Li, J. Liu, W. Yao, J.-F. Jia, and J. Liu, Nature Communications 12, 2846 (2021).
- Šmejkal et al. (2022d) L. Šmejkal, A. B. Hellenes, R. González-Hernández, J. Sinova, and T. Jungwirth, Physical Review X 12, 011028 (2022d), arXiv:2103.12664 .
- Feng et al. (2022a) Z. Feng, X. Zhou, L. Šmejkal, L. Wu, Z. Zhu, H. Guo, R. González-Hernández, X. Wang, H. Yan, P. Qin, X. Zhang, H. Wu, H. Chen, Z. Meng, L. Liu, Z. Xia, J. Sinova, T. Jungwirth, and Z. Liu, Nature Electronics 5, 735 (2022a).
- Bose et al. (2022) A. Bose, N. J. Schreiber, R. Jain, D. f. Shao, H. P. Nair, J. Sun, X. S. Zhang, D. A. Muller, E. Y. Tsymbal, D. G.Schlom, and D. C. Ralph, Nature Electronics 5, 263 (2022).
- Bai et al. (2022) H. Bai, L. Han, X. Feng, Y. Zhou, R. Su, Q. Wang, L. Liao, W. Zhu, X. Chen, F. Pan, X. Fan, and C. Song, Physical Review Letters 128, 197202 (2022).
- Karube et al. (2022) S. Karube, T. Tanaka, D. Sugawara, N. Kadoguchi, M. Kohda, and J. Nitta, Physical Review Letters 129, 137201 (2022), arXiv:2111.07487 .
- Hariki et al. (2023) A. Hariki, T. Yamaguchi, D. Kriegner, K. W. Edmonds, P. Wadley, S. S. Dhesi, G. Springholz, L. Šmejkal, K. Výborný, T. Jungwirth, and J. Kuneš, (2023), 10.48550/arXiv.2305.03588, arXiv:2305.03588 .
- Schneider et al. (1991) C. M. Schneider, M. S. Hammond, P. Schuster, A. Cebollada, R. Miranda, and J. Kirschner, Physical Review B 44, 12066 (1991).
- Bansmann et al. (1992) J. Bansmann, C. Westphal, M. Getzlaff, F. Fegel, and G. Schönhense, Journal of Magnetism and Magnetic Materials 104-107, 1691 (1992).
- Stöhr et al. (1993) J. Stöhr, Y. Wu, B. D. Hermsmeier, M. G. Samant, G. R. Harp, S. Koranda, D. Dunham, and B. P. Tonner, Science 259, 658 (1993).
- van der Laan and Thole (1993) G. van der Laan and B. T. Thole, Physical Review B 48, 210 (1993).
- Braun (1996) J. Braun, Reports on Progress in Physics 59, 1267 (1996).
- Ebert and Schwitalla (1997) H. Ebert and J. Schwitalla, Physical Review B 55, 3100 (1997).
- Henk et al. (1996) J. Henk, T. Scheunemann, S. V. Halilov, and R. Feder, Journal of Physics: Condensed Matter 8, 47 (1996).
- Yokoyama et al. (2008) T. Yokoyama, T. Nakagawa, and Y. Takagi, International Reviews in Physical Chemistry 27, 449 (2008).
- Hild et al. (2009) K. Hild, J. Maul, G. Schönhense, H. J. Elmers, M. Amft, and P. M. Oppeneer, Physical Review Letters 102, 057207 (2009).
- Berlijn et al. (2017a) T. Berlijn, P. Snijders, O. Delaire, H.-D. Zhou, T. Maier, H.-B. Cao, S.-X. Chi, M. Matsuda, Y. Wang, M. Koehler, P. Kent, and H. Weitering, Physical Review Letters 118, 077201 (2017a).
- Zhu et al. (2019) Z. Zhu, J. Strempfer, R. Rao, C. Occhialini, J. Pelliciari, Y. Choi, T. Kawaguchi, H. You, J. Mitchell, Y. Shao-Horn, and R. Comin, Physical Review Letters 122, 017202 (2019).
- Ahn et al. (2019) K.-H. Ahn, A. Hariki, K.-W. Lee, and J. Kuneš, Physical Review B 99, 184432 (2019).
- Jovic et al. (2018) V. Jovic, R. J. Koch, S. K. Panda, H. Berger, P. Bugnon, A. Magrez, K. E. Smith, S. Biermann, C. Jozwiak, A. Bostwick, E. Rotenberg, and S. Moser, Physical Review B 98, 241101 (2018).
- Medjanik et al. (2017) K. Medjanik, O. Fedchenko, S. Chernov, D. Kutnyakhov, M. Ellguth, A. Oelsner, B. Schönhense, T. R. F. Peixoto, P. Lutz, C.-H. Min, F. Reinert, S. Däster, Y. Acremann, J. Viefhaus, W. Wurth, H. J. Elmers, and G. Schönhense, Nature Materials 16, 615 (2017).
- Berlijn et al. (2017b) T. Berlijn, P. C. Snijders, O. Delaire, H.-D. Zhou, T. A. Maier, H.-B. Cao, S.-X. Chi, M. Matsuda, Y. Wang, M. R. Koehler, P. R. C. Kent, and H. H. Weitering, Physical Review Letters 118, 077201 (2017b), arXiv:1612.09589 .
- Feng et al. (2022b) Z. Feng, X. Zhou, L. Šmejkal, L. Wu, Z. Zhu, H. Guo, R. González-Hernández, X. Wang, H. Yan, P. Qin, X. Zhang, H. Wu, H. Chen, Z. Meng, L. Liu, Z. Xia, J. Sinova, T. Jungwirth, and Z. Liu, Nature Electronics 5, 735 (2022b), arXiv:2002.08712 .
- Westphal et al. (1989) C. Westphal, J. Bansmann, M. Getzlaff, and G. Schönhense, Physical Review Letters 63, 151 (1989).
- Daimon et al. (1995) H. Daimon, T. Nakatani, S. Imada, and S. Suga, Journal of Electron Spectroscopy and Related Phenomena 76, 55 (1995).
- Ebert et al. (2011) H. Ebert, D. Ködderitzsch, and J. Minár, Reports on Progress in Physics 74, 096501 (2011).
- Braun et al. (2018) J. Braun, J. Minár, and H. Ebert, Physics Reports 740, 1 (2018).
- Šmejkal et al. (2022e) L. Šmejkal, A. Marmodoro, K.-H. Ahn, R. Gonzalez-Hernandez, I. Turek, S. Mankovsky, H. Ebert, S. W. D’Souza, O. Šipr, J. Sinova, and T. Jungwirth, arXiv:2211.13806 , 1 (2022e), arXiv:2211.13806 .
- Scholz et al. (2013) M. R. Scholz, J. Sánchez-Barriga, J. Braun, D. Marchenko, A. Varykhalov, M. Lindroos, Y. J. Wang, H. Lin, A. Bansil, J. Minár, H. Ebert, A. Volykhov, L. V. Yashina, and O. Rader, Physical Review Letters 110, 216801 (2013).
- Schönhense (1990) G. Schönhense, Physica Scripta T31, 255 (1990).
- Stejskal et al. (2021) O. Stejskal, M. Veis, and J. Hamrle, Scientific Reports 11 (2021), 10.1038/s41598-021-00478-1.
- Sup (a) H. Ebert, A. Perlov, and S. Mankovsky, Solid State Commun. 127, 443 (2003). (a).
- Sup (b) P. Lloyd, Proc. Phys. Soc. 90, 207 (1967); P. Lloyd and P. V. Smith, Adv. Phys. 21, 69 (1972); R. Zeller, J. Phys.: Condens. Matter 20, 035220 (2008). (b).
- (58) K. Dewhurst, “Elk code,” .
II Supplementary Material
II.1 Sample preparation and characterization
Epitaxial RuO2(110) films with a thickness of 34 nm were grown by pulsed laser deposition on TiO2(110) substrates that were heated during deposition to 400 oC. The oxygen pressure was 0.02 mbar and typical growth rates were 1.9 nm/min with the KrF excimer laser running at 10 Hz and 150 mJ pulse energy. Samples were structurally characterized by X-ray diffraction, X-ray reflectometry and in-situ reflective high energy electron diffraction (RHEED). From X-ray reflectometry we find that 34 nm samples have a surface roughness smaller than 0.3 nm, while the width of the out-of plane scattering peak in 2 indicates a somewhat reduced coherent scattering volume of 22 nm. The existence of the RHEED scattering pattern shows that crystallinity persists up to the surface. The full width at half maximum of the rocking curve is 1.0o indicating a good alignment of the surface normal. scans reveal the epitaxial growth and show a two fold symmetry of (200) peaks aligned with that from the substrate. The width of the peaks in is 2o. From the determined lattice constants we conclude on a compressive strain of -1.4% along -axis and a tensile strain of 0.4% along -axis. Samples were transported from the deposition chamber to the photoemission experiment using an ultra-high vacuum suitcase.
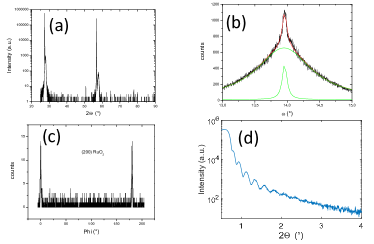
We examined the crystal structure of the samples using a four circle Bruker D8 Discover X-ray diffractometer. The instrument was operated with a copper anode, a Goebel mirror, and a Germanium 2-bounce monochromator to eliminate Cu Kα2 and Cu Kβ radiation. Fig. SM-1(a) displays a scan of the sample investigated at the synchrotron. The figure reveals pronounced peaks corresponding to the [110] and [220] orientations of the substrate. Adjacent to them, we observe film peaks corresponding to [110] and [220], indicating slightly smaller lattice plane distances for the films compared to the substrate. No other peaks are visible in the X-ray diffraction diagram. The small yet distinct peak at 50.7∘ results from Cu Kβ radiation that was not perfectly filtered and diffracted at the [220] substrate peak.
The analysis of the tilt of [110] film lattice planes relative to the surface normal was conducted through the performance of rocking curves (-scans), as depicted in Fig. SM-1(b). The observed peak exhibited two contributions and was fitted using a summation of two Lorentzian lines. The exceptionally sharp peak is presumed to originate from the nearby substrate peak. The second peak, characterized by a width of 1.0∘, provides information regarding the tilt of the out-of-plane directions of the crystallites. The in-plane alignment of the crystallites was confirmed through (Phi) scans of non-specular reflections, such as the [101] and [200] film peaks. In Fig. SM-1(c), only two reflections with a 180∘ difference are observed, specifically the [200] and [020] film peaks. The angles are aligned with their corresponding substrate reflections.
Low-angle X-ray reflectivity experiments provide valuable information regarding the total film thickness and film roughness. By analyzing the distance between oscillations in Fig. SM-1(d), we calculated a film thickness of 33.7 nm and a total roughness of 1.5 nm, which includes contributions from both substrate and surface roughness.
II.2 Details of soft X-ray excitation
As we have described in the main text, using soft X-ray excitation measures the photoelectron intensity distribution . Considering the energy conservation and the role of reciprocal lattice vectors in order to obey momentum conservation, for a given photon energy and binding energy , the final photoelectron states are located on a spherical shell with radius (for units Å-1 and eV)
| (2) |
Here, we assume free-electron like final states, whose final-state energies inside the material are determined by the inner potential eV referenced to the Fermi energy. The transferred photon momentum leads to a rigid shift of the final state sphere by the vector with absolute value along the photon beam Medjanik et al. (2017).
The kinetic energy of the emitted photoelectrons is recorded by their time of flight. The Fermi edge serves as reference for . The pattern observed on the detector represents the photoelectron intensity distribution as a function of the transversal momentum .
We next discuss the photoelectron intensity distributions averaged for circular left and right polarization. Fig. SM-2(a,b) shows results recorded at a photon energy of 380 eV corresponding to final states in the 5th repeated BZ along the direction perpendicular to the surface (). The results are shown as raw data divided by the detector response function. The constant energy map [Fig. SM-2(a)] at the Fermi level reveals the two-fold symmetry of the RuO2(110) surface. The cut along the high symmetry direction indicates the energy dispersion of the valence band [Fig. SM-2(b)]. We observe a homogeneous background intensity and the maximum photoelectron intensity of direct transitions amounts to 20% of the background intensity, originating from quasi-inelastic scattering. The electron bands appear broadened both on the energy and momentum scale, which cannot be explained by the finite energy and momentum resolution of the instrument. Instead, we attribute the broadening to the electron correlation, which is expected to be large in oxides Ahn et al. (2019).
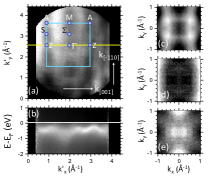
The symmetrized constant energy maps centered at in the range of eV [Fig. SM-2(c-e)] have been acquired for eV and cover one Brillouin zone. The maps agree with previously published results Jovic et al. (2018) on RuO2 single crystals obtained with a photon energy of 131 eV, except for the localized high intensity at the crossing points of horizontal and vertical lines, which may stem from surface states. Hence, we attribute the observed photoelectron intensity distribution to bulk states of RuO2.
To further verify the results of the circular dichroism observations, we show the intensity maps at the Fermi level for circular left and right polarization [Fig. SM-3(a,b)]. Here, as compared to the main text, the asymmetry, CDAD, and MCD are presented convoluted with the averaged intensity maps [Fig. SM-3(c)-(e) and (h)-(f)]. As with the results presented in Fig. 2, the asymmetry is decomposed in the CDAD and MCD components. The result shown in Fig. SM-3(d) reveals predominantly negative values for positive except for a reversed sign close to . The maximum experimental values amount to 5.4%. After subtracting the homogeneous background intensity, the CDAD for direct transitions is 27% and its size is thus in the range of previously reported values Schönhense (1990). For non-magnetic systems is the only possible circular dichroism mechanism except for crystal structures with natural chirality, where effects are extremely small. On the other hand, CDAD is ubiquitous in photoemission because it is a pure orbital effect and does not require spin-orbit interaction and heavy elements.
The MCD data show a negative asymmetry for the vertical stripes parallel to -M and positive values for the horizontal strips parallel to -Z. Along the M--M path in Fig. 6(e), is negative near the M-points and positive near the point, in good agreement with the results shown in Fig. 2(c) for the Fermi level.
To confirm that the observed is connected to the magnetic order of the sample, we rotated the sample around the surface normal by 180 degrees and repeated the photoemission experiment, albeit not in the same exact spot given the experimental limitations of the set-up. Corresponding results are shown in Figs. SM-3(f-j). The distribution of is similar to the results for the non-rotated sample. This can be expected because the (,) plane represents a crystal mirror plane. In contrast, has reversed its sign. The reversal of the sign of the MCD data further confirms that the observations and those in Fig. 2 are a directly observation of the broken time-reversal symmetry of the altermagnetic sample.
In Fig. SM-4 we present the theory calculations corresponding to the experiment and the spin-resolved bands presented in SM-4 (e) and (j). Here the color plots are not convoluted with the intensity for easier visualization. Fig. SM-4 (a)-(e) corresponds to the experimental set-up of SM-3 (a)-(e) and Fig. SM-4 (f)-(j) corresponds to the experimental set-up of SM-3 (f)-(j).
We present the scan of the perpendicular momentum by photon energy in Fig. SM-5. This topographic mapping is made by varying the photon energy in the range of 560 - 660 eV. According to Eq. 2 this variation results in values ranging from to , i.e. from the center to the rim of a Brillouin zone [see Fig. SM-5(b)]. Similarly, corresponding asymmetry maps were determined. Exploiting the translational symmetry in momentum space, the intensity distributions map a complete Brillouin zone. This topographic map and cuts are the ones used in Fig. 4.
II.3 Results with ultraviolet excitation
As compared to the previous results, photoelectron excitation with a photon energy of 6.4 eV using an infrared fibre laser with quadrupled photon energy is favourable with respect to photon intensity. Yet, the small photon energy limits the detectable parallel momentum to Å-1 [see Fig. SM-6(a)]. Assuming an excitation into free-electron like final states Stejskal et al. (2021), Eq. 2 results in a cut close to the center of the second repeated Brillouin zone () in momentum space [see Fig. SM-6(b)]. At increased binding energy, we still observe the two pairs of horizontal and vertical bands, which we identify with the band features seen with soft X-ray excitation. The dispersion maps [Figs. SM-6(c,d)] reveal a maximum binding energy of the parabolic band at of 0.6 eV, in reasonable agreement with results obtained with soft X-ray excitation. When comparing band dispersions at different photon energies, the different cuts in the three-dimensional momentum-space and a possible variation of the effective mass must be considered.
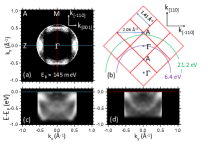
The circular dichroism results obtained for 6.4 eV photon energy are shown in Fig. SM-7. The asymmetries are calculated in the same way as for the soft X-ray results. In this case the azimuthal orientation could not be varied in-situ and hence we compare to similarly prepared samples with the c-axis oriented parallel and perpendicular to the incident light beam. For the case of parallel orientation [Fig. SM-7(a-e)] shows the expected antisymmetric behavior with respect to the symmetry axis, originating from non-relativistic CDAD Westphal et al. (1989); Daimon et al. (1995). By calculating we separate the CDAD asymmetry as shown in Fig. SM-3(c-d and h-i). The CDAD shows the same antisymmetry as in the soft X-ray case with the characteristic feature of a sign change at the line . This line corresponds to the coplanar geometry of crystal mirror plane and photon incidence plane. The maximum experimental values amount to 26%.
The calculation of results in the magnetic contribution to the circular dichroism [Fig. SM-7(e)]. We observe a positive asymmetry for the vertical stripes parallel to -M and negative values for the horizontal strips parallel to -Z. The maximum values of are 13%. observed with 6.4 eV excitation thus confirms the non-vanishing magnetic circular dichroism observed for soft X-ray excitation.
A similar photoemission experiment with the c-axis orientated perpendicular to the incident light beam serves as a control test [Fig. SM-7(f-j)]. In this case, shows a left-right asymmetry with respect to the -M axis [Fig. SM-7(i)]. [Fig. SM-7(j)] vanishes within error limits. This observation indicates that the magnetization axis points perpendicular to the light polarization vector and hence parallel to the c-axis [001], in perfect agreement with the results obtained with soft X-ray excitation.
II.4 Ab initio calculations
We have calculated the ground state electronic structure of RuO2 in P42/mnm (Space group:136) symmetry using the optimized lattice parameter (a = b = 4.5331 Å, c = 3.1241 Å) Šmejkal et al. (2020). These calculations were carried out using spin-polarized relativistic Korringa-Kohn-Rostoker (SPRKKR) Green’s function method in the atomic sphere approximation (ASA), within the rotationally invariant GGA+U scheme as implemented in the SPRKKR formalism Ebert et al. (2011); Sup (a). The screened on-site Coulomb interaction U and exchange interaction J of Ru are set to 2.00 eV and 0.70 eV, respectively. The angular momentum expansion up to has been used for each atom on a 22 x 22 x 32 k-point grid. The energy convergence criterion has been set to 10-5 Ry. Lloyd’s formula has been employed for accurate determination of the Fermi level Sup (b). The ab initio photoemission calculations of RuO2(110) were performed within the one-step model of photoemission in the spin-density-matrix formulation as implemented in the SPRKKR package Braun et al. (2018), taking into account all geometry and light-induced effects of the photoemission process for the actual experiment including photoelectron angular distribution, matrix elements and final states constructed as the time-reversed LEED states. The final-state damping was described via constant eV set to simulate finite inelastic mean free path. The electronic structure and Fermi surface calculations in Figs. 1 and 4 were calculated using FLAPW ELK code Dewhurst . The nonmagnetic and magnetic calculations were performed without spin-orbit coupling.