Majorana Collaboration
Constraints on the decay of 180mTa
Abstract
180mTa is a rare nuclear isomer whose decay has never been observed. Its remarkably long lifetime surpasses the half-lives of all other known and electron capture decays due to the large K-spin differences and small energy differences between the isomeric and lower energy states. Detecting its decay presents a significant experimental challenge but could shed light on neutrino-induced nucleosynthesis mechanisms, the nature of dark matter and K-spin violation. For this study, we repurposed the Majorana Demonstrator, an experimental search for the neutrinoless double-beta decay of 76Ge using an array of high-purity germanium detectors, to search for the decay of 180mTa. More than 17 kilograms, the largest amount of tantalum metal ever used for such a search was installed within the ultra-low background Majorana Demonstrator detector array. In this paper we present results from the first year of Ta data taking and provide an updated limit for the 180mTa half-life on the different decay channels. With new limits up to years, we improved existing limits by one to two orders of magnitude. This result is the most sensitive search for a single and electron capture decay ever achieved.
The 180mTa isomer is unique in two interesting ways: it is the only naturally occurring long-lived isomer, and it is the only known isomer that has not been observed to decay while its ground state has a half-life of only 8.15 hours [1]. This remarkable property can be attributed to a combination of two factors. The large difference in the K-spin which stands for the projection the spin on the symmetry axis; and the small energy differences requiring an E7 or M8-transition between the isomeric and lower lying states [2, 3, 4]. The combination of both result in the isomer being trapped in a metastable excited state. Over the last century numerous attempts were made to measure the decay of 180mTa [5, 6, 7, 8, 9, 10, 11].
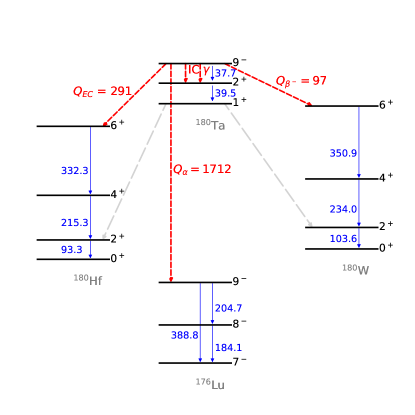
As shown in Fig. 1, 180mTa has several possible decay modes. These include de-excitation to a lower lying state by -ray emission or internal conversion (IC), electron-capture (EC) decay to 180Hf [12], to 180W by decay, and decay to 176Lu. As shown in Tab. 1 the IC mode is expected to be the fastest decay and the -ray emission is expected to be the slowest [13, 14]. While often neglected, the possibility of an decay branch is motivated by a positive Q-value and the observation of decays with -year half-lives in neighboring W isotopes [15]. We follow the common behavior of decays that similar spin and parity in the daughter are preferred, hence a specific state in 176Lu is favored, see Fig. 1. The total decay width of the 180mTa isomer can expressed as:
| (1) |
Here, and are the decay of the isomeric state directly to Hf by EC and decay to W. The decay width and are isomeric transitions to lower lying states of 180Ta via -ray emission or IC. is the decay, and is the decay due to the possible isomeric de-excitation by dark matter (DM) [16]. Each decay mode can be identified by characteristic -rays, cf. Fig. 1. If no decay is found the total width has to be bigger then the smallest half-life limit whereas .
Theoretical techniques [14, 18] have been proposed for estimating the lifetime of deformed nuclei like 180mTa. A measurement of the 180mTa decay rate would test the accuracy of these models, particularly the K-selection rule based on the symmetry of the deformation [14], under the most extreme conditions. In addition, long-lived isomers can be used to constrain DM models by considering the contributions of DM-induced transitions on the decay rate [16]. Finally, the measurement of the 180mTa lifetime could help explain the observed abundance of 180Ta and its role within a nucleosynthesis framework [19, 20, 21, 22].
Despite being an isotope of interest for almost a century, measuring the decay of the metastable isomer is experimentally challenging. The natural isotopic abundance is very small [21] and obtaining sufficient quantities of the isotope is difficult. Additionally, the expected energies of the decay emissions are low while the density and atomic number of tantalum metal are high, which makes it challenging to maintain reasonable detection efficiency while increasing the sample mass due to self shielding. Finally, the decay rate is very slow, making standard radioassay techniques insufficient for detection. To overcome these a larger amount material then ever before was installed into the ultra-low background environment of the Majorana Demonstrator. The purpose of Majorana was to demonstrate the feasibility of using high-purity germanium (HPGe) detectors for a ton-scale neutrinoless double-beta decay search in 76Ge and to explore the low-background experimental techniques required to build such a detector [23, 24]. Located at the 4850-ft level of the Sanford Underground Research Facility (SURF) [25], it consisted of two arrays of HPGe detectors in vacuum cryostats, most of which were enriched in 76Ge. These were arranged within a passive copper, lead, and polyethylene shield as well as an active muon veto. Data taking with the enriched detectors concluded in 2021 [26]. The success of the Demonstrator was enabled by the careful selection and development of ultra low-background components [27], the use of low-noise electronics and data acquisition hardware [28], and excellent energy resolution achieved through a combination of detector design and novel analysis techniques [29, 30]. These features also made the Majorana an ideal platform for investigating the decay of 180mTa. In 2022, following the completion of the neutrinoless double-beta decay search and the removal of the enriched detectors for use in LEGEND-200 [31], the Demonstrator was repurposed to make this measurement.
To implement tantalum in the existing setup, 99.995% pure Ta metal disks were purchased from Goodfellow Corp. [32]. Each disc is 2 mm thick with a mass of approximately 181 g. They were brought underground in January 2022, where they underwent a multi-step cleaning process. The discs were scrubbed with Micro-90 to remove oil and manufacturing dirt, then underwent a light chemical etch using 10% nitric acid, and were finally baked under high vacuum. A total of 17.39 kg of Ta disks were installed within the Demonstrator, resulting in a total 180mTa mass of 2.045 g, assuming a 180mTa natural abundance of 0.0001176(23) [33], which is a combined analysis of several previous measurements [34, 35, 36, 37].
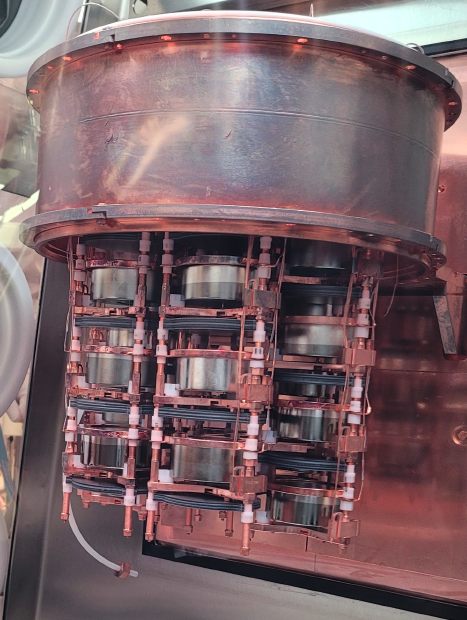
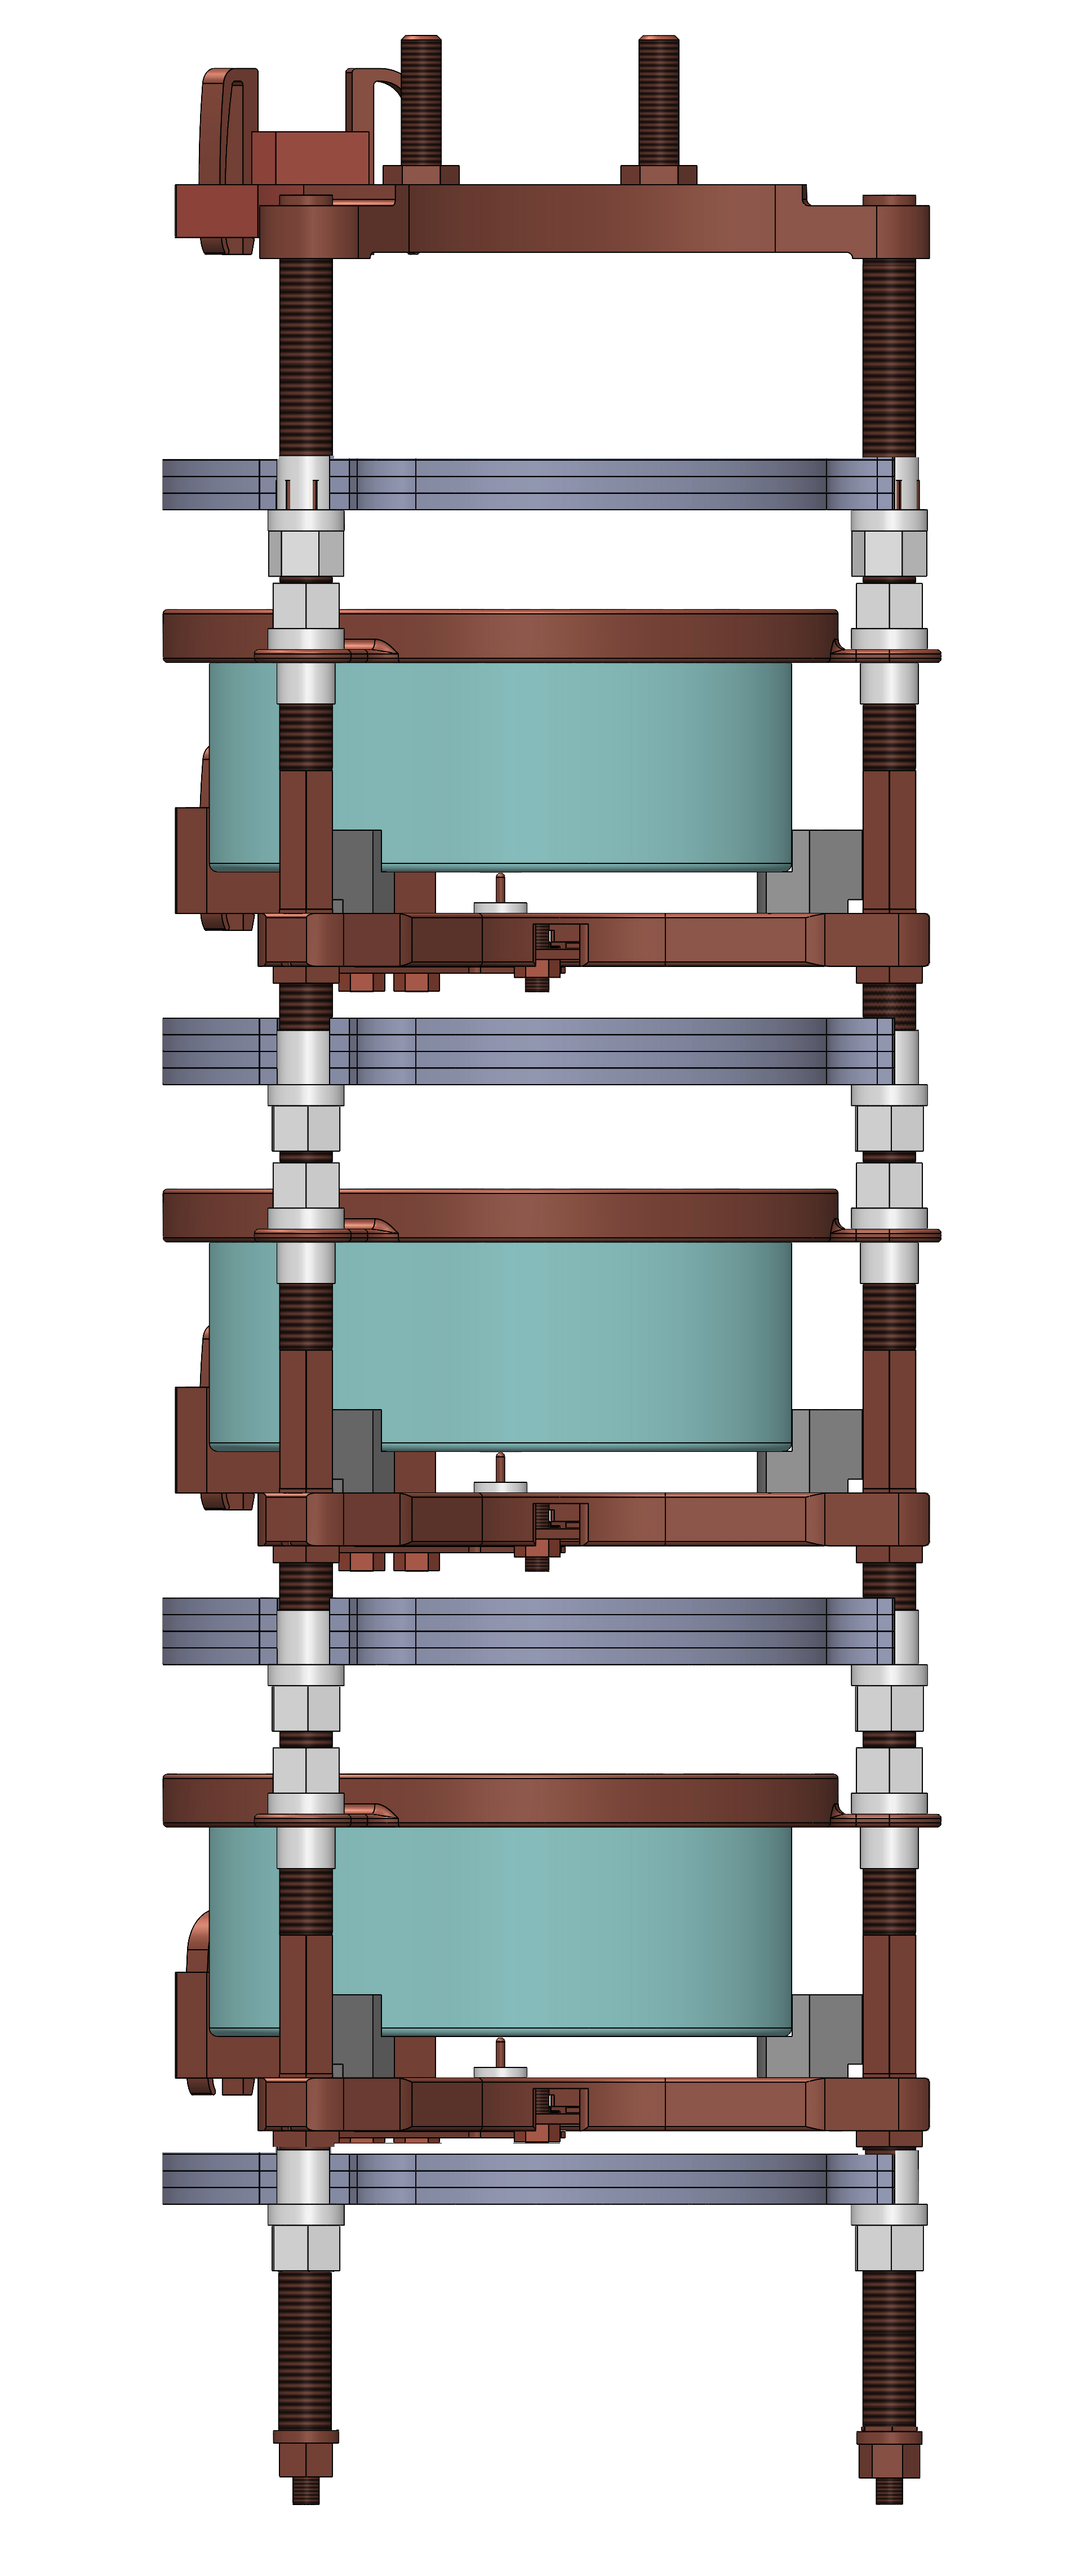
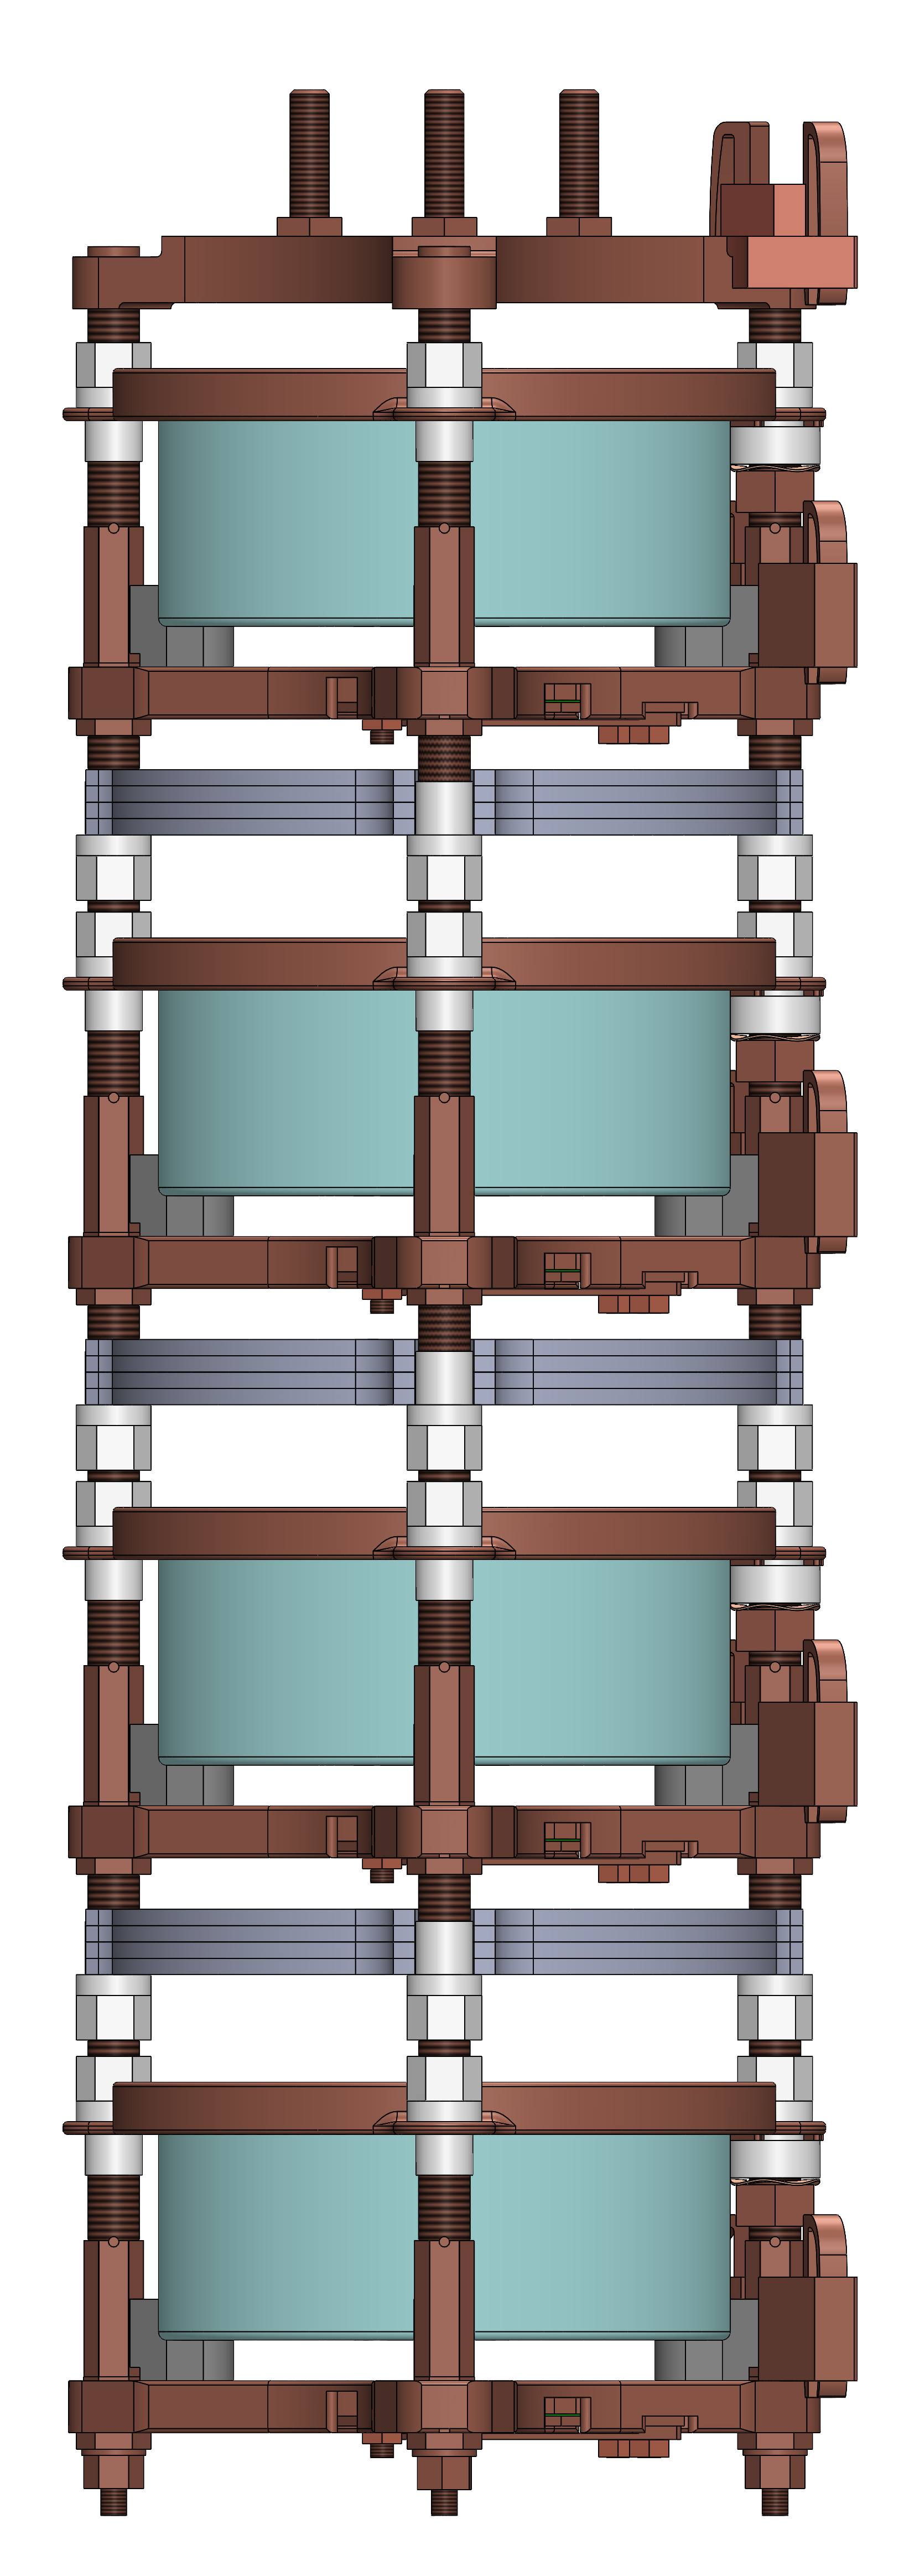
To maximize exposure and detection efficiency while preserving the low-background performance of the Demonstrator, a scheme was developed to re-use previously screened, ultra-high-radiopurity components to hold the Ta samples and interleave them with the 23 remaining natural detectors [38]. A Geant4 [39] simulation was used to determine the optimal positioning of the samples while respecting the weight and geometry constraints of the Demonstrator cryostat. The final arrangement optimizes the thickness of the Ta samples against efficiency for detecting the low energy -rays of interest. Figure 2 shows the final configuration. Detectors in neighboring strings are offset vertically so that each stack of 3 or 4 Ta discs has a line of sight with at least three HPGe detectors.
This paper presents data collected over 348 days between May 2022 and April 2023. Each of the 23 HPGe detectors in the array is read out independently, in a similar fashion to the Majorana Demonstrator experiment. Detector waveforms that exceed approximately 5 keV are digitized with GRETINA digitizers [40, 41] and read-out using the ORCA data acquisition software [42]. Timestamps are synchronized across the data acquisition system and signals from multiple detectors that occur within a 4 s window are grouped. Events coincident with muons that trigger the external veto system are tagged for offline removal. Periods of high noise due to liquid-nitrogen fills are also excluded from the analysis. Throughout the data taking period, a bi-weekly, 4-hour energy calibration was performed with a 228Th line source [43].
The 180mTa data analysis was done using the secondary analysis chain of Majorana Demonstrator, a Radware-based software package [44]. Data from 228Th calibration data was used to set the energy scale for each subsequent two week period. The energy calibration procedure uses many of the tools developed for the Demonstrator, including pole-zero and charge-trapping corrections [30]. To estimate the quality of the energy calibration, the -rays from natural backgrounds (which are not used for calibration), including 182Ta, are fit with one or more Gaussian functions plus a linear background. For the lowest energies, an additional exponential background component is added to reproduce the rise of the spectrum towards lower energies. The fit is conducted over a 20 keV window around the expected signal energy. For each energy, the width of the Gaussian agrees well with the resolution achieved during the neutrinoless double-beta decay search [30, 24, 26]. Three of the twenty-three detectors showed gain drifts following a power outage that occurred midway through data taking, which negatively affected their energy resolution, and these detectors were not used in this analysis.
Following energy calibration, the data are checked for drop-out periods. This is done by measuring the event rate. If no events occur within a detector over a 4-hour window, that entire time period, for all detectors, is excluded from the analysis. Data collected during calibration runs were also removed from the 180mTa data-set, along with two, one-day shutdowns due to power outages at SURF. The array was live for 98.2% of the data taking period as a result of these cuts.
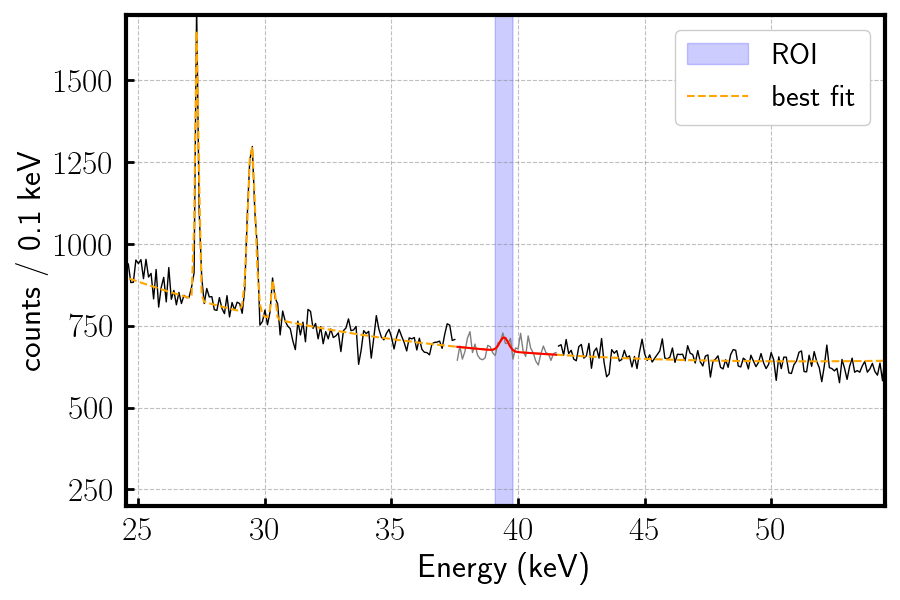
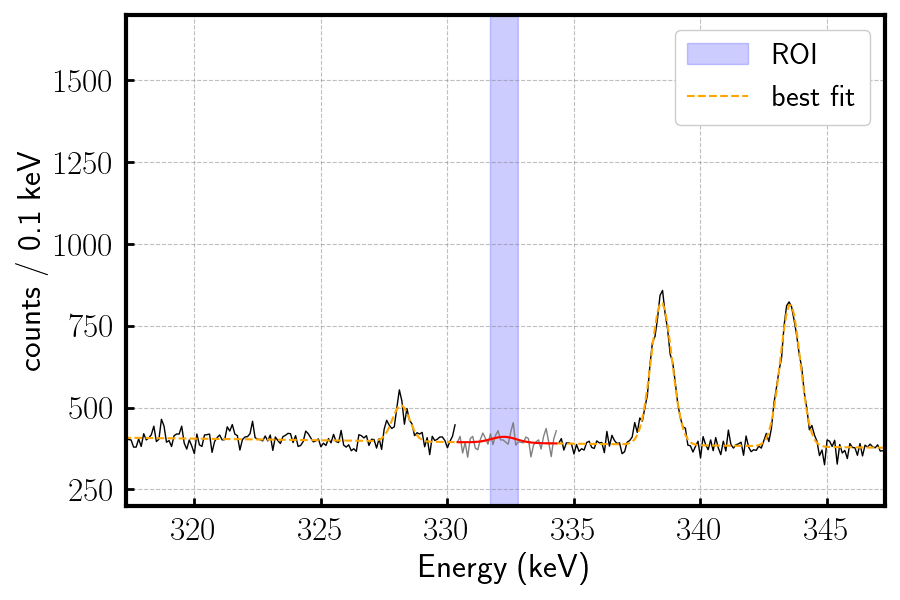
A 10-keV analysis threshold is applied to all data sets, and the data are blinded by removing events that fall within 2 keV of signature -rays. The possible transitions and the associated -rays energies are shown by the blue arrows in Fig. 1: EC to 180Hf -rays are 93.3, 215.3, and 332.2 keV; decay to 180W -rays are 103.6, 234.0, and 350.9 keV; and internal -rays are 37.7 and 39.5 keV [17]. For the IC, only the 39.5 keV transition can be observed. An additional signature of the and IC branches is the observation of a 93.3 or a 103.6-keV -ray from the de-excitation of Hf or W, although the branching ratios to the first excited states of these nuclei is small (25% for Hf and 4% for W).
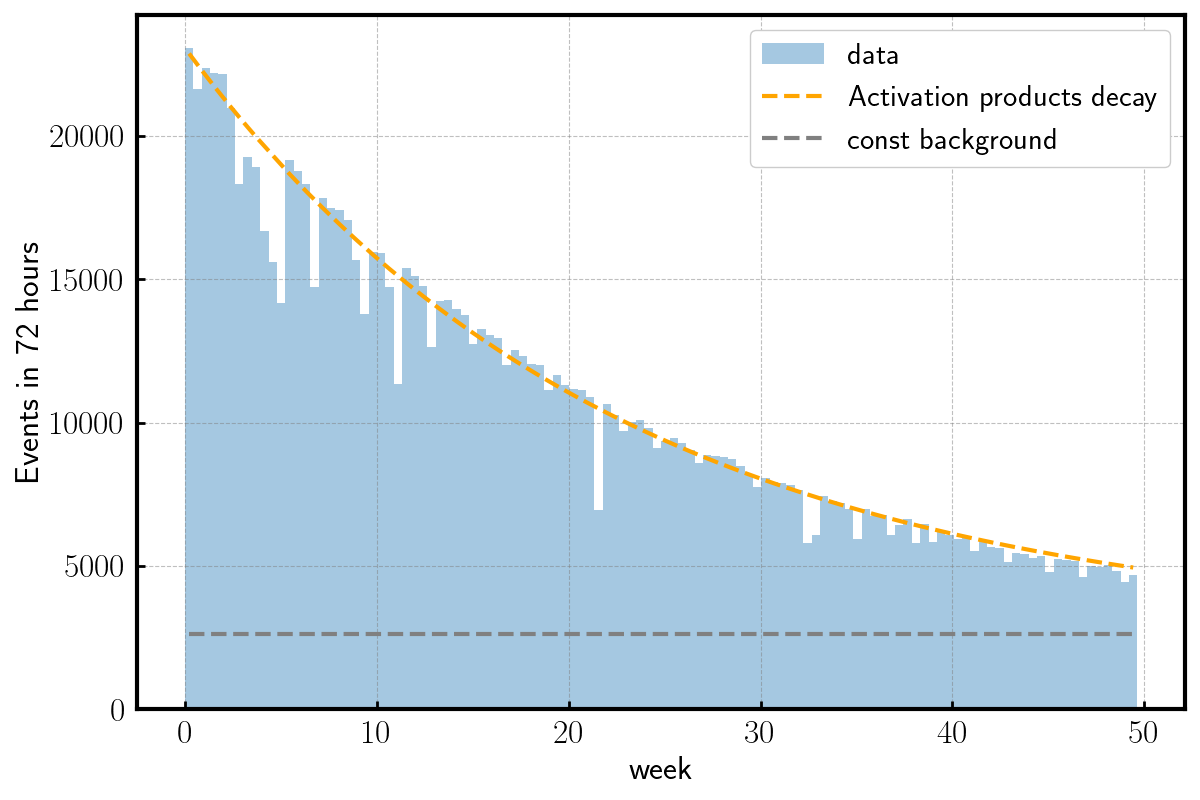
The total event rate of a few Hz observed in the detector array is dominated by signals originating from the Ta samples, see Fig. 3. There is a constant event rate due to long-lived natural radioactivity in the discs and apparatus. From the Demonstrator data we can estimate that in the current configuration only about 10% of the observed constant background comes from the latter, hence the sample disks contain around 0.5(1) mBq 238U per kg Ta and 0.10(2) mBq/kg 232Th. The decrease of the background rate is due to 182Ta and 175Hf, which are the remnants of cosmogenic activation of the Ta samples above ground, with half-lives of 114 and 70.3 days, respectively. Previous studies stored their Ta samples underground for several years before beginning measurements to eliminate these backgrounds [45].
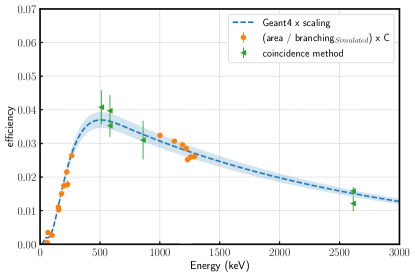
A crucial component of the half-life calculation is the efficiency for detecting the signature -rays emitted during the 180mTa decay. To determine this, a combination of experimental data and Monte Carlo simulation is used. First, a Geant4 simulation was performed in which individual -rays were emitted from uniformly distributed points within the Ta discs. The starting energy of the -rays was varied from 10 keV to 3 MeV in increments of 10 keV, and the efficiency of detecting these -rays in one of the detectors was calculated at each energy. The resulting interpolated efficiency curve is shown in Fig. 4. The simulation assumes the cosmogenic activity is uniform between all of the Ta discs, which is consistent with the observed count rates in each detector.
The shape of the simulated efficiency curve is validated by a comparison with the observed intensities of the -rays from 182Ta decay, after correcting the signal intensities for the known branching ratios (e.g. [46],) and including possible summing of multiple signals in one detector due to the close geometry. The absolute efficiency, or a possible scaling of the predicted curve, is determined using the coincidence method [47, 48]. In this method, one compares the individual intensity of -rays in a cascade with the rate of multi-detector events to obtain the absolute efficiency of an individual detector. The 208Tl decay at the end of the natural 232Th-chain provides cascades that can be used for this analysis. Due to the low rate of 208Tl decays in the Ta discs, this method suffers from low statistics, especially for high multiplicity events, and the uncertainty on the derived efficiencies are large. The Geant4-derived efficiency is normalized to these points using a least-squares fit that results in a scaling of 0.95(6), and the efficiency values from this scaled curve are used in the following analysis.
The 180mTa half-life can be calculated from the following formula:
| (2) |
where represents the counts in the decay channel, is the detection efficiency at the energy for specfic decay mode (shown by the curve in Fig. 4), and is the number of 180mTa atoms, . The live time of the data-taking period, , is 341.5 days.
A likelihood fit is used to extract the 180mTa decay signal strengths from the data. Spectral fits were performed in the regions of interest surrounding each of the characteristic -ray energies. The fits include a Gaussian peak shape for the signal, a linear background, and additional Gaussians at the energies of any known background lines in the region of interest, see e.g. Fig. 5. The literature value for the energy of the -rays and the expected energy resolution are used as initial values in the fit. The energy is allowed to float within keV and the resolution is allowed to float within % from the expected value. The background rate is fit to be about 0.7 (0.5) cts/keV/day averaged over the data-taking period in the 100-keV (300-keV) region and is comparable with previous experiments [10]. The fit of the 93.3-keV and the 350.9-keV 180mTa signals are impacted by nearby background. The excellent energy resolution of the Demonstrator allows a simultaneous fit of multiple contributions from signal and backgrounds at known energies. Hence, all regions can be used but some will have larger uncertainties. Within all of the signal regions of interest, the best fit signal strength is within 2- of a null-result. To calculate , the best fit peak area plus 1.65- (90% C.L.) is used to calculate a limit on the decay rate.
In contrast to previous studies, the large number of detectors in close geometry combined with low background rate means a multiplicity analysis can be done that looks for the coincident -rays expected from some of the 180mTa decay channels. This analysis is competitive with fitting the single detector spectra because the reduction in signal detection efficiency (0.001 - 0.01) is counter-balanced by the improved background suppression ( cts/keV/keV/day), so that the factor is similar to, or higher than, the simple spectral search. A two-dimensional histogram is made for events that contain two coincident energy deposits within the considered signal regions, and a two-dimensional likelihood fit is done assuming the same mean energy and peak resolution as in the one-dimensional fit. The efficiency from Eq. 2 now consists of the simulated detection efficiency for a two-detector event with the corresponding energies from within the cascade, cf. Fig. 1. In this simulation two -rays are started with an angular correlation factor based on multipole momentum and spin of the emitting states [49]. The results from the spectral and two-dimensional fits are shown in Table 1. These results improve upon the best existing limits for each decay channel and combine for a total half-life limit of years. In previous measurements [9, 50, 10], the total half-life is calculated without considering the isomeric transitions. Ref. [50] does search for the isomeric transitions but does not include them in the total half-life calculation. The most recent work [11] includes them, hence, the Majorana Demonstrator result represents an improvement of two orders of magnitude. For the direct decays of the isomeric state, the improvement in efficiency and reduction in background rate due to the coincidence method results in an improvement of about one orders of magnitude. These improvements are of great interest to the predictions on the basis of the K-selection rules [14].
| method | energy | energy | energy | energy | energy | |||||
|---|---|---|---|---|---|---|---|---|---|---|
| (keV) | ( yrs)) | (keV) | ( yrs)) | (keV) | ( yrs)) | (keV) | ( yrs)) | (keV) | ( yrs)) | |
| SF | 93.3 | 1.23(30) | 103.6 | 1.54(17) | 37.7 | 0.63(8) | - | - | 184.1 | 4.80(42) |
| 215.3 | 5.69(55) | 234.0 | 5.76(75) | 39.5 | 0.67(10) | 39.5 | 0.67(10) | 204.7 | 5.58(54) | |
| 332.2 | 10.0(13) | 350.9 | 9.31(114) | 93.3 | 0.29(4) | 93.3 | 0.29(4) | 388.8 | 10.2(12) | |
| 103.6 | 0.07(2) | 103.6 | 0.07(2) | |||||||
| 2D | 93.3+215.3 | 1.88(35) | 103.6+234.0 | 2.65(49) | - | - | - | - | 184.1+204.7 | 11.3(22) |
| 93.3+332.2 | 3.18(56) | 103.6+350.9 | 4.18(78) | - | - | - | - | |||
| 215.3+332.2 | 13.3(22) | 234.0+350.9 | 15.4(27) | - | - | - | - | |||
| Best - this work | 13.3(22) | 15.4(27) | 0.67(10) | 0.67(10) | 11.3(22) | |||||
| previous works | 1.6 [11] | 1.1 [11] | 0.0045 [11] | 0.0045 [11] | - | |||||
| Expected [13, 14, 51, 52] | 1023yrs | 1020yrs | 1031yrs | 1018-19yrs | 1028yrs | |||||
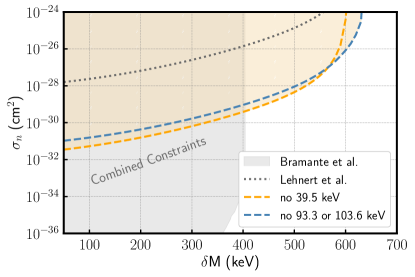
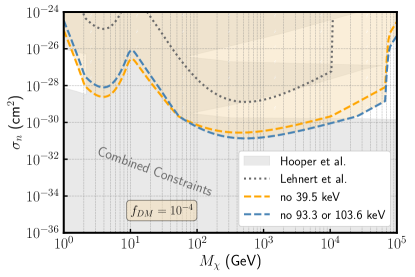
The non-observation of the transition to the ground state decays ( and ) constrains the phase-space of certain classes of DM models that evade traditional underground detection methods [16, 45], cf. Fig 6. Strongly interacting DM, which thermalizes as it passes through the earth, rendering it undetectable via nuclear scattering, would mediate exothermic transitions from the 180mTa state and measurably increase the decay rate of the isomer. Similarly, in inelastic DM models, where ground state DM only interacts inelastically with the Standard Model, and upscatters to an excited state by downscattering 180mTa increasing the measured 180mTa decay rate.
With 341.5 live days of data, we set new limits on the the decay of 180mTa decay that improve upon previous half-lifes by two to three orders of magnitude. We also derive new constraints on strongly interacting and inelastic dark matter. Data-taking with the Demonstrator array will continue into 2024, and as the background rate decreases further to about a quarter of the current average due to the decay of cosmogenics within the Ta samples, sensitivity will continue to improve to levels that are comparable to Ref. [11]. Besides dedicated -searches and some decays, the results presented are the most sensitive search for radioactive decays ever achieved.
Acknowledgements.
We gratefully acknowledge that the research presented in this report was supported by the Laboratory Directed Research and Development program of Los Alamos National Laboratory under project number 20220092ER, which enabled the 180mTa rare decay search. This material is based upon work supported by the U.S. Department of Energy, Office of Science, Office of Nuclear Physics under contract / award numbers DE-AC02-05CH11231, DE-AC05-00OR22725, DE-AC05-76RL0130, DE-FG02-97ER41020, DE-FG02-97ER41033, DE-FG02-97ER41041, DE-SC0012612, DE-SC0014445, DE-SC0018060, DE-SC0022339, and LANLEM77/LANLEM78. We acknowledge support from the Particle Astrophysics Program and Nuclear Physics Program of the National Science Foundation through grant numbers MRI-0923142, PHY-1003399, PHY-1102292, PHY-1206314, PHY-1614611, PHY-1812409, PHY-1812356, PHY-2111140, and PHY-2209530. We gratefully acknowledge the support of the Laboratory Directed Research & Development (LDRD) program at Lawrence Berkeley National Laboratory for this work. We gratefully acknowledge the support of the U.S. Department of Energy through the Los Alamos National Laboratory LDRD Program, the Oak Ridge National Laboratory LDRD Program, and the Pacific Northwest National Laboratory LDRD Program for this work. We gratefully acknowledge the support of the South Dakota Board of Regents Competitive Research Grant. We acknowledge the support of the Natural Sciences and Engineering Research Council of Canada, funding reference number SAPIN-2017-00023, and from the Canada Foundation for Innovation John R. Evans Leaders Fund. We acknowledge support from the 2020/2021 L’Oréal-UNESCO for Women in Science Programme. This research used resources provided by the Oak Ridge Leadership Computing Facility at Oak Ridge National Laboratory and by the National Energy Research Scientific Computing Center, a U.S. Department of Energy Office of Science User Facility. We thank our hosts and colleagues at the Sanford Underground Research Facility for their support.References
- Gallagher et al. [1962] C. Gallagher, M. Jørgensen, and O. Skilbreid, A measurement of and ec branching ratios in the decay of 8.15-h ta180 and a search for the decay of hf180m, Nuclear Physics 33, 285 (1962).
- Walker and Dracoulis [1999] P. Walker and G. Dracoulis, Energy traps in atomic nuclei, Nature 399, 35 (1999).
- Walker et al. [2001] P. Walker, G. Dracoulis, and J. Carroll, Interpretation of the excitation and decay of through a band, Phys. Rev. C 64, 061302 (2001).
- Bissell et al. [2006] M. L. Bissell et al., Model independent determination of the spin of the Ta-180 naturally occurring isomer, Phys. Rev. C 74, 047301 (2006).
- Bauminger and Cohen [1958] E. R. Bauminger and S. G. Cohen, Natural radioactivity of and , Phys. Rev. 110, 953 (1958).
- Ryves [1980] T. B. Ryves, The decay scheme of 180mta, Journal of Physics G: Nuclear Physics 6, 763 (1980).
- Cumming and Alburger [1985] J. B. Cumming and D. E. Alburger, Search for the decay of Tam180, Phys. Rev. C 31, 1494 (1985).
- Wakasugi et al. [1994] M. Wakasugi, W. G. Jin, T. T. Inamura, T. Murayama, T. Wakui, H. Katsuragawa, T. Ariga, T. Ishizuka, and I. Sugai, Precision measurement of the hyperfine structure and nuclear moments of by laser-rf double resonance, Phys. Rev. A 50, 4639 (1994).
- Hult et al. [2006] M. Hult, J. Gasparro, G. Marissens, P. Lindahl, U. Watjen, P. N. Johnston, C. Wagemans, and M. Kohler, Underground search for the decay of Ta180m, Phys. Rev. C 74, 054311 (2006).
- Lehnert et al. [2017] B. Lehnert, M. Hult, G. Lutter, and K. Zuber, Search for the decay of nature’s rarest isotope 180mTa, Phys. Rev. C 95, 044306 (2017), arXiv:1609.03725 [nucl-ex] .
- Cerroni et al. [2023] R. Cerroni et al., Deep-underground search for the decay of 180m-ta with an ultra-low-background hpge detector (2023), arXiv:2305.17238 .
- Wilkinson and Hicks [1949] G. Wilkinson and H. G. Hicks, , a new radioactive isotope of hafnium, Phys. Rev. 75, 696 (1949).
- Auerbach and Zelevinsky [2017] N. Auerbach and V. Zelevinsky, The curious case of tantalum 180, AIP Conference Proceedings 1912, 020002 (2017).
- Ejiri and Shima [2017] H. Ejiri and T. Shima, K-hindered beta and gamma transition rates in deformed nuclei and the halflife of 180Tam, J. Phys. G 44, 065101 (2017).
- Cozzini et al. [2004] C. Cozzini et al., Detection of the natural alpha decay of tungsten, Phys. Rev. C 70, 064606 (2004), arXiv:nucl-ex/0408006 .
- Pospelov et al. [2020] M. Pospelov, S. Rajendran, and H. Ramani, Metastable nuclear isomers as dark matter accelerators, Phys. Rev. D 101, 055001 (2020).
- McCutchan [2015] E. McCutchan, Nuclear data sheets for a = 180, Nuclear Data Sheets 126, 151 (2015).
- Ejiri et al. [2019] H. Ejiri, J. Suhonen, and K. Zuber, Neutrino–nuclear responses for astro-neutrinos, single beta decays and double beta decays, Phys. Rept. 797, 1 (2019).
- Mohr et al. [2007] P. Mohr, F. Kaeppeler, and R. Gallino, Survival of Nature’s Rarest Isotope 180Ta under Stellar Conditions, Phys. Rev. C 75, 012802 (2007), arXiv:astro-ph/0612427 .
- Hayakawa et al. [2010] T. Hayakawa, P. Mohr, T. Kajino, S. Chiba, and G. Mathews, Reanalysis of the () state at kev in and its role in the -process nucleosynthesis of in supernovae, Phys. Rev. C 82, 058801 (2010).
- Baccolo [2015] G. Baccolo, Tantalizing tantalum, Nature Chemistry 7, 854 (2015).
- Malatji et al. [2019] K. Malatji, M. Wiedeking, S. Goriely, C. Brits, B. Kheswa, F. Bello Garrote, D. Bleuel, F. Giacoppo, A. Görgen, M. Guttormsen, K. Hadynska-Klek, T. Hagen, V. Ingeberg, M. Klintefjord, A. Larsen, P. Papka, T. Renstrøm, E. Sahin, S. Siem, L. Siess, G. Tveten, and F. Zeiser, Re-estimation of 180ta nucleosynthesis in light of newly constrained reaction rates, Physics Letters B 791, 403 (2019).
- Abgrall et al. [2014] N. Abgrall et al. (Majorana), The Majorana Demonstrator Neutrinoless Double-Beta Decay Experiment, Adv. High Energy Phys. 2014, 365432 (2014), arXiv:1308.1633 [physics.ins-det] .
- Alvis et al. [2019] S. I. Alvis et al. (Majorana), A Search for Neutrinoless Double-Beta Decay in 76Ge with 26 kg-yr of Exposure from the Majorana Demonstrator, Phys. Rev. C 100, 025501 (2019), arXiv:1902.02299 [nucl-ex] .
- Heise [2015] J. Heise, The sanford underground research facility at homestake, Journal of Physics: Conference Series 606, 012015 (2015).
- Arnquist et al. [2023a] I. J. Arnquist et al. (Majorana), Final Result of the Majorana Demonstrator’s Search for Neutrinoless Double- Decay in Ge76, Phys. Rev. Lett. 130, 062501 (2023a), arXiv:2207.07638 [nucl-ex] .
- Abgrall et al. [2016] N. Abgrall et al., The Majorana Demonstrator radioassay program, Nucl. Instrum. Meth. A 828, 22 (2016), arXiv:1601.03779 [physics.ins-det] .
- Abgrall et al. [2022] N. Abgrall et al. (Majorana), The Majorana Demonstrator readout electronics system, JINST 17 (05), T05003, arXiv:2111.09351 [physics.ins-det] .
- Abgrall et al. [2021] N. Abgrall et al., Adc nonlinearity correction for the majorana demonstrator, IEEE Transactions on Nuclear Science 68, 359 (2021).
- Arnquist et al. [2023b] I. J. Arnquist et al. (Majorana Collaboration), Charge trapping correction and energy performance of the Majorana Demonstrator, Phys. Rev. C 107, 045503 (2023b).
- Abgrall et al. [2017a] N. Abgrall et al., The large enriched germanium experiment for neutrinoless double beta decay (LEGEND), AIP Conference Proceedings 1894, 10.1063/1.5007652 (2017a), 020027, https://pubs.aip.org/aip/acp/article-pdf/doi/10.1063/1.5007652/14142902/020027_1_online.pdf .
- [32] Goodfellow corporation.
- Pub [2023] Pubchem element summary for atomic number 73, tantalum (2023).
- Holden [1980] N. Holden, Atomic weights of the elements 1979, Pure and Applied Chemistry 52, 2349 (1980).
- Berglund and Wieser [2011] M. Berglund and M. E. Wieser, Isotopic compositions of the elements 2009 (iupac technical report), Pure and Applied Chemistry 83, 397 (2011).
- Pfeifer et al. [2017] M. Pfeifer, N. S. Lloyd, S. T. M. Peters, F. Wombacher, B.-M. Elfers, T. Schulz, and C. Münker, Tantalum isotope ratio measurements and isotope abundances determined by mc-icp-ms using amplifiers equipped with 1010, 1012 and 1013 ohm resistors, J. Anal. At. Spectrom. 32, 130 (2017).
- de Laeter and Bukilic [2005] J. R. de Laeter and N. Bukilic, Isotope abundance of 180Ta and p-process nucleosynthesis, Phys. Rev. C 72, 025801 (2005).
- [38] Canberra industries inc. (now mirion technologies).
- Agostinelli et al. [2003] S. Agostinelli et al. (GEANT4), GEANT4–a simulation toolkit, Nucl. Instrum. Meth. A 506, 250 (2003).
- Doering et al. [2008] D. Doering, J. Joseph, H. Yaver, and S. Zimmermann, GRETINA Digitizer Specification, Tech. Rep. GRT-3-060815-0 (Gamma Ray Energy Tracking In-Beam Nuclear Array, Nuclear Science Division, Lawrence Berkeley National Laboratory, Berkeley, CA 94720, USA., 2008).
- Anderson et al. [2009] J. Anderson, R. Brito, D. Doering, T. Hayden, B. Holmes, J. Joseph, H. Yaver, and S. Zimmermann, Data acquisition and trigger system of the gamma ray energy tracking in-beam nuclear array (gretina), IEEE Transactions on Nuclear Science 56, 258 (2009).
- Howe et al. [2004] M. A. Howe, G. A. Cox, P. J. Harvey, F. McGirt, K. Rielage, J. F. Wilkerson, and J. M. Wouters, Sudbury neutrino observatory neutral current detector acquisition software overview, IEEE Transactions on Nuclear Science 51, 878 (2004).
- Abgrall et al. [2017b] N. Abgrall et al., The Majorana Demonstrator calibration system, Nucl. Instrum. Meth. A 872, 16 (2017b), arXiv:1702.02466 [physics.ins-det] .
- [44] Radware/ornl analysis codes for Majorana Demonstrator (mjd) data analysis and hpge detector characterization.
- Lehnert et al. [2020] B. Lehnert, H. Ramani, M. Hult, G. Lutter, M. Pospelov, S. Rajendran, and K. Zuber, Search for Dark Matter Induced Deexcitation of 180Tam, Phys. Rev. Lett. 124, 181802 (2020), arXiv:1911.07865 [astro-ph.CO] .
- Singh [2015] B. Singh, Nuclear data sheets for a = 182, Nuclear Data Sheets 130, 21 (2015).
- Golovko [2022] V. V. Golovko, Simplified efficiency calibration methods for semiconductor detectors used in criticality dosimetry, Appl. Radiat. Isot. 187, 110335 (2022), arXiv:2206.09749 [physics.ins-det] .
- Hlavac [1999] S. Hlavac, Coincidence method for semiconductor detector calibration, Tech. Rep. (International Atomic Energy Agency (IAEA), 1999) iNDC(NDS)–403.
- Bohr and Mottelson [1969] A. Bohr and B. Mottelson, Nuclear Structure, Vol. 1 (W.A. Benjamin, New York / Amsterdam, 1969).
- Hult et al. [2009] M. Hult, J. E. Wieslander, G. Marissens, J. Gasparro, U. Watjen, and M. Misiaszek, Search for the radioactivity of 180mta using an underground hpge sandwich spectrometer, Applied Radiation and Isotopes 67, 918 (2009).
- Royer [2010] G. Royer, Analytic expressions for alpha-decay half-lives and potential barriers, Nuclear Physics A 848, 279 (2010).
- Fényes and Bődy [1964] T. Fényes and Z. Bődy, Expected -decay data of the rare earth nuclides on the basis of different systematics, Acta Physica Academiae Scientiarum Hungaricae 16, 299 (1964).
- Hooper and McDermott [2018] D. Hooper and S. D. McDermott, Robust constraints and novel gamma-ray signatures of dark matter that interacts strongly with nucleons, Phys. Rev. D 97, 115006 (2018).
- Bramante et al. [2016] J. Bramante, P. J. Fox, G. D. Kribs, and A. Martin, Inelastic frontier: Discovering dark matter at high recoil energy, Phys. Rev. D 94, 115026 (2016).