NLPositionality:
Characterizing Design Biases of Datasets and Models
Abstract
Design biases in NLP systems, such as performance differences for different populations, often stem from their creator’s positionality, i.e., views and lived experiences shaped by identity and background. Despite the prevalence and risks of design biases, they are hard to quantify because researcher, system, and dataset positionality is often unobserved. We introduce NLPositionality, a framework for characterizing design biases and quantifying the positionality of NLP datasets and models. Our framework continuously collects annotations from a diverse pool of volunteer participants on LabintheWild, and statistically quantifies alignment with dataset labels and model predictions. We apply NLPositionality to existing datasets and models for two tasks—social acceptability and hate speech detection. To date, we have collected annotations in over a year for instances from annotators across countries. We find that datasets and models align predominantly with Western, White, college-educated, and younger populations. Additionally, certain groups, such as non-binary people and non-native English speakers, are further marginalized by datasets and models as they rank least in alignment across all tasks. Finally, we draw from prior literature to discuss how researchers can examine their own positionality and that of their datasets and models, opening the door for more inclusive NLP systems. ††footnotetext: * Equal contribution; work done while at the Allen Institute for AI
1 Introduction
“Treating different things the same can generate as much inequality as treating the same things differently.”
– Kimberlé Crenshaw
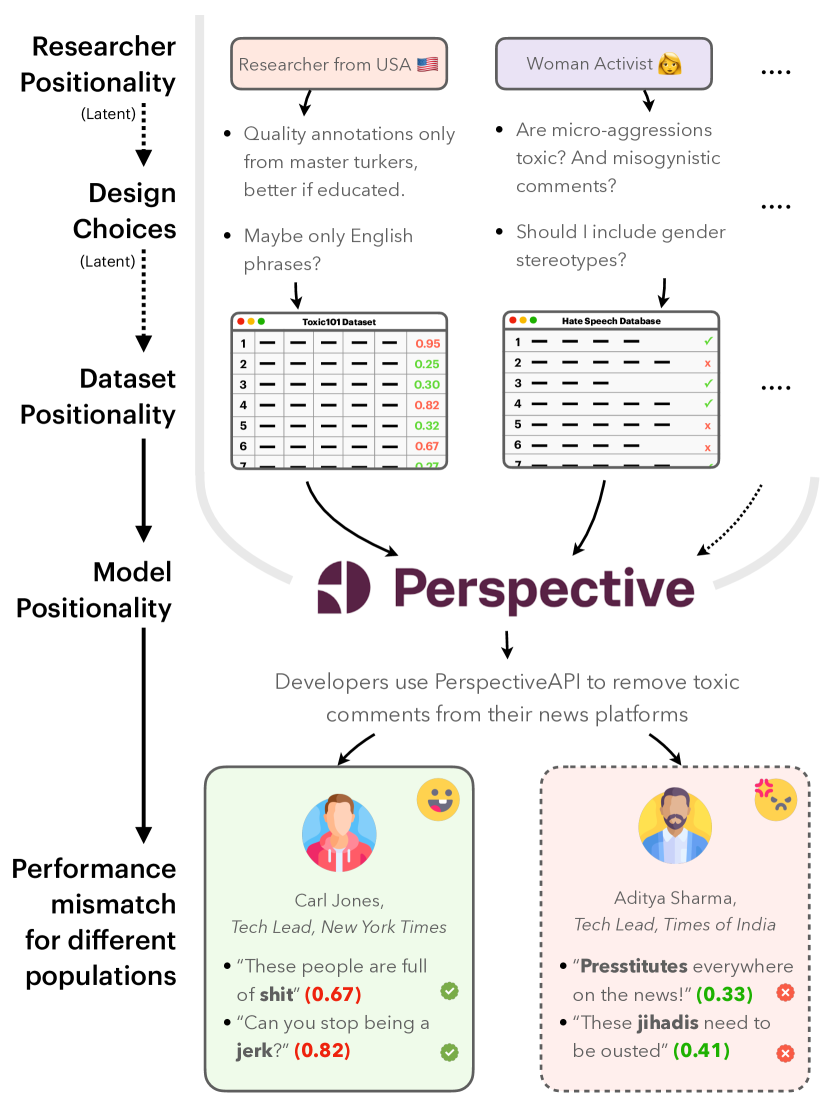
When creating NLP datasets and models, researchers’ design choices are partly influenced by their positionality, i.e., their views shaped by their lived experience, identity, culture, and background Savin-Baden and Howell-Major (2013). While researcher positionality is commonly discussed outside of NLP, it is highly applicable to NLP research but remains largely overlooked. For example, a U.S.-born English-speaking researcher building a toxicity detection system will likely start with U.S.-centric English statements to annotate for toxicity. This can cause the tool to work poorly for other populations (e.g., not detect offensive terms like “presstitute” in Indian contexts; see Figure 1).
Such design biases in the creation of datasets and models, i.e., disparities in how well datasets and models work for different populations, stem from factors including latent design choices and the researcher’s positionality. However, they can perpetuate systemic inequalities by imposing one group’s standards onto the rest of the world Ghosh et al. (2021); Gururangan et al. (2022); Blasi et al. (2022). The challenge is that design biases arise from the myriad of design choices made; in the context of creating datasets and models, only some of these choices may be documented (e.g., through model cards and data sheets; Bender and Friedman, 2018; Mitchell et al., 2019; Gebru et al., 2021). Further, many popular deployed models are hidden behind APIs, and thus design biases can only be characterized indirectly (e.g., by observing model behavior).
We introduce NLPositionality, a framework for characterizing design biases and positionality of NLP datasets and models. For a given dataset and task, we obtain a wide set of new annotations for a data sample, from a diverse pool of volunteers from various countries and of different backgrounds (recruited through LabintheWild; Reinecke and Gajos, 2015). We then quantify design biases by comparing which identities and backgrounds have higher agreement with the original dataset labels or model predictions. NLPositionality offers three advantages over other approaches (e.g., paid crowdsourcing or laboratory studies). First, the demographic diversity of participants on LabintheWild is better than on other crowdsourcing platforms Reinecke and Gajos (2015) and in traditional laboratory studies. Second, the compensation and incentives in our approach rely on a participant’s motivation to learn about themselves instead of monetary compensation. This has been shown to result in higher data quality compared to using paid crowdsourcing platforms August and Reinecke (2019), as well as in opportunities for participant learning Oliveira et al. (2017). This allows our framework to continuously collect new annotations and reflect more up-to-date measurements of design biases for free over long periods of time, compared to one-time paid studies such as in previous works Sap et al. (2022); Davani et al. (2022).111To view the most up-to-date results, visit the project page (nlpositionality.cs.washington.edu) or Github repository (github.com/liang-jenny/nlpositionality). Finally, our approach is dataset- and model-agnostic and can be applied post-hoc to any dataset or model using only instances and their labels or predictions.
We apply NLPositionality to two case studies of NLP tasks—social acceptability and hate speech detection—which are known to exhibit design biases Talat et al. (2022); Sap et al. (2022); Ghosh et al. (2021). We examine datasets and supervised models related to these tasks as well as general-purpose large language models (i.e., GPT-4). As of May 25 2023, a total of annotations were collected from annotators from countries, with an average of annotations per day. We discover that the datasets and models we investigate are most aligned with White and educated young people from English-speaking countries, which are a subset of “WEIRD” (Western, Educated, Industrialized, Rich, Democratic; Henrich et al., 2010) populations. We also see that datasets exhibit close alignment with their original annotators, emphasizing the importance of gathering data and annotations from diverse groups.
Our paper highlights the importance of considering design biases in NLP. Our findings showcase the usefulness of our framework in quantifying dataset and model positionality. In a discussion of the implications of our results, we consider how positionality may manifest in other NLP tasks.
2 Dataset & Model Positionality: Definitions and Background
A person’s positionality is the perspectives they hold as a result of their demographics, identity, and life experiences Holmes (2020); Savin-Baden and Howell-Major (2013). For researchers, positionality “reflects the position that [they have] chosen to adopt within a given research study” Savin-Baden and Howell-Major (2013). It influences the research process and its outcomes and results Rowe (2014). Some aspects of positionality, such as gender, race, skin color, and nationality, are culturally ascribed and part of one’s identity. Others, such as political views and life history, are more subjective Holmes (2020); Foote and Gau Bartell (2011).
Dataset and Model Positionality
While positionality is often attributed to a person, in this work, we focus on dataset and model positionality. Cambo and Gergle (2022) introduced model positionality, defining it as “the social and cultural position of a model with regard to the stakeholders with which it interfaces.” We extend this definition to add that datasets also encode positionality, in a similar way as models. This results in perspectives embedded within language technologies, making them less inclusive towards certain populations.

Design Biases
In NLP, design biases occur when a researcher or practitioner makes design choices—often based on their positionality—that cause models and datasets to systematically work better for some populations over others. Curating datasets involves design choices such as what source to use, what language to use, what perspectives to include or exclude, or who to get annotations from. For example, a researcher’s native language may influence them to create datasets in that language due to their familiarity with the domain (as in the example in Figure 1). When training models, these choices include the type of training data, data pre-processing techniques, or the objective function Hall et al. (2022). For example, a researcher’s institutional affiliation may influence the training datasets they select (e.g., choosing a dataset made by a coworker). Since the latent choices that result in design biases are fundamental to research itself, some researchers have argued that it is impossible to completely de-bias datasets and models Waseem et al. (2021).
Current discussions around bias in NLP often focus on ones that originate from social biases embedded within the data. In comparison, design biases originate from the developer who makes assumptions. Based on Friedman and Nissenbaum (1996)’s framework on bias, social biases are pre-existing biases in society, whereas design biases are emergent biases that originate from the computing system itself. ‘Gender bias’ in computing systems means that the system does not perform well for some genders; “man is to doctor as woman is to nurse” Bolukbasi et al. (2016) is a social bias, while captioning systems that fail to understand women’s voices Tatman (2017) is a design bias.
One prominent example of design bias in NLP is the overt emphasis on English Joshi et al. (2020); Blasi et al. (2022). Others include the use of block lists in dataset creation or toxicity classifiers as a filter, which can marginalize minority voices Dodge et al. (2021); Xu et al. (2021). In this work, we extend the discussion of design biases from prior work into NLP, discuss it in relation to researcher positionality, and show its effects on datasets and models.
3 NLPositionality: Quantifying Dataset and Model Positionality
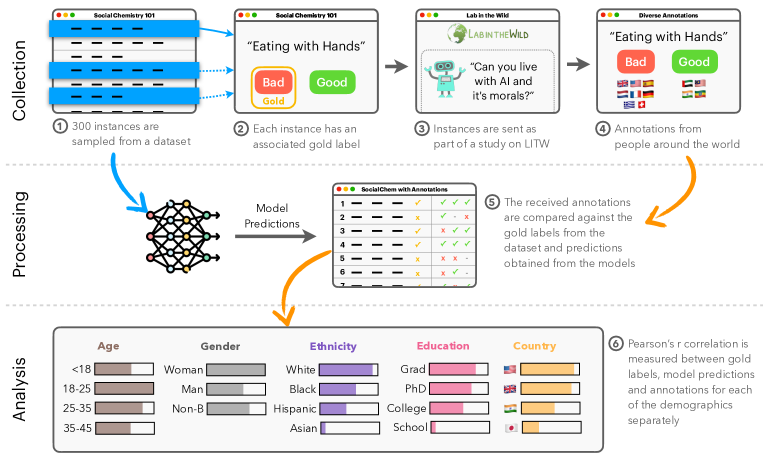
Our NLPositionality framework follows a two-step process for characterizing the design biases and positionality of datasets and models. First, a subset of data for a task is re-annotated by annotators from around the world to obtain globally representative data in order to quantify positionality (§3.1). We specifically rely on re-annotation to capture self-reported demographic data of annotators with each label. Then, the positionality of the dataset or model is computed by comparing the responses of the dataset or model with different demographic groups for identical instances (§3.2). While relying on demographics as a proxy for positionality is limited (see discussion in §7), we use demographic information for an initial exploration in uncovering design biases in datasets and models.
3.1 Collecting Diverse Annotations
Cost-effectively collecting annotations from a diverse crowd at scale is challenging. Popular crowdsourcing platforms like Amazon Mechanical Turk (MTurk) are not culturally diverse, as a majority of workers are from the United States and India Difallah et al. (2018); Ipeirotis (2010). Further, MTurk does not easily support continuous and longitudinal data collection. To address these challenges, we use LabintheWild Reinecke and Gajos (2015), which hosts web-based online experiments. Compared to traditional laboratory settings, it has more diverse participants and collects equally high-quality data for free August and Reinecke (2019); Oliveira et al. (2017); instead of monetary compensation, participants typically partake in LabintheWild experiments because they learn something about themselves. Thus, we motivate people to participate in our IRB-approved study (§8) by enabling them to learn how their responses on a given task (e.g., judging hate speech) compare to a judgment by AI systems as well as by others who are demographically similar to them (see Appendix 4).
For a given task, we choose a dataset to be annotated. To select instances for re-annotation, we filter the dataset based on relevant information that could indicate subjectivity (such as controversiality label for the social acceptability dataset), and then sample diverse instances by stratified sampling across different dataset metadata, (such as the targeted groups of toxic speech label for the hate speech dataset) (see Appendix A.1). These instances are then hosted as an experiment on LabintheWild to be annotated by a diverse crowd, where participants report their demographics. To ensure consistency in the re-annotated data, the instructions and annotation setups are similar to the original tasks’. Figure 2 is an example from the Social Chemistry dataset and its annotations.
3.2 Quantifying Positionality
We use correlation as a quantitative construct for positionality. First, we group the annotations by specific demographics. When datasets contain multiple annotations from the same demographic for the same instance, we take the mean of the labels from annotators of that demographic to obtain an aggregated score (see Table 3.2). Next, for each demographic, we compute Pearson’s using the demographic’s aggregated score for each instance and correlated it to the dataset label or model prediction222We use models’ output probability scores for supervised models and categorical labels for GPT-4.. We then apply the Bonferroni correction to account for multiple hypotheses testing Wickens and Keppel (2004). We rank the correlations to reveal which demographic groups best align with the positionality of datasets and models. Finally, we report the total number of annotators and inter-annotator agreements for each demographic using Krippendorff’s Krippendorff (2006).
| Instance | Demographic | Label | Score | ||
|---|---|---|---|---|---|
| Social Acceptability | Telling a woman what to do. |
Man
Non-binary Woman |
It’s okay
It’s okay It’s bad |
|
|
| \cdashline2-6[1.5pt/3pt] | Questioning your sexual orientation. |
10-20 years old
20-30 years old 30-40, 40-50 years old |
It’s good
It’s okay It’s okay |
|
|
| \cdashline2-6[1.5pt/3pt] | Going to church to practice your religion. |
Christian
Buddhist None |
It’s good
It’s okay It’s okay |
|
|
| Hate Speech | Justice for yellow man lol |
Asian, Black, Latino/Latina
White |
Hate speech
Not sure |
|
|
| \cdashline2-6[1.5pt/3pt] | Iran’s Supreme Court claims gender equality is ‘Zionist plot’ aiming to corrupt role of women in society. I fucking second that! |
Christian
Jewish Muslim |
Not sure
Hate speech Not hate speech |
|
|
| \cdashline2-6[1.5pt/3pt] | Literally anyone can be a shitty person, LGBT people especially! |
College, Graduate school
Pre-high school |
Hate speech
Not hate speech |
|
|
4 Case Studies
| DATASETS: |
||||||||||||
| Demographic | Pearson’s | |||||||||||
| Social Acceptability | Toxicity & Hate Speech | |||||||||||
| # |
|
|
|
# |
|
|
|
|
|
|||
| Country (Lived Longest) | ||||||||||||
| African Islamic | 316 | 0.20 | 0.54* | 0.49 | 0.47 | 234 | 0.22 | 0.39 | 0.29 | 0.39 | 0.27 | 0.25 |
| Baltic | 140 | 0.41 | 0.73* | 0.72* | 0.71* | 54 | 0.50 | 0.38 | -0.08 | 0.20 | 0.05 | 0.46 |
| Catholic Europe | 452 | 0.28 | 0.64* | 0.59* | 0.68* | 183 | 0.41 | 0.32 | 0.12 | 0.32 | 0.21 | 0.21 |
| Confucian | 528 | 0.42 | 0.75* | 0.58* | 0.74* | 154 | 0.24 | 0.47 | 0.28 | 0.51* | 0.12 | 0.52* |
| English-Speaking | 8289 | 0.51 | 0.76* | 0.61* | 0.74* | 4025 | 0.40 | 0.70* | 0.33* | 0.58* | 0.37* | 0.41* |
| Latin American | 281 | 0.33 | 0.45 | 0.41 | 0.47 | 65 | 0.20 | 0.39 | 0.10 | 0.28 | 0.09 | 0.17 |
| Orthodox Europe | 426 | 0.39 | 0.56* | 0.58* | 0.67* | 139 | 0.32 | 0.36 | 0.18 | 0.47 | 0.15 | 0.13 |
| Protestant Europe | 706 | 0.48 | 0.65* | 0.57* | 0.67* | 387 | 0.37 | 0.40* | 0.32 | 0.23 | 0.29 | 0.34 |
| West South Asia | 413 | 0.40 | 0.63* | 0.60* | 0.59* | 116 | 0.21 | 0.34 | 0.20 | 0.33 | 0.30 | 0.21 |
| Education Level | ||||||||||||
| College | 4489 | 0.48 | 0.74* | 0.66* | 0.69* | 2383 | 0.39 | 0.66* | 0.34* | 0.56* | 0.38* | 0.39* |
| Graduate School | 1116 | 0.53 | 0.72* | 0.54* | 0.69* | 604 | 0.36 | 0.59* | 0.28* | 0.51* | 0.25 | 0.38* |
| High School | 2183 | 0.49 | 0.67* | 0.54* | 0.64* | 908 | 0.41 | 0.60* | 0.25 | 0.49* | 0.30* | 0.37* |
| PhD | 709 | 0.46 | 0.65* | 0.55* | 0.61* | 359 | 0.45 | 0.48* | 0.19 | 0.43* | 0.26 | 0.31 |
| Pre-High School | 406 | 0.40 | 0.56* | 0.46* | 0.59* | 116 | 0.26 | 0.37 | 0.24 | 0.45* | 0.25 | 0.38 |
| Professional School | 460 | 0.40 | 0.53* | 0.46* | 0.49* | 195 | 0.09 | 0.61* | 0.10 | 0.35 | 0.09 | 0.19 |
| Ethnicity | ||||||||||||
| Asian, Asian American | 1160 | 0.55 | 0.66* | 0.55* | 0.63* | 644 | 0.45 | 0.57* | 0.35* | 0.47* | 0.33* | 0.39* |
| Black, African American | 465 | 0.52 | 0.61* | 0.50* | 0.57* | 287 | 0.34 | 0.56* | 0.32 | 0.36* | 0.31 | 0.37* |
| Latino / Latina, Hispanic | 314 | 0.57 | 0.62* | 0.52* | 0.54* | 239 | 0.36 | 0.43* | 0.39* | 0.46* | 0.31 | 0.31 |
| Native American, Alaskan Native | 103 | 0.64 | 0.59* | 0.52* | 0.64* | 65 | — | 0.23 | 0.31 | 0.31 | 0.32 | 0.33 |
| Pacific Islander, Native Australian | 38 | 0 | 0.65* | 0.63 | 0.62 | 27 | — | 0.36 | 0.65 | 0.54 | 0.64 | 0.57 |
| White | 3102 | 0.55 | 0.73* | 0.61* | 0.70* | 1831 | 0.44 | 0.69* | 0.29* | 0.56* | 0.32* | 0.38* |
| Gender | ||||||||||||
| Man | 4082 | 0.45 | 0.73* | 0.63* | 0.69* | 1798 | 0.37 | 0.65* | 0.34* | 0.56* | 0.34* | 0.36* |
| Non-Binary | 858 | 0.41 | 0.60* | 0.51* | 0.55* | 329 | 0.48 | 0.57* | 0.21 | 0.37* | 0.27 | 0.31* |
| Woman | 4368 | 0.55 | 0.74* | 0.60* | 0.73* | 2357 | 0.39 | 0.63* | 0.34* | 0.53* | 0.38* | 0.37* |
| Native Language | ||||||||||||
| English | 7338 | 0.51 | 0.76* | 0.64* | 0.71* | 3622 | 0.40 | 0.70* | 0.33* | 0.60* | 0.39* | 0.42* |
| Not English | 2157 | 0.40 | 0.62* | 0.54* | 0.64* | 1020 | 0.27 | 0.46* | 0.32* | 0.39* | 0.32* | 0.36* |
| Age | ||||||||||||
| 10-20 yrs old | 3360 | 0.50 | 0.70* | 0.61* | 0.69* | 1615 | 0.39 | 0.61* | 0.32* | 0.55* | 0.36* | 0.36* |
| 20-30 yrs old | 4066 | 0.47 | 0.74* | 0.66* | 0.70* | 2114 | 0.39 | 0.65* | 0.34* | 0.56* | 0.38* | 0.42* |
| 30-40 yrs old | 870 | 0.51 | 0.66* | 0.52* | 0.61* | 419 | 0.28 | 0.48* | 0.14 | 0.41* | 0.24 | 0.29 |
| 40-50 yrs old | 655 | 0.44 | 0.62* | 0.55* | 0.63* | 256 | 0.28 | 0.63* | 0.29 | 0.57* | 0.31 | 0.37* |
| 50-60 yrs old | 308 | 0.49 | 0.69* | 0.53* | 0.60* | 199 | 0.39 | 0.57* | 0.26 | 0.41* | 0.20 | 0.25 |
| 60-70 yrs old | 204 | 0.48 | 0.64* | 0.49* | 0.60* | 19 | — | 0.57 | 0.42 | 0.46 | 0.05 | -0.18 |
| 70-80 yrs old | 68 | — | 0.56* | 0.52* | 0.56* | 24 | — | 0.50 | 0.35 | 0.36 | 0.24 | 0.85* |
| 80+ yrs old | 24 | — | 0.52 | 0.48 | 0.48 | 12 | — | 0.63 | 0.01 | 0.45 | -0.09 | 0.43 |
| Country (Residence) | ||||||||||||
| African Islamic | 164 | 0.27 | 0.49 | 0.48 | 0.46 | 116 | 0.21 | 0.35 | 0.23 | 0.29 | 0.15 | 0.16 |
| Baltic | 53 | 0.02 | 0.65 | 0.65 | 0.33 | 14 | 0.00 | 0.42 | 0.14 | 0.52 | 0.35 | 0.75 |
| Catholic Europe | 406 | 0.33 | 0.53* | 0.41* | 0.64* | 172 | 0.37 | 0.32 | 0.11 | 0.38 | 0.15 | 0.22 |
| Confucian | 268 | 0.42 | 0.68* | 0.55* | 0.77* | 83 | 0.17 | 0.41 | 0.36 | 0.45 | 0.33 | 0.48 |
| English-Speaking | 7315 | 0.50 | 0.76* | 0.65* | 0.73* | 3819 | 0.40 | 0.72* | 0.34* | 0.60* | 0.38* | 0.42* |
| Latin American | 166 | 0.43 | 0.54* | 0.56* | 0.59* | 53 | 0.15 | 0.30 | 0.12 | 0.26 | -0.04 | 0.17 |
| Orthodox Europe | 264 | 0.38 | 0.47 | 0.57* | 0.60* | 90 | 0.31 | 0.25 | 0.28 | 0.37 | 0.29 | 0.17 |
| Protestant Europe | 736 | 0.46 | 0.63* | 0.57* | 0.61* | 387 | 0.36 | 0.45* | 0.31 | 0.23 | 0.31 | 0.31 |
| West South Asia | 166 | 0.44 | 0.61* | 0.57* | 0.53* | 21 | — | 0.77 | 0.22 | 0.57 | 0.07 | 0.16 |
| Religion | ||||||||||||
| Buddhist | 189 | 0.33 | 0.64* | 0.58* | 0.55* | 69 | 0.40 | 0.48 | 0.10 | 0.25 | 0.19 | 0.50 |
| Christian | 1969 | 0.50 | 0.73* | 0.55* | 0.73* | 1080 | 0.29 | 0.56* | 0.34* | 0.49* | 0.36* | 0.34* |
| Hindu | 201 | 0.75 | 0.65* | 0.60* | 0.58* | 109 | 0.46 | 0.63* | 0.34 | 0.41 | 0.30 | 0.38 |
| Jewish | 204 | 0.50 | 0.66* | 0.60* | 0.60* | 144 | 0.45 | 0.64* | 0.29 | 0.43* | 0.29 | 0.33 |
| Muslim | 319 | 0.36 | 0.63* | 0.59* | 0.72* | 89 | 0.33 | 0.42 | 0.16 | 0.29 | 0.14 | 0.31 |
| Spritual | 88 | 0.48 | 0.61* | 0.60* | 0.72* | 13 | — | 0.35 | -0.16 | 0.15 | 0.20 | — |
We present case studies of applying NLPositionality to two different socially-aligned tasks: social acceptability and hate speech detection.
4.1 Social Acceptability
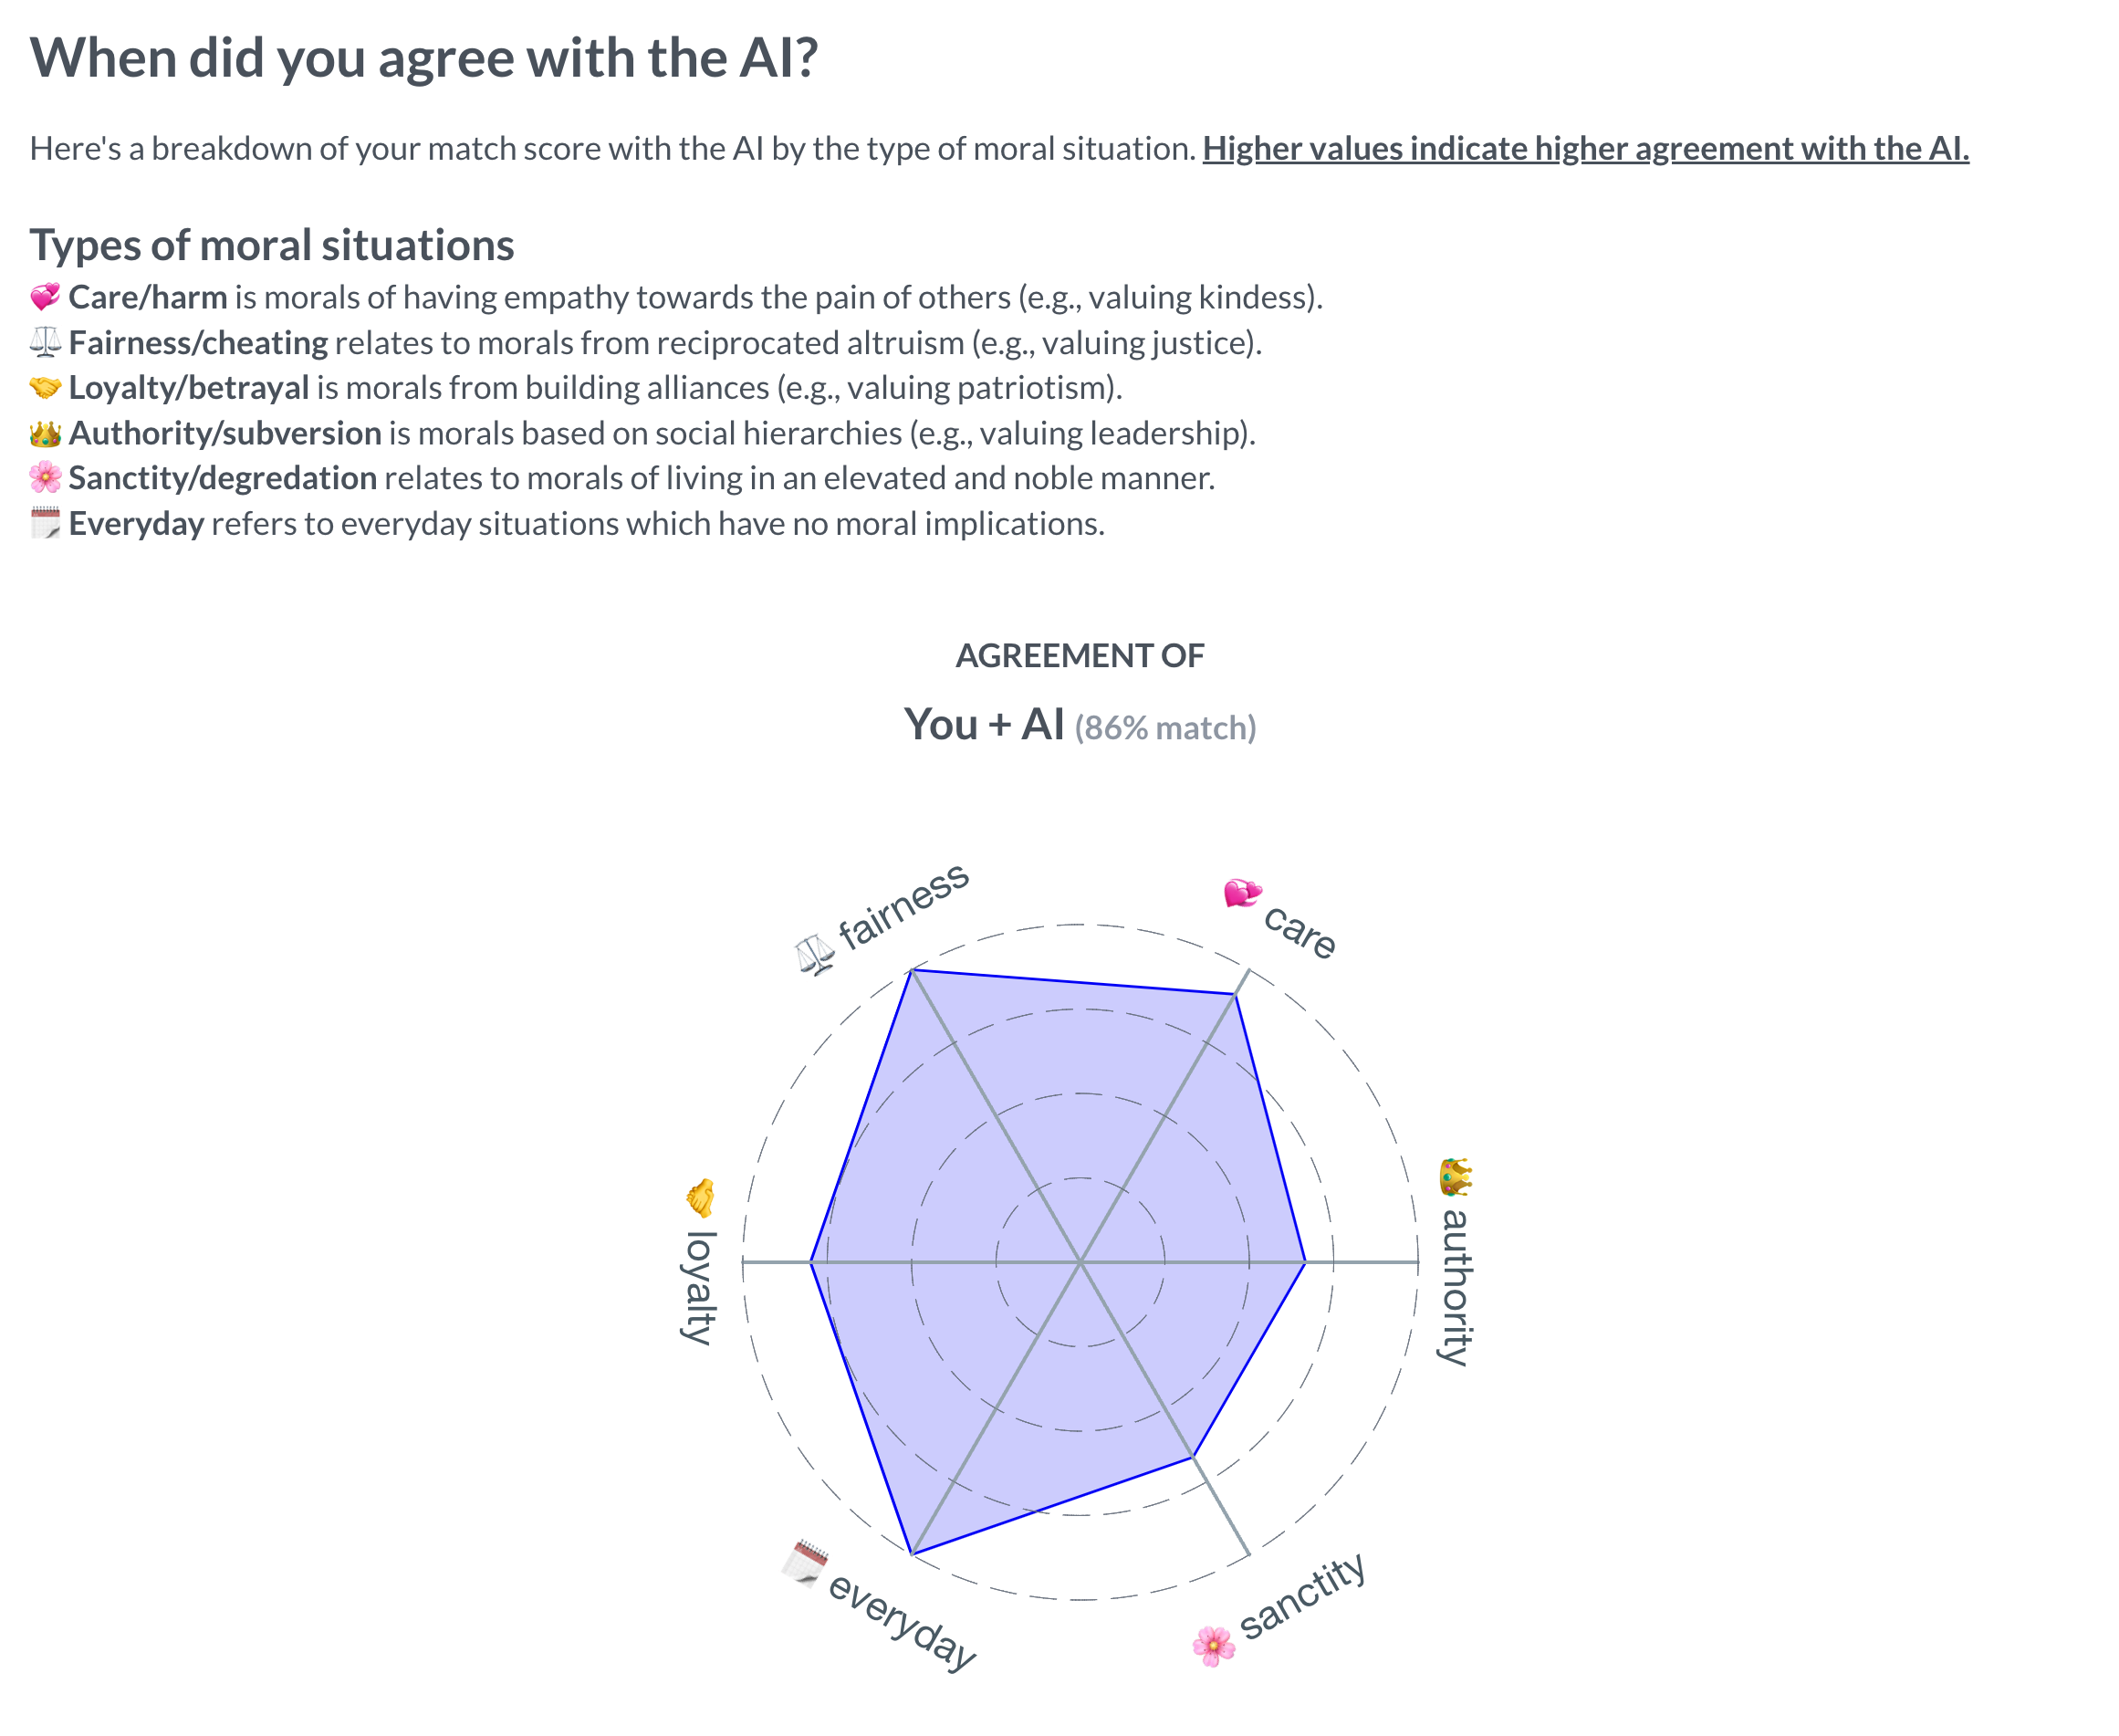
Social acceptability is the task of evaluating how acceptable certain actions are in society. Related to making moral judgments, it requires models to have commonsense rules about social norms and acceptable behavior Forbes et al. (2020). Social acceptability is likely to vary by background, as morality Atari et al. (2022), values Haerpfer and Kizilova (2012), and moral decision-making Awad et al. (2018, 2020) vary by culture. In NLP, social acceptability models’ behavior have been shown to systematically display certain values Arora et al. (2023) and biases Hämmerl et al. (2022), some of which are Western-centric Jiang et al. (2021); Talat et al. (2022).
Setup
participants annotated the social acceptability of examples from the Social Chemistry dataset Forbes et al. (2020). We collected annotations for this task and compared participants’ responses to the original Social Chemistry dataset, the Delphi model Jiang et al. (2021), and GPT-4 zero-shot OpenAI (2023). In order to evaluate GPT-4, we combine Delphi’s GPT-3 zero-shot evaluation setup from Jiang et al. (2021) with the template used by Rae et al. (2021):
Results
We find that the instances we selected for the social acceptability task can vary by the annotator’s demographics (see Table 3.2). For example, men and non-binary people are more likely than women to say it’s okay to tell a woman what to do.
We also report the Pearson’s results in Table 2, with corresponding -values after applying the Bonferroni correction in the Appendix C.1. We use ∗ to represent statistically significant Pearson’s coefficients (). Social Chemistry is most aligned with people who grow up () and live in () English-speaking countries, who have a college education (), are White (), and are 20-30 years old (), indicating a preference to younger WEIRD populations.
Delphi also exhibits a similar pattern, but to a lesser degree. While it strongly aligns with people who grow up () and live in ( English-speaking countries, who have a college education (), are White (), and are 20-30 years old (); it also correlates more with other populations, such as people who grow up () in Baltic countries compared to English-speaking countries.
We also observe a similar pattern with GPT-4. It has the highest Pearson’s value for people who grow up () and live in () English-speaking countries, are college-educated (), are White () and are between 20-30 years old (). However, it does have strong correlations with other populations, such as people who grow up in Confucian countries () and have a graduate degree ().
Native English speakers strongly correlate with both datasets and models. Non-binary people align less to both Social Chemistry, Delphi, and GPT-4 compared to men and women. People with professional school education and Black, Latinx, and Native American populations consistently rank least in correlation for education level and ethnicity.
4.2 Hate Speech Detection
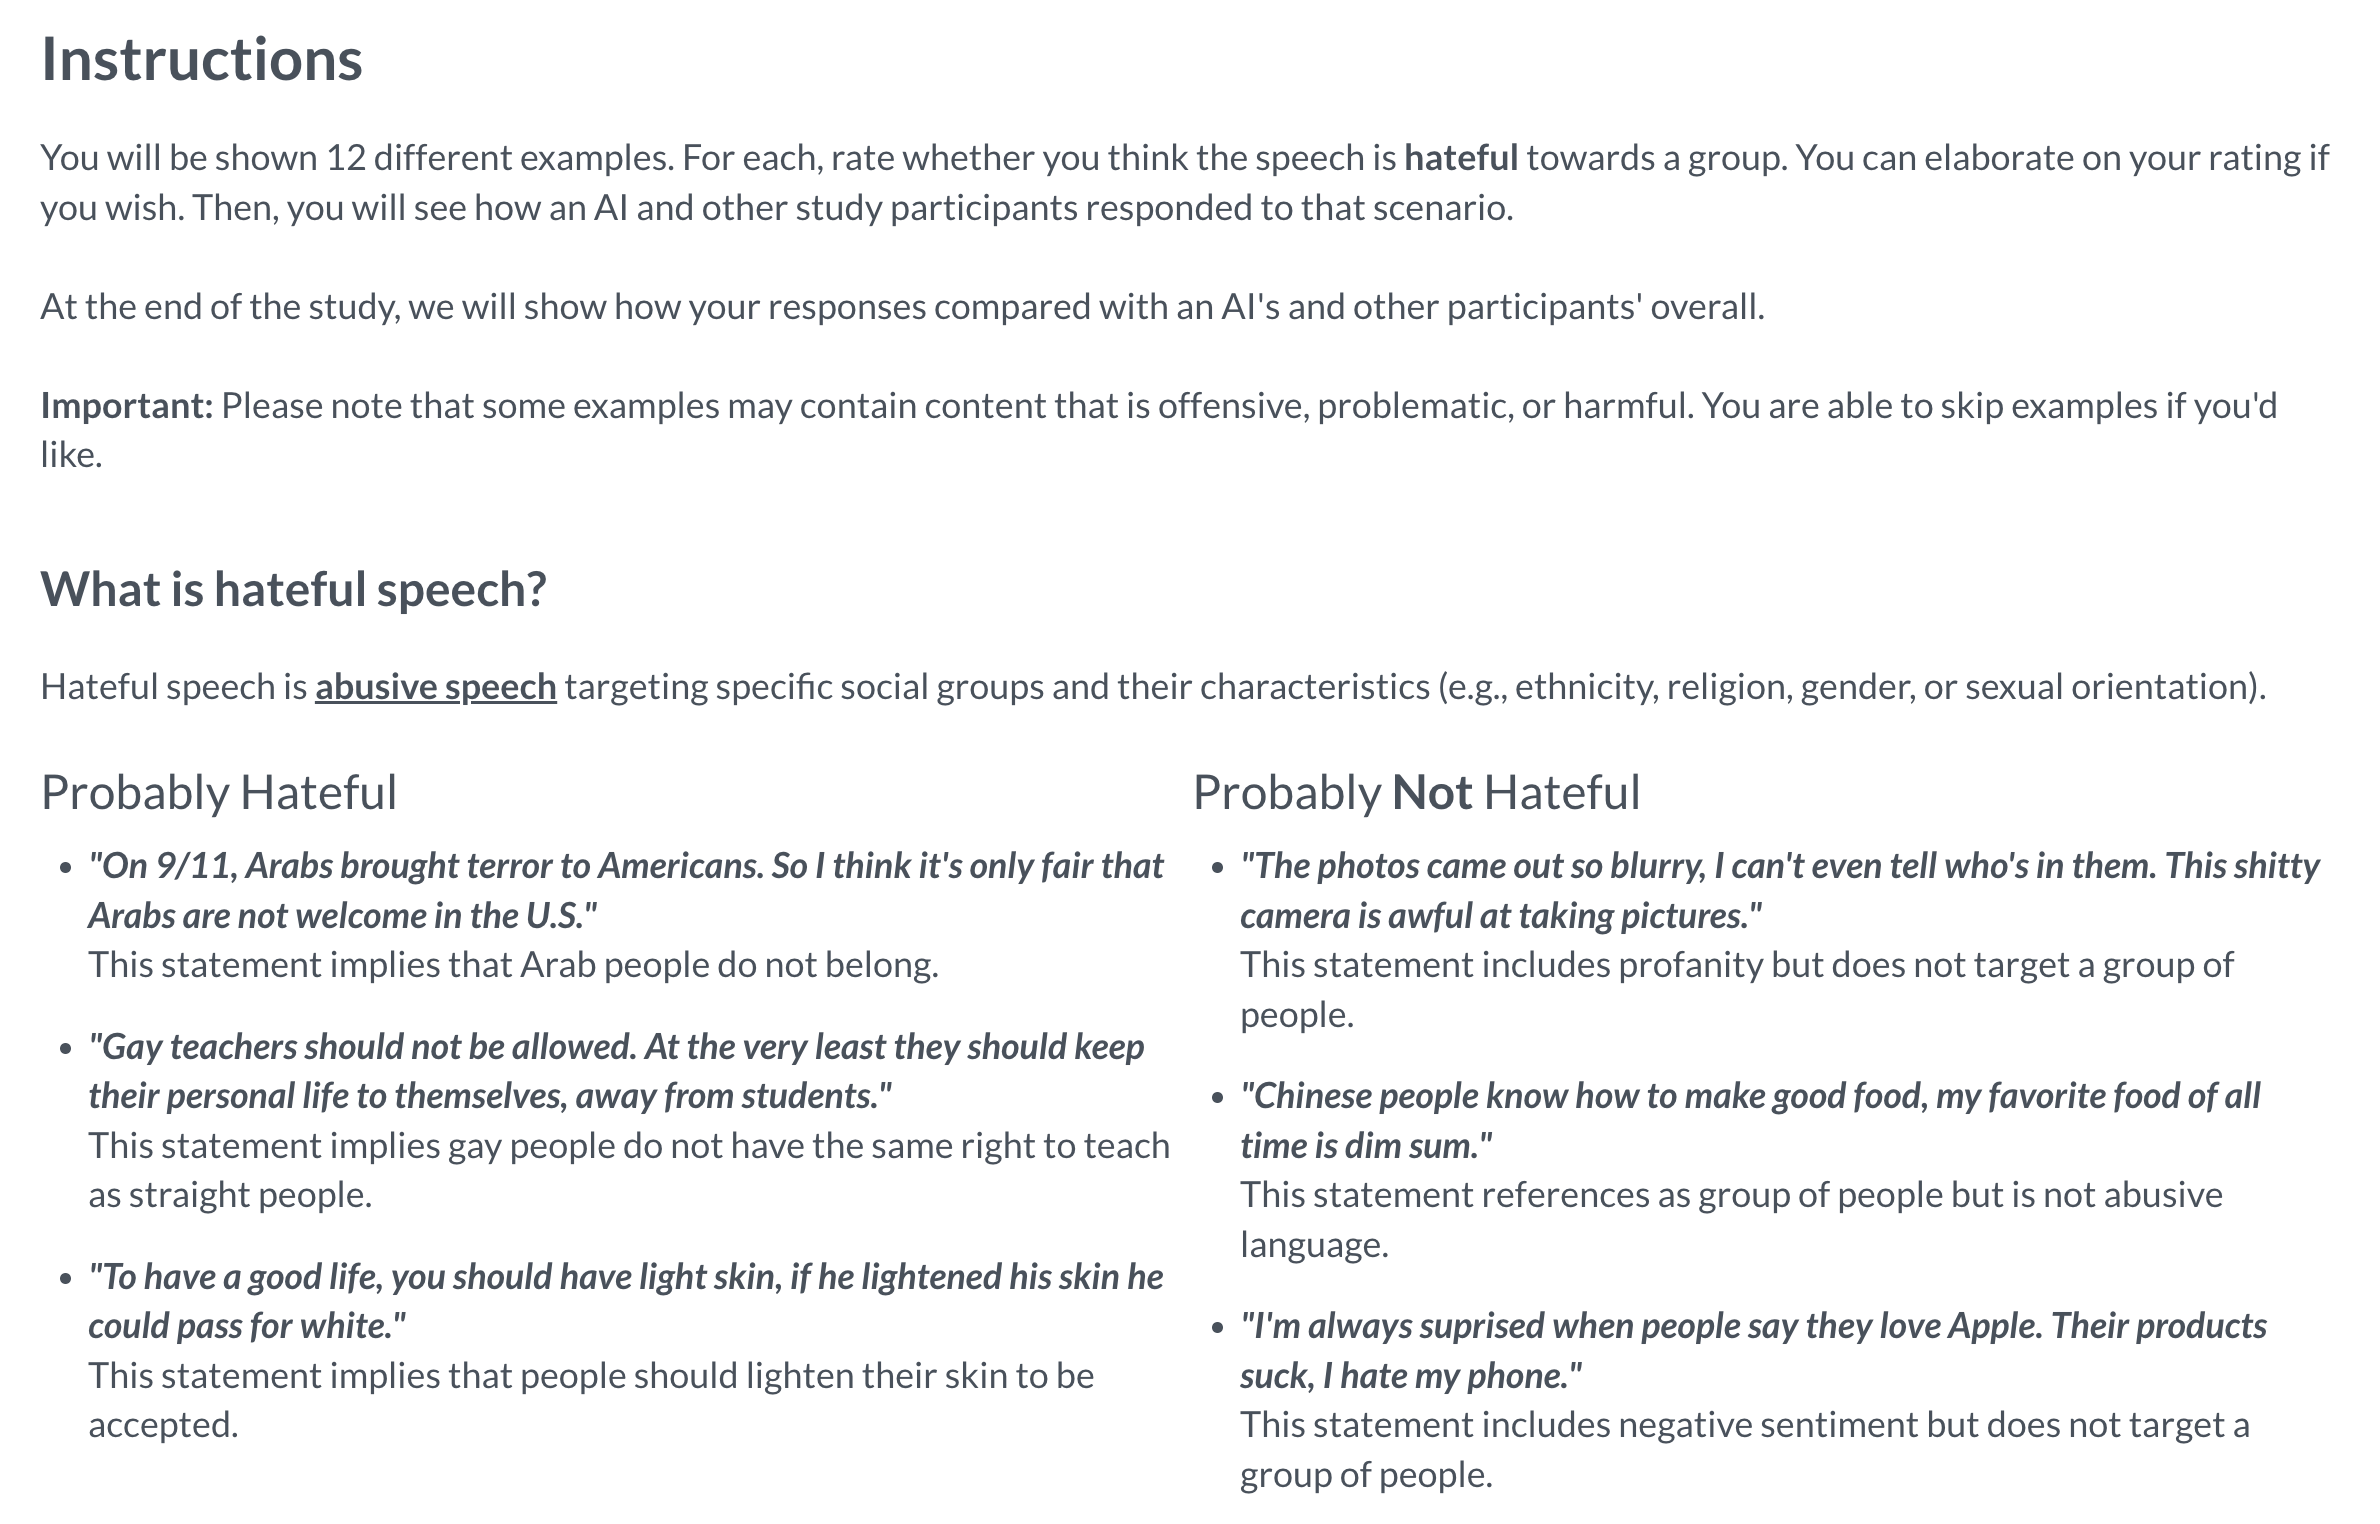
Hate speech detection is the task of determining whether an instance is “abusive speech targeting specific group characteristics, such as ethnic origin, religion, gender, or sexual orientation” Warner and Hirschberg (2012). Rating whether text is hate speech is likely to vary by background. Also, annotators rate the toxicity of tweets with African American English (AAE) differently by background, such as political affiliation Sap et al. (2022). Hate speech classifiers also produce errors for instances outside Western contexts Ghosh et al. (2021).
Setup
For the hate speech detection task, LabintheWild participants annotated examples from the Dynahate dataset Vidgen et al. (2021) and rated whether an instance was hate speech or not. We collected annotations and compared participants’ responses to the original Dynahate dataset as well as Perspective API333perspectiveapi.com, Rewire API444rewire.online, HateRoBERTa Hartvigsen et al. (2022), and GPT-4 zero-shot. To evaluate GPT-4, we use the prompt used by Rae et al. (2021):
Results
We find that the instances we selected for this task can vary by the annotator’s demographics (see Table 3.2). For instance, annotators who were racial minorities rated the instance “Justice for the yellow man lol” as hate speech, while White annotators voted being not sure.
We also report the results in Table 2. We report the -values after applying the Bonferroni correction in the Appendix C.1. Dynahate is highly correlated with people who grow up in English-speaking countries (), who have a college education (), are White (), and are 20-30 years old (). However, it also has high alignment with other populations, such as people who live in West South Asia ().
Perspective API also tends to align with WEIRD populations, though to a lesser degree than Dynahate. Perspective API exhibits some alignment with people who grow up and live in English-speaking (, respectively), have a college education (), are White (), and are 20-30 years old (). It also exhibits higher alignment with other populations, such as people who live in Confucian countries () compared to English-speaking countries. Unexpectedly, White people rank lowest in Pearson’s score within the ethnicity category.
Rewire API similarly shows this bias. It has a moderate correlation with people who grow up and live in English-speaking countries (, respectively), have a college education (), are White (), and are 20-30 years old ().
A Western bias is also shown in HateRoBERTa. HateRoBERTa shows some alignment with people who grow up () and live in () English-speaking countries, have a college education (), are White (), and are between 20-30 years of age ().
We also observe similar behavior with GPT-4. The demographics with some of the higher Pearson’s values in its category are people who grow up () and live in () English-speaking countries, are college-educated (), are White (), and are 20-30 years old (). It shows stronger alignment to Asian-Americans () compared to White people, as well as people who live in Baltic countries () and people who grow up in Confucian countries () compared to people from English-speaking countries.
As in the previous task, labels from native English speakers are strongly correlated with datasets and models. Non-binary people align less with Dynahate, Perspective API, Rewire, HateRoBERTa, and GPT-4 compared to other genders. Also, people who are professional school-educated or are Black, Latinx, and Native American rank least in alignment for education and ethnicity respectively.
5 Discussion
In this paper, we characterized design biases and the positionality of datasets and models in NLP. We introduced the NLPositionality framework for identifying design biases in NLP datasets and models. NLPositionality consists of a two-step process of collecting annotations from diverse annotators for a specific task and then computing the alignment of the annotations to dataset labels and model predictions using Pearson’s . We applied NLPositionality to two tasks: social acceptability and hate speech detection, with two datasets and five models in total. In this section, we discuss key takeaways from our experiments and offer recommendations to account for design biases in datasets and models.
There Is Positionality in NLP
Models and datasets have positionality, as they align better with some populations than others. This corroborates work from Cambo and Gergle (2022) on model positionality, which quantifies positionality by inspecting the content of annotated documents, as well as work from Rogers (2021), who argues that collecting a corpus of speech inherently encodes a particular world view (e.g., via linguistic structures, topic of conversations, and the speaker’s social context). We extend these works by showing design biases and quantifying dataset and model positionality by computing correlations between LabintheWild annotations, dataset labels, and model predictions.
Our case studies show examples of positionality in NLP. However, most socially-aligned tasks may encode design biases due to differences in language use between demographic groups, for example, commonsense reasoning Shwartz (2022), question answering Gor et al. (2021), and sentiment analysis Mohamed et al. (2022). Even tasks that are considered purely linguistic have seen design biases: in parsing and tagging, performance differences exist between texts written by people of different genders Garimella et al. (2019), ages Hovy and Søgaard (2015), and races Johannsen et al. (2015); Jørgensen et al. (2015). This shows how common design biases are in NLP, as language is a social construct Burr (2015) and technologies are imbued with their creator’s values Friedman (1996). This raises the question of whether there are any value-neutral language technologies Birhane et al. (2022); Winner (2017).
Datasets and Models Skew Western
Across all tasks, models, and datasets, we find statistically significant moderate correlations with Western, educated, White, and young populations, indicating that language technologies are WEIRD to an extent, though each to varying degrees. Prior work identifies Western-centric biases in NLP research Hershcovich et al. (2022), as a majority of research is conducted in the West ACL (2017); Caines (2021). Joshi et al. (2020); Blasi et al. (2022) find disproportionate amounts of resources dedicated to English in NLP research, while Ghosh et al. (2021) identify cross-geographic errors made by toxicity models in non-Western contexts. This could lead to serious downstream implications such as language extinction Kornai (2013). Not addressing these biases risks imposing Western standards on non-Western populations, potentially resulting in a new kind of colonialism in the digital age Irani et al. (2010).
Some Populations Are Left Behind
Certain demographics consistently rank lowest in their alignment with datasets and models across both tasks compared to other demographics of the same type. Prior work has also reported various biases against these populations in datasets and models: people who are non-binary (e.g., Dev et al., 2021), Black (e.g., Sap et al., 2019; Davidson et al., 2019), Latinx (e.g., Dodge et al., 2021), Native American (e.g., Mager et al., 2018); and people who are not native English speakers (e.g., Joshi et al., 2020). These communities are historically marginalized by technological systems Bender et al. (2021).
Datasets Tend to Align with Their Annotators
We observe that the positionality we compute is similar to the reported annotator demographics of the datasets, indicating that annotator background contributes to dataset positionality. Social Chemistry reports their annotators largely being women, White, between 30-39 years old, having a college education, and from the U.S. Forbes et al. (2020), all of which have high correlation to the dataset. Similarly, Dynahate exhibits high correlation with their annotator populations, which are mostly women, White, 18-29 years old, native English speakers, and British Vidgen et al. (2021). This could be because annotators’ positionalities cause them to make implicit assumptions about the context of subjective annotation tasks, which affects its labels Wan et al. (2023); Birhane et al. (2022). In toxicity modeling, men and women value speaking freely versus feeling safe online differently Duggan et al. (2014).
Recommendations
Based on these findings, we discuss some recommendations. Following prior work on documenting the choices made in building datasets Gebru et al. (2021) and models Bender and Friedman (2018); Bender et al. (2021), researchers should keep a record of all design choices made while building them. This can improve reproducibility NAACL (2021); AAAI (2023) and aid others in understanding the rationale behind the decisions, revealing some of the researcher’s positionality. Similar to the “Bender Rule” Bender (2019), which suggests stating the language used, researchers should report their positionality and the assumptions they make (potentially after paper acceptance to preserve anonymity).
We echo prior work in recommending methods to center the perspectives of communities who are harmed by design biases Blodgett et al. (2020); Hanna et al. (2020); Bender et al. (2021). This can be done using approaches such as participatory design Spinuzzi (2005), including interactive storyboarding Madsen and Aiken (1993), as well as value-sensitive design Friedman (1996), including panels of experiential experts Madsen and Aiken (1993). Building datasets and models with large global teams such as BigBench Srivastava et al. (2022) and NL-Augmenter Dhole et al. (2021) could also reduce design biases by having diverse teams Li (2020).
To account for annotator subjectivity Aroyo and Welty (2015), researchers should make concerted efforts to recruit annotators from diverse backgrounds. Websites like LabintheWild can be platforms where these annotators are recruited. Since new design biases could be introduced in this process, we recommend following the practice of documenting the demographics of annotators as in prior works (e.g., Forbes et al., 2020; Vidgen et al., 2021) to record a dataset’s positionality.
We urge considering research through the lens of perspectivism Basile et al. (2021), i.e. being mindful of different perspectives by sharing datasets with disaggregated annotations and finding modeling techniques that can handle inherent disagreements or distributions Plank (2022), instead of forcing a single answer in the data (e.g., by majority vote; Davani et al., 2022) or model (e.g., by classification to one label; Costanza-Chock, 2018). Researchers also should carefully consider how they aggregate labels from diverse annotators during modeling so their perspectives are represented, such as not averaging annotations to avoid the “tyranny of the mean” Talat et al. (2022).
Finally, we argue that the notion of “inclusive NLP” does not mean that all language technologies have to work for everyone. Specialized datasets and models are immensely valuable when the data collection process and other design choices are intentional and made to uplift minority voices or historically underrepresented cultures and languages, such as Masakhane-NER Adelani et al. (2021) and AfroLM Dossou et al. (2022). There have also been efforts to localize the design of technologies, including applications that adapt their design and functionality to the needs of different cultures (e.g., Oyibo, 2016; Reinecke and Bernstein, 2011, 2013). Similarly, language models could be made in more culturally adaptive ways, because one size does not fit all Groenwold et al. (2020); Rettberg (2022). Therefore, we urge the NLP community to value the adaptation of language technologies from one language or culture to another Joshi et al. (2020).
6 Conclusion
We introduce NLPositionality, a framework to quantify design biases and positionality of datasets and models. In this work, we present how researcher positionality leads to design biases and subsequently gives positionality to datasets and models, potentially resulting in these artifacts not working equally for all populations. Our framework involves recruiting a demographically diverse pool of crowdworkers from around the world on LabintheWild, who then re-annotate a sample of a dataset for an NLP task. We apply NLPositionality to two tasks, social acceptability and hate speech detection, to show that models and datasets have a positionality and design biases by aligning better with Western, White, college-educated, and younger populations. Our results indicate the need for more inclusive models and datasets, paving the way for NLP research that benefits all people.
7 Limitations
Our study has several limitations. First, demographics may not be the best construct for positionality, as there may be variability of beliefs within demographic groups. Assuming that there is homogeneity within demographic groups is reductionist and limited. Rather, capturing an individual’s attitudes or beliefs may be a more reliable way to capture one’s positionality that future work can investigate.
Study annotators could also purposefully answer untruthfully, producing low-quality annotations. We address this risk by using LabintheWild. LabintheWild has been shown to produce high-quality data because participants are intrinsically motivated to participate by learning something about themselves Reinecke and Gajos (2015). However, as is the case for all online recruiting methods, our sample of participants is not representative of the world’s population due to the necessity of having access to the Internet. In addition, there is likely a selection bias in who decides to participate in a LabintheWild study.
Pearson’s may not fully capture alignment as it does not consider interaction effects between different demographics (i.e., intersectionality). Thus, there may be additional mediating or moderating variables that may explain the results that our analysis does not consider. We also took the average of the annotations per group, which could mask individual variations Talat et al. (2022). Also, having a low number of participants from specific demographic groups may limit how well the results generalize to the entire group; further, it may risk tokenizing already marginalized communities. As part of our study, we apply NLPositionality to only two tasks which have relatively straightforward annotation schemes. It may be difficult to generalize to other NLP tasks which have harder annotation schemes, especially ones that require a lot of explanation to the annotators, for example, natural language inference (NLI) tasks.
Our approach is evaluated and works the best for classification tasks and classifiers. Generation tasks would need more careful annotator training which is difficult to achieve on a voluntary platform without adequate incentives. Having annotators use one Likert scale to rate the social acceptability and toxicity of a situation or text may not be a sufficient measure to represent these complex social phenomena. To reduce this threat, we provide detailed instructions that describe how to provide annotations and followed the original annotation setup as closely as possible.
8 Ethics Statement
Towards Inclusive NLP Systems
Building inclusive NLP systems is important so that everyone can benefit from their usage. Currently, these systems exhibit many design biases that negatively impact minoritized or underserved communities in NLP Joshi et al. (2020); Blodgett et al. (2020); Bender et al. (2021). Our work is a step towards reducing these disparities by understanding that models and datasets have positionalities and by identifying design biases. The authors take inspiration from fields outside of NLP by studying positionality Rowe (2014) and acknowledge cross-disciplinary research as crucial to building inclusive AI systems.
Ethical Considerations
We recognize that the demographics we collected only represent a small portion of a person’s positionality. There are many aspects of positionality that we did not collect, such as sexual orientation, socioeconomic status, ability, and size. Further, we acknowledge the limitation of assigning labels to people as being inherently reductionist. As mentioned in §7, using a single Likert scale for social acceptability and toxicity is not sufficient in capturing the complexities in these phenomena, such as situational context.
We note that quantifying positionality of existing systems is not an endorsement of the system. In addition to making sure that language technologies work for all populations, researchers should also continue to examine whether these systems should exist in the first place Denton and Gebru (2020); Keyes et al. (2019). Further, we note that understanding a dataset or model’s positionality does not preclude researchers from the responsibilities of adjusting it further.
This study was undertaken following approval from the IRB at the University of Washington (STUDY00014813). LabintheWild annotators were not compensated financially. They were lay people from a wide range of ages (including minors) and diverse backgrounds. Participants were asked for informed consent to the study procedures as well as the associated risks, such as being exposed to toxic or mature content, prior to beginning the study.
Research Team Positionality
We discuss aspects of our positionality below that we believe are most relevant to this research. The research team is comprised of computer scientists who study human-computer interaction and NLP and have a bent for using quantitative methods. Thus, we approach the topic from a perspective that assumes that positionality can be characterized, fixed, and quantified.
The entire research team currently resides in the United States. In alphabetical order, the team members originate from Belgium and Switzerland, France, Germany, India, and the United States; and identify as East Asian, South Asian, and White. These nationalities and ethnicities are overrepresented in the development of NLP technologies. Thus, we acknowledge that our knowledge of how design biases in NLP datasets and models impact people is largely through research, rather than personal experience.
Acknowledgements
We thank Yejin Choi and Liwei Jiang for their invaluable inputs in the early stages of the project, especially their ideas in shaping the direction of this work, as well as the ReViz team at the Allen Institute for AI for their technical support for building the LabintheWild experiments. We also thank the members of the University of Washington NLP, HCI, and ML/AI groups for their feedback throughout the project. We give a special thanks to Mei ![]() , an outstanding canine researcher, for providing support and motivation throughout the study.
, an outstanding canine researcher, for providing support and motivation throughout the study.
Jenny T. Liang was supported by the National Science Foundation under grants DGE1745016 and DGE2140739. Katharina Reinecke was partially supported by the National Science Foundation under grant 2230466.
References
- AAAI (2023) AAAI. 2023. Reproducibility checklist.
- ACL (2017) ACL. 2017. ACL Diversity Statistics.
- Adelani et al. (2021) David Ifeoluwa Adelani, Jade Abbott, Graham Neubig, Daniel D’souza, Julia Kreutzer, Constantine Lignos, Chester Palen-Michel, Happy Buzaaba, Shruti Rijhwani, Sebastian Ruder, et al. 2021. Masakhaner: Named entity recognition for african languages. Transactions of the Association for Computational Linguistics, 9:1116–1131.
- Arora et al. (2023) Arnav Arora, Lucie-Aimée Kaffee, and Isabelle Augenstein. 2023. Probing pre-trained language models for cross-cultural differences in values. In Workshop on Cross-Cultural Considerations in NLP, page 114–130.
- Aroyo and Welty (2015) Lora Aroyo and Chris Welty. 2015. Truth is a lie: Crowd truth and the seven myths of human annotation. AI Magazine, 36(1):15–24.
- Atari et al. (2022) Mohammad Atari, Jonathan Haidt, Jesse Graham, Sena Koleva, Sean T Stevens, and Morteza Dehghani. 2022. Morality beyond the WEIRD: How the nomological network of morality varies across cultures. PsyArXiv.
- August and Reinecke (2019) Tal August and Katharina Reinecke. 2019. Pay attention, please: Formal language improves attention in volunteer and paid online experiments. In ACM SIGCHI Conference on Human Factors in Computing Systems, page 1–11.
- Awad et al. (2018) Edmond Awad, Sohan Dsouza, Richard Kim, Jonathan Schulz, Joseph Henrich, Azim Shariff, Jean-François Bonnefon, and Iyad Rahwan. 2018. The moral machine experiment. Nature, 563(7729):59–64.
- Awad et al. (2020) Edmond Awad, Sohan Dsouza, Azim Shariff, Iyad Rahwan, and Jean-François Bonnefon. 2020. Universals and variations in moral decisions made in 42 countries by 70,000 participants. National Academy of Sciences, 117(5):2332–2337.
- Basile et al. (2021) Valerio Basile, Federico Cabitza, Andrea Campagner, and Michael Fell. 2021. Toward a perspectivist turn in ground truthing for predictive computing. arXiv preprint arXiv:2109.04270.
- Bender (2019) Emily Bender. 2019. The# benderrule: On naming the languages we study and why it matters. The Gradient, 14.
- Bender and Friedman (2018) Emily M. Bender and Batya Friedman. 2018. Data statements for natural language processing: Toward mitigating system bias and enabling better science. Transactions of the Association for Computational Linguistics, 6:587–604.
- Bender et al. (2021) Emily M. Bender, Timnit Gebru, Angelina McMillan-Major, and Shmargaret Shmitchell. 2021. On the dangers of stochastic parrots: Can language models be too big? In ACM Conference on Fairness, Accountability, and Transparency, page 610–623.
- Birhane et al. (2022) Abeba Birhane, Pratyusha Kalluri, Dallas Card, William Agnew, Ravit Dotan, and Michelle Bao. 2022. The values encoded in machine learning research. In ACM Conference on Fairness, Accountability, and Transparency, pages 173–184.
- Blasi et al. (2022) Damian Blasi, Antonios Anastasopoulos, and Graham Neubig. 2022. Systematic inequalities in language technology performance across the world’s languages. In Annual Meeting of the Association for Computational Linguistics (Volume 1: Long Papers), pages 5486–5505.
- Blodgett et al. (2020) Su Lin Blodgett, Solon Barocas, Hal Daumé III, and Hanna Wallach. 2020. Language (technology) is power: A critical survey of "bias" in NLP. In Annual Meeting of the Association for Computational Linguistics, pages 5454–5476.
- Bolukbasi et al. (2016) Tolga Bolukbasi, Kai-Wei Chang, James Y Zou, Venkatesh Saligrama, and Adam T Kalai. 2016. Man is to computer programmer as woman is to homemaker? Debiasing word embeddings. volume 29.
- Burr (2015) Vivien Burr. 2015. Social Constructionism. Routledge.
- Caines (2021) Andrew Caines. 2021. The geographic diversity of NLP conferences.
- Cambo and Gergle (2022) Scott Allen Cambo and Darren Gergle. 2022. Model positionality and computational reflexivity: Promoting reflexivity in data science. In ACM SIGCHI Conference on Human Factors in Computing Systems, pages 1–19.
- Costanza-Chock (2018) Sasha Costanza-Chock. 2018. Design justice, AI, and escape from the matrix of domination. Journal of Design and Science, 3(5).
- Davani et al. (2022) Aida Mostafazadeh Davani, Mark Díaz, and Vinodkumar Prabhakaran. 2022. Dealing with disagreements: Looking beyond the majority vote in subjective annotations. Transactions of the Association for Computational Linguistics, 10:92–110.
- Davidson et al. (2019) Thomas Davidson, Debasmita Bhattacharya, and Ingmar Weber. 2019. Racial bias in hate speech and abusive language detection datasets.
- Denton and Gebru (2020) Emily Denton and Timnit Gebru. 2020. Tutorial on fairness, accountability, transparency, and ethics in computer vision at CVPR 2020.
- Dev et al. (2021) Sunipa Dev, Masoud Monajatipoor, Anaelia Ovalle, Arjun Subramonian, Jeff Phillips, and Kai-Wei Chang. 2021. Harms of gender exclusivity and challenges in non-binary representation in language technologies. In Conference on Empirical Methods in Natural Language Processing, pages 1968–1994.
- Dhole et al. (2021) Kaustubh D Dhole, Varun Gangal, Sebastian Gehrmann, Aadesh Gupta, Zhenhao Li, Saad Mahamood, Abinaya Mahendiran, Simon Mille, Ashish Srivastava, Samson Tan, et al. 2021. NL-augmenter: A framework for task-sensitive natural language augmentation. arXiv preprint arXiv:2112.02721.
- Difallah et al. (2018) Djellel Difallah, Elena Filatova, and Panos Ipeirotis. 2018. Demographics and dynamics of mechanical turk workers. In ACM International Conference on Web Search and Data Mining, page 135–143.
- Dodge et al. (2021) Jesse Dodge, Maarten Sap, Ana Marasović, William Agnew, Gabriel Ilharco, Dirk Groeneveld, Margaret Mitchell, and Matt Gardner. 2021. Documenting large webtext corpora: A case study on the colossal clean crawled corpus. In Conference on Empirical Methods in Natural Language Processing, pages 1286–1305.
- Dossou et al. (2022) Bonaventure F.P. Dossou, Atnafu Lambebo Tonja, Oreen Yousuf, Salomey Osei, Abigail Oppong, Iyanuoluwa Shode, Oluwabusayo Olufunke Awoyomi, and Chris Emezue. 2022. Afrolm: A self-active learning-based multilingual pretrained language model for 23 African languages. In Workshop on Simple and Efficient Natural Language Processing, pages 52–64.
- Duggan et al. (2014) Maeve Duggan, L Rainie, A Smith, C Funk, A Lenhart, and M Madden. 2014. Online harassment. Pew Research Center, Washington, DC, USA, Technical Rep.
- Foote and Gau Bartell (2011) Mary Q Foote and Tonya Gau Bartell. 2011. Pathways to equity in mathematics education: How life experiences impact researcher positionality. Educational Studies in Mathematics, 78(1):45–68.
- Forbes et al. (2020) Maxwell Forbes, Jena D. Hwang, Vered Shwartz, Maarten Sap, and Yejin Choi. 2020. Social chemistry 101: Learning to reason about social and moral norms. In Conference on Empirical Methods in Natural Language Processing, pages 653–670.
- Friedman (1996) Batya Friedman. 1996. Value-sensitive design. Interactions, 3(6):16–23.
- Friedman and Nissenbaum (1996) Batya Friedman and Helen Nissenbaum. 1996. Bias in computer systems. ACM Transactions on Information Systems, 14(3):330–347.
- Garimella et al. (2019) Aparna Garimella, Carmen Banea, Dirk Hovy, and Rada Mihalcea. 2019. Women’s syntactic resilience and men’s grammatical luck: Gender-bias in part-of-speech tagging and dependency parsing. In Annual Meeting of the Association for Computational Linguistics, pages 3493–3498.
- Gebru et al. (2021) Timnit Gebru, Jamie Morgenstern, Briana Vecchione, Jennifer Wortman Vaughan, Hanna Wallach, Hal Daumé III, and Kate Crawford. 2021. Datasheets for datasets. Communications of the ACM, 64(12):86–92.
- Ghosh et al. (2021) Sayan Ghosh, Dylan Baker, David Jurgens, and Vinodkumar Prabhakaran. 2021. Detecting cross-geographic biases in toxicity modeling on social media. In Workshop on Noisy User-generated Text, page 313–328.
- Gor et al. (2021) Maharshi Gor, Kellie Webster, and Jordan Boyd-Graber. 2021. Toward deconfounding the effect of entity demographics for question answering accuracy. In Conference on Empirical Methods in Natural Language Processing, pages 5457–5473.
- Groenwold et al. (2020) Sophie Groenwold, Lily Ou, Aesha Parekh, Samhita Honnavalli, Sharon Levy, Diba Mirza, and William Yang Wang. 2020. Investigating African-American Vernacular English in transformer-based text generation. In Conference on Empirical Methods in Natural Language Processing, pages 5877–5883.
- Gururangan et al. (2022) Suchin Gururangan, Dallas Card, Sarah K Drier, Emily K Gade, Leroy Z Wang, Zeyu Wang, Luke Zettlemoyer, and Noah A Smith. 2022. Whose language counts as high quality? measuring language ideologies in text data selection. "Conference on Empirical Methods in Natural Language Processing", pages 2562–2580.
- Haerpfer and Kizilova (2012) Christian W Haerpfer and Kseniya Kizilova. 2012. The world values survey. The Wiley-Blackwell Encyclopedia of Globalization, pages 1–5.
- Hall et al. (2022) Melissa Hall, Laurens van der Maaten, Laura Gustafson, and Aaron Adcock. 2022. A systematic study of bias amplification. arXiv preprint arXiv:2201.11706.
- Hämmerl et al. (2022) Katharina Hämmerl, Björn Deiseroth, Patrick Schramowski, Jindřich Libovickỳ, Constantin A Rothkopf, Alexander Fraser, and Kristian Kersting. 2022. Speaking multiple languages affects the moral bias of language models. arXiv preprint arXiv:2211.07733.
- Hanna et al. (2020) Alex Hanna, Emily Denton, Andrew Smart, and Jamila Smith-Loud. 2020. Towards a critical race methodology in algorithmic fairness. In ACM Conference on Fairness, Accountability, and Transparency, pages 501–512.
- Hartvigsen et al. (2022) Thomas Hartvigsen, Saadia Gabriel, Hamid Palangi, Maarten Sap, Dipankar Ray, and Ece Kamar. 2022. Toxigen: Controlling language models to generate implied and adversarial toxicity. In Annual Meeting of the Association for Computational Linguistics (Volume 1: Long Papers).
- Henrich et al. (2010) Joseph Henrich, Steven J Heine, and Ara Norenzayan. 2010. The weirdest people in the world? Behavioral and Brain Sciences, 33(2-3):61–83.
- Hershcovich et al. (2022) Daniel Hershcovich, Stella Frank, Heather Lent, Miryam de Lhoneux, Mostafa Abdou, Stephanie Brandl, Emanuele Bugliarello, Laura Cabello Piqueras, Ilias Chalkidis, Ruixiang Cui, Constanza Fierro, Katerina Margatina, Phillip Rust, and Anders Søgaard. 2022. Challenges and strategies in cross-cultural NLP. In Annual Meeting of the Association for Computational Linguistics (Volume 1: Long Papers), pages 6997–7013.
- Holmes (2020) Andrew Gary Darwin Holmes. 2020. Researcher positionality–A consideration of its influence and place in qualitative research–A new researcher guide. Shanlax International Journal of Education, 8(4):1–10.
- Hovy and Søgaard (2015) Dirk Hovy and Anders Søgaard. 2015. Tagging performance correlates with author age. In Annual Meeting of the Association for Computational Linguistics and the International Joint Conference on Natural Language Processing (Volume 2: Short Papers), pages 483–488.
- Ipeirotis (2010) Panagiotis G Ipeirotis. 2010. Demographics of Mechanical Turk.
- Irani et al. (2010) Lilly Irani, Janet Vertesi, Paul Dourish, Kavita Philip, and Rebecca E. Grinter. 2010. Postcolonial computing: A lens on design and development. In ACM SIGCHI Conference on Human Factors in Computing Systems, page 1311–1320.
- Jiang et al. (2021) Liwei Jiang, Jena D Hwang, Chandra Bhagavatula, Ronan Le Bras, Jenny Liang, Jesse Dodge, Keisuke Sakaguchi, Maxwell Forbes, Jon Borchardt, Saadia Gabriel, et al. 2021. Can machines learn morality? the delphi experiment. arXiv e-prints, pages arXiv–2110.
- Johannsen et al. (2015) Anders Johannsen, Dirk Hovy, and Anders Søgaard. 2015. Cross-lingual syntactic variation over age and gender. In Conference on Computational Natural Language Learning, pages 103–112.
- Jørgensen et al. (2015) Anna Jørgensen, Dirk Hovy, and Anders Søgaard. 2015. Challenges of studying and processing dialects in social media. In ACL Workshop on Noisy User-generated Text, pages 9–18.
- Joshi et al. (2020) Pratik Joshi, Sebastin Santy, Amar Budhiraja, Kalika Bali, and Monojit Choudhury. 2020. The state and fate of linguistic diversity and inclusion in the NLP world. In Annual Meeting of the Association for Computational Linguistics, pages 6282–6293.
- Keyes et al. (2019) Os Keyes, Jevan Hutson, and Meredith Durbin. 2019. A mulching proposal: Analysing and improving an algorithmic system for turning the elderly into high-nutrient slurry. In Extended abstracts of the SIGCHI Conference on Human Factors in Computing Systems, pages 1–11.
- Kornai (2013) András Kornai. 2013. Digital language death. PLOS ONE, 8(10):1–11.
- Krippendorff (2006) Klaus Krippendorff. 2006. Reliability in content analysis: Some common misconceptions and recommendations. Human Communication Research, 30(3):411–433.
- Li (2020) Michael Li. 2020. To build less-biased AI, hire a more diverse team. Harvard Business Review.
- Madsen and Aiken (1993) Kim Halskov Madsen and Peter H. Aiken. 1993. Experiences using cooperative interactive storyboard prototyping. Communications of the ACM, 36(6):57–64.
- Mager et al. (2018) Manuel Mager, Ximena Gutierrez-Vasques, Gerardo Sierra, and Ivan Meza-Ruiz. 2018. Challenges of language technologies for the indigenous languages of the Americas. In International Conference on Computational Linguistics, pages 55–69.
- Mitchell et al. (2019) Margaret Mitchell, Simone Wu, Andrew Zaldivar, Parker Barnes, Lucy Vasserman, Ben Hutchinson, Elena Spitzer, Inioluwa Deborah Raji, and Timnit Gebru. 2019. Model cards for model reporting. In ACM Conference on Fairness, Accountability, and Transparency, page 220–229.
- Mohamed et al. (2022) Youssef Mohamed, Mohamed Abdelfattah, Shyma Alhuwaider, Feifan Li, Xiangliang Zhang, Kenneth Ward Church, and Mohamed Elhoseiny. 2022. Artelingo: A million emotion annotations of WikiArt with emphasis on diversity over language and culture. In Conference on Empirical Methods in Natural Language Processing, pages 8770–8785.
- NAACL (2021) NAACL. 2021. Reproducibility checklist.
- Oliveira et al. (2017) Nigini Oliveira, Eunice Jun, and Katharina Reinecke. 2017. Citizen science opportunities in volunteer-based online experiments. In ACM SIGCHI Conference on Human Factors in Computing Systems, page 6800–6812.
- OpenAI (2023) OpenAI. 2023. Gpt-4 technical report. arXiv.
- Oyibo (2016) Kiemute Oyibo. 2016. Designing culture-based persuasive technology to promote physical activity among university students. In Proceedings of the 2016 conference on user modeling adaptation and personalization, pages 321–324.
- Plank (2022) Barbara Plank. 2022. The ’problem’ of human label variation: On ground truth in data, modeling and evaluation. In Conference on Empirical Methods in Natural Language Processing, pages 10671–10682.
- Rae et al. (2021) Jack W Rae, Sebastian Borgeaud, Trevor Cai, Katie Millican, Jordan Hoffmann, Francis Song, John Aslanides, Sarah Henderson, Roman Ring, Susannah Young, et al. 2021. Scaling language models: Methods, analysis & insights from training Gopher. arXiv preprint arXiv:2112.11446.
- Reinecke and Bernstein (2011) Katharina Reinecke and Abraham Bernstein. 2011. Improving performance, perceived usability, and aesthetics with culturally adaptive user interfaces. ACM Transactions on Computer-Human Interaction, 18(2):1–29.
- Reinecke and Bernstein (2013) Katharina Reinecke and Abraham Bernstein. 2013. Knowing what a user likes: A design science approach to interfaces that automatically adapt to culture. Mis Quarterly, pages 427–453.
- Reinecke and Gajos (2015) Katharina Reinecke and Krzysztof Z. Gajos. 2015. LabInTheWild: Conducting large-scale online experiments with uncompensated samples. In ACM Conference on Computer Supported Cooperative Work & Social Computing, pages 1364––1378.
- Rettberg (2022) Jill Walker Rettberg. 2022. ChatGPT is multilingual but monocultural, and it’s learning your values. https://jilltxt.net/right-now-chatgpt-is- multilingual-but-monocultural-but-its- learning-your-values/. Accessed: 2023-5-25.
- Rogers (2021) Anna Rogers. 2021. Changing the world by changing the data. In Annual Meeting of the Association for Computational Linguistics and the International Joint Conference on Natural Language Processing (Volume 1: Long Papers), pages 2182–2194.
- Rowe (2014) Wendy E Rowe. 2014. Positionality. The SAGE encyclopedia of action research, 628:627–628.
- Sap et al. (2019) Maarten Sap, Dallas Card, Saadia Gabriel, Yejin Choi, and Noah A. Smith. 2019. The risk of racial bias in hate speech detection. In Annual Meeting of the Association for Computational Linguistics, pages 1668–1678.
- Sap et al. (2022) Maarten Sap, Swabha Swayamdipta, Laura Vianna, Xuhui Zhou, Yejin Choi, and Noah A. Smith. 2022. Annotators with attitudes: How annotator beliefs and identities bias toxic language detection. In Conference of the North American Chapter of the Association for Computational Linguistics: Human Language Technologies, pages 5884–5906.
- Savin-Baden and Howell-Major (2013) Maggi Savin-Baden and Claire Howell-Major. 2013. Qualititative research: The essential guide to theory and practice. Qualitative Research: The Essential Guide to Theory and Practice. Routledge.
- Shwartz (2022) Vered Shwartz. 2022. Good night at 4 pm?! time expressions in different cultures. In Findings of the Association for Computational Linguistics: ACL, pages 2842–2853.
- Spinuzzi (2005) Clay Spinuzzi. 2005. The methodology of participatory design. Technical Communication, 52(2):163–174.
- Srivastava et al. (2022) Aarohi Srivastava, Abhinav Rastogi, Abhishek Rao, Abu Awal Md Shoeb, Abubakar Abid, Adam Fisch, Adam R Brown, Adam Santoro, Aditya Gupta, Adrià Garriga-Alonso, et al. 2022. Beyond the imitation game: Quantifying and extrapolating the capabilities of language models. arXiv preprint arXiv:2206.04615.
- Talat et al. (2022) Zeerak Talat, Hagen Blix, Josef Valvoda, Maya Indira Ganesh, Ryan Cotterell, and Adina Williams. 2022. On the machine learning of ethical judgments from natural language. In Conference of the North American Chapter of the Association for Computational Linguistics: Human Language Technologies, pages 769–779.
- Tatman (2017) Rachael Tatman. 2017. Gender and dialect bias in YouTube’s automatic captions. In ACL Workshop on Ethics in Natural Language Processing, pages 53–59.
- Vidgen et al. (2021) Bertie Vidgen, Tristan Thrush, Zeerak Waseem, and Douwe Kiela. 2021. Learning from the worst: Dynamically generated datasets to improve online hate detection. In Annual Meeting of the Association for Computational Linguistics and the International Joint Conference on Natural Language Processing (Volume 1: Long Papers), pages 1667–1682.
- Wan et al. (2023) Ruyuan Wan, Jaehyung Kim, and Dongyeop Kang. 2023. Everyone’s voice matters: Quantifying annotation disagreement using demographic information. arXiv preprint arXiv:2301.05036.
- Warner and Hirschberg (2012) William Warner and Julia Hirschberg. 2012. Detecting hate speech on the world wide web. In Workshop on Language in Social Media, pages 19–26.
- Waseem et al. (2021) Zeerak Waseem, Smarika Lulz, Joachim Bingel, and Isabelle Augenstein. 2021. Disembodied machine learning: On the illusion of objectivity in NLP. arXiv preprint arXiv:2101.11974.
- Wickens and Keppel (2004) Thomas D Wickens and Geoffrey Keppel. 2004. Design and Analysis: A Researcher’s Handbook. Prentice-Hall.
- Winner (2017) Langdon Winner. 2017. Do artifacts have politics? In Computer Ethics, pages 177–192. Routledge.
- Xu et al. (2021) Albert Xu, Eshaan Pathak, Eric Wallace, Suchin Gururangan, Maarten Sap, and Dan Klein. 2021. Detoxifying language models risks marginalizing minority voices. In Conference of the North American Chapter of the Association for Computational Linguistics: Human Language Technologies, pages 2390–2397.
Appendix A Data
In this section, we describe all the decisions that went into sampling data points from the different datasets and its post-processing.
A.1 Sampling
For Social Chemistry, we sample instances whose label for anticipated agreement by the general public was “Controversial (0%)”. We ensure the samples are equally represented by the moral foundation label, which we compute based on majority vote across annotators. In the study, annotators respond whether they found a presented action socially acceptable.
For Dynahate, we randomly sample instances from rounds 3 and 4. In these rounds, annotators generated examples of implicit hate, which is subtler and harder to detect and could yield differences in annotations. We ensure that there are equal amounts of hateful and not hateful instances and that the types of targets of the hateful instances are equally represented. During the studsy, annotators respond whether they found a presented instance toxic.
For both social acceptability and hate speech detection, annotators responded whether they found the situation moral and whether they found the instance to be hate speech respectively.
A.2 Post-Processing
Because Social Chemistry has multiple annotations for each instance, we compute an aggregate score by taking the average score across annotators. This score is then used to correlate to the annotators’ aggregated scores.
Appendix B Study Design
In this section, we discuss the design of the LabintheWild experiments. The social acceptability task was released to the public in April 2022. The hate speech detection task was released August 2022. To reduce confounding factors on the data collection process, we conduct multiple user studies of the LabintheWild experiments prior to the public release. Additionally, all the annotations collected through the experiments are anonymous and are stored securely.
The social acceptability task is marketed as “Could you live with an AI and its morals?” Participants for this study provide annotations for 25 situations. The hate speech detection task is marketed as “Do you and AI agree on what is hate speech? Let’s find out!” Participants provid annotations for 15 instances.
B.1 LabintheWild Study Flow
We describe the format of the LabintheWild experiment. The phases of the experiment are: obtaining consent, collecting demographics, explaining instructions, collecting annotations, collecting study feedback, and displaying results.
Obtaining Consent
Prior to beginning the study, participants review a consent form. The consent form includes information on the purpose of the research, what the participant will do, risks and benefits of the research, privacy and data collection methods, and contact information of the researchers. At the end of the form, participants give explicit consent to participate in the study.
Collecting Demographics
We then collect the demographics of study participants. LabintheWild participants enter in whether they had taken this test before, the country they lived in the longest, the country of residence, age, native language, religion, education, and ethnicity. No demographics are required except for the country the participant lived in the longest and whether they have taken the test before. Additionally, we only display ethnicity for people within the United States.
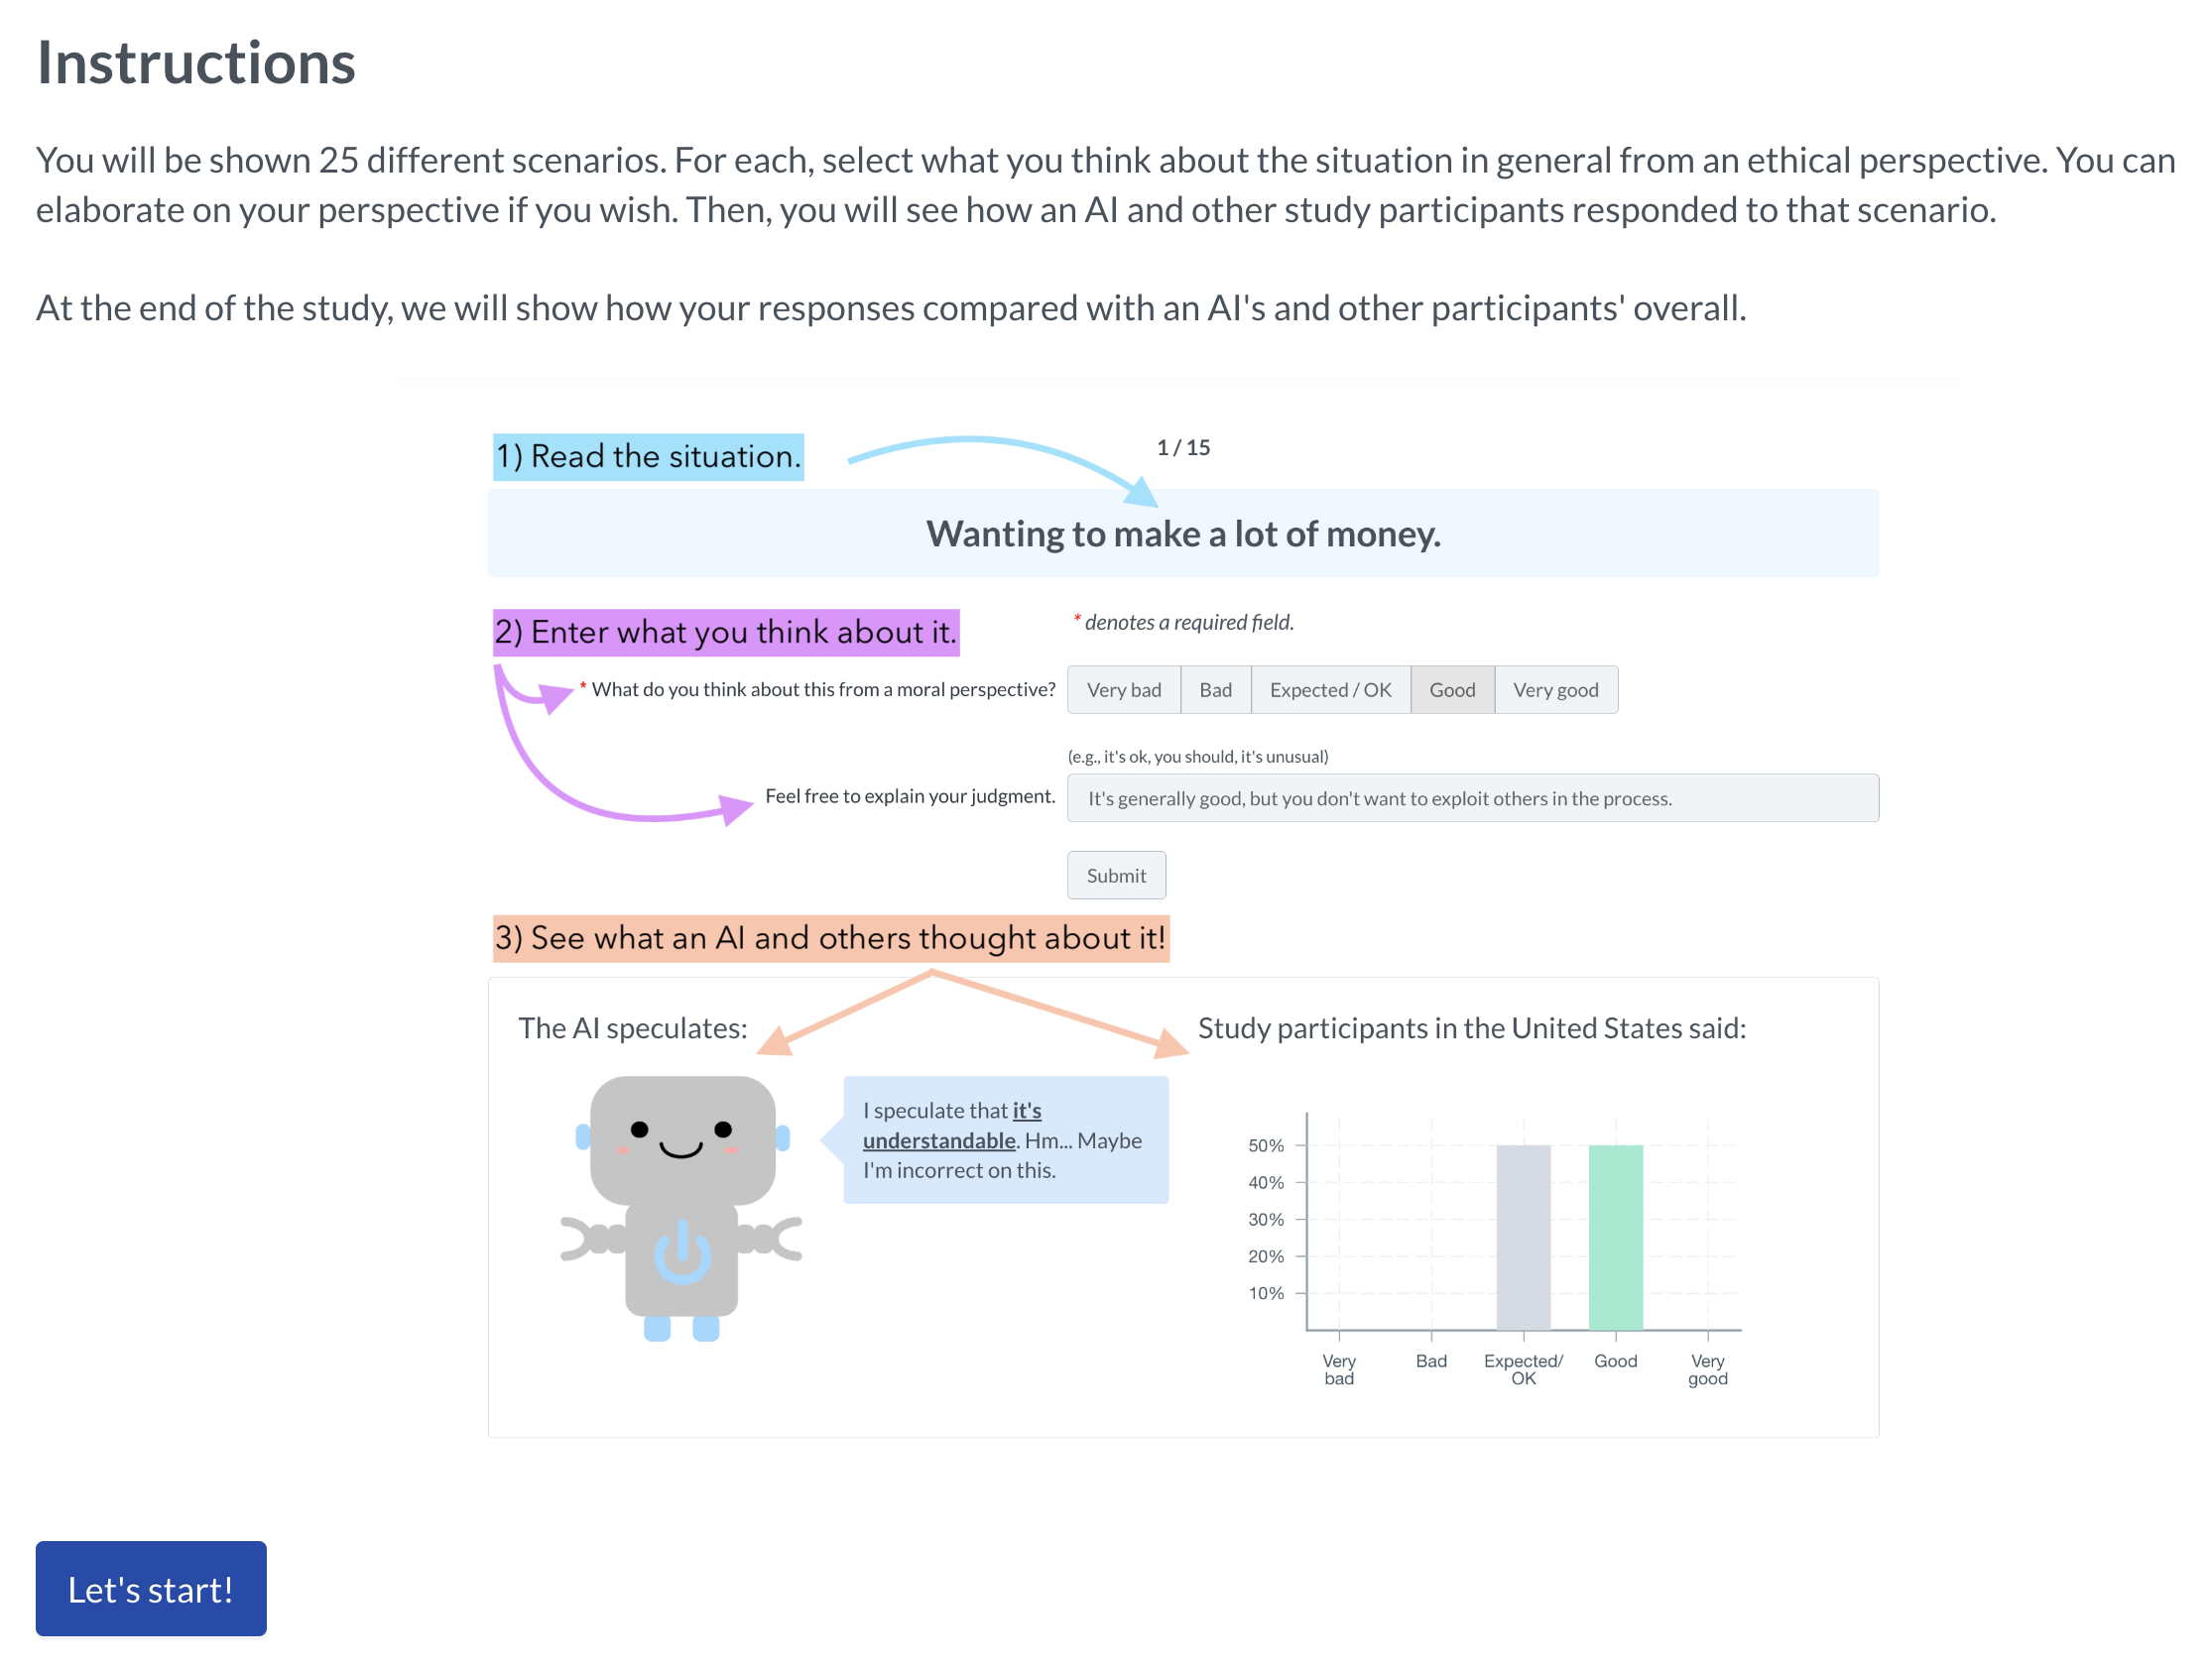
Explaining Instructions
For each task, we provide instructions to participants on how to perform the annotation task. For social acceptability, we explain social acceptability as rating “what you think about the situation in general from an ethical perspective” (see Figure 5). For hate speech detection, use the definition of hate speech from Dynahate and we provide three examples of hate speech (see Figure 6). We also present examples of negative sentiment, profanity, or discussing groups that could be confused as hate speech, but are not hate speech.
Collecting Annotations
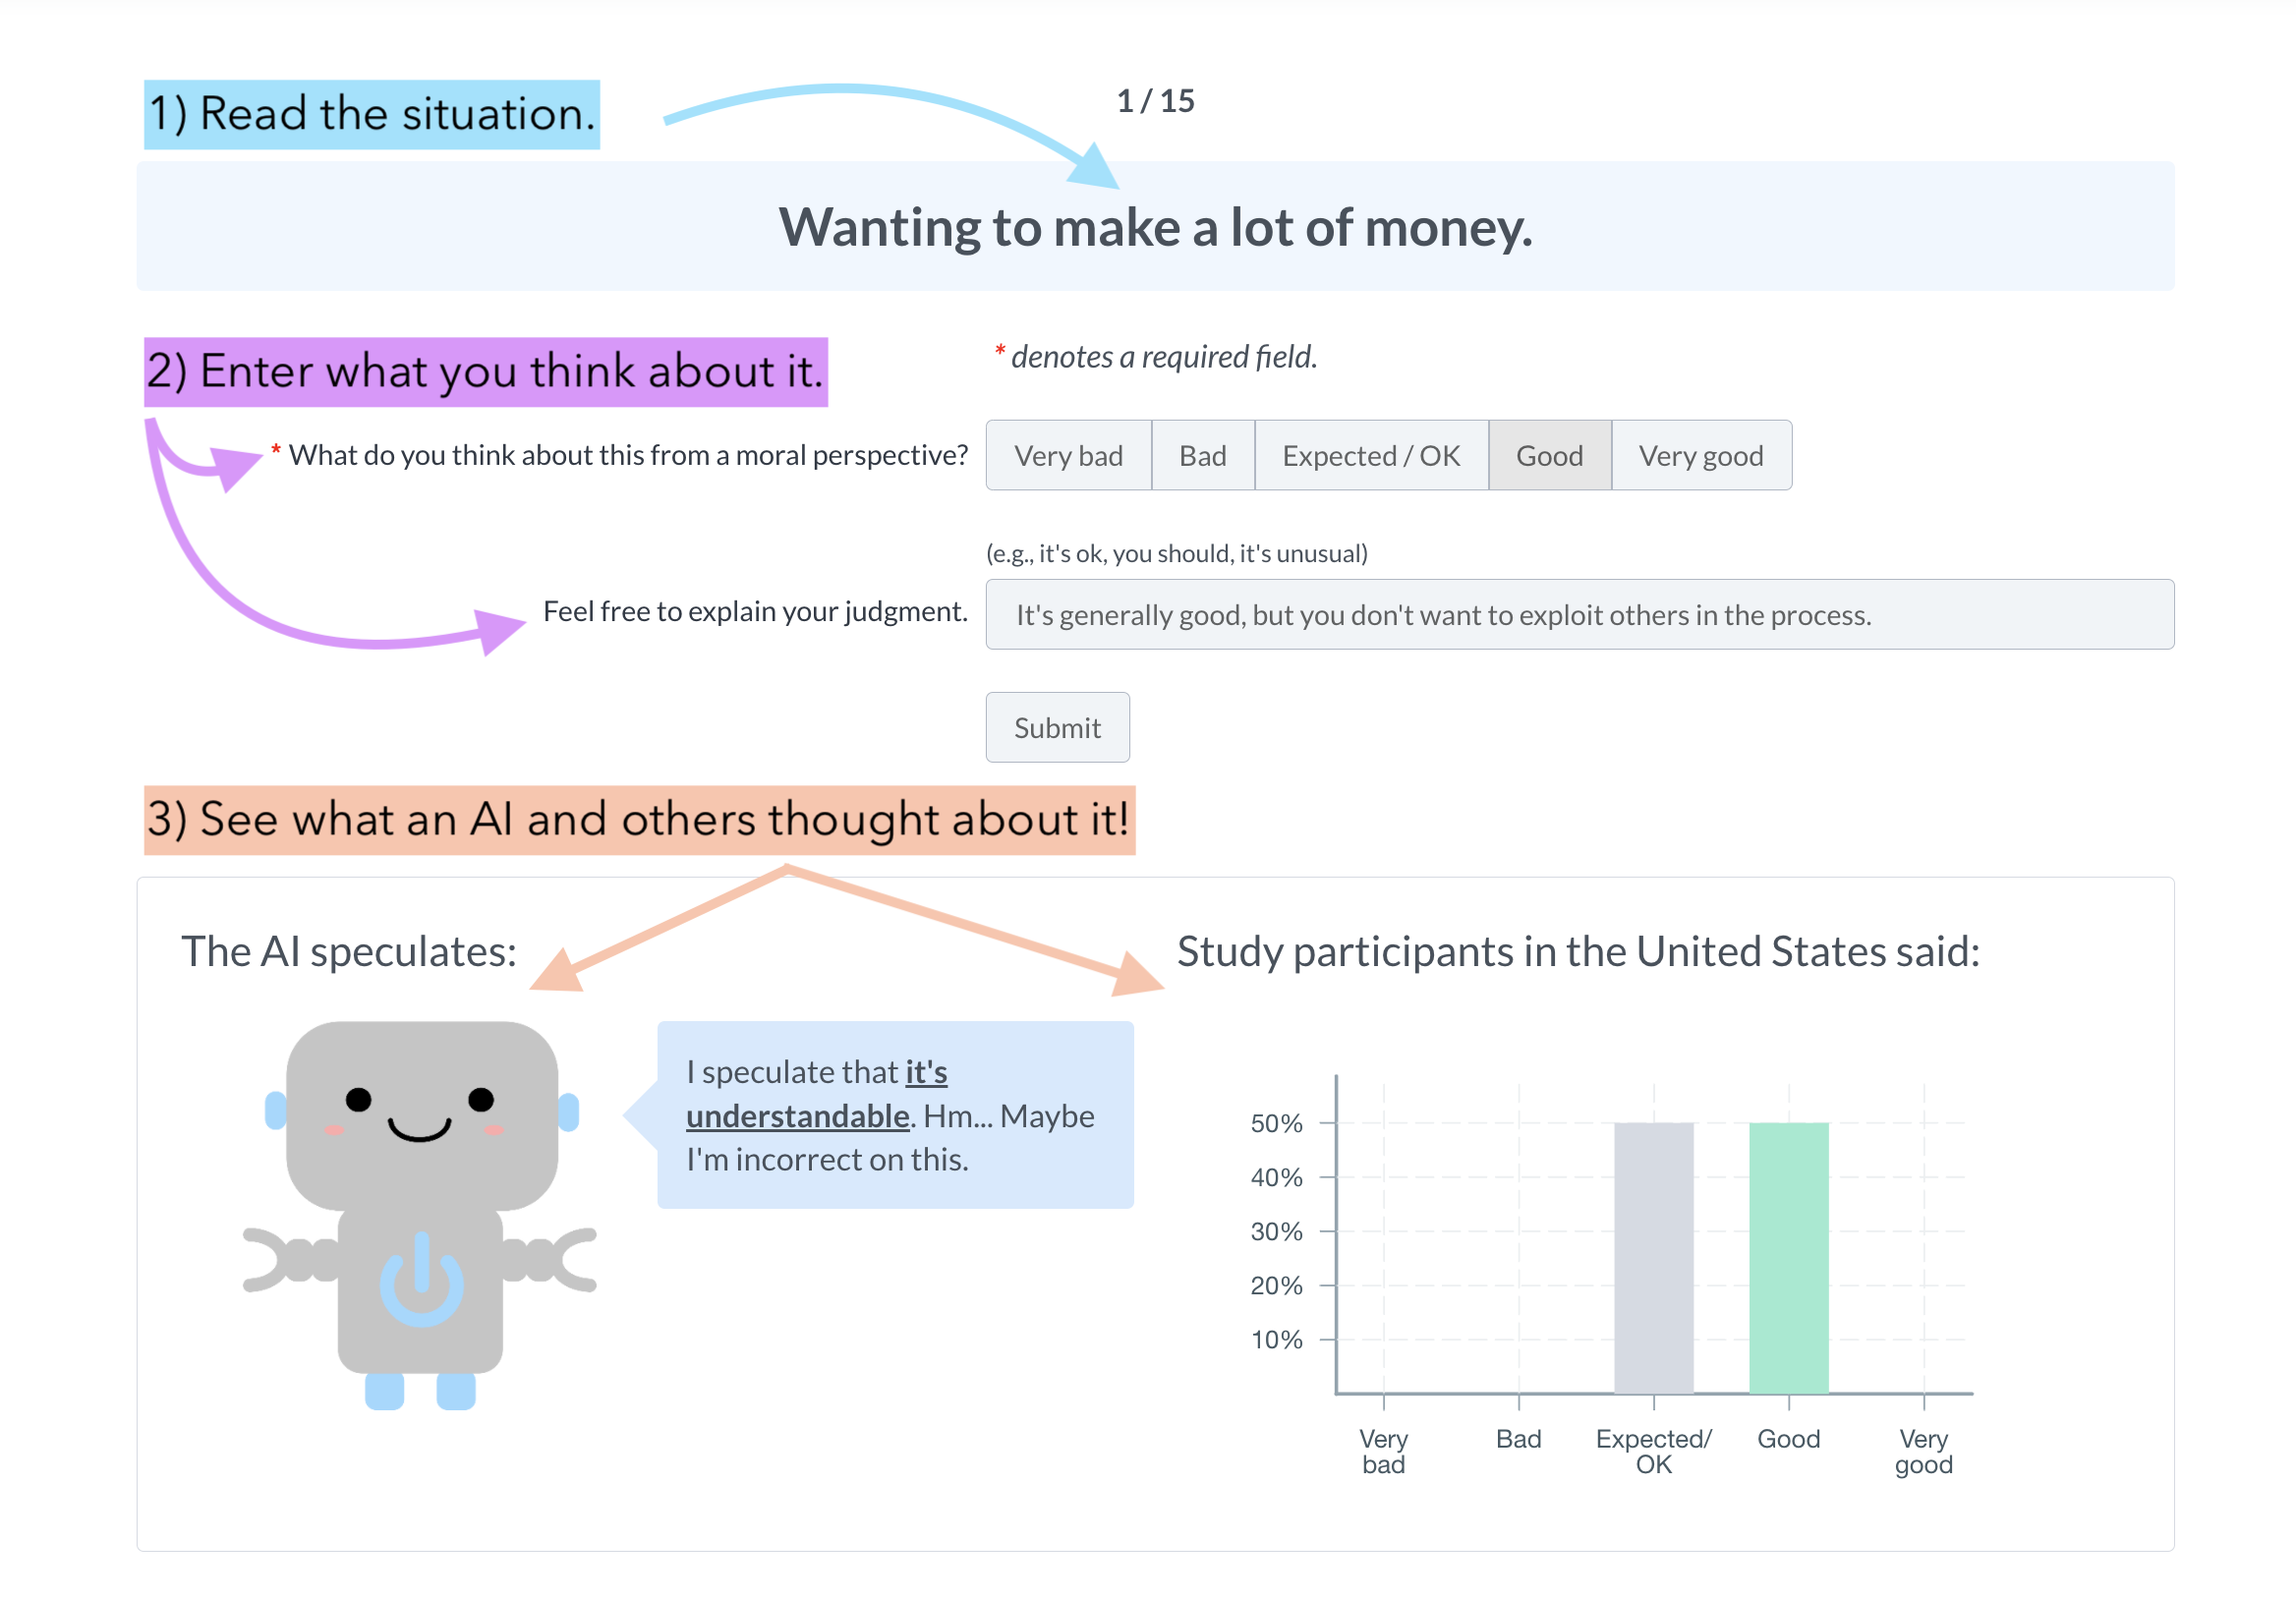
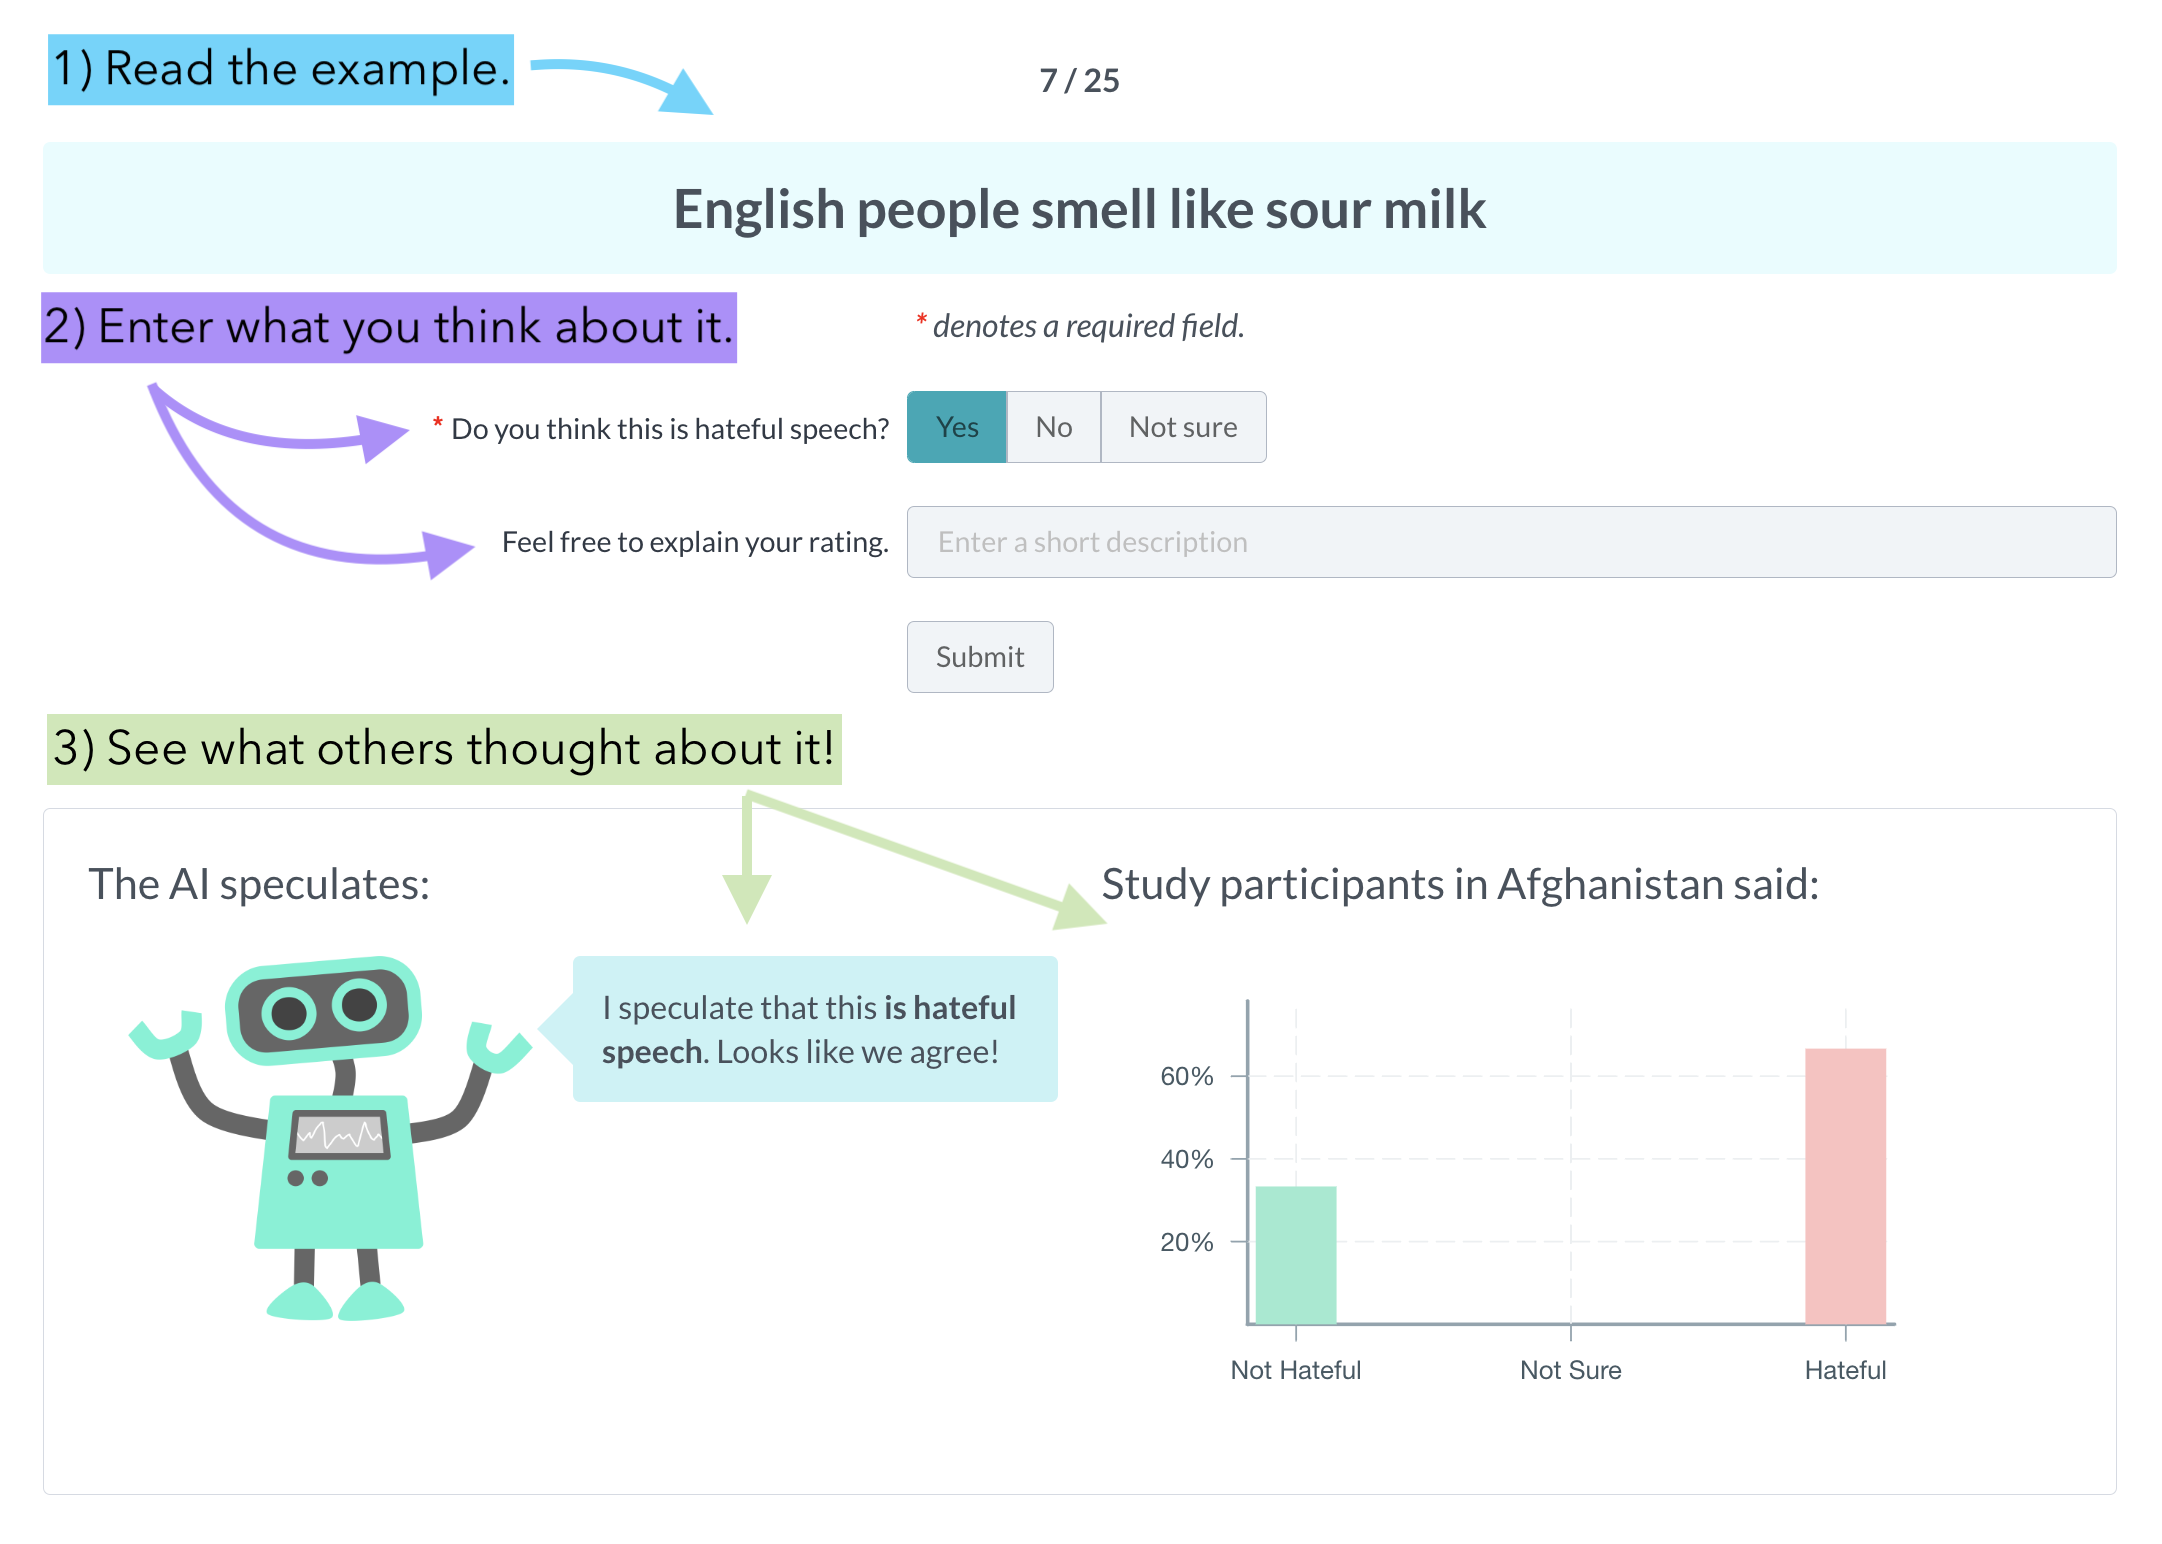
After being presented with instructions, participants begin data collection from the 300 instances selected from Section A.1. For each task, we keep the annotation setup identical to the original one. For social acceptability, we collect Likert-scale ratings of situations ranging from “It’s very bad”, “It’s bad”, “It’s okay”, “It’s good”, and “It’s very good”. Participants can provide rationale for their decision by using an open text box. The data collection interface is presented in Figure 4. For hate speech detection, we collect ratings of instances ranging from “Hate speech”, “Not sure”, “Not hate speech”. We also provide an optional open-text box for participants to explain their rationale. The data collection interface is presented in Figure 7. After submitting the annotation, the participant is able to see a visualization on how the AI responded as well as how other participants from the same country responded to the instance.
We also specifically sample which instances to present to participants for annotation. We sample a third of the instances that did not have any annotations from the demographic and a third that are already sampled by participants of the demographic. The rest are equally split across the different of types of instances (i.e., moral foundation for Social Chemistry, hate type for Dynahate).
Providing Study Feedback
Following typical LabintheWild experiment procedures, we collect feedback from participants about the study. Participants can enter open-text feedback on anything. They also submit whether they encountered technical difficulties during the study or whether they cheated. Participants can elaborate on their answers from the prior questions in an open-text box.
Displaying Overall Results
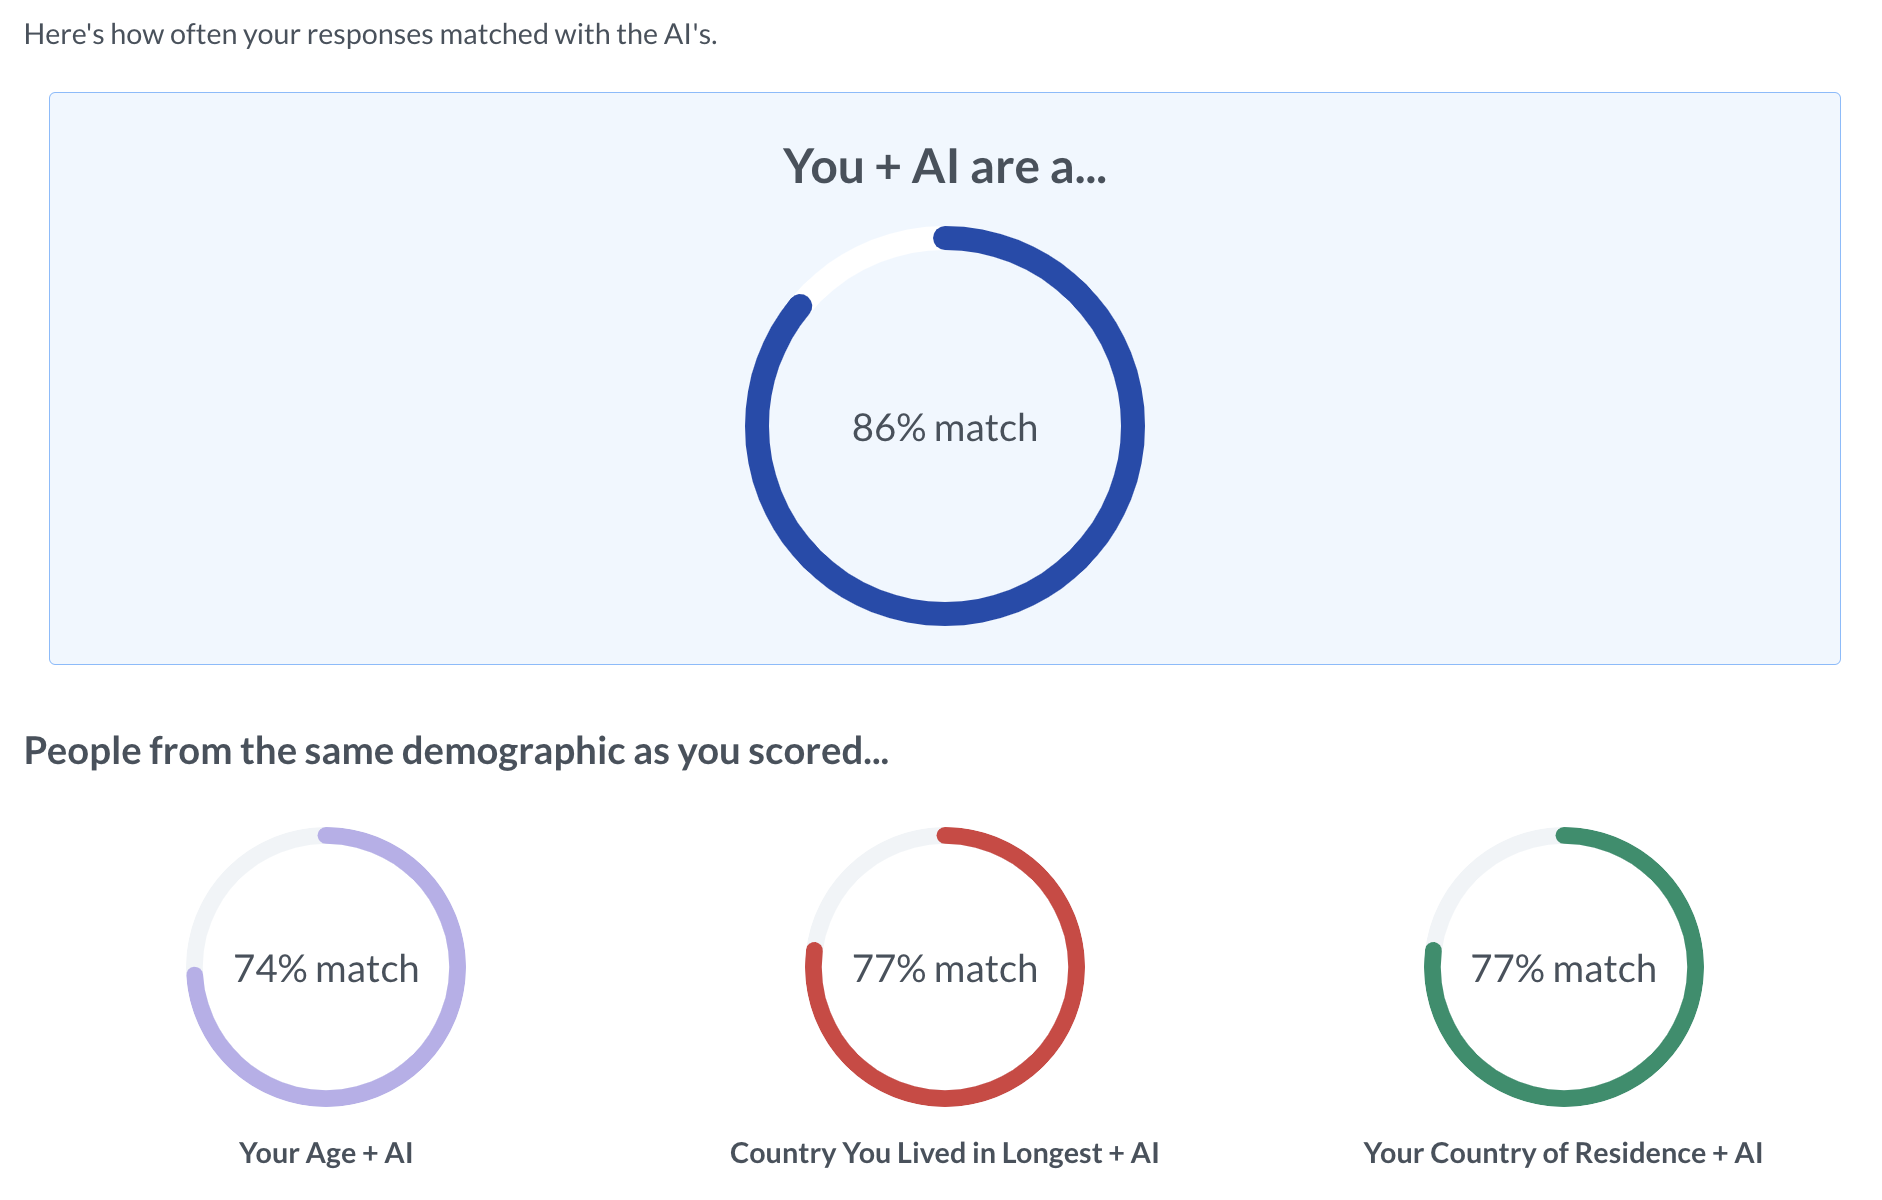
Finally, participants see their overall results for the experiment task. First, participants are presented with the percentage of time they agreed with the AI as well as with participants as the same demographic as them (see Figure 8). Each of these agreement scores are further broken down by the type of the instance (i.e., moral foundation for Social Chemistry and hate type for Dynahate).
Appendix C Additional Results
In this section, we report additional results from our analyses of the LabintheWild data.
C.1 p-values
We report the p-values from our analyses from Table 3.
| DATASETS: |
||||||||
| Demographic | -value ( = 2.04e-05) | |||||||
| Social Acceptability | Toxicity & Hate Speech | |||||||
|
|
|
|
|
|
|
|
|
|
| Country (Lived Longest) | ||||||||
| African Islamic | 1.74e-04 | 2.01e-03 | 4.40e-03 | 4.02e-03 | 2.37e-01 | 3.50e-03 | 3.28e-01 | 6.82e-01 |
| Baltic | 2.98e-06 | 7.11e-06 | 1.27e-05 | 1.00e+00 | 1.00e+00 | 1.00e+00 | 1.00e+00 | 4.34e-01 |
| Catholic Europe | 1.40e-09 | 1.98e-07 | 3.77e-11 | 2.21e-01 | 1.00e+00 | 2.01e-01 | 1.00e+00 | 1.00e+00 |
| Confucian | 5.23e-15 | 3.89e-07 | 1.58e-14 | 3.15e-03 | 1.00e+00 | 4.27e-04 | 1.00e+00 | 3.07e-04 |
| English-Speaking | 6.67e-55 | 4.12e-29 | 2.21e-49 | 3.31e-44 | 3.59e-07 | 8.74e-27 | 3.17e-09 | 5.38e-12 |
| Latin American | 2.50e-02 | 9.08e-02 | 1.52e-02 | 7.87e-01 | 1.00e+00 | 1.00e+00 | 1.00e+00 | 1.00e+00 |
| Orthodox Europe | 1.02e-06 | 2.42e-07 | 1.38e-10 | 1.37e-01 | 1.00e+00 | 3.34e-03 | 1.00e+00 | 1.00e+00 |
| Protestant Europe | 1.17e-14 | 2.18e-10 | 6.14e-16 | 1.15e-04 | 1.46e-02 | 5.09e-01 | 5.43e-02 | 5.07e-03 |
| West South Asia | 1.63e-09 | 2.10e-08 | 4.53e-08 | 3.30e-01 | 1.00e+00 | 4.34e-01 | 9.13e-01 | 1.00e+00 |
| Education Level | ||||||||
| College | 1.02e-50 | 1.19e-35 | 8.21e-41 | 8.96e-37 | 8.42e-08 | 7.75e-25 | 9.17e-10 | 8.75e-11 |
| Graduate School | 5.80e-44 | 1.97e-21 | 1.74e-39 | 9.60e-23 | 3.79e-04 | 4.51e-16 | 3.15e-03 | 4.12e-08 |
| High School | 9.32e-38 | 1.31e-21 | 4.85e-33 | 6.01e-24 | 2.74e-03 | 1.19e-14 | 4.48e-05 | 5.12e-08 |
| PhD | 4.16e-28 | 2.29e-18 | 4.32e-24 | 1.63e-09 | 5.54e-01 | 9.82e-08 | 2.54e-02 | 1.93e-03 |
| Pre-High School | 4.48e-17 | 8.53e-11 | 7.00e-20 | 2.25e-02 | 1.00e+00 | 8.06e-04 | 1.00e+00 | 1.43e-02 |
| Professional School | 2.19e-13 | 1.50e-09 | 3.50e-11 | 1.65e-12 | 1.00e+00 | 3.08e-03 | 1.00e+00 | 1.00e+00 |
| Ethnicity | ||||||||
| Asian, Asian American | 6.37e-35 | 2.04e-22 | 4.77e-31 | 1.85e-21 | 4.80e-07 | 1.46e-13 | 4.19e-06 | 9.54e-09 |
| Black, African American | 3.50e-24 | 8.08e-15 | 2.03e-20 | 8.82e-14 | 1.01e-03 | 6.16e-05 | 1.79e-03 | 2.34e-05 |
| Latino / Latina, Hispanic | 1.47e-19 | 8.00e-13 | 6.30e-14 | 6.39e-07 | 2.39e-05 | 5.23e-08 | 3.19e-03 | 3.26e-03 |
| Native American, Alaskan Native | 2.33e-07 | 3.11e-05 | 3.44e-09 | 1.00e+00 | 6.37e-01 | 6.72e-01 | 6.07e-01 | 4.81e-01 |
| Pacific Islander, Native Australian | 6.63e-04 | 1.38e-03 | 2.22e-03 | 1.00e+00 | 1.32e-02 | 1.77e-01 | 1.59e-02 | 1.01e-01 |
| White | 1.27e-48 | 4.94e-29 | 1.44e-42 | 4.51e-42 | 1.47e-05 | 2.00e-24 | 1.18e-06 | 8.31e-10 |
| Gender | ||||||||
| Man | 2.55e-47 | 2.19e-31 | 8.72e-41 | 1.99e-34 | 1.09e-07 | 3.55e-24 | 7.84e-08 | 1.46e-08 |
| Non-Binary | 3.61e-26 | 4.94e-18 | 1.14e-21 | 3.00e-16 | 1.64e-01 | 6.67e-06 | 8.00e-03 | 8.49e-04 |
| Woman | 7.04e-51 | 1.25e-27 | 1.76e-48 | 4.02e-33 | 6.36e-08 | 8.19e-22 | 4.27e-10 | 2.17e-09 |
| Native Language | ||||||||
| English | 8.54e-55 | 2.04e-33 | 1.91e-44 | 1.22e-44 | 3.38e-07 | 1.28e-29 | 2.10e-10 | 2.39e-12 |
| Not English | 1.04e-25 | 5.10e-18 | 1.05e-27 | 9.78e-11 | 1.58e-04 | 2.40e-07 | 1.93e-04 | 6.29e-06 |
| Age | ||||||||
| 10-20 yrs old | 5.54e-43 | 9.00e-29 | 1.46e-40 | 2.89e-29 | 1.85e-06 | 2.23e-22 | 7.63e-09 | 8.33e-09 |
| 20-30 yrs old | 5.35e-50 | 1.49e-36 | 1.23e-42 | 1.79e-34 | 1.22e-07 | 6.51e-24 | 5.61e-10 | 2.90e-12 |
| 30-40 yrs old | 2.71e-33 | 2.24e-18 | 7.56e-27 | 2.25e-10 | 1.00e+00 | 2.37e-07 | 4.49e-02 | 3.21e-03 |
| 40-50 yrs old | 2.48e-24 | 4.36e-18 | 2.98e-26 | 3.43e-16 | 1.49e-02 | 2.12e-12 | 5.43e-03 | 1.68e-04 |
| 50-60 yrs old | 9.40e-23 | 9.98e-12 | 4.58e-16 | 1.96e-10 | 1.49e-01 | 9.98e-05 | 1.00e+00 | 2.47e-01 |
| 60-70 yrs old | 4.85e-17 | 9.35e-09 | 1.92e-14 | 4.99e-01 | 1.00e+00 | 1.00e+00 | 1.00e+00 | 1.00e+00 |
| 70-80 yrs old | 5.14e-05 | 4.20e-04 | 3.91e-05 | 8.78e-01 | 1.00e+00 | 1.00e+00 | 1.00e+00 | 2.96e-05 |
| 80+ yrs old | 4.75e-01 | 9.08e-01 | 8.63e-02 | 1.00e+00 | 1.00e+00 | 1.00e+00 | 1.00e+00 | 1.00e+00 |
| Country (Residence) | ||||||||
| African Islamic | 2.01e-02 | 2.64e-02 | 4.28e-02 | 2.75e-01 | 1.00e+00 | 1.00e+00 | 1.00e+00 | 1.00e+00 |
| Baltic | 8.25e-03 | 8.25e-03 | 1.00e+00 | 1.00e+00 | 1.00e+00 | 1.00e+00 | 1.00e+00 | 1.66e-01 |
| Catholic Europe | 6.35e-08 | 3.01e-04 | 7.84e-13 | 1.68e-01 | 1.00e+00 | 1.82e-02 | 1.00e+00 | 1.00e+00 |
| Confucian | 3.36e-08 | 1.83e-04 | 1.35e-11 | 1.62e-01 | 4.59e-01 | 5.03e-02 | 8.55e-01 | 2.13e-02 |
| English-Speaking | 1.96e-53 | 8.43e-35 | 6.34e-48 | 7.43e-47 | 1.17e-07 | 2.65e-29 | 3.29e-10 | 6.96e-13 |
| Latin American | 1.14e-04 | 5.20e-05 | 7.76e-06 | 1.00e+00 | 1.00e+00 | 1.00e+00 | 1.00e+00 | 1.00e+00 |
| Orthodox Europe | 2.23e-03 | 1.60e-05 | 3.18e-06 | 1.00e+00 | 1.00e+00 | 4.34e-01 | 1.00e+00 | 1.00e+00 |
| Protestant Europe | 6.59e-18 | 5.21e-14 | 3.82e-16 | 3.23e-06 | 1.43e-02 | 3.54e-01 | 1.66e-02 | 1.21e-02 |
| West South Asia | 3.46e-08 | 8.91e-07 | 1.29e-05 | 1.89e-03 | 1.00e+00 | 3.46e-01 | 1.00e+00 | 1.00e+00 |
| Religion | ||||||||
| Buddhist | 7.42e-13 | 3.16e-10 | 7.78e-09 | 2.44e-02 | 1.00e+00 | 1.00e+00 | 1.00e+00 | 1.27e-02 |
| Christian | 3.47e-48 | 2.43e-22 | 9.04e-47 | 1.21e-22 | 1.66e-07 | 3.99e-17 | 3.03e-08 | 3.61e-07 |
| Hindu | 4.62e-14 | 3.57e-11 | 2.97e-10 | 1.12e-08 | 7.96e-02 | 6.02e-03 | 3.03e-01 | 1.89e-02 |
| Jewish | 8.32e-17 | 1.85e-13 | 4.97e-13 | 8.13e-11 | 1.95e-01 | 4.75e-04 | 1.89e-01 | 4.87e-02 |
| Muslim | 2.72e-14 | 1.81e-12 | 1.37e-20 | 7.50e-02 | 1.00e+00 | 1.00e+00 | 1.00e+00 | 1.00e+00 |
| Spritual | 9.75e-08 | 3.49e-07 | 3.56e-12 | 1.00e+00 | 1.00e+00 | 1.00e+00 | 1.00e+00 | — |
Appendix D Cultural Spheres
Division of countries can be done through continents. However, continents are often not representative of the countries within it and clustering based on them can lead to inaccurate findings. For example, Asia includes both Japan and Saudi Arabia, which are different culturally. We instead adopt cultural spheres as used in World Values Survey Haerpfer and Kizilova (2012), which clusters the countries in terms of the values they uphold and norms they follow. Table 4 shows the countries and the spheres.
| Cultural Sphere | Countries |
|---|---|
| African-Islamic |
Afghanistan, Albania, Algeria, Azerbaijan, Ethiopia, Indonesia, Iraq, Jordan, Morocco, Pakistan, Palestine, Qatar, Nigeria, Saudi Arabia, South Africa, Syrian Arab Republic, Tunisia, Turkey, United Arab Emirates, Uzbekistan
Burkina Faso, Bangladesh, Egypt, Ghana, Iran, Kazakhstan, Kyrgyzstan, Lebanon, Libya, Mali, Rwanda, Tajikistan, Tanzania, Uganda, Yemen, Zambia, Zimbabwe |
| Baltic | Estonia, Latvia, Lithuania, Åland Islands |
| Catholic-Europe |
Andorra, Austria, Belgium, Czech Republic, France, Hungary, Italy, Luxembourg, Poland, Portugal, Spain
Slovakia, Slovenia |
| Confucian |
China, Hong Kong, Japan, South Korea, Taiwan
Macao |
| English-Speaking | American Samoa, Australia, Canada, Guernsey, Ireland, New Zealand, United Kingdom, United States |
| Latin-America |
Argentina, Brazil, Colombia, Dominican Republic, Mexico, Philippines, Trinidad and Tobago, Venezuela
Bolivia, Chile, Ecuador, Guatemala, Haiti, Nicaragua, Peru, Puerto Rico, Uruguay |
| Orthodox-Europe |
Belarus, Bosnia, Bulgaria, Cyprus, Georgia, Greece, Moldova, Romania, Russia, Serbia, Ukraine
Armenia, Montenegro, North Macedonia |
| Protestant-Europe | Denmark, Finland, Germany, Iceland, Netherlands, Norway, Sweden, Switzerland |
| West-South-Asia |
India, Israel, Malaysia, Myanmar, Singapore, Vietnam
Thailand |