The surface composition of six newly discovered chemically peculiar stars.
Comparison to the HgMn stars Lep and Scl and the superficially normal B star Cap
Abstract
We report on a detailed abundance study of six bright, mostly southern, slowly rotating late B stars: HD 1279 (B8III), HD 99803 (B9V), HD 123445 (B9V), HD 147550 (B9V), HD 171961 (B8III) and HD 202671 (B5II/III), hitherto reported as normal stars. We compare them to the two classical HgMn stars Lep and Scl and to the superficially normal star, Cap. In the spectra of the six stars, the Hg II line at 3984 Å line is clearly seen and numerous lines of P, Ti, Mn, Fe, Ga, Sr, Y, and Zr appear to be strong absorbers. A comparison of newly acquired and archival spectra of these objects with a grid of synthetic spectra for selected unblended lines reveals large overabundances of P, Ti, Cr, Mn, Sr, Y, Zr, Ba, Pt and Hg and underabundances of He, Mg, Sc and Ni. The effective temperatures, surface gravities, low projected rotational velocities and the peculiar abundance patterns of the six investigated stars show that they are new chemically peculiar stars, mostly new HgMn stars, and are reclassified as such. The evolutionary status of these stars has been inferred and their ages and masses estimated. The two most massive objects, HD 1279 and HD 202671, might have evolved away from the main-sequence recently, the other stars are main-sequence objects. HD 99803A is a sharp lined HgMn star with grazing eclipses; from TESS and MASCARA photometry we determine an orbital period of d.
=13
1 Introduction
The bright southern stars HD 99803 (HR 4423, B9V, ), HD 123445 (HR 5294, B9V, ), HD 147550 (HR 6096, B9V, ), HD 171961 (HR 6990, B8III, ) and HD 202671 (HR 8137, B5II/III, ) have received little attention for their brightnesses: only 38, 57, 93, 35 and 79 references respectively can be found in SIMBAD for these stars.
We have recently undertaken a spectroscopic survey of all apparently slowly rotating late B stars (B8 – B9V) brighter than magnitude 7.0 and observable in the southern hemisphere which have km s-1 and . We have added to these objects the northern star HD 1279 (HR 62, B8III, 53 references in SIMBAD) for which we obtained discretionary time at Observatoire de Haute Provence in January 2019.
This project addresses some fundamental questions of the physics of late-B stars: i) Is our census of Chemically Peculiar (CP) stars complete up to the magnitude limits we adopted? If not, what are the physical properties of the newly found CP stars? ii) Can we find new instances of rapid rotators seen pole-on (other than Vega) and study their physical properties (gradient of temperature across the disk, limb and gravity darkening)?
Royer et al. (2014) carried out a similar exercise on a sample of 47 apparently slowly rotating A0 – A1V stars in the northern hemisphere which satisfy km s-1 and . Abundance analyses of selected lines allowed them to sort these stars into 3 groups: 13 chemically peculiar stars (among which 4 were new CPs), 17 superficially normal stars and 17 spectroscopic binaries (Royer et al. 2014). Monier et al. (2015) reported on a first analysis of the abundances of Fe, Mn and Hg and showed that four members of that sample: HD 30085, HD 18104, HD 32867 and HD 53588 are four newly discovered HgMn stars. Monier et al. (2018) have shown that HR 8844 is a new CP star, possibly an intermediate object between the Am and HgMn stars. Monier et al. (2019) provide a detailed abundance analyses of HD 30085 and HD 30963 which highlight the HgMn status of these 2 stars.
In this paper we report on abundance analyses from high resolution, high signal-to-noise, optical range échelle spectra of HD 1279 and five stars of the southern sample, HD 99803, HD 123445, HD 147550, HD 171961 and HD 202671. We also derive elemental abundances of Lep (HR 1702, HD 33904) and Scl, (HR 8937, HD 221507) two classical HgMn stars, which we use as comparison stars. We also use Cap (HR 7773, HD 193432), a superficially normal B9 V star, as a comparison.
Using model atmospheres and line synthesis, we derive for the first time the abundances of up to forty chemical elements in these six stars and find that they depart strongly from solar. The overabundances of Mn, Sr, Y, Zr, Pt and Hg and the underabundances of He, Mg, Sc and Ni establish that these stars are newly discovered CP stars, mostly new HgMn or PGa stars, whose atmospheres respectively harbour overabundances of manganese and mercury and overabundances of phosphorus and gallium.
The paper is divided into seven sections. The first section recapitulates results from previous spectroscopic work on HD 1279 (HR 62), HD 99803 (HR 4423), HD 123445 (HR 5294), HD 147550 (HR 6096), HD 171961 (HR 6990) and HD 202671 (HR 8137), the second section describes new or archival spectroscopic observations of the eight stars. In the third section, we present the derivation of fundamental parameters, the modelling of the evolution of these new CP stars, including radiative diffusion and rotational mixing, and we provide estimates of their masses and ages. In the fourth section, we present frequency analyses of the recent lightcurves of these stars obtained with the Transiting Exoplanet Survey Satellite, Ricker et al. (2015) and we derive a rotational period when feasible. In section 5, we discuss the model atmosphere analyses and the computations of synthetic spectra and, in section 6, the determination of elemental abundances for each star. In the conclusion, we discuss the chemical peculiarity of the six newly discovered chemically peculiar stars in the light of what is known of other HgMn stars.
2 Previous spectroscopic work on HD 1279, HD 99803, HD 123445, HD 147550, HD 171961, HD 202671, Lep and Scl
HD 1279 (HR 62) was ascribed a spectral type B7II by Garrison & Gray (1994). This star does not have a Renson nor a CCDM number: it was not previously known to be a chemically peculiar star or a spectroscopic binary. HD 99803 (HR 4423) is a visual binary with 13 arcsec separation. Corbally (1984) classified HD 99803A as B9IV and HD 99803B as Am: kA3hA5VmA7 (meaning a marginal Am star); Monier et al. (2020) found HD 99803A to be a new HgMn star. HD 99803B, is fainter () and cooler than HD 99803A; the lines of the two components are clearly separated in the HARPS spectrum we have used). HD 123445 (HR 5294) is CCDM J14089-4328A, the other member of the system is much fainter and cooler (). We see no signs of this companion in the spectra we analysed. HD 123445A (HR 5294) does not have any Renson member. HD 171961 (HR 6990) has neither a CCDM nor a Renson number. HD 147550 (HR 6096) is Renson 41660, it is classified as a B9 He-weak star. HD 202671 (HR 8137) is Renson 56480 and is classified as a B7 He-weak Mn star. Takeda et al. (2014) derived the abundance of sodium and iron for this star, and Leone & Manfre (1997) derived the effective temperature. No extensive abundance study (i.e., for several elements) has been published for any of these six stars.
In contrast, the abundances of Lep (HR 1702) and Scl (HR 8937) have been well studied. General abundance analyses of Lep and Scl can be found in Adelman & Pintado (1997) and Thiam et al. (2010), respectively. Other works focus on the determination of the abundance of one element in several HgMn stars, they are collected in Table 1.
| Chemical element(s) | Reference | star |
|---|---|---|
| Sr, Y | Dworetsky et al. (2008) | Lep and Scl |
| Xe | Dworetsky et al. (2008) | Lep and Scl |
| Ca | Cowley et al. (2007) | Lep |
| Castelli & Hubrig (2004) | Scl | |
| Ga | Nielsen et al. (2005) | Lep |
| Dworetsky et al. (1998) | Lep and Scl | |
| Smith (1996) | Lep and Scl | |
| Lanz et al. (1993) | Scl | |
| Hg | Dolk et al. (2003) | Lep and Scl |
| Woolf & Lambert (1999) | Lep | |
| Smith (1997) | Scl | |
| Cr | Savanov & Hubrig (2003) | Lep |
| Ne | Dworetsky & Budaj (2000) | Lep |
| N | Roby et al. (1999) | Lep |
| Mn | Jomaron et al. (1998) | Lep and Scl |
| O | Takeda et al. (1999)) | Lep |
| Cu, Zn | Smith (1994) | Lep and Scl |
| Fe-peak | Smith & Dworetsky (1993) | Lep and Scl |
| Adelman et al. (1993) | Lep | |
| Mg, Al, Si | Smith & Dworetsky (1993) | Lep and Scl |
| C, N, O | Roby & Lambert (1990) | Lep |
| C | Catanzaro & Leone (2002) | Scl |
3 Observations
For the comparison stars Lep (HR 1702) and Scl (HR 8937), we have used archival FEROS spectra (Fiber-fed Extended Range Optical Spectrograph , R = 48000 111https://www.eso.org/sci/facilities/lasilla/instruments/feros.html) with good signal-to-noise ratios. The spectra that we use were retrieved from the ESO Spectral archive 222http://archive.eso.org/wdb/wdb/adp/phase3_spectral/form.
For the northern star HD 1279 (HR 62), one high resolution spectrum was obtained in service observing at Observatoire de Haute Provence with SOPHIE 333http://www.obs-hp.fr/guide/sophie/sophie-eng.shtml, the échelle spectrograph in its high resolution mode () yielding a full spectral coverage from 3820 Å to 6930 Å in 39 orders. A detailed technical description of SOPHIE is given in Perruchot et al. (2008). SOPHIE is a cross-dispersed, environmentally stabilized échelle spectrograph dedicated to high precision radial velocity measurements. The spectra are extracted online from the detector images using a specific pipeline adapted from that of HARPS (High Accuracy Radial Velocity Planet Searcher 444https://www.eso.org/sci/facilities/lasilla/instruments/harps.html).
HD 171961 (HR 6990) was observed five times using the High Resolution Spectrograph (HRS555https://astronomers.salt.ac.za/instruments/hrs/, Crause et al. 2014) behind the 11-m Southern African Large Telescope (SALT 666https://astronomers.salt.ac.za/). We have coadded the individual spectra. The SALT HRS is a dual-beam (370-550 nm & 550-890 nm) fibre-fed, white-pupil, échelle spectrograph, employing VPH gratings as cross dispersers. The cameras are all-refractive. SALT HRS is an efficient single-object spectrograph using pairs of large (350 m and 500 m; 1.6 and 2.2 arcsec) diameter optical fibers, one for the star and one for background sky. Three of the pairs feed image slicers before injection into the spectrograph, which delivers in its highest resolution mode a resolving power of (sliced 350 m fibres). A single 2k 4k CCD captures all of the blue orders, while a 4k 4k detector, using a fringe-suppressing deep-depletion CCD, is used for the red camera.
For the four remaining stars, HD 99803 (HR 4423), HD 123445 (HR 294), HD 147550 (HR 6096) and HD 202671 (HR 8137), we have used FEROS or HARPS archival spectra.
The observing dates, exposure times and signal-to-noise ratios at 5000 Å of the spectra are collected in Table 2. When several spectra were available for one star, we have used the spectrum with the highest signal-to-noise ratio. In all cases, we have used the one dimensional spectrum provided by the project.
| Star ID | Observation | Instrument | R | Exposition | S/N |
| Date | Time [s] | ||||
| Lep | 08/12/2011 | FEROS | 48000 | 60 | 517 |
| 21/12/2019 | HRS | 65000 | 60(V)+50(NIR) | 450 | |
| Scl | 21/10/2005 | FEROS | 48000 | 60 | 387 |
| 21/12/2019 | HRS | 65000 | 120(V)+80(NIR) | 400 | |
| HD 1279 | 14/01/2019 | SOPHIE | 75000 | 1200 | 209 |
| HD 99803 | 29/04/2019 | HRS | 65000 | 144(V)+118(NIR) | 200 |
| 07/04/2009 | HARPS | 115000 | 200 | 305 | |
| HD 123445 | 02/02/2010 | FEROS | 48000 | 450 | 277 |
| HD 147550 | 24/03/2006 | UVES | 40970 | 25 | 278 |
| 24/03/2006 | UVES | 40970 | 25 | 278 | |
| HD 171961 | 26/07/2019 | HRS | 65000 | 206(V)+155(NIR) | 220 |
| 27/07/2019 | HRS | 65000 | 206(V)+155(NIR) | 320 | |
| 28/07/2019 | HRS | 65000 | 206(V)+155(NIR) | 190 | |
| 18/08/2019 | HRS | 65000 | 206(V)+155(NIR) | 230 | |
| 19/08/2019 | HRS | 65000 | 206(V)+155(NIR) | 240 | |
| HD 202671 | 21/08/2013 | FEROS | 48000 | 600 | 457 |
4 Evolutionary status and rotational periods determination
4.1 Fundamental parameters
The fundamental data for HD 1279 (HR 62), HD 99803A (HR 4423), HD 123445 (HR 5294), HD 147550 (HR 6096), HD 171961 (HR 6990), HD 202671 (HR 8137), Scl (HR 8937) and Lep (HR 1702) are collected in Table 3. The spectral type retrieved from SIMBAD appears in row 2 and the apparent magnitudes in row 3, the Strömgren indexes , and in rows 4, 5, 6. The photometric data were taken from Hauck & Mermilliod (1998).
For all stars, the effective temperature () and surface gravity () were determined using the UVBYBETA code developed by Napiwotzki et al. (1993). They are collected in rows 7 and 8. This code is based on the Moon & Dworetsky (1985) grid, which calibrates the photometry in terms of and . The estimated errors on and , are 125 K and 0.20 dex, respectively (see Sec. 4.2 in Napiwotzki et al. 1993).
The radial velocities were derived by cross-correlating Fe II lines with very accurate wavelengths from NIST in the range Å with a synthetic spectrum computed for the derived effective temperature and surface gravity of the star and solar abundances. A parabolic fit to the upper part of the resulting cross-correlation function yields the Doppler shift, which is then used to shift spectra to rest wavelengths. The projected rotational velocities were derived from the position of the first zero of the Fourier transform of individual lines; they are taken from Royer et al. (2014). The radial velocity, the microturbulent velocity and projected equatorial velocity are collected in rows 8, 9 and 10 in Table 3.
| HD 1279 | HD 99803 | HD 123445 | HD 147550 | HD 171961 | HD 202671 | Scl | Lep | ||
| Sp.T. | B8III | B9V | B9V | B9V | B8III | B5II/III | B9.5III | B9IV | |
| 5.852 | 5.136 | 6.170 | 6.241 | 5.772 | 5.383 | 4.370 | 3.290 | ||
| -0.020 | -0.012 | -0.016 | 0.059 | 0.032 | -0.048 | -0.046 | -0.043 | ||
| 0.092 | 0.122 | 0.109 | 0.109 | 0.074 | 0.096 | 0.125 | 0.106 | ||
| 0.588 | 0.944 | 0.746 | 1.035 | 0.558 | 0.547 | 0.677 | 0.653 | ||
| [K] | |||||||||
| log | (cgs) | ||||||||
| [km s-1] | 28.0 | 8.0 | 66.0 | 4.8 | 55.0 | 25.0 | 26.0 | 18.0 | |
| [km s-1] | 0.0 | 0.1 | 0.2 | 0.70 | 0.0 | 0.9 | 0.0 | 0.0 | |
| [km s-1] | -9.20 | 3.0 | -2.0 | -24.0 | -33.0 | -12.50 | 0.40 | 27.10 | |
| [M⊙] | |||||||||
| (Myr) | |||||||||
| Phase | SG/MS | MS | MS | MS | MS | SG/MS | MS | MS |
4.2 Evolutionary status and mass and age determinations
To estimate the mass and age of the stars, we used the SPInS stellar model optimization tool (Lebreton & Reese, 2020). SPInS uses a Bayesian approach to find the probability distribution function of stellar parameters from a set of constraints. At the heart of the code is a Markov Chain Monte Carlo solver coupled with interpolation within a pre-computed stellar model grid. Here, we used the BaSTI-IAC grid of stellar models (Hidalgo et al., 2018). This grid is for a solar-scaled heavy element distribution with the solar mixture taken from Caffau et al. (2011) complemented by Lodders (2010), which corresponds to . The grid considers convective core overshooting included as an instantaneous mixing between Schwarzschild’s convective limit up to layers at a distance from it, where is the pressure scale height at the Schwarzschild limit. Neither microscopic diffusion, nor rotation are taken into account. We considered as prior, Salpeter (1955)’s initial mass function.
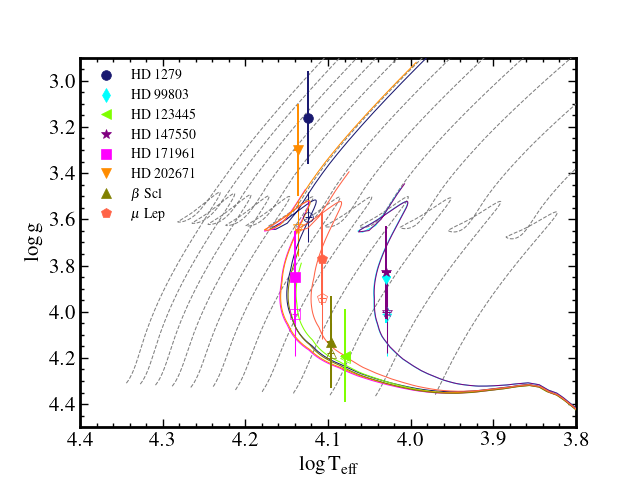
We estimate the age and mass of each star on the basis of the Kiel diagram observational constraints, that is effective temperature and surface gravity . We assume that the initial metallicity of the stars is close to solar, i.e. dex. We provide the inferred mean ages and masses and their errors in Table 3. The positions of the stars in the Kiel diagram are plotted in Fig. 1, together with isochrones of age and metallicity inferred by SPInS. The figure also shows BaSTI-IAC stellar evolutionary tracks of solar metallicity with masses increasing, from right to left, from to , by steps of .
The six stars are found to be young with ages between and Myr and masses in the range . For each couple of stars (HD 99803A (HR 4423), HD 147550 (HR 6096)) and (HD 123445 (HR 5294), Scl (HR 8937)), stars have very close Kiel diagram parameters so that their ages and masses are very close. These stars lie on the main sequence and so do HD 171961 (HR 6990) and Lep (HR 1702). For stars HD 1279 (HR 62) and HD 202671 (HR 8137), the situation is less clear. Considering the observed parameters, the stars are expected to be on the subgiant branch but the SPInS inference places them close to the terminal age main sequence (TAMS) with surface gravities lower than the observed ones and error bars that do not overlap. More generally, it is interesting to note that for all stars but two (HD 123445 (HR 5294) and Scl (HR 8937)), SPInS can find a solution corresponding to the observed effective temperature but for a -value higher than the observed one. It is difficult to identify the exact reason of the disagreement. On the theoretical side, these rather massive stars have very probably experienced rotation in the previous phases of their evolution, as well as microscopic diffusion and radiative accelerations on chemical elements. Rotation and gravitational settling bring fresh fuel to the H-burning core which impacts the age-dating and enlarges the main sequence. Concerning rotation, it has been shown by Ekström et al. (2012) that rotation combined with a moderate amount of overshooting () have similar effects on the main sequence width than compared with overshooting alone but with which is the amount considered in the BaSTI grids. Concerning diffusion, we calculated the evolution on the MS of a star of mass with the cestam code including microscopic diffusion and radiative accelerations (Morel & Lebreton, 2008; Marques et al., 2013; Deal et al., 2018) and checked that it has no impact for these stars. A precise modeling of each star is very demanding and is therefore beyond the scope of this work, in particular because, on the observational side, the error on the values of is quite high which hampers a precise characterization of these stars.
5 Analysis of photometric data
5.1 Analysis of the photometric TESS and MASCARA data of HD 99803 (HR 4423)
5.1.1 Frequency analysis of the TESS data- HD 99803 (HR 4423)
HD 99803 (TIC 163204899; HR 4423) was observed by TESS in Sector 10 in 2-min cadence. The data are available in both SAP (simple aperture photometry) and PDCSAP (presearch-data conditioning SAP); we used the PDCSAP data for our analysis, converting intensity to magnitudes. The data have a time span of 24.96 d with a centre point in time of , and comprise 15992 data points, after clipping 51 outliers, which are probably the result of cosmic ray strikes (including solar radiation).
There is also a 2.6-d gap in the data at the time of perigee. The TESS orbit is a lunar-synchronous eccentric orbit with an orbital period of half the sidereal orbital period of the moon. This keeps the satellite from being perturbed significantly at apogee, and allows for higher bandwidth data downloads at perigee. The gap in the data thus comes during the data transfers.
Fig. 2 shows the light curve of the Sector 10 data where an eclipse is obvious. This eclipse was also noted by Kochukhov et al. (2021). The bottom panel of the figure shows a higher time resolution of the eclipse. HD 99803 (HR 4423) was observed again by TESS in Sector 36, two years later, in 10-min cadence, and another eclipse was observed. The S36 data are from Full Frame Images and the star was close to an edge in this sector, making extraction of the data problematic. Nevertheless, with assistance from Tibor Mitnyan (private communication) who used Andras Pál’s FITSH package (Pál, 2012), we were able to extract a time for the eclipse. We discuss the eclipses and the orbital period inferred from them in the next subsection.


The S10 data were analysed using a fast Discrete Fourier Transform (Kurtz, 1985) to produce an amplitude spectrum (Fig. 3). There is no evidence of any p mode pulsations out to the Nyquist frequency near 360 d-1 (not shown). In the low frequency range where g modes occur there is no peak that cannot be ascribed to instrumental variations. Hence there is also no evidence of g modes. Comparison with the instability strips of Zdravkov & Pamyatnykh (2008) show that HD 99803A (HR 4423) is too cool to be either a Cep star or an SPB star. There is a small peak at 0.6 d-1 that may appear to be of interest, but when dividing the data into two subsets, this peak is most evident in the second half of the data set, so it is not convincing as a pulsation frequency.
HD 99803A and B fall within one pixel in TESS observations. The problem of HD 99803A lying near to a chip edge in the S36 FFI data may indicate that HD 99803B actually contributed more of the combined light. This could have resulted in an apparently shallower eclipse, which we judge to be an artefact. There are also some low-amplitude Sct pulsations visible in the FT of the S36 data in the frequency range d-1. These very probably arise from the marginal Am star HD 99803B, which lies within the Sct instability strip. Many marginal Am stars are known to pulsate (Smalley et al., 2017).These data do not warrant further analysis at present; HD 99803 (HR 4423) will be observed again during TESS S63at, at that time the eclipse depth and p-mode pulsations can be examined further.

5.1.2 Eclipses Observed with TESS
The TESS Sector 10 eclipse occurred at BJD = , while a second eclipse was detected in Sector 36 at BJD = . There are no TESS observations in between these two sectors, which are separated by two years. The difference between these two times of eclipse is days. Therefore in the absence of any perturbing effects on the binary orbit, the orbital period is days.
The eclipse depths are about 4% deep. For an equatorial occultation by the companion star, the inferred size of the companion star is approximately 20% of the radius of HD 99803A. Given that the latter is about 3 R⊙, this implies a companion radius of roughly 0.6 R⊙. If so, this close companion would be orders of magnitude fainter than HD 99803A, and would not be expected to contribute noticeably to its spectrum. There would also be no readily detectable secondary eclipse.
Another consideration is that HD 99803A and B are co-moving Gaia stars where component B is 2.6 magnitudes fainter than component A in , with a 13 arcsec separation, which is some 2500 AU on the plane of the sky. This fainter star is contained within the photometric aperture of HD 99803. However, if the eclipses were actually hosted by this co-moving companion, then the actual eclipse depth would be close to 50%. That is highly implausible.
5.1.3 Analysis of the MASCARA photometry
We are also fortunate to have MASCARA coverage of this star over a nearly 6-year interval. MASCARA (Multi-site All-Sky CAmeRA; Talens et al. (2017)) and bRing (Stuik et al., 2017) have observed HD 99803 (HR 4423) since early 2017, providing 163,000 photometric data points, each representing a set of 50 exposures of 6.4 s. After filtering the data, 115,000 data points were used for further analysis. MASCARA and bRing have a pixel scale of approximately 1′, while aperture photometry has been performed using a 2.5-pixel radius, with local background subtraction in an annulus of pixels radius. The aperture photometry data have been calibrated using Talens et al. (2018) to remove most instrumental artefacts, mainly due to vignetting, PSF variations and inter-pixel variations. Due to the use of fixed cameras, further strong systematics are known to exist at frequencies of 1 cycle per day, 1 cycle per sidereal day (and its harmonics), and synodic and sidereal lunar periods.
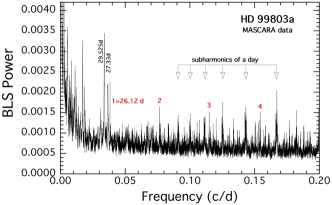
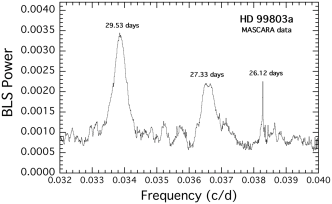
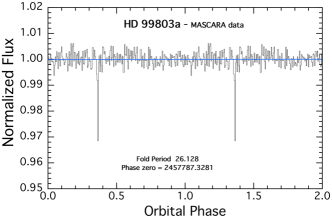
The first panel in Fig. 4 shows the Box Least-Squares (BLS) transform of the MASCARA data. The largest peaks are associated with the synodic and sidereal periods of the lunar cycle which affects the observations. There are also a number of peaks associated with subharmonics of the daily observing cycle. In addition to these non-astrophysical peaks, there is one significant peak at a period of 26.128 d, and its three higher harmonics, labeled 1-4. The second panel of Fig. 4 shows a zoom-in of the BLS transform around the range of d. As one can readily see, the peak at 26.128 d is much narrower than either peak associated with the lunar activity. Furthermore, the four harmonics of this period indicate that it represents a sharp feature in the light curve. The third panel in this figure shows a fold of the MASCARA data about the 26.128-d period. It is gratifying to see that it is a narrow eclipse that is about 4% deep, just as the TESS Sector 10 eclipse indicates.
Finally, we note that the phase of the MASCARA eclipse agrees with the TESS eclipses to within of an orbital cycle. The MASCARA period therefore represents the same eclipsing behavior we see in the TESS data. This, in turn, implies that the ‘missing’ integer in the expression above for the orbital period is 27. The accurate period determined from the time difference between the two TESS eclipses, and the integer number of cycles between them, is then days.
5.2 Frequency analysis of TESS data - HD 1279 (HR 62)
HD 1279 (TIC 440076466; HR 62) was observed by TESS in Sector 17 in 2-min cadence. The data are available in both SAP (simple aperture photometry) and PDCSAP (presearch-data conditioning SAP); we used the PDCSAP data for our analysis, converting intensity to magnitudes. The data have a time span of 22.85 d with a centre point in time of , and comprise 12969 data points, after clipping 9 outliers, which are probably the result of cosmic ray strikes (including solar radiation). The TESS lightcurve od HD 1279 (HR 62) is shown in Fig. 5.
The S17 data were analysed using a fast Discrete Fourier Transform (Kurtz, 1985) to produce an amplitude spectrum (Fig. 6). There is no evidence of any p mode pulsations out to the Nyquist frequency near 360 d-1 (not shown). In the low frequency range where g modes occur there is no peak that cannot be ascribed to instrumental variations. Hence there is also no evidence of g modes. Comparison with the instability strips of Zdravkov & Pamyatnykh (2008) show that HD 1279 is too cool to be a Cep star and too luminous to be an SPB star.


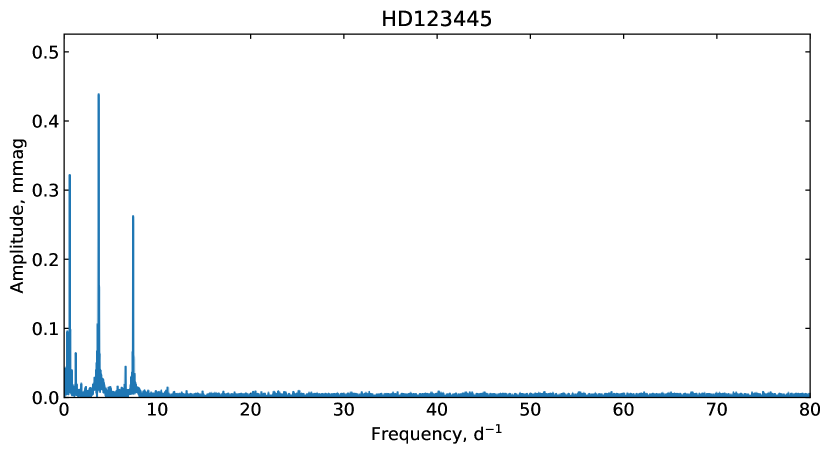
5.3 Frequency analysis of TESS data - HD 123445 (HR 5294)
HD 123445 (TIC 242288894; HR 5294) was observed by TESS in Sector 11 in 30-min cadence. The Fourier Transform of the light curve from sector 38 (2-min cadence) reveals that HD 123445 (HR 5294) has a rotation period of roughly 3 days. It also pulsates with a frequency of about = 3.8 c/d, and the harmonics 2 and show up clearly (Fig. 7). The frequencies are collected in Table LABEL:tab:HD123445
| Designation | Frequency d-1 | Amplitude (mag) | Comment |
|---|---|---|---|
| F5 | 0.35658876 | 0.000083 | |
| F4 | 0.62403082 | 0.000319 | |
| F6 | 1.25185483 | 0.000059 | |
| F1 | 3.71004238 | 0.000448 | |
| F7 | 3.75556579 | 0.000149 | |
| F8 | 6.59310162 | 0.000043 | |
| F2 | 7.42008475 | 0.000260 | 2f1 |
| F3 | 11.1301271 | 0.000013 | 3f1 |
5.4 Frequency analysis - HD 147550 (HR 6096), HD 171961 (HR 6990) and HD 202671 (HR 8137)
HD 147550 (TIC 71983021; HR 6096), HD 171961 (TIC 1286643; HR 6990) and HD 202671 (TIC 39364873; HR 8137) were not observed by TESS.
6 Model atmosphere analysis and synthetic spectra computation
For the six stars rotating with a lower than 30 km s-1, the abundances or their upper limits for forty chemical elements could be derived by iteratively adjusting synthetic spectra to the normalized spectra and looking for the best fit to carefully selected unblended lines. For the two stars rotating faster than 30 km s-1, HD 123445 (HR 5294) and HD 171961 (HR 6990), the lines of elements with intrinsically low abundances (eg. the lanthanides and heavy elements) are blended and fewer abundances could be derived. Specifically, synthetic spectra were computed assuming LTE using Hubeny & Lanz (1992) SYNSPEC49 code which computes line profiles for elements up to Z=99.
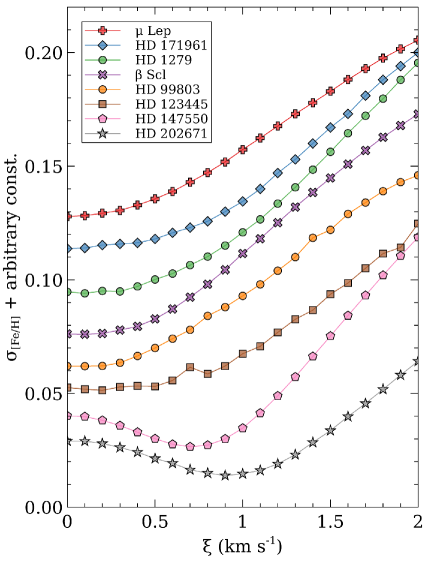
6.0.1 Microturbulent velocity determinations
In order to derive the microturbulent velocities, we have derived the iron abundance [Fe/H] from unblended Fe II lines for a set of microturbulent velocities ranging from 0.0 to 2.0 km s-1for each star. Figure 8 shows the standard deviation of [Fe/H] as a function of the microturbulent velocity. The adopted microturbulent velocities are the values which minimize the standard deviations, i.e., for that value, all Fe II lines yield the same iron abundance. The microturbulent velocities of the eight stars, which are accurate to within 0.1 km s-1, are collected in Table 3. Only two stars, HD 147550 (HR 6096) and HD 202671 (HR 8137), have microturbulent velocities which differ from 0 km s-1.
6.1 Model atmospheres
The ATLAS9 code (Kurucz, 1992) was used to compute a first model atmosphere for the effective temperature and surface gravity of each star assuming a plane parallel geometry, a gas in hydrostatic and radiative equilibrium and local thermodynamical equilibrium. The ATLAS9 model atmosphere contains 72 layers with a regular increase in and was calculated assuming a solar chemical composition (Grevesse & Sauval, 1998). It was converged up to in order to attempt reproduce the cores of the Balmer lines. This ATLAS9 version uses the new opacity distribution function (ODF) of Castelli & Kurucz (2003) computed for that solar chemical composition. Once a first set of elemental abundances was derived using the ATLAS9 model atmosphere, the atmospheric structure was recomputed for these abundances using the Opacity Sampling ATLAS12 code (Kurucz, 2005, 2013). New slightly different abundances were then derived and a new ATLAS12 model recomputed until the abundances of iteration (n-1) differed of those of iteration (n) by less than 0.10 dex.
6.2 The linelist
Atomic linelists from Kurucz’s database have provided the basis to construct our linelist777http://kurucz.harvard.edu/lineslists/ . These lists collect data mostly from the literature for light and heavy elements (usually critically evaluated transition probabilities from Martin et al. (1988) and Fuhr et al. (1988)) and computed data by Kurucz (1992) for the iron group elements. A first linelist was built from Kurucz’s file gfall21oct16.dat 888http://kurucz.harvard.edu/linelists/gfnew/gfall21oct16.dat which includes hyperfine splitting levels. We then updated several oscillator strengths and damping parameters with more recent and accurate determinations when necessary. As a rule, we have preferred NIST999http://physics.nist.gov/cgi-bin/AtData/linesform and Wiese et al. (1996) oscillator strengths for CNO and also Nilsson et al. (2006). The H I lines are calculated using Vidal et al. (1973) tables upgraded by Schoening & Butler up to H 10. The He I lines are computed in SYNSPEC49 by using specific tables, either from Shamey (1969) or Dimitrijevic & Sahal-Brechot (1984).
We introduced hyperfine components for a few lines of Mn II (Holt et al., 1999), isotopic and hyperfine transitions for the Ga II line at 6334.07 Å (Nielsen et al., 2000). To model the Hg II line at 3983.93 Å, we have included 9 hyperfine transitions from all isotopes from up to from Dolk et al. (2003). For Pt II, we have used the atomic data provided in (Engleman, 1989; Bohlender et al., 1998; Jomaron et al., 1998).
For the Rare Earths, we retrieved all relevant transitions from the DREAM database101010http://www.umh.ac.be/astro/dream.shtml. We also used specific publications reporting on laboratory measurements: Sm II (Lawler et al., 2006), Nd II (Den Hartog et al., 2003), Eu II (Lawler et al., 2001b), Tb II (Lawler et al., 2001a). In Kurucz’s linelists, the damping constants are taken from the literature when available. For the iron group elements, they come from Kurucz’s (1992) computations. Additional damping constants for a few Si II lines were taken from Lanz et al. (1988). When they are not available from the linelist, damping constants are actually computed in SYNSPEC49 using an approximate formula (Kurucz & Avrett, 1981).
6.3 Spectrum synthesis
We have used only unblended lines to derive the abundances. For the two fastest rotators, HD 123445 (HR 5294) and HD 171961 (HR 6990), fewer abundances could be derived. For a given element, the final abundance is a weighted mean of the abundances derived for each transition. The weights are derived from the NIST grade assigned to that particular transition when available. The same weight was assigned to all transitions when no critical evaluation from NIST was available.
For several elements, in particular the heaviest elements, only one unblended line was available and the abundance should be regarded as an estimate only. For each modeled transition, the adopted abundance is that which provides the best fit to the observed normalized profile. A grid of synthetic spectra was computed with SYNSPEC49 (Hubeny & Lanz, 1992) to model each selected unblended line of the forty elements. Computations were iterated varying the unknown abundance until minimization of the chi-square between the observed and synthetic spectrum was achieved.
7 Abundance determinations
We discuss here the identifications of chemical elements, the lines selected for abundance determinations and the abundance determinations for each element. We also provide non-LTE abundance corrections for three light elements, namely Na I, Mg I and Ca II. We use the Formato code (Merle et al., 2011) to build simple model atoms, using atomic data from NIST (Kramida et al., 2018) for energy levels, from VALD (Ryabchikova et al., 2015) for radiative bound-bound transitions and from TOPbase (Cunto & Mendoza, 1992) for radiative bound-free transitions. For inelastic collisions with electrons, we use the semi-empirical formula from Seaton (1962) for which a radiative counterpart exist and a collision strength of one for transitions with a forbidden radiative couterpart. For inelastic collisions with hydrogen, we use the formula from Drawin (1969) without scaling factor, except for Mg I where we implemented the mechanical quantum data from Guitou et al. (2015). The statistical equilibrium and the radiative transfer equation for each level and line in each model atom are consistently solved using the non-LTE 1D radiative transfer code MULTI (Carlsson, 1986, 1992).
7.1 Helium
The strongest helium lines unambiguously detected are: 4026.19 Å, 4471.48 Å, 5875.621 Å. The others are either weak or embedded into blends. The least blended, 4471.48 Å, has been synthesized to derive the helium LTE abundance. Helium is underabundant in all stars, the deficiency is the most important in HD 171961 (HR 6990), for which the abundance is only 4 % of the solar abundance (-1.07)
7.2 The light elements (C to Ti)
7.2.1 Carbon
Most of the expected C II lines are blended with more abundant species. The least blended is the high excitation C II triplet at 4267.26 Å. Carbon is underabundant in HD 1279 (HR 62), HD 99803 (HR 4423), HD 123445 (HR 5294), HD 147550 (HR 6096), HD 202671 (HR 8137), Scl (HR 8937) and Lep (HR 1702) with similar deficiencies, from 0.30 up to 0.60 times the solar abundance (-1.07).
Carbon is very underabundant in HD 171961 (HR 6990). Sakhibullin (1987) has shown that the C II line at 4267.26 Å is prone to NLTE effects for B stars hotter than 15000 K. He suggests to use the C II lines at 3919.97 and 3921.69 Å less influenced by departures from LTE to derive carbon abundances. These lines yield the same carbon abundances as 4267.26 Å for the eight stars.
7.2.2 Oxygen
For O I, the strongest expected allowed lines are those of multiplet 7 (NIST quality B+). The nine transitions of multiplet 7 dominate the opacity from 6155 Å to 6159 Å. Oxygen is underabundant in HD 99803 (HR 4423), HD 123445 (HR 5294), HD 147550 (HR 6096), HD 171961 (HR 6990), HD 202671 (HR 8137) and Scl (HR 8937) with depletions of about 0.50 to 0.80 times the solar abundance (-3.31). In Lep (HR 1702), oxygen is about solar and marginally overabundant in HD 1279 (HR 62).
7.2.3 Neon
The Ne I line at 6402.25 Å (NIST quality AAA) was used to derive neon abundances. Neon is overabundant in HD 202671 (HR 8137) and quite underabundant in Scl (HR 8937) and Lep (HR 1702). In all other stars, 6402.25 Å is not observed which indicates an upper limit of one solar abundance (-4.07).
7.2.4 Sodium
We have used the 2 Na I lines at 4497.66 Å (NIST quality B+) and the resonance Na I lines at 5889.95 and 5895.92 Å (quality AA). The LTE overabundances of sodium derived from these lines are -5.67 (ie. solar) for HD 1279 (HR 62) and HD 171961 (HR 6990), half the solar value for HD 99803 (HR 4423), and overabundant by a factor of 4 in Scl (HR 8937). No conclusion could be reached for HD 123445 (HR 5294) because of telluric lines and for HD 202671 (HR 8137) and Lep (HR 1702) because of blending.
The NLTE corrections for the resonance Na I lines at 5889.95 and 5895.92 Å are about -0.52 and -0.60 dex respectively which yields Non-LTE abundances of Na of -6.27 in HD 1279 (HR 62) and HD 171961 (HR 6990), -5.97 for HD 99803A (HR 4423) and -5.37 for Scl (HR 8937), well below the LTE determinations.
7.2.5 Magnesium
The unblended Mg II lines at 4390.514 Å and 4390.572 Å yield LTE abundances of -4.94 (HD 1279, HR 62), -5.0 (HD 99803A, HR 4423) , -4.72 (HD 123445 (HR 5294), HD 171961 (HR 6990), Scl (HR 8937)), -4.57 (HD 147550, HR 6096), -4.77 (HD 202671, HR 8137), -4.54 ( Lep, HR 1702) respectively the solar abundance is -4.42. The unblended Mg I line at 5172.68 Å yields similar abundances, after a NLTE correction which amounts to -0.33 dex. Magnesium therefore appears to be underabundant in each star.
7.2.6 Aluminium
The synthesis of the unblended Al II line at 4663.056 Å shows that aluminium is severely depleted in all stars except in HD 147550 (HR 6096) where it is overabundant (-5.23). The underabundance is the most pronounced in Scl (HR 8937, -6.83). The solar abundance is -5.53.
7.2.7 Silicon
The synthesis of strong and unblended lines of Si II reveals a large spread of the silicon abundances: from very deficient (-5.75) in HD 1279 (HR 62) to overabundant in HD 147550 (HR 6096,-4.25), Scl (HR 8937, -4.09) and Lep (HR 1702, -3.91). The solar silicon abundance is -4.45.
7.2.8 Phosphorus
The lines of P II expected strongest are 6024.18 Å and 6043.12 Å of multiplet 2. Phosphorus is overabundant in HD 1279 (HR 62, -5.07), HD 147550 (HR 6096, -5.67), HD 171961 (HR 6990, -5.00), HD 202671 (HR 8137, -4.32), Lep (HR 1702, -5.27) and Scl (HR 8937, -5.14). None of the lines mentioned above are detected in HD 99803A (HR 4423) and HD 123445 (HR 5294), suggested a 1 solar upper limit. The solar phosphorus abundance is -6.59.
7.2.9 Sulfur
The lines of S II at 4162.67 Å, 4142.25 Å and 4153.06 Å of multiplet 4 are clearly present and unblended in the spectra of all stars. Sulfur is solar in HD 123445 (HR 5294), HD 147550 (HR 6096) and Lep (HR 1702, -4.88) and underabundant in all other stars. The solar sulfur abundance is -4.67.
7.2.10 Argon
The high excitation line of Ar II at 5194.53 Å was used to derive the abundance of argon. Argon is solar in HD 1279 (HR 62, -5.60). The Ar II line is blended in HD 202671 (HR 8137). The line of Ar II is not detected in HD 99803 (HR 4423), HD 123445 (HR 5294), HD 147550 (HR 6096), hD 171961 (HR 6990), Lep (HR 1702) and Scl (HR 8937), which suggests a 1 solar upper limit. The solar argon abundance is -5.82.
7.2.11 Calcium
The synthesis of the unblended Ca II lines at 3933.66 Å and 5019.97 Å yields the calcium LTE abundances, respectively -5.64 (HD 1279, HR 62), -6.34 (HD 99803A, HR 4423), -5.86 (HD 123445, HR 5294), -5.86 (HD 147550, HR 6096), -6.64 (HD 171961, HR 6990), -5.34 (HD 202671, HR 8137), -5.21 ( Lep, HR 1702), -5.24 ( Scl, HR 8937). The solar calcium abundance is -5.64. The Non-LTE correction for the 3933.66 Å amounts to +0.37 dex, Calcium therefore appears to be overabundant in HD 1279 (HR 62), HD 202671 (HR 8137), Lep (HR 1702) and Scl (HR 8937).
7.2.12 Scandium
The line of multiplet 1 of Sc II at 4246.820 Å is the only unblended line (quality A’ in NIST). Scandium appears to be overabundant in HD 1239 (HR 62, -8.13), HD 99803A (HR 4423, -8.35) and Lep (HR 1702, -8.13) and underabundant in HD 147550 (HR 6096, -9.13) and Scl (HR 8937, -9.83). The line is not detected in HD 123445 (HR 5294), HD 171961 (HR 6990) and HD 202671 (HR 8137), for which we adopt a 1 solar upper limit (the solar scandium abundance is -8.85).
7.2.13 Titanium
Ten lines of Ti II were used to derive the mean titanium abundances. Titanium is found to be overabundant in all stars, from marginally overabundant in HD 147550 (HR 6096, -6.82) to a sizeable overabundance (-6.10) in Scl (HR 8937). The solar titanium abundance is -6.98.
7.3 The iron-peak elements (V to Zn) and gallium
7.3.1 Vanadium
The vanadium abundance has been estimated using three lines of V II at 4005.705 Å, 4023.378 Å and 4036.78 Å.
The analysis of these lines yields an overabundance in HD 147550 (HR 6096), a solar abundance in HD 1239 (HR 62), HD 123445 (HR 5294), HD 171961 (HR 6990) and Scl (HR 8937, -8.07) and a one solar upper limit for HD 202671 (HR 8137) and Lep (HR 1702). The solar vanadium abundance is -8.00. The selected lines of V II are not observed in these two stars.
7.3.2 Chromium
Several strong and unblended lines of Cr II could easily be found in the spectra of all tars. Six unblended lines of Cr II were synthesized. Chromium is solar in HD 171961 (HR 6990, -6.36) and overabundant in all stars from mildly overabundant in HD 1239 (HR 62), HD 123445 (HR 5294), HD 147550 (HR 6096) and HD 202671 (HR 8137) to overabundances close to 5 times the solar chromium abundance in HD 99803A (HR 4423), Lep (HR 1702) and Scl (HR 8937). The solar chromium abundance is -6.33.
7.3.3 Manganese
The two Mn II lines have hyperfine structures published by Holt et al. (1999). They yield overabundances in all stars, but for HD 171961 (HR 6990) which has a solar manganese abundance (-6.57). The overabundances are very pronounced in HD 1279 (HR 62, -5.21), HD 202671 (HR 8137, -5.10), Lep (HR 1702, -4.13) and Scl (HR 8937, -4.21) and mild in HD 99803A (HR 4423, -6.00), HD 123445 (HR 5294, -6.21), HD 147550 (HR 6096, -6.21). The solar manganese abundance is -6.61.
7.3.4 Iron
The abundance of iron was derived from eleven Fe II lines, all of which are sensitive to small changes in . Iron is mildly overabundant in HD 202671 (HR 8137, -4.10), about solar in HD 1279 (HR 62), HD 147550 (HR 6096), HR 6990, Lep (HR 1702) and Scl (HR 8937, -4.50) and very underabundant in HD 99803A (HR 4423, -4.90) and HD 147550 (HR 6096, -5.02). The solar iron abundance is -4.50.
7.3.5 Nickel
The nickel abundances was derived using one line at 4067.031 Å only and should be taken with caution. Nickel is found to be underabundant in HD 1279 (HR 62), HD 99803A (HR 4423), HD 171961 (HR 6990), HD 202671 (HR 8137) and Scl (HR 8937, –6.40 for these stars), very underabundant in Lep (HR 1702, -7.16) and HD 123445 (HR 5294, -7.00), and close to solar in HD 147550 (HR 6096, -5.78). The solar nickel abundance is -5.75.
7.3.6 Gallium
We have used the high excitation Ga II line at 6334.069 Å with hyperfine splitting of the gallium isotopes. It is the strongest expected line of Ga II in this temperature regime. The eight transitions retrieved and modified from
Nielsen et al. (2000) are collected in Table LABEL:tab:Gaii.
The line of Ga II at 6334.069 Å is usually clearly present. Other lines of Ga II are present at 4251.108 Å, 4254.032 Å, 4255.64 Å and 4261.995 Å and 5360.313 Å, 5363.353 Å and 5421.122 Å in the red part of the spectrum.
Gallium is overabundant in HD 1279 (HR 62, -7.18), HD 123445 (HR 5294, -5.96), HD 171961 (HR 6990, -6.86), Lep (HR 1702, -5.38), Scl (HR 8937, -5.96),
solar in HD 99803A (HR 4423), HD 147550 (HR 6096, -8.96), consistent with an upper limit of one solar in HD 202671 (HR 8137, the solar gallium abundance is -8.96, no line observed).
| Wavelength | ion | lower energy level | EW | |
|---|---|---|---|---|
| (Å) | (cm-1) | (mÅ) | ||
| 6333.930 | Ga II | 0.08 | 102944.595 | 14.7 |
| 6333.980 | Ga II | 0.21 | 102944.595 | 20.5 |
| 6333.990 | Ga II | 0.08 | 102944.595 | 14.6 |
| 6334.069 | Ga II | 0.10 | 102944.595 | 15.3 |
| 6334.080 | Ga II | 0.40 | 102944.595 | 26.5 |
| 6334.083 | Ti II | -2.08 | 66521.008 | 0.0 |
| 6334.120 | Ga II | 0.02 | 102944.595 | 12.8 |
| 6334.200 | Ga II | 0.09 | 102944.595 | 20.9 |
| 6334.208 | Cr II | -1.66 | 89812.422 | 0.0 |
| 6334.290 | Ga II | 0.01 | 102944.595 | 16.8 |
| 6334.368 | Ni II | -2.36 | 120271.975 | 0.0 |
7.4 The Sr-Y-Zr triad
7.4.1 Strontium
The abundance of strontium was derived from the fit to the only unblended line of Sr II at 4215.52 Å. Strontium is overabundant in HD 1279 (HR 62, -7.35), HD 147550 (HR 6096, -8.13), Lep (HR 1702, -6.43), Scl (HR 8937, -5.95), solar in HD 99803A (HR 4423, -9.13), HD 123445 (HR 5294), HD 202671 (HR 8137) and HD 171961 (HR 6990). The solar strontium abundance is -9.03.
7.4.2 Yttrium
The yttrium lines are conspicuous in the spectra of HD 1279 (HR 62), HD 99803A (HR 4423), HD 123445 (HR 5294), HD 147550 (HR 6096), HD 202671 (HR 8137), Lep (HR 1702), Scl (HR 8937) and HD 147550 (HR 6096). These lines absorb from a few % up to 10 %. The only unblended lines are the low excitation lines at 3982.592 Å and 5662.925 Å. Yttrium is very overabundant in all stars from a factor of 5 times (- 9.09) up to 12500 times (-5.69) the solar abundance except in HD 171961 (HR 6990) where it is solar (the solar yttrium abundance is -9.79).
7.4.3 Zirconium
The only two Zr II unblended lines are 4443.008 Å and 4457.431 Å. Zirconium is solar in HD 1279 (HR 62), HD 123445 (HR 5294), HD 171961 (HR 6990, the solar zirconium abundance is -9.42), overabundant in HD 99803A (HR 4423, -8.12), HD 147550 (HR 6096, -8.64), HD 202671 (HR 8137, -7.42), Lep (HR 1702, -7.64) and Scl (HR 8937, -7.32).
7.5 Barium
The two resonance lines of Ba II (Multiplet 1) at 4554.029 Å and 4934.076 Å and the low excitation line 6141.59 Å are present. The hyperfine structure of the various isotopes of barium we have used is collected in Table LABEL:tab:Baii. Barium is solar in HD 1279 (HR 62), HD 123445 (HR 5294), HD 202671 (HR 8137), Scl (HR 8937) and HD 171961 (HR 6990, the solar barium abundance is -9.82) and overabundant in HD 99803A (HR 4423, -8.30), HD 147550 (HR 6096, -8.74) and Lep (HR 1702, -8.82).
| Wavelength | ion | lower energy level | EW | |
| (Å) | (cm-1) | (mÅ) | ||
| 4553.934 | Zr II | -0.57 | 19514.840 | 0.1 |
| 4553.995 | Ba II | -1.57 | 0.000 | 0.1 |
| 4553.997 | Ba II | -1.57 | 0.000 | 0.1 |
| 4553.998 | Ba II | -1.99 | 0.000 | 0.0 |
| 4553.999 | Ba II | -1.82 | 0.000 | 0.1 |
| 4554.001 | Ba II | -1.82 | 0.000 | 0.1 |
| 4554.001 | Ba II | -2.22 | 0.000 | 0.0 |
| 4554.011 | Cr I | -0.73 | 33040.093 | 0.0 |
| 4554.029 | Ba II | 0.02 | 0.000 | 16.6 |
| 4554.029 | Ba II | -1.45 | 0.000 | 1.3 |
| 4554.029 | Ba II | -0.94 | 0.000 | 3.8 |
| 4554.046 | Ba II | -1.38 | 0.000 | 0.3 |
| 4554.049 | Ba II | -1.82 | 0.000 | 0.1 |
| 4554.049 | Ba II | -1.15 | 0.000 | 0.6 |
| 4554.050 | Ba II | -2.52 | 0.000 | 0.0 |
| 4554.051 | Ba II | -1.57 | 0.000 | 0.1 |
| 4554.052 | Ba II | -2.29 | 0.000 | 0.0 |
| 4934.005 | Fe I | -0.61 | 33507.120 | 0.4 |
| 4934.074 | Ba II | -3.12 | 0.000 | 0.0 |
| 4934.074 | Ba II | -1.33 | 0.000 | 0.8 |
| 4934.075 | Ba II | -3.15 | 0.000 | 0.0 |
| 4934.075 | Ba II | -1.10 | 0.000 | 1.3 |
| 4934.076 | Ba II | -1.77 | 0.000 | 0.3 |
| 4934.076 | Ba II | -1.25 | 0.000 | 0.9 |
| 4934.077 | Ba II | -0.29 | 0.000 | 7.0 |
| 4934.084 | Fe I | -2.30 | 26627.608 | 0.1 |
| 6141.597 | Fe I | -3.12 | 33765.304 | 0.0 |
| 6141.713 | Ba II | -0.22 | 5674.824 | 2.4 |
| 6141.713 | Ba II | -1.03 | 5674.824 | 0.4 |
| 6141.714 | Ba II | -1.18 | 5674.824 | 0.3 |
| 6141.714 | Ba II | -1.26 | 5674.824 | 0.2 |
| 6141.715 | Ba II | -1.69 | 5674.824 | 0.1 |
| 6141.717 | Ba II | -3.07 | 5674.824 | 0.0 |
| 6141.718 | Ba II | -3.05 | 5674.824 | 0.0 |
| 6141.731 | Fe I | -1.61 | 29056.322 | 0.1 |
7.6 The Rare Earths
We have searched for once ionized rare earths elements in the spectra of the eight stars, namely La II, Ce II, Pr II, Nd II, Sm II, Eu II, Gd II, Tb II, Dy II, Ho II and Er II. As the twice ionised rare earths often are the dominant stages in these atmospheres of late B stars, we also looked for the twice ionized species, Pr III and Nd III, using the lines listed either in NIST or in DREAM and the linelists published in Ryabchikova et al. (2006) and Ryabchikova et al. (2007) . The lines of these ions are weak, a few of these lines could be found in most stars only be found in the slowest rotators. HD 147550 (HR 6096) is the star which has the most detections of rare earths.
7.6.1 Lanthanum
The spectrum synthesis of the La II line at 4042.91 Å feature is consistent with one solar abundance upper limit for HD 171961 (HR 6990) and Scl (HR 8937). The line is detected in HD 1279 (HR 62), HD 99803A (HR 4423) and HD 202671 (HR 8137) and properly reproduced with a solar abundance (the solar lanthanum abundance is -10.90). Lanthanum is overabundant in HD 147550 (HR 6096, -9.90) and very abundant in Lep (HR 1702, -8.00).
7.6.2 Cerium
The synthesis of the unblended Ce II lines at 4133.80 Å and 4460.21 Å yields a mild overabundance of cerium in HD 147550 (HR 6096, -9.24) and a one solar upper limit in all the other stars (the solar cerium abundance is -10.42).
7.6.3 Praseodymium
The lines of Pr III at 5284.69 and 5299.99 Å are unblended and provide large overabundances in HD 147550 (HR 6096, -10.38), HD 99803A (HR 4423, -9.98), Lep (HR 1702, -8.98), HD 123445 (HR 5294, -8.58). The synthesis of these lines is consistent with a solar abundance upper value for HD 1279 (HR 62), HD 202671 (HR 8137), HD 171961 (HR 6990) and Scl (HR 8937, the solar praseodymium abundance is -11.28)
7.6.4 Neodymium
For Nd III, the strongest expected lines in DREAM are the resonance lines 5265.019 Å and 5294.099 Å. The synthesis of these lines yields moderate to large overabundances of Nd III in HD 99803A (HR 4423, -9.98), HD 1279 (HR 62, -9.28) and HD 123445 (HR 5294, -8.18), HD 147550 (HR 6096, -9.73). In HD 202671 (HR 8137), HD 171961 (HR 6990), Lep (HR 1702) and Scl (HR 8937) the abundance of neodymium has a one solar upper value, ie. -10.50 (the lines are not detected).
7.6.5 Samarium
The Sm II lines at 4280.79 Å and 4424.32 Å are unblended and are consistent with a 1 solar upper limit abundance of samarium (the solar samarium abundance is -11.04) in all stars, except for HD 147550 (HR 6096) for which samarium is overabundant (-9.44).
7.6.6 Europium
The Eu II resonance line at 4129.73 Å is unblended and consistent with a 1 solar upper limit abundance of europium (the solar europium abundance being -11.48) in all stars except in HD 147550 (HR 6096) where europium is overabundant (-10.48).
7.6.7 Gadolinium
The Gd II line at 4037.32 Å is unblended and properly reproduced with large overabundances in HD 147550 (HR 6096, -9.63) and Lep (HR 1702, -7.45). In the other stars, gadolinium has a one solar upper limit (the solar gadolinium abundance is -10.88).
7.6.8 Terbium
The Tb II line at 4005.47 Å provides a 1 solar upper limit abundance (the solar terbium abundance is -11.70) for all stars except HD 147550 (HR 6096) where terbium is overabundant (-10.70)
7.6.9 Dysprosium
The Dy II line at 4000.45 Å provides a 1 solar upper linit (the solar dysprosium abundance is -10.90) in all stars except for HD 147550 (HR 6096) where dysprosium is overabundant (-9.30).
7.6.10 Holmium
The low excitation line of Ho II at 4152.62 Å provides a 1 solar upper limit (the solar holmium abundance is -11.52) in all stars except for HD 147550 (HR 6096) where holmium is overabundant (-9.04).
7.6.11 Erbium
For Er II, the line at 4142.91 Å is consistent with a 1 solar upper limit (the solar erbium abundance is -11.08) for all stars except HD 147550 (HR 6096) where erbium is very overabundant (-8.78)
7.6.12 Thulium
The line at 4242.15 Å of Tm II is consistent with a 1 solar upper limit (the solar thulium abundance is -11.90) in all eight stars.
7.6.13 Ytterbium
The Yb II line at 4135.095 Å provides a one solar upper limit for all eight stars (the solar ytterbium abundance is -11.16).
7.7 The very heavy elements Hafnium, Osmium, Platinum, Gold and Mercury
7.7.1 Hafnium
The Hf II line at 3918.08 Å yields a 1 solar upper limit (the solar hafnium abundance being -11.15) in all eight stars.
7.7.2 Osmium
The Os II line at 4158.44 Å is consistent with a 1 solar upper limit (the solar osmium abundance being -10.60) in all eight stars.
7.7.3 Platinum
The 4514.47 Å Pt II line is the only clearly detected line of platinum in the spectra of HD 99803A (HR 4423), Lep (HR 1702) and Scl (HR 8937). In the other five stars, this line is not detected and the abundance of platinum has a one solar upper limit (the solar platinum abundance is -10.38). Our referee, Prof. M. Dworetsky has kindly provided the hyperfine structure and isotopic shifts for the 4514.47 Å Pt II line (Engleman, 1989; Bohlender et al., 1998; Jomaron et al., 1998). Inclusion of these hyperfine transitions significantly reduces the overabundances of platinum. The new abundances are -8.32 in HR 4423, -7.20 in HR 1702, -6.20 in HR 8937. There are no other species at this wavelength which could account for the observed absorption. The wavelength scale around the Pt II line was checked using the Fe II neighbouring control lines whose NIST wavelengths are accurate to within 0.001 Å.
7.7.4 Gold
The Au II line at 4052.790 Å is not clearly seen in the spectra of the eight stars and is therefore reproduced by a one solar upper limit for all stars (-10.99).
7.7.5 Mercury
The abundance of mercury has been derived from the low excitation Hg II line at 3983.93 Å only which is clearly present in all eight stars. This feature absorbs from 2% in HD 147550 (HR 6096) and HD 202671 (HR 8137) to about 12 % of the continuum in Scl (HR 8937). The other Hg II lines are all high excitation lines either weak or blended with more abundant species and were not synthesized. In particular Hg II 6149.4749 Å is blended with Fe II 6149.258 Å in all stars.
To model the Hg II line at 3983.93 Å, we have included 9 transitions ie., all hyperfine structure from the various isotopes from and
listed in Dolk et al. (2003). These transitions are collected together with blending lines from Ti I, Fe I, Cr I and Cr II in Table LABEL:tab:Hgii, where the equivalent widths are computed for the final abundances of HR 62.
| Wavelength | ion | lower energy level | EW | |
|---|---|---|---|---|
| (Å) | (cm-1) | (mÅ) | ||
| 3983.771 | Hg II | -4.50 | 35514.999 | 1.2 |
| 3983.827 | Ti I | -1.46 | 17075.258 | 0.0 |
| 3983.832 | Fe I | -4.81 | 24338.766 | 0.0 |
| 3983.839 | Hg II | -3.00 | 35514.000 | 14.1 |
| 3983.844 | Hg II | -3.13 | 35514.000 | 12.5 |
| 3983.851 | Cr II | -4.31 | 81962.291 | 0.0 |
| 3983.853 | Hg II | -3.00 | 35514.000 | 14.1 |
| 3983.874 | Fe I | -2.70 | 34039.515 | 0.0 |
| 3983.899 | Cr I | 0.35 | 20520.904 | 3.2 |
| 3983.912 | Hg II | -2.50 | 35514.000 | 19.2 |
| 3983.932 | Hg II | -3.10 | 35514.000 | 12.9 |
| 3983.941 | Hg II | -2.90 | 35514.000 | 15.3 |
| 3983.956 | Fe I | -1.02 | 21999.129 | 2.5 |
| 3983.986 | Cr II | -2.32 | 90512.561 | 0.0 |
| 3983.991 | Cr II | -2.88 | 82362.188 | 0.0 |
| 3983.993 | Hg II | -3.00 | 35514.000 | 14.2 |
| 3984.022 | Cr I | -2.47 | 35397.971 | 0.0 |
| 3984.072 | Hg II | -3.00 | 35514.000 | 14.4 |
The wavelength scale was checked by using four control lines on each side of the Hg II line: shortwards the Zr II line at 3982.0250 Å , the Y II line at 3982.59 Å and longwards the Zr II lines at 3984.718 Å and 3991.15 Å. Once corrected for the radial velocities of each star, the centers of these lines are found at their expected laboratory locations to within 0.02 Å which we will adopt as the accuracy of the wavelength scale in this spectral region.
First, we checked the influence of possible contaminant species to the Hg II line from 3983.50 Å up to 3984.50 Å which we estimate to be the maximum extension of the line wings. The only possible contaminants are three weak lines: Fe II 3983.737 Å, Cr I 3983.897 Å and Fe I 3983.956 Å. The equivalent widths of these lines were computed for the derived Fe and Cr abundances and the sum of their contributions, is by far insufficient to reproduce the equivalent width of the observed feature at 3983.93 Å (about 64 to 70 mÅ) of the Hg II blend.
Another test consisted in computing the flux without the Hg II transitions. This consistently resulted into a very weak absorption feature from 3983.50 Å to 3984.50 Å in each star. We can therefore conclude that the observed features at 3983.93 Å are indeed mostly due to the Hg II line and almost free of blends.
Including the hyperfine structure of the seven isotopes from Table 2 of Dolk et al. (2003) significantly usually reduces the mercury abundance.
The final combination of oscillator strengths is recorded in Table LABEL:tab:Hgii.
The final mercury abundances derived from the synthesis of the 3983.93 Å line
yield overabundances of -7.43 for HD 147550 (HR 6096) and HD 202671 (HR 8137), of about -7.43 for HD 1219 (HR 62) and HD 99803A (HR 4423), -6.23 in HD 171961 (HR 6990) and of -5.40 for HD 123445 (HR 5294), of -5.23 for Lep (HR 1702) and -4.83 for Scl (HR 8937). The solar mercury abundance is -10.91.
The final abundances 111111We here refer to the absolute abundance in the star: where are collected in Table 8. The error budget for these abundances is explained in the Appendix and uncertainties are collected in Table LABEL:tab:uncertainties.
| Element | HD 1279 | HD 99803A | HD 123445 | HD 147550 | HD 171961 | HD 202671 | Lep | Scl | Sun |
| HR 62 | HR 4423 | HR 5294 | HR 6096 | HR 6990 | HR 8137 | HR 1702 | HR 8937 | ||
| He ( 2) | 10.33 | 10.63 | 10.23 | 10.53 | 9.53 | 9.93 | 9.93 | 9.93 | 10.93 |
| C ( 6) | 7.97 | 8.03 | 8.21 | 8.03 | 7.13 | 7.91 | 8.21 | 8.21 | 8.43 |
| N ( 7) | 7.83 | 7.83 | 7.83 | ||||||
| O ( 8) | 8.87 | 8.41 | 8.39 | 8.47 | 8.39 | 8.47 | 8.73 | 8.59 | 8.69 |
| Ne (10) | 7.93 | 7.93 | 8.41 | 8.23 | 7.23 | 7.93 | |||
| Na (11) | 6.24 | 5.94 | 6.24 | 6.24 | 6.24 | 6.94 | 6.24 | ||
| Mg (12) | 7.08 | 6.98 | 7.25 | 7.45 | 6.90 | 7.25 | 7.48 | 7.30 | 7.60 |
| Al (13) | 5.45 | 5.93 | 5.85 | 6.75 | 5.45 | 5.15 | 5.45 | 5.15 | 6.45 |
| Si (14) | 6.21 | 7.00 | 7.29 | 7.72 | 6.99 | 7.45 | 8.03 | 7.87 | 7.51 |
| P (15) | 6.89 | 5.41 | 5.41 | 6.29 | 6.95 | 7.71 | 6.82 | 6.68 | 5.41 |
| S (16) | 6.82 | 7.12 | 7.12 | 7.33 | 7.12 | 6.52 | 7.12 | 6.82 | 7.12 |
| Cl (17) | 6.50 | 5.50 | |||||||
| Ar (18) | 6.40 | 6.40 | 6.40 | ||||||
| Ca (20) | 7.04 | 5.64 | 6.12 | 6.22 | 5.34 | 6.64 | 6.74 | 6.74 | 6.34 |
| Sc (21) | 3.85 | 3.63 | 2.85 | 3.85 | 2.15 | 3.15 | |||
| Ti (22) | 5.65 | 5.36 | 5.46 | 5.11 | 5.53 | 5.63 | 5.83 | 5.75 | 4.95 |
| V (23) | 3.93 | 3.53 | 3.93 | 4.40 | 3.93 | 3.93 | |||
| Cr (24) | 5.88 | 6.27 | 6.04 | 5.78 | 5.64 | 5.94 | 6.36 | 6.29 | 5.64 |
| Mn (25) | 6.83 | 6.03 | 7.28 | 5.77 | 5.43 | 6.94 | 7.91 | 7.83 | 5.43 |
| Fe (26) | 7.68 | 7.06 | 6.98 | 7.55 | 7.50 | 7.90 | 7.73 | 7.73 | 7.50 |
| Ni (28) | 5.52 | 5.52 | 4.92 | 6.48 | 5.52 | 5.46 | 4.76 | 5.52 | 6.22 |
| Ga (31) | 4.82 | 3.04 | 6.04 | 3.04 | 5.14 | 6.62 | 6.04 | 3.04 | |
| Sr (38) | 3.47 | 2.97 | 2.87 | 3.87 | 2.87 | 2.87 | 5.57 | 6.05 | 2.87 |
| Y (39) | 4.75 | 3.99 | 4.91 | 2.91 | 2.21 | 4.21 | 5.51 | 6.31 | 2.21 |
| Zr (40) | 2.58 | 3.88 | 2.58 | 3.36 | 2.58 | 2.58 | 4.36 | 4.68 | 2.58 |
| Xe (54) | 5.84 | 2.24 | 4.24 | 6.98 | 6.94 | 2.24 | |||
| Ba (56) | 2.18 | 3.69 | 2.18 | 3.26 | 2.18 | 2.18 | 3.18 | 2.18 | 2.18 |
| La (57) | 1.10 | 2.10 | 1.10 | 4.00 | 1.10 | ||||
| Ce (58) | 2.76 | 1.58 | 1.58 | 1.58 | |||||
| Pr (59) | 0.72 | 2.02 | 3.42 | 1.72 | 3.02 | 0.72 | |||
| Nd (60) | 2.72 | 2.02 | 3.82 | 2.27 | 1.42 | 1.42 | |||
| Sm (62) | 2.56 | 0.96 | 0.96 | 0.96 | |||||
| Eu (63) | 1.52 | 0.52 | 0.52 | 0.52 | |||||
| Gd (64) | 2.37 | 4.55 | 1.07 | ||||||
| Tb (65) | 1.30 | 0.30 | 0.30 | 0.30 | |||||
| Dy (66) | 1.10 | 2.70 | 1.10 | 1.10 | 1.10 | ||||
| Ho (67) | 2.96 | 0.48 | 0.48 | ||||||
| Er (68) | 3.22 | 0.92 | |||||||
| Hf (72) | 0.85 | 0.85 | |||||||
| Os (76) | 1.40 | 1.40 | |||||||
| Pt (78) | 1.90 | 0.02 | 2.72 | 4.02 | 0.02 | ||||
| Hg (80) | 5.35 | 5.17 | 6.60 | 4.57 | 5.77 | 4.47 | 6.77 | 7.17 | 1.17 |
| Bi (83) | 4.95 | 0.65 |
| HeI | CII | OI | MgII | AlII | SiII | PII | SII | CaII | ||
|---|---|---|---|---|---|---|---|---|---|---|
| +200 K | -0.30 | 0.00 | 0.05 | 0.047 | 0.075 | -0.017 | 0.00 | 0.00 | 0.109 | |
| 0.15 dex | 0.079 | 0.24 | -0.06 | -0.052 | 0.118 | -0.017 | -0.12 | -0.12 | -0.032 | |
| +0.20 km s-1 | 0.00 | 0.00 | 0.00 | 0.00 | 0.075 | -0.035 | -0.05 | -0.046 | 0.00 | |
| +0.10 | -0.30 | -0.12 | -0.16 | -0.25 | -0.028 | -0.053 | -0.07 | -0.071 | -0.105 | |
| -0.12 | 0.21 | 0.075 | 0.13 | 0.25 | 0.062 | 0.06 | 0.061 | 0.058 | ||
| 0.45 | 0.34 | 0.19 | 0.29 | 0.20 | 0.092 | 0.160 | 0.159 | 0.165 | ||
| ScII | TiII | VII | CrII | MnII | FeII | NiII | SrII | YII | ||
| +200 K | 0.22 | 0.041 | 0.028 | 0.057 | 0.00 | 0.079 | 0.176 | 0.138 | 0.146 | |
| 0.15 dex | -0.079 | 0.015 | -0.014 | 0.03 | 0.007 | 0.041 | 0.114 | -0.058 | ||
| +0.20 km s-1 | -0.038 | -0.016 | 0.00 | 0.00 | 0.00 | -0.095 | 0.00 | -0.058 | 0.00 | |
| +0.10 | -0.13 | -0.23 | -0.046 | -0.15 | -0.015 | -0.095 | -0.155 | -0.058 | -0.05 | |
| 0.067 | 0.03 | 0.014 | 0.046 | 0.014 | 0.0126 | 0.079 | 0.051 | 0.041 | ||
| 0.276 | 0.064 | 0.23 | 0.169 | 0.076 | 0.162 | 0.273 | 0.178 | 0.165 | ||
| ZrII | BaII | LaII | CeII | PrIII | NdIII | SmII | EuII | GdII | ||
| +200 K | 0.058 | 0.114 | 0.11 | 0.11 | 0.11 | 0.11 | 0.11 | 0.11 | 0.11 | |
| 0.15 dex | 0.046 | -0.032 | -0.125 | -0.13 | -0.13 | -0.13 | -0.13 | -0.13 | -0.13 | |
| +0.20 km s-1 | 0.00 | -0.097 | -0.09 | -0.09 | -0.09 | -0.09 | -0.09 | -0.09 | -0.09 | |
| +0.10 | -0.066 | -0.125 | -0.13 | -0.13 | -0.13 | -0.13 | -0.13 | -0.13 | -0.13 | |
| 0.146 | -0.097 | -0.09 | -0.09 | -0.09 | -0.09 | -0.09 | -0.09 | -0.09 | ||
| 0.173 | 0.251 | 0.25 | 0.25 | 0.25 | 0.25 | 0.25 | 0.25 | 0.25 | ||
| DyII | TbII | HoII | ErII | Tm II | YbII | HfII | OsII | PtII | ||
| +200 K | 0.11 | 0.11 | 0.11 | 0.11 | -0.155 | 0.11 | 0.11 | 0.11 | 0.11 | |
| 0.15 dex | -0.13 | -0.13 | -0.13 | -0.13 | 0.041 | -0.13 | -0.13 | -0.13 | -0.13 | |
| +0.20 km s-1 | -0.09 | -0.09 | -0.09 | -0.09 | -0.097 | -0.09 | -0.09 | -0.09 | -0.09 | |
| +0.10 | -0.13 | -0.13 | -0.13 | -0.13 | -0.108 | -0.13 | -0.13 | -0.13 | -0.13 | |
| -0.09 | -0.09 | -0.09 | -0.09 | 0.079 | -0.09 | -0.09 | -0.09 | -0.09 | ||
| 0.25 | 0.25 | 0.25 | 0.25 | 0.23 | 0.25 | 0.25 | 0.25 | 0.25 | ||
| AuII | Hg II | |||||||||
| +200 K | 0.11 | -0.155 | ||||||||
| 0.15 dex | -0.13 | 0.041 | ||||||||
| +0.20 km s-1 | -0.09 | -0.097 | ||||||||
| +0.10 | -0.13 | -0.108 | ||||||||
| -0.09 | 0.079 | |||||||||
| 0.25 | 0.23 |
8 Discussion
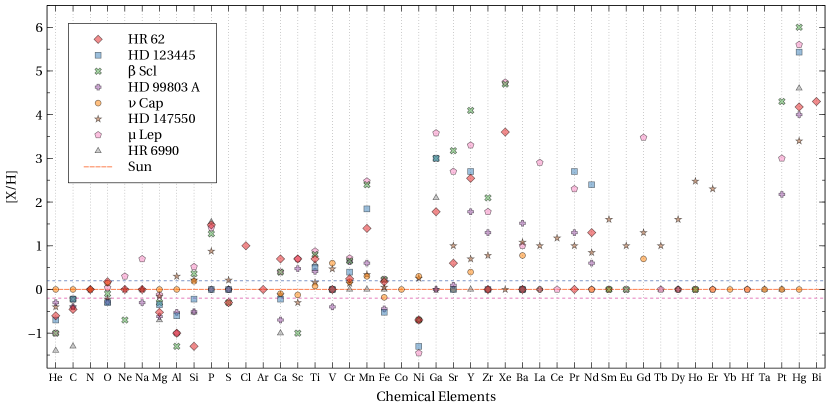
The abundance analysis carried out here clearly establishes that the six slowly rotating southern stars analysed are newly discovered Chemically Peculiar stars with large mercury overabundances.
The abundance patterns for these objects are shown in Figure 9.
None of these objects appears to be a rapid rotator seen pole-on as Vega is. We fail to find the characteristic flat-bottomed Fe II lines of Vega in the spectra we analysed.
The inference of the age and mass of the stars with the SPInS tool and BaSTI stellar models shows that six stars are still on the main sequence while for the two most massive ones, HD 1279 (HR 62) and HD 202671 (HR 8137), the evolutionary status cannot be firmly assessed. All these stars are young as expected, their estimated ages range from 100 to 261 Myrs.
The analysis of the TESS lightcurve of HD 99803A (HR 4423) shows that this star is an eclipsing binary star with an orbital period longer than the 24.96-d time span of the Sector 10 data.
We estimate the radius of the transiting body to be about 0.2 the radius of the primary B9V star from the transit depth. That suggests a secondary that is a lower main-sequence star, a plausible conjecture. There is no evidence for p-modes nor g-modes in the periodogram of the TESS lightcurve. HD 99803 (HR 4423) is too cool to be a SPB star nor a Cephei star. There is no evidence either in this star for signatures of p-modes nor g-modes. HD 123445 (HR 5294) is a pulsational variable with a principal period of 6 hours and 28 minutes and 2 harmonics.
HD 99803A (HR 4423) stands out as a particularly interesting object also because its spectrum has very sharp lines, similar to HD 72660 (HR 3383). There are very few very sharped lined early A/late B stars.From the list of identifications provided for the final composition of HD 99803A (HR 4423) in Table 10 in the Appendix, we can conclude that the following species are present in the spectra of HD 99803A (and in the other stars as well): C II, N II, O I, Na I, Mg II, Mg I,Mg II, Si II, P II, S II, Ca II, Sc II, Ti II, V II, Cr II, Cr I, Mn II, Fe II, Ni II, Ga II, Sr II, Y II, Zr II, Ba II, Pt II, Hg II. Among these species, Si II, Ti II, Cr II, Mn II, Fe II, Y II, Zr II, have numerous and strong lines and are important opacity sources. Lines from neutrals: Cr I, Mn I, Fe I are also observed and yield lower abundances than Cr II, Mn II and Fe II, indicating possibly departures from LTE.
For the Rare Earths, we find evidence for overbundances of four Rare Earths from unblended lines of Ce II, Pr III and Nd III and Gd II in the slowest rotating stars. For the other Rare Earths, we only find upper limits: the abundances must be solar or lower.
The presence of once ionised Rare Earths is difficult to assess at these temperatures above 10000 K
because they are not the dominant ionisation stage. In general, the abundances for the Rare Earths should be regarded as the least reliable ones in this study because they were usually infered from the synthesis of one weak line of the once ionised species only.
The overabundances found in the six newly discovered CP stars run from very mild (2.0 for Fe) up to quite large
( for Hg). The underabundances run from mild -0.80 for carbon to pronounced -0.02 for nickel. Helium is quite underabundant in HD 171961 (HR 6990), for which the abundance is only 4 % of the solar abundance.
The comparison late B star, Cap (HR 7773, HD 193432), has a nearly solar composition for all elements as already found by Monier et al. (2018) and Adelman (1991). For the other eight stars, the overall trend is that the light elements (He through Mg) are most often deficient whereas elements heavier than manganese tend to be more and more overabundant as the atomic mass increases (with the exception of nickel).
This pattern of abundances is most likely caused by radiative diffusion.
9 Conclusion
With their characteristic underabundances of most light elements up to calcium and overabundances of manganese and elements heavier than strontium, in particular mercury, the six stars studied here are definitely new HgMn stars or new PGa stars. Their abundances differ from those of the classical HgMn stars Lep (HR 1702) and Scl (HR 8937) possibly because their initial abundances differed slightly and because radiative diffusion operated in a slightly different manner in stars having different masses. For HD 147550 (HR 6096), the mild deficiencies for light elements and overabundances for strontium, yttrium and zirconium and several rare-earths and mercury suggest that this object should be reclassified as a mild Chemically Peculiar star. We find that HD 123445 (HR 5294) pulsates with a main period of 6 hours 28 minutes and two harmonics. More observations of this interesting star will help elucidate its nature. A photometric monitoring of HD 99803A (HR 4423) over a period of time longer than 25 days span of the TESS observations should help measure the orbital period of this new eclipsing spectroscopic binary.
References
- Adelman (1991) Adelman, S. J. 1991, MNRAS, 252, 116
- Adelman et al. (1993) Adelman, S. J., Cowley, C. R., Leckrone, D. S., Roby, S. W., & Wahlgren, G. M. 1993, ApJ, 419, 276
- Adelman & Pintado (1997) Adelman, S. J. & Pintado, O. I. 1997, A&AS, 125, 219
- Bohlender et al. (1998) Bohlender, D. A., Dworetsky, M. M., & Jomaron, C. M. 1998, ApJ, 504, 533
- Caffau et al. (2011) Caffau, E., Ludwig, H. G., Steffen, M., Freytag, B., & Bonifacio, P. 2011, Sol. Phys., 268, 255
- Carlsson (1986) Carlsson, M. 1986, Uppsala Astronomical Observatory Reports, 33
- Carlsson (1992) Carlsson, M. 1992, in Astronomical Society of the Pacific Conference Series, Vol. 26, Cool Stars, Stellar Systems, and the Sun, ed. M. S. Giampapa & J. A. Bookbinder, 499
- Castelli & Hubrig (2004) Castelli, F. & Hubrig, S. 2004, A&A, 425, 263
- Castelli & Kurucz (2003) Castelli, F. & Kurucz, R. L. 2003, in IAU Symposium, Vol. 210, Modelling of Stellar Atmospheres, ed. N. Piskunov, W. W. Weiss, & D. F. Gray, A20
- Catanzaro & Leone (2002) Catanzaro, G. & Leone, F. 2002, New A, 7, 495
- Corbally (1984) Corbally, C. J. 1984, ApJS, 55, 657
- Cowley et al. (2007) Cowley, C. R., Hubrig, S., Castelli, F., González, J. F., & Wolff, B. 2007, MNRAS, 377, 1579
- Crause et al. (2014) Crause, L. A., Sharples, R. M., Bramall, D. G., et al. 2014, in Society of Photo-Optical Instrumentation Engineers (SPIE) Conference Series, Vol. 9147, Ground-based and Airborne Instrumentation for Astronomy V, ed. S. K. Ramsay, I. S. McLean, & H. Takami, 91476T
- Cunto & Mendoza (1992) Cunto, W. & Mendoza, C. 1992, Rev. Mexicana Astron. Astrofis., 23
- Deal et al. (2018) Deal, M., Alecian, G., Lebreton, Y., et al. 2018, A&A, 618, A10
- Den Hartog et al. (2003) Den Hartog, E. A., Lawler, J. E., Sneden, C., & Cowan, J. J. 2003, ApJS, 148, 543
- Dimitrijevic & Sahal-Brechot (1984) Dimitrijevic, M. S. & Sahal-Brechot, S. 1984, A&A, 136, 289
- Dolk et al. (2003) Dolk, L., Wahlgren, G. M., & Hubrig, S. 2003, A&A, 402, 299
- Drawin (1969) Drawin, H. W. 1969, Zeitschrift fur Physik, 225, 483
- Dworetsky & Budaj (2000) Dworetsky, M. M. & Budaj, J. 2000, MNRAS, 318, 1264
- Dworetsky et al. (1998) Dworetsky, M. M., Jomaron, C. M., & Smith, C. A. 1998, A&A, 333, 665
- Dworetsky et al. (2008) Dworetsky, M. M., Persaud, J. L., & Patel, K. 2008, MNRAS, 385, 1523
- Ekström et al. (2012) Ekström, S., Georgy, C., Eggenberger, P., et al. 2012, A&A, 537, A146
- Engleman (1989) Engleman, Rolf, J. 1989, ApJ, 340, 1140
- Fuhr et al. (1988) Fuhr, J. R., Martin, G. A., & Wiese, W. L. 1988, Journal of Physical and Chemical Reference Data, 17
- Garrison & Gray (1994) Garrison, R. F. & Gray, R. O. 1994, AJ, 107, 1556
- Grevesse & Sauval (1998) Grevesse, N. & Sauval, A. J. 1998, Space Sci. Rev., 85, 161
- Guitou et al. (2015) Guitou, M., Spielfiedel, A., Rodionov, D., et al. 2015, Chemical Physics, 462, 94 , inelastic Processes in Atomic, Molecular and Chemical Physics
- Hauck & Mermilliod (1998) Hauck, B. & Mermilliod, M. 1998, A&AS, 129, 431
- Hidalgo et al. (2018) Hidalgo, S. L., Pietrinferni, A., Cassisi, S., et al. 2018, ApJ, 856, 125
- Holt et al. (1999) Holt, R. A., Scholl, T. J., & Rosner, S. D. 1999, MNRAS, 306, 107
- Hubeny & Lanz (1992) Hubeny, I. & Lanz, T. 1992, A&A, 262, 501
- Jomaron et al. (1998) Jomaron, C. M., Dworetsky, M. M., & Bohlender, D. A. 1998, Contributions of the Astronomical Observatory Skalnate Pleso, 27, 324
- Kochukhov et al. (2021) Kochukhov, O., Khalack, V., Kobzar, O., et al. 2021, MNRAS, 506, 5328
- Kramida et al. (2018) Kramida, A., Ralchenko, Y., Reader, J., & NIST ASD Team. 2018, http://physics.nist.gov/asd, 5
- Kurtz (1985) Kurtz, D. W. 1985, MNRAS, 213, 773
- Kurucz (1992) Kurucz, R. L. 1992, Rev. Mexicana Astron. Astrofis., 23
- Kurucz (2005) Kurucz, R. L. 2005, Memorie della Societa Astronomica Italiana Supplementi, 8, 14
- Kurucz (2013) Kurucz, R. L. 2013, ATLAS12: Opacity sampling model atmosphere program, Astrophysics Source Code Library
- Kurucz & Avrett (1981) Kurucz, R. L. & Avrett, E. H. 1981, SAO Special Report, 391
- Lanz et al. (1993) Lanz, T., Artru, M. C., Didelon, P., & Mathys, G. 1993, A&A, 272, 465
- Lanz et al. (1988) Lanz, T., Dimitrijevic, M. S., & Artru, M.-C. 1988, A&A, 192, 249
- Lawler et al. (2006) Lawler, J. E., Den Hartog, E. A., Sneden, C., & Cowan, J. J. 2006, ApJS, 162, 227
- Lawler et al. (2001a) Lawler, J. E., Wickliffe, M. E., Cowley, C. R., & Sneden, C. 2001a, ApJS, 137, 341
- Lawler et al. (2001b) Lawler, J. E., Wickliffe, M. E., den Hartog, E. A., & Sneden, C. 2001b, Astrophys. J., 563, 1075, (LWHS)
- Lebreton & Reese (2020) Lebreton, Y. & Reese, D. R. 2020, A&A, 642, A88
- Leone & Manfre (1997) Leone, F. & Manfre, M. 1997, A&A, 320, 257
- Lodders (2010) Lodders, K. 2010, in Astrophysics and Space Science Proceedings, Vol. 16, Principles and Perspectives in Cosmochemistry, 379
- Marques et al. (2013) Marques, J. P., Goupil, M. J., Lebreton, Y., et al. 2013, A&A, 549, A74
- Martin et al. (1988) Martin, G. A., Fuhr, J. R., & Wiese, W. L. 1988, Atomic transition probabilities. Scandium through Manganese
- Merle et al. (2011) Merle, T., Thévenin, F., Pichon, B., & Bigot, L. 2011, MNRAS, 418, 863
- Monier et al. (2015) Monier, R., Gebran, M., & Royer, F. 2015, A&A, 577, A96
- Monier et al. (2018) Monier, R., Gebran, M., Royer, F., Kilicoglu, T., & Frémat, Y. 2018, ApJ, 854, 50
- Monier et al. (2019) Monier, R., Griffin, E., Gebran, M., et al. 2019, AJ, 158, 157
- Monier et al. (2020) Monier, R., Niemczura, E., & Kılıçoğlu, T. 2020, Research Notes of the American Astronomical Society, 4, 234
- Moon & Dworetsky (1985) Moon, T. T. & Dworetsky, M. M. 1985, MNRAS, 217, 305
- Morel & Lebreton (2008) Morel, P. & Lebreton, Y. 2008, Ap&SS, 316, 61
- Napiwotzki et al. (1993) Napiwotzki, R., Schoenberner, D., & Wenske, V. 1993, A&A, 268, 653
- Nielsen et al. (2000) Nielsen, K., Karlsson, H., & Wahlgren, G. M. 2000, A&A, 363, 815
- Nielsen et al. (2005) Nielsen, K. E., Wahlgren, G. M., Proffitt, C. R., Leckrone, D. S., & Adelman, S. J. 2005, AJ, 130, 2312
- Nilsson et al. (2006) Nilsson, H., Ljung, G., Lundberg, H., & Nielsen, K. E. 2006, A&A, 445, 1165
- Pál (2012) Pál, A. 2012, MNRAS, 421, 1825
- Perruchot et al. (2008) Perruchot, S., Kohler, D., Bouchy, F., et al. 2008, in Proc. SPIE, Vol. 7014, Ground-based and Airborne Instrumentation for Astronomy II, 70140J
- Ricker et al. (2015) Ricker, G. R., Winn, J. N., Vanderspek, R., et al. 2015, Journal of Astronomical Telescopes, Instruments, and Systems, 1, 014003
- Roby & Lambert (1990) Roby, S. W. & Lambert, D. L. 1990, ApJS, 73, 67
- Roby et al. (1999) Roby, S. W., Leckrone, D. S., & Adelman, S. J. 1999, ApJ, 524, 974
- Royer et al. (2014) Royer, F., Gebran, M., Monier, R., et al. 2014, A&A, 562, A84
- Ryabchikova et al. (2015) Ryabchikova, T., Piskunov, N., Kurucz, R. L., et al. 2015, Phys. Scr, 90, 054005
- Ryabchikova et al. (2006) Ryabchikova, T., Ryabtsev, A., Kochukhov, O., & Bagnulo, S. 2006, Astron. and Astrophys., 456, 329, (RRKB)
- Ryabchikova et al. (2007) Ryabchikova, T., Sachkov, M., Kochukhov, O., & Lyashko, D. 2007, A&A, 473, 907
- Sakhibullin (1987) Sakhibullin, N. A. 1987, Soviet Ast., 31, 151
- Salpeter (1955) Salpeter, E. E. 1955, ApJ, 121, 161
- Savanov & Hubrig (2003) Savanov, I. & Hubrig, S. 2003, in Astronomical Society of the Pacific Conference Series, Vol. 305, Magnetic Fields in O, B and A Stars: Origin and Connection to Pulsation, Rotation and Mass Loss, ed. L. A. Balona, H. F. Henrichs, & R. Medupe, 230
- Seaton (1962) Seaton, M. J. 1962, Proceedings of the Physical Society, 79, 1105
- Shamey (1969) Shamey, L. J. 1969, PhD thesis, UNIVERSITY OF COLORADO AT BOULDER.
- Smalley et al. (2017) Smalley, B., Antoci, V., Holdsworth, D. L., et al. 2017, MNRAS, 465, 2662
- Smith (1994) Smith, K. C. 1994, A&A, 291, 521
- Smith (1996) Smith, K. C. 1996, Ap&SS, 237, 77
- Smith (1997) Smith, K. C. 1997, A&A, 319, 928
- Smith & Dworetsky (1993) Smith, K. C. & Dworetsky, M. M. 1993, A&A, 274, 335
- Stuik et al. (2017) Stuik, R., Bailey, J. I., Dorval, P., et al. 2017, A&A, 607, A45
- Takeda et al. (2014) Takeda, Y., Kawanomoto, S., & Ohishi, N. 2014, PASJ, 66, 23
- Takeda et al. (1999) Takeda, Y., Takada-Hidai, M., Jugaku, J., Sakaue, A., & Sadakane, K. 1999, PASJ, 51, 961
- Talens et al. (2018) Talens, G. J. J., Deul, E. R., Stuik, R., et al. 2018, A&A, 619, A154
- Talens et al. (2017) Talens, G. J. J., Spronck, J. F. P., Lesage, A. L., et al. 2017, A&A, 601, A11
- Thiam et al. (2010) Thiam, M., LeBlanc, F., Khalack, V., & Wade, G. A. 2010, MNRAS, 405, 1384
- Vidal et al. (1973) Vidal, C. R., Cooper, J., & Smith, E. W. 1973, ApJS, 25, 37
- Wiese et al. (1996) Wiese, W. L., Fuhr, J. R., & Deters, T. M. 1996, Atomic transition probabilities of carbon, nitrogen, and oxygen : a critical data compilation
- Woolf & Lambert (1999) Woolf, V. M. & Lambert, D. L. 1999, ApJ, 521, 414
- Zdravkov & Pamyatnykh (2008) Zdravkov, T. & Pamyatnykh, A. A. 2008, in Journal of Physics Conference Series, Vol. 118, Journal of Physics Conference Series, 012079
Appendix A Determination of uncertainties
For a representative line of a given element, six major sources are included in the uncertainty determinations: the uncertainty on the effective temperature (), on the surface gravity (), on the microturbulent velocity (), on the apparent rotational velocity (), the oscillator strength () and the continuum placement (). These uncertainties are supposed to be independent, so that the total uncertainty for a given transition (i) verifies:
| (A1) |
The mean abundance is then computed as a weighted mean of the individual abundances [X/H]i derived for each transition (i):
| (A2) |
and the total error, is given by:
| (A3) |
where N is the number of lines per element.
Appendix B Identification of the lines for HD 99803A (HR 4423)
The lines in the HARPS spectrum of HD 99803A (HR 4423) absorbing more than 2% of the continuum have been identified using the synthetic spectrum which best fits the observed spectrum. They are collected in the Table 10.
| (Å) | (Å) | Identification | Relative flux | ||
|---|---|---|---|---|---|
| 3901.22 | 3900.515 | Fe I | -0.92 | 26140.176 | 0.41 |
| 3900.550 | Ti II | -0.45 | 9118.260 | ||
| 3903.61 | 3902.945 | Fe I | -0.47 | 12560.933 | 0.87 |
| 3904.42 | 3903.73 | Fe II | -1.49 | 60807.228 | 0.90 |
| 3906.31 | 3905.644 | Cr II | -0.90 | 42986.619 | 0.56 |
| 3906.71 | 3906.035 | Fe II | -1.83 | 44929.549 | 0.74 |
| 3911.99 | 3911.30 | Cr II | -2.06 | 39824.381 | 0.82 |
| 3914.14 | 3913.45 | Ti II | -0.53 | 8997.710 | 0.43 |
| 3914.83 | 3914.14 | Ti II | -2.24 | 15257.430 | 0.92 |
| 3915.18 | 3914.49 | Fe II | -4.05 | 13474.491 | 0.85 |
| 3916.61 | 3915.92 | Zr II | -0.82 | 4248.300 | 0.90 |
| 3918.01 | 3917.32 | Mn II | -1.15 | 55759.270 | 0.93 |
| 3919.20 | 3918.51 | Fe II | -2.10 | 47674.718 | 0.91 |
| 3921.31 | 3920.62 | Fe II | -1.20 | 60625.451 | 0.84 |
| C II | -0.21 | 131735.525 | |||
| 3920.94 | 3920.26 | Fe I | -1.75 | 978.074 | 0.95 |
| 3922.69 | 3922.00 | Fe II | -1.07 | 75603.502 | 0.96 |
| 3923.60 | 3922.912 | Fe I | -1.65 | 415.933 | 0.94 |
| 3925.52 | 3924.83 | Fe II | -1.17 | 78137.366 | 0.96 |
| 3928.60 | 3927.92 | Fe I | -1.59 | 888.132 | 0.92 |
| 3927.925 | Fe I | -2.19 | 22838.320 | ||
| 3930.98 | 3930.28 | Fe I | -1.59 | 704.007 | 0.79 |
| Fe II | -4.03 | 13673.186 | |||
| 3931.33 | 3930.63 | Dy III | -0.88 | 0.000 | 0.86 |
| Y II | -1.61 | 3296.184 | |||
| 3932.70 | 3932.00 | Ti II | -1.78 | 9118.260 | 0.55 |
| 3933.56 | 3932.86 | Fe II | -1.98 | 79285.109 | 0.88 |
| 3933.94 | 3933.24 | S II | 0.58 | 131187.190 | 0.89 |
| 3934.34 | 3933.660 | Ca II | 0.130 | 0.000 | 0.33 |
| 3934.79 | 3934.09 | Zr II | -1.160 | 2572.210 | 0.86 |
| 3935.33 | 3934.63 | Cr II | -2.44 | 81978.081 | 0.91 |
| 3935.47 | 3933.77 | Zr II | -0.90 | 5752.920 | 0.90 |
| 3936.64 | 3935.94 | Ce II | -1.08 | 5675.763 | 0.73 |
| 3937.65 | 3936.95 | Cr II | -4.02 | 39824.381 | 0.92 |
| 3938.49 | 3937.79 | Ti II | -1.13 | 39926.659 | 0.97 |
| 3938.97 | 3938.289 | Fe II | -3.890 | 13474.411 | 0.77 |
| 3943.38 | 3942.68 | Cr II | -2.95 | 65156.56 | 0.91 |
| 3944.55 | 3943.95 | Ti II | -3.69 | 39926.659 | 0.94 |
| 3944.70 | 3944.006 | Al I | -0.620 | 0.000 | 0.91 |
| 3951.05 | 3950.352 | Y II | -0.490 | 840.213 | 0.61 |
| 3945.89 | 3945.19 | Fe II | -4.250 | 13673.186 | 0.87 |
| 3947.99 | 3947.29 | O I | -2.28 | 73768.202 | 0.92 |
| 3948.15 | 3947.45 | O I | -2.43 | 73768.202 | 0.92 |
| 3958.91 | 3958.21 | Zr II | -0.31 | 4248.320 | 0.68 |
| 3949.47 | 3948.77 | Fe I | -0.34 | 26351.038 | 0.94 |
| Fe II | -2.34 | 60807.228 | |||
| 3952.29 | 3951.59 | Y II | -1.98 | 3296.184 | 0.90 |
| 3952.64 | 3951.94 | V II | -0.74 | 11908.270 | 0.91 |
| 3956.06 | 3955.36 | Fe I | -1.01 | 26479.379 | 0.87 |
| 3957.15 | 3956.45 | Fe I | -0.26 | 26105.907 | 0.86 |
| 3957.36 | 3956.710 | Fe I | -0.430 | 21715.731 | 0.85 |
| 3957.59 | 3956.89 | Cr II | -2.18 | 82362.188 | 0.84 |
| 3958.91 | 3958.21 | Zr II | -0.31 | 4248.300 | 0.68 |
| 3960.90 | 3960.20 | Fe I | -1.16 | 29356.743 | 0.74 |
| 3961.59 | 3955.89 | N II | -0.78 | 148940.167 | 0.70 |
| 3962.20 | 3961.60 | Al I | -0.320 | 112.061 | 0.69 |
| 3964.37 | 3963.37 | Fe I | -2.21 | 26406.464 | 0.60 |
| 3969.14 | 3968.44 | Ca II | -0.170 | 0.000 | 0.13 |
| 3969.65 | 3968.95 | Cr I | -0.64 | 20319.554 | 0.79 |
| 3974.84 | 3974.14 | Fe II | -3.51 | 21812.055 | 0.49 |
| 3980.20 | 3979.50 | Cr II | -0.730 | 45730.581 | 0.47 |
| 3982.67 | 3981.97 | Ti II | -2.530 | 4628.581 | 0.75 |
| 3983.28 | 3982.58 | Y II | -0.560 | 1045.083 | 0.56 |
| 3984.67 | 3983.941 | Hg II | -2.900 | 35514.000 | 0.79 |
| 3983.993 | Hg II | -2.400 | 35514.000 | 0.84 | |
| 3984.76 | 3984.06 | Hg II | -1.700 | 35514.000 | 0.79 |
| 3988.29 | 3987.59 | Ti II | -2.73 | 4897.650 | 0.87 |
| 3991.81 | 3991.11 | Zr II | -0.25 | 6111.700 | 0.79 |
| 3994.95 | 3994.25 | Cr II | -1.99 | 50687.621 | 0.96 |
| 3995.98 | 3997.62 | Cr I | -1.85 | 35862.981 | 0.97 |
| 3999.66 | 3998.96 | Zr II | -0.520 | 4205.500 | 0.84 |
| 4001.45 | 4000.74 | Fe II | -3.310 | 82978.679 | 0.97 |
| 4001.89 | 4001.18 | Fe I | -4.01 | 29371.817 | 0.96 |
| 4002.27 | 4001.56 | Ce II | -0.33 | 5010.870 | 0.98 |
| 4002.64 | 4001.95 | Fe II | -3.47 | 22408.852 | 0.98 |
| 4002.76 | 4002.05 | Fe II | -3.47 | 22409.851 | 0.88 |
| 4003.22 | 4002.51 | Fe II | -1.71 | 48039.087 | 0.82 |
| 4003.98 | 4003.27 | Cr II | -0.60 | 52297.808 | 0.71 |
| 4004.59 | 4003.88 | S II | -0.62 | 128233.197 | 0.93 |
| 4005.05 | 4004.34 | Fe II | -3.11 | 79243.598 | 0.94 |
| 4005.94 | 4005.23 | Fe I | -0.61 | 12660.903 | 0.90 |
| 4006.40 | 4005.69 | V II | -0.46 | 14655.630 | 0.95 |
| 4011.74 | 4011.03 | Nd II | -0.83 | 3801.930 | 0.95 |
| 4011.88 | 4011.17 | N I | -2.91 | 86137.352 | 0.96 |
| 4013.08 | 4012.37 | Ti II | -1.61 | 4628.580 | 0.61 |
| 4013.21 | 4012.50 | Cr II | -0.89 | 45669.369 | 0.64 |
| 4013.43 | 4012.72 | Fe II | -0.56 | 88614.518 | 0.98 |
| 4013.87 | 4013.16 | Nd II | -1.15 | 1470.105 | 0.97 |
| 4014.83 | 4014.12 | Ti II | -3.11 | 40074.521 | 0.95 |
| 4015.18 | 4014.67 | Fe II | -3.90 | 78137.366 | 0.93 |
| 4016.17 | 4015.46 | Ni II | -2.42 | 32523.540 | 0.85 |
| 4017.39 | 4016.68 | Co II | -3.06 | 25147.370 | 0.98 |
| 4018.66 | 4017.95 | Cr II | -2.42 | 42986.619 | 0.94 |
| 4019.08 | 4018.37 | Zr II | -0.99 | 7776.020 | 0.97 |
| 4021.23 | 4020.52 | Cr II | -1.33 | 33906.472 | 0.98 |
| 4022.54 | 4021.83 | Fe I | -0.66 | 22249.428 | 0.97 |
| 4022.73 | 4022.02 | Er II | 0.42 | 18463.347 | 0.95 |
| 4023.09 | 4022.39 | Cr II | -2.02 | 45730.581 | 0.92 |
| 4023.90 | 4023.19 | Ti II | -2.170 | 40425.589 | 0.93 |
| 4024.08 | 4023.37 | V II | -0.880 | 14556.090 | 0.93 |
| 4024.47 | 4023.78 | Ni II | -1.78 | 76402.031 | 0.95 |
| 4025.13 | 4024.41 | Zr II | -0.97 | 8058.160 | 0.94 |
| 4025.24 | 4024.54 | Fe II | -2.48 | 36252.917 | 0.75 |
| 4025.82 | 4025.12 | Ti II | -1.98 | 4897.650 | 0.71 |
| 4026.36 | 4025.65 | Fe II | -1.03 | 88723.396 | 0.92 |
| 4026.95 | 4026.24 | He I | -0.70 | 169086.867 | 0.88 |
| He I | -1.45 | 169086.769 | |||
| He I | -1.45 | 169086.845 | |||
| He I | -0.98 | 169086.845 | |||
| 4027.70 | 4026.99 | Cr I | -0.60 | 20593.902 | 0.91 |
| 4029.03 | 4028.32 | Ti II | -1.00 | 15257.430 | 0.56 |
| 4029.45 | 4028.74 | S II | -0.12 | 128599.162 | 0.97 |
| 4029.82 | 4029.11 | Ti II | -3.94 | 40074.521 | 0.97 |
| 4030.09 | 4029.39 | C I | -2.19 | 60393.138 | 0.97 |
| 4030.37 | 4029.66 | Zr II | -0.60 | 5752.920 | 0.89 |
| 4030.80 | 4030.09 | Zr I | -0.36 | 4870.530 | 0.98 |
| 4031.06 | 4030.35 | Cr II | -3.56 | 25033.70 | 0.86 |
| 4031.44 | 4030.73 | Mn I | -0.47 | 0.000 | 0.93 |
| 4032.14 | 4031.43 | Fe II | -3.11 | 38164.105 | 0.94 |
| 4032.30 | 4031.59 | Cr II | -2.76 | 90512.561 | 0.95 |
| 4032.41 | 4031.70 | Al II | -1.16 | 123423.357 | 0.97 |
| 4033.65 | 4032.94 | Fe II | -2.700 | 36252.917 | 0.85 |
| 4033.77 | 4033.06 | Mn I | -0.620 | 0.000 | 0.94 |
| 4034.97 | 4034.26 | Fe II | -3.710 | 38164.195 | 0.94 |
| 4035.18 | 4034.47 | Mn I | -0.810 | 0.000 | 0.97 |
| 4036.34 | 4035.63 | V II | -0.96 | 14461.750 | 0.97 |
| 4037.33 | 4036.62 | Mn I | -1.06 | 30419.611 | 0.97 |
| 4038.68 | 4037.97 | Cr II | -0.56 | 52321.010 | 0.67 |
| 4042.05 | 4041.34 | Mn I | 0.28 | 17052.289 | 0.96 |
| 4042.36 | 4041.65 | Fe II | -3.13 | 44915.046 | 0.98 |
| 4043.37 | 4042.65 | Ce II | -0.08 | 3995.460 | 0.97 |
| 4044.71 | 4044.00 | Fe II | -2.41 | 44929.549 | 0.91 |
| 4044.95 | 4044.24 | Fe I | -3.43 | 33412.716 | 0.97 |
| 4045.17 | 4044.45 | Fe I | -1.22 | 33095.940 | 0.90 |
| 4046.31 | 4045.60 | Zr II | -0.60 | 5724.380 | 0.91 |
| 4046.51 | 4045.80 | Fe I | 0.28 | 4045.812 | 0.68 |
| 4047.56 | 4046.85 | Fe II | -4.10 | 36252.917 | 0.98 |
| 4048.02 | 4047.31 | Fe II | -4.11 | 84870.863 | 0.97 |
| 4048.18 | 4047.47 | C I | -3.93 | 64090.948 | 0.97 |
| 4049.36 | 4948.65 | Zr II | -0.34 | 6467.610 | 0.88 |
| 4049.53 | 4048.82 | Fe II | -2.05 | 44915.046 | 0.85 |
| 4049.80 | 4049.093 | Cr II | -0.86 | 52297.808 | 0.77 |
| 4050.55 | 4049.83 | Mn II | -3.90 | 39808.460 | 0.98 |
| 4051.02 | 4050.30 | Zr II | -1.00 | 5752.92 | 0.94 |
| 4051.29 | 4050.57 | Dy II | -0.23 | 4755.660 | 0.96 |
| 4051.90 | 4051.18 | Fe II | -2.99 | 44929.549 | 0.96 |
| 4052.64 | 4051.93 | Cr II | -2.19 | 25033.700 | 0.64 |
| 4053.18 | 4052.46 | Fe II | -1.57 | 79331.503 | 0.95 |
| 4054.14 | 4053.43 | Cr II | -3.37 | 25042.811 | 0.93 |
| 4054.51 | 4053.83 | Ti II | -1.21 | 15265.619 | 0.64 |
| 4054.78 | 4054.07 | Cr II | -2.47 | 25046.759 | 0.71 |
| 4056.77 | 4056.06 | Cr II | -3.27 | 45669.369 | 0.89 |
| 4056.87 | 4056.15 | Ti II | -2.68 | 4897.650 | 0.95 |
| 4058.15 | 4057.46 | Fe II | -1.55 | 58666.256 | 0.90 |
| 4061.79 | 4060.98 | Nd II | 0.57 | 3801.930 | 0.96 |
| 4062.48 | 4061.76 | Fe II | -2.65 | 48039.087 | 0.96 |
| 4062.94 | 4062.23 | Fe I | -0.75 | 27166.817 | 0.89 |
| 4064.29 | 4063.58 | Fe I | 0.07 | 12560.933 | 0.74 |
| 4064.74 | 4064.02 | Cr II | -4.37 | 25046.759 | 0.95 |
| 4065.06 | 4064.35 | Ti II | -1.61 | 20951.620 | 0.93 |
| 4066.37 | 4065.65 | Cr I | -0.02 | 33113.234 | 0.91 |
| 4066.59 | 4065.87 | Mn II | -3.76 | 43696.190 | 0.98 |
| 4067.73 | 4067.03 | Ni II | -1.29 | 32499.529 | 0.70 |
| 4067.33 | 4066.61 | Cr I | -0.49 | 36577.647 | 0.96 |
| 4068.68 | 4067.96 | Fe I | -0.43 | 25899.986 | 0.96 |
| 4069.11 | 4068.39 | Ce II | -2.63 | 281123.060 | 0.96 |
| 4070.58 | 4069.86 | Fe II | -2.75 | 47674.718 | 0.95 |
| 4071.09 | 4070.37 | Mn I | -0.95 | 17637.150 | 0.86 |
| 4071.55 | 4070.84 | Cr II | -0.75 | 52321.010 | 0.72 |
| 4072.44 | 4071.73 | Fe I | -0.02 | 12968.554 | 0.76 |
| 4073.25 | 4072.56 | Cr II | -2.41 | 29951.880 | 0.76 |
| 4071.81 | 4071.09 | Zr II | -1.60 | 8058.160 | 0.98 |
| 4073.42 | 4072.70 | Si II | -2.37 | 79338.502 | 0.98 |
| 4074.46 | 4073.74 | Ce II | -0.18 | 8448.641 | 0.98 |
| 4074.80 | 4074.08 | Fe II | -3.14 | 47674.718 | 0.96 |
| 4075.97 | 4075.25 | Mn I | -0.86 | 34938.701 | 0.97 |
| 4076.33 | 4075.62 | Cr II | -3.47 | 25035.399 | 0.93 |
| 4076.65 | 4075.93 | Fe II | -3.38 | 20516.959 | 0.93 |
| 4076.14 | 4075.42 | Si II | -1.40 | 79355.019 | 0.87 |
| 4077.06 | 4076.34 | Fe I | -3.76 | 29732.735 | 0.87 |
| 4077.33 | 4076.61 | Fe I | -0.36 | 25899.986 | 0.96 |
| 4077.57 | 4076.86 | Cr II | -2.76 | 25042.811 | 0.80 |
| 4077.74 | 4077.02 | Zr II | -1.60 | 7736.020 | 0.96 |
| 4078.23 | 4077.52 | Cr II | -2.78 | 25046.759 | 0.80 |
| 4078.42 | 4077.71 | Sr II | 0.15 | 0.00 | 0.62 |
| 4082.15 | 4081.43 | Mn II | -2.24 | 49291.313 | 0.90 |
| 4082.99 | 4082.28 | Cr II | -1.23 | 42897.990 | 0.73 |
| 4086.83 | 4085.52 | Mn II | -2.52 | 43395.381 | 0.69 |
| 4088.30 | 4087.59 | Cr II | -3.22 | 25035.399 | 0.79 |
| 4090.19 | 4089.49 | Cr II | -4.05 | 42897.990 | 0.78 |
| 4091.23 | 4090.54 | Zr II | -1.01 | 6111.700 | 0.77 |
| 4099.14 | 4098.41 | Cr II | -1.47 | 42986.619 | 0.41 |
| 4111.33 | 4110.60 | Mn II | -1.51 | 49465.130 | 0.73 |
| 4111.71 | 4110.98 | Cr II | -2.02 | 30307.439 | 0.46 |
| 4111.00 | Fe II | -1.92 | 25033.700 | ||
| 4112.58 | 4111.85 | fe II | -2.16 | 48030.087 | 0.75 |
| 4113.26 | 4112.53 | Cr II | -3.02 | 25042.811 | 0.75 |
| 4113.93 | 4113.20 | Cr II | -2.27 | 25046.759 | 0.68 |
| 4117.88 | 4117.15 | P II | -2.04 | 103667.860 | 0.86 |
| 4119.25 | 4118.52 | Fe I | 0.280 | 28819.950 | 0.85 |
| 4120.22 | 4120.70 | Hg II | -1.21 | 108298.003 | 0.85 |
| 4122.00 | 4121.27 | ? | 0.88 | ||
| 4125.49 | 4124.76 | Fe II | -4.20 | 20516.959 | 0.91 |
| 4125.61 | 4124.88 | Y II | -1.50 | 3296.184 | 0.87 |
| 4127.78 | 4127.05 | Cr II | -1.77 | 45730.581 | 0.85 |
| 4128.08 | 4127.35 | Cr I | 0.01 | 33113.234 | 0.92 |
| 4128.79 | 4128.06 | Si II | 0.360 | 79338.502 | 0.57 |
| 4129.45 | 4128.74 | Fe II | -3.600 | 20830.553 | 0.82 |
| 4129.86 | 4129.13 | Ti II | 15265.619 | 0.90 | |
| 4123.37 | 4122.64 | Fe II | -3.38 | 20830.582 | 0.73 |
| 4125.51 | 4124.77 | Fe II | -4.20 | 20516.959 | 0.90 |
| 4125.63 | 4124.89 | Y II | -1.50 | 3296.184 | 0.88 |
| 4127.78 | 4127.04 | Cr II | -1.77 | 45730.581 | 0.84 |
| 4128.08 | 4127.34 | Ce II | 0.11 | 5513.709 | 0.91 |
| 4129.47 | 4128.73 | Fe II | -3.77 | 20830.582 | 0.80 |
| 4129.85 | 4129.11 | Ti II | -4.00 | 15265.619 | 0.89 |
| 4131.37 | 4130.63 | Ba II | 0.68 | 21952.423 | 0.79 |
| 4131.58 | 4130.84 | Si II | -0.780 | 79355.019 | 0.57 |
| 4130.890 | Si II | 0.550 | 79355.019 | ||
| 4131.37 | 4130.63 | Ba II | 0.68 | 21952.423 | 0.79 |
| 4132.76 | 4132.02 | Fe I | -0.650 | 12969.554 | 0.90 |
| 4133.12 | 4132.38 | Cr II | -2.35 | 30307.439 | 0.76 |
| 4134.01 | 4133.27 | Nd II | -0.52 | 2585.460 | 0.95 |
| 4135.80 | 4135.06 | Mn I | -0.03 | 34250.519 | 0.96 |
| 4136.01 | 4135.57 | C I | -3.07 | 64086.919 | 0.96 |
| 4136.99 | 4136.25 | C I | -4.22 | 64090.948 | 0.97 |
| 4138.92 | 4138.18 | Fe II | -3.18 | 38164.195 | 0.95 |
| 4139.11 | 4138.38 | Fe II | -4.47 | 22810.356 | 0.95 |
| 4140.44 | 4139.70 | Fe II | -3.72 | 36252.917 | 0.98 |
| 4142.75 | 4142.01 | ? | 0.93 | ||
| 4142.98 | 4142.24 | S II | 0.24 | 127825.085 | 0.96 |
| 4143.21 | 4142.47 | Fe I | -1.88 | 35237.323 | 0.92 |
| 4144.13 | 4143.39 | Fe I | -0.20 | 24574.652 | 0.94 |
| 4144.58 | 4143.04 | Fe II | -3.59 | 48039.087 | 0.88 |
| 4145.10 | 4144.36 | Fe II | -3.98 | 84685.198 | 0.94 |
| 4145.84 | 4145.10 | S II | 0.23 | 127976.340 | 0.90 |
| 4146.49 | 4145.75 | Cr II | -1.16 | 42897.990 | 0.60 |
| 4147.10 | 4146.36 | Cr II | -3.15 | 30307.439 | 0.94 |
| Fe II | -1.70 | 89119.456 | |||
| 4148.52 | 4147.78 | C I | -2.76 | 64089.851 | 0.96 |
| 4149.91 | 4149.17 | Zr II | -0.03 | 6467.610 | 0.74 |
| 4150.96 | 4150.22 | Fe II | -2.90 | 49100.978 | 0.98 |
| 4151.27 | 4150.53 | Fe II | -1.70 | 89119.456 | 0.98 |
| Cr II | -1.34 | 42986.619 | |||
| 4151.70 | 4150.96 | Zr II | -0.99 | 6467.610 | 0.86 |
| 4153.23 | 4152.49 | N I | -1.87 | 83364.621 | 0.97 |
| 4153.80 | 4153.06 | S II | 0.39 | 128233.197 | 0.94 |
| 4154.14 | 4153.40 | C I | -2.65 | 64089.851 | 0.98 |
| 4155.23 | 4154.49 | Fe I | -0.69 | 22838.320 | 0.98 |
| 4155.55 | 4154.81 | Fe I | -0.37 | 27166.817 | 0.97 |
| 4156.14 | 4155.40 | Fe II | -3.74 | 83364.621 | 0.97 |
| 4156.96 | 4156.22 | Zr II | -0.78 | 5724.380 | 0.91 |
| 4157.12 | 4156.38 | Fe II | -3.62 | 86416.331 | 0.98 |
| 4157.50 | 4156.76 | Fe I | -0.62 | 22838.320 | 0.99 |
| 4158.12 | 4157.38 | ? | 0.98 | ||
| 4158.49 | 4157.75 | Fe I | -0.40 | 27559.582 | 0.97 |
| 4158.98 | 4158.24 | Ti II | -0.48 | 43780.791 | 0.96 |
| 4160.53 | 4159.79 | Al II | -1.53 | 123420.446 | 0.97 |
| 4161.12 | 4160.38 | Fe II | -4.45 | 38214.506 | 0.97 |
| 4161.79 | 4161.05 | Cr II | -2.47 | 42986.619 | 0.92 |
| 4161.92 | 4161.18 | Zr II | -0.72 | 5752.920 | 0.87 |
| 4162.25 | 4161.51 | Ti II | -2.36 | 8744.250 | 0.82 |
| 4162.97 | 4162.23 | S II | -1.20 | 140379.232 | 0.93 |
| 4163.38 | 4162.64 | S II | 0.82 | 128599.162 | 0.93 |
| 4164.36 | 4163.65 | Ti II | -0.40 | 20891.660 | 0.52 |
| 4166.72 | 4165.98 | Ba II | -0.42 | 21952.423 | 0.96 |
| 4168.04 | 4167.30 | Fe II | -0.56 | 90300.626 | 0.97 |
| 4171.23 | 4170.49 | C I | -3.40 | 64089.851 | 0.93 |
| 4171.33 | 4170.59 | Cr II | -3.05 | 25035.399 | 0.92 |
| 4171.57 | 4170.03 | Fe II | -5.41 | 18360.647 | 0.94 |
| 4171.76 | 4171.02 | Mn II | -2.36 | 49427.321 | 0.96 |
| 4172.63 | 4171.89 | Cr II | -2.38 | 25042.811 | 0.54 |
| Ti II | -0.56 | 20951.620 | |||
| 4172.78 | 4172.04 | Fe I | -0.90 | 26224.966 | 0.90 |
| 4173.32 | 4171.58 | Mn II | -2.12 | 48920.159 | 0.82 |
| 4173.31 | 4172.57 | Fe I | -4.01 | 35856.400 | 0.80 |
| 4174.17 | 4173.43 | Zr I | -0.45 | 14791.280 | 0.58 |
| 4174.79 | 4174.05 | Ti II | -1.25 | 20951.620 | 0.89 |
| 4175.03 | 4174.29 | S II | 0.76 | 140319.232 | 0.91 |
| 4176.85 | 4176.11 | Fe II | -3.15 | 82978.679 | 0.96 |
| 4177.02 | 4176.28 | Mn II | -3.35 | 82232.179 | 0.94 |
| 4178.24 | 4177.50 | Y II | -0.16 | 3296.184 | 0.57 |
| 4178.74 | 4178.00 | Sm II | -0.93 | 4386.030 | 0.97 |
| Sm II | -1.29 | 1489.160 | |||
| 4179.58 | 4178.84 | Fe II | -2.48 | 20830.582 | 0.58 |
| 4180.14 | 4179.40 | Cr II | -1.77 | 30864.459 | 0.62 |
| 4180.53 | 4179.79 | Zr II | -0.78 | 13428.500 | 0.95 |
| 4181.08 | 4180.34 | ? | 0.95 | ||
| 4181.52 | 4180.79 | Yb II | -0.29 | 30932.230 | 0.96 |
| 4182.50 | 4181.76 | Fe I | -0.18 | 22838.320 | 0.95 |
| 4185.03 | 4184.29 | Ti II | -1.86 | 8710.440 | 0.90 |
| 4185.18 | 4184.44 | Mn II | -1.95 | 49889.858 | 0.97 |
| 4185.61 | 4184.87 | Fe I | -0.86 | 22838.320 | 0.98 |
| 4186.37 | 4185.63 | Fe II | -3.42 | 82978.679 | 0.95 |
| 4187.15 | 4186.41 | Fe II | -3.04 | 91167.935 | 0.94 |
| 4187.41 | 4186.67 | Zr II | -0.58 | 14162.900 | 0.96 |
| 4187.77 | 4187.03 | Fe I | -0.55 | 19757.031 | 0.96 |
| 4188.08 | 4187.34 | Ce II | -0.31 | 4459.872 | 0.97 |
| 4188.57 | 4187.83 | Ni II | -2.68 | 32499.529 | 0.88 |
| 4189.72 | 4188.98 | Ti II | -0.59 | 43740.650 | 0.96 |
| 4190.74 | 4190.00 | Mn I | -0.27 | 34250.519 | 0.93 |
| 4192.78 | 4192.04 | Ni II | -3.06 | 32523.540 | 0.94 |
| 4196.14 | 4195.40 | Cr II | -2.32 | 42897.990 | 0.78 |
| 4198.42 | 4197.68 | Ce II | -0.84 | 3995.460 | 0.93 |
| 4199.83 | 4199.09 | Fe I | 0.25 | 24574.652 | 0.89 |
| 4200.20 | 4199.46 | Fe II | -0.23 | 89924.175 | 0.94 |
| 4201.00 | 4200.26 | Mn II | -1.74 | 49882.153 | 0.95 |
| 4201.36 | 4200.62 | Si II | -0.82 | 101023.046 | 0.92 |
| 4202.75 | 4202.01 | Fe I | -0.71 | 11976.238 | 0.91 |
| 4203.25 | 4202.51 | Fe II | -2.33 | 54902.315 | 0.96 |
| 4205.43 | 4204.69 | Y II | -1.76 | 0.000 | 0.92 |
| 4206.11 | 4205.60 | Fe II | -0.30 | 90386.527 | 0.89 |
| 4206.34 | 4205.83 | ? | 0.96 | ||
| 4208.09 | 4207.35 | Cr II | -2.47 | 30864.459 | 0.85 |
| 4209.82 | 4209.08 | Zr II | -0.46 | 5752.920 | 0.93 |
| 4210.55 | 4209.81 | Cr II | -1.81 | 45730.581 | 0.98 |
| 4211.08 | 4210.34 | Fe I | -1.24 | 24772.016 | 0.98 |
| 4211.80 | 4211.06 | Cr II | -3.45 | 42986.619 | 0.98 |
| 4212.60 | 4211.86 | Zr II | -1.08 | 4268.300 | 0.93 |
| 4214.24 | 4213.50 | Fe II | -2.21 | 62689.878 | 0.97 |
| 4216.26 | 4215.52 | Sr II | -0.17 | 0.000 | 0.68 |
| 4216.48 | 4215.74 | Cr II | -2.63 | 25035.399 | 0.86 |
| 4216.90 | 4216.16 | Fe I | 0.000 | 0.97 | |
| 4217.80 | 4217.06 | Cr II | -2.81 | 25042.811 | 0.92 |
| 4220.09 | 4219.35 | Fe I | 0.12 | 28819.952 | 0.95 |
| 4221.55 | 4220.81 | ? | 0.96 | ||
| 4222.73 | 4221.99 | Cr II | -1.93 | 45669.369 | 0.92 |
| 4222.95 | 4222.21 | Fe I | -0.97 | 19757.031 | 0.97 |
| 4223.50 | 4222.76 | Fe II | -1.23 | 88723.398 | 0.96 |
| 4224.17 | 4223.43 | Fe II | -3.40 | 82978.679 | 0.96 |
| 4224.80 | 4224.06 | Cr II | -2.53 | 31117.390 | 0.94 |
| 4225.58 | 4224.84 | Cr II | -1.73 | 42986.619 | 0.62 |
| N I | -1.49 | 83317.831 | |||
| 4226.04 | 4225.30 | Pr II | 0.11 | 0.000 | 0.91 |
| Sm II | -1.13 | 0.000 | |||
| 4226.77 | 4226.03 | Fe II | -1.33 | 99331.196 | 0.92 |
| 4227.46 | 4226.72 | Ca I | 0.24 | 0.000 | 0.97 |
| 4228.07 | 4227.33 | Ti II | -2.36 | 9118.260 | 0.91 |
| 4228.15 | 4227.41 | Fe I | 0.23 | 26874.547 | 0.91 |
| 4230.53 | 4229.79 | Cr II | -3.32 | 30864.459 | 0.95 |
| 4232.92 | 4232.18 | Cr I | -0.50 | 33935.424 | 0.95 |
| 4233.90 | 4233.16 | Fe II | -2.00 | 20830.582 | 0.50 |
| Cr II | -2.12 | 31168.581 | |||
| 4234.34 | 4233.60 | Fe I | -0.60 | 20019.633 | 0.95 |
| 4235.26 | 4234.52 | V II | -1.16 | 30318.531 | 0.93 |
| 4236.47 | 4235.73 | Y II | -1.50 | 1045.083 | 0.89 |
| 4236.45 | 4235.71 | Y II | -1.50 | 1045.076 | 0.89 |
| 4236.69 | 4235.95 | Fe I | -0.34 | 19562.437 | 0.92 |
| 4237.13 | 4236.39 | Cr II | -3.30 | 25033.700 | 0.94 |
| 4238.12 | 4237.39 | ? | 0.96 | ||
| 4239.51 | 4238.77 | Cr II | -4.04 | 25046.759 | 0.92 |
| 4239.93 | 4239.19 | Mn II | -2.25 | 43311.301 | 0.96 |
| 4241.68 | 4240.94 | Fe I | -2.29 | 35611.622 | 0.93 |
| 4243.09 | 4242.35 | Mn II | -1.26 | 49820.159 | 0.52 |
| Cr II | -0.39 | 31219.350 | |||
| 4243.65 | 4242.91 | Mn II | -2.99 | 43339.400 | 0.98 |
| 4244.11 | 4243.37 | Fe I | -1.71 | 29356.743 | 0.97 |
| 4244.98 | 4244.24 | Mn II | -2.40 | 43339.420 | 0.95 |
| 4245.54 | 4244.80 | Ni II | -3.11 | 32523.540 | 0.95 |
| 4246.14 | 4245.40 | Fe II | -3.92 | 49506.935 | 0.94 |
| 4247.14 | 4246.40 | Cr II | -3.22 | 31082.940 | 0.93 |
| 4247.56 | 4246.82 | Sc II | 0.24 | 2540.950 | 0.48 |
| 4248.17 | 4247.43 | Fe I | -0.23 | 27166.817 | 0.96 |
| 4249.42 | 4248.68 | Ce II | 0.11 | 5513.709 | 0.96 |
| 4250.10 | 4249.35 | Fe II | -2.49 | 46482.749 | 0.93 |
| 4250.86 | 4250.05 | Fe I | -0.91 | 19912.499 | 0.94 |
| 4251.16 | 4250.41 | Fe II | -1.75 | 61974.931 | 0.94 |
| 4251.52 | 4250.77 | Fe I | -0.71 | 12560.933 | 0.93 |
| 4251.96 | 4251.21 | Ar I | -1.86 | 93143.762 | 0.96 |
| 4252.36 | 4252.60 | Cr II | -2.02 | 31117.390 | 0.63 |
| 4253.69 | 4252.95 | Mn II | -1.14 | 49889.858 | 0.86 |
| 4253.84 | 4253.09 | Mn II | -2.09 | 49889.858 | 0.96 |
| 4255.07 | 4254.32 | Cr I | -0.11 | 0.000 | 0.79 |
| 4255.26 | 4254.51 | Cr II | -0.97 | 47354.440 | 0.74 |
| 4256.85 | 4256.10 | Cr II | -1.46 | 67448.368 | 0.89 |
| 4257.47 | 4256.72 | Fe II | -3.63 | 83559.539 | 0.95 |
| 4258.14 | 4257.39 | S II | -0.01 | 140750.335 | 0.97 |
| 4258.77 | 4258.02 | Zr II | -1.13 | 4505.500 | 0.94 |
| 4258.89 | 4258.14 | fe II | -3.40 | 21812.055 | 0.82 |
| 4259.08 | 4258.33 | Fe II | -4.13 | 21308.040 | 0.94 |
| 4259.79 | 4259.04 | Mn II | -3.61 | 45073.562 | 0.91 |
| 4259.93 | 4259.18 | Mn II | -2.97 | 43537.180 | 0.90 |
| 4261.21 | 4260.47 | Mn II | -4.25 | 14901.180 | 0.80 |
| Cr II | -1.46 | 67448.568 | |||
| 4262.65 | 4261.90 | Cr II | -1.53 | 31168.581 | 0.50 |
| 4264.61 | 4263.86 | Fe II | -1.71 | 62049.023 | 0.93 |
| 4269.63 | 4268.88 | Cr II | -1.57 | 52297.808 | 0.90 |
| 4270.01 | 4169.26 | Cr II | -2.17 | 31082.940 | 0.65 |
| 4270.47 | 4269.72 | S II | 0.08 | 129787.825 | 0.92 |
| 4271.89 | 4271.14 | Fe I | -0.35 | 19757.031 | 0.93 |
| 4272.50 | 4271.75 | Fe I | -0.16 | 11976.238 | 0.80 |
| 4272.64 | 4271.89 | Cr II | -3.26 | 21812.055 | 0.92 |
| 4274.08 | 4273.31 | Ti II | -2.61 | 42208.591 | 0.75 |
| 4274.87 | 4274.12 | Ti II | -2.61 | 42208.591 | 0.94 |
| 4275.54 | 4274.78 | Cr I | -0.23 | 0.000 | 0.83 |
| 4276.30 | 4275.55 | Cr II | -1.71 | 31117.390 | 0.53 |
| 4277.46 | 4276.71 | Fe I | -1.85 | 26351.208 | 0.96 |
| 4278.27 | 4277.52 | Ti II | -0.83 | 40074.521 | 0.95 |
| 4278.79 | 4278.14 | Fe II | -3.82 | 21711.917 | 0.87 |
| 4282.69 | 4281.94 | Mn II | -2.55 | 43339.420 | 0.96 |
| Mn II | -0.65 | 85895.298 | |||
| 4283.50 | 4282.75 | Gd II | -0.73 | 13030.786 | 0.94 |
| 4284.51 | 4283.76 | Mn II | -2.20 | 43339.420 | 0.91 |
| 4284.93 | 4284.18 | Cr II | -1.86 | 31082.940 | 0.57 |
| 4285.17 | 4284.42 | Mn II | -2.27 | 43311.301 | 0.93 |
| 4287.02 | 4286.27 | Fe II | -1.62 | 62171.614 | 0.91 |
| 4288.61 | 4287.86 | Ti II | -2.02 | 8710.440 | 0.71 |
| 4288.79 | 4288.04 | Mn II | -2.76 | 43311.301 | 0.95 |
| 4289.53 | 4288.78 | Cr II | -1.53 | 81232.918 | 0.90 |
| 4290.46 | 4289.71 | Cr I | -0.36 | 0.000 | 0.45 |
| 4290.96 | 4290.21 | Ti II | -1.12 | 9395.710 | 0.51 |
| 4292.95 | 4292.20 | Mn II | -2.23 | 43395.381 | 0.89 |
| 4293.41 | 4292.66 | Cr II | -1.26 | 93974.028 | 0.89 |
| 4294.84 | 4294.08 | Ti II | -1.11 | 8744.250 | 0.49 |
| 4295.15 | 4294.40 | S II | 0.55 | 130134.156 | 0.94 |
| 4295.51 | 4294.75 | Sc II | -1.28 | 4083.570 | 0.90 |
| 4295.89 | 4295.14 | Cr II | -1.54 | 67333.829 | 0.89 |
| 4297.31 | 4296.56 | Fe II | -3.01 | 21812.055 | 0.65 |
| 4298.55 | 4297.79 | Cr I | 0.25 | 31055.280 | 0.92 |
| 4299.36 | 4298.60 | Ti I | -0.05 | 6598.764 | 0.88 |
| 4300.59 | 4299.83 | Cr II | -1.37 | 62688.949 | 0.93 |
| 4300.79 | 4300.03 | Ti II | -0.77 | 9518.060 | 0.46 |
| 4301.24 | 4300.48 | Cr I | -0.43 | 27703.776 | 0.89 |
| 4302.67 | 4301.91 | Ti II | -1.16 | 9363.620 | 0.56 |
| 4303.93 | 4303.17 | Fe II | -2.49 | 21812.055 | 0.57 |
| 4306.45 | 4305.69 | Sc II | -1.22 | 4802.850 | 0.87 |
| 4307.67 | 4306.91 | Cr II | -1.18 | 47372.533 | 0.80 |
| 4308.63 | 4307.87 | Ti II | -1.29 | 9395.710 | 0.52 |
| Fe I | -0.07 | 12560.933 | |||
| 4310.37 | 4309.61 | Y II | -0.75 | 1449.808 | 0.70 |
| 4313.60 | 4312.84 | Ti II | -1.16 | 9518.060 | 0.49 |
| 4314.28 | 4313.52 | Fe II | -3.16 | 90780.619 | 0.88 |
| 4314.83 | 4314.07 | Sc II | -0.10 | 4987.790 | 0.57 |
| 4315.07 | 4314.31 | Fe II | -3.48 | 21581.638 | 0.77 |
| 4315.73 | 4314.97 | Ti II | -1.13 | 9363.620 | 0.54 |
| Fe II | -3.10 | 38164.195 | |||
| Cr II | -1.66 | 67344.031 | |||
| 4317.53 | 4316.77 | Ti II | -1.42 | 16515.860 | 0.77 |
| 4320.41 | 4319.65 | Fe II | -1.76 | 63272.974 | 0.88 |
| 4321.48 | 4320.72 | Sc II | -0.26 | 4883.570 | 0.59 |
| 4321.70 | 4320.94 | Ti II | -1.87 | 9395.710 | 0.69 |
| 4322.05 | 4321.29 | Fe II | -1.83 | 63465.106 | 0.88 |
| 4325.75 | 4324.99 | Sc II | -0.44 | 4802.870 | 0.59 |
| 4326.51 | 4325.75 | Fe I | -0.01 | 12968.554 | 0.68 |
| 4327.40 | 4326.64 | Mn II | -1.25 | 43537.180 | 0.73 |
| 4330.99 | 4330.23 | Ti II | -1.40 | 16515.860 | 0.65 |
| 4331.46 | 4330.70 | Ti II | -2.04 | 9518.060 | 0.64 |
| 4338.66 | 4337.90 | Ti II | -1.13 | 8710.440 | 0.28 |
| 4345.02 | 4344.26 | Ti II | -2.09 | 8744.250 | 0.97 |
| 4351.58 | 4350.82 | Ti II | -1.40 | 16625.110 | 0.70 |
| 4352.53 | 4351.77 | Fe II | -2.10 | 21812.055 | 0.48 |
| 4353.35 | 4352.58 | Cr II | -3.26 | 31531.239 | 0.80 |
| 4355.10 | 4354.33 | Fe II | -1.39 | 61726.078 | 0.83 |
| 4358.35 | 4357.58 | Fe II | -2.11 | 49100.978 | 0.83 |
| 4359.47 | 4358.70 | Y II | -1.32 | 840.213 | 0.80 |
| 4361.40 | 4360.63 | Ti II | -2.04 | 9518.060 | 0.92 |
| 4362.01 | 4361.24 | Fe II | -2.11 | 49506.935 | 0.89 |
| 4362.85 | 4362.08 | Ni II | -2.72 | 32499.529 | 0.88 |
| 4363.68 | 4362.91 | Cr II | -1.89 | 45669.369 | 0.85 |
| 4365.98 | 4365.21 | Mn II | -1.35 | 53017.157 | 0.94 |
| 4368.40 | 4367.63 | Ti II | -1.27 | 20891.660 | 0.68 |
| 4368.70 | 4367.93 | Fe II | -2.27 | 90593.499 | 0.94 |
| 4368.88 | 4368.11 | Cr II | -3.02 | 31531.239 | 0.88 |
| 4369.00 | 4368.23 | O I | -2.03 | 76794.977 | 0.89 |
| 4370.16 | 4369.39 | Fe II | -3.67 | 22409.852 | 0.85 |
| 4371.71 | 4370.94 | Zr II | -0.86 | 9472.800 | 0.93 |
| 4374.24 | 4373.47 | Fe II | -3.48 | 50157.455 | 0.93 |
| 4375.21 | 4374.76 | Ti II | -1.29 | 16625.110 | 0.67 |
| 4375.58 | 4374.82 | Ti II | -1.21 | 16625.244 | 0.80 |
| 4375.69 | 4374.93 | Y II | 0.16 | 3296.184 | 0.58 |
| 4380.37 | 4379.60 | Mn II | -1.85 | 43850.421 | 0.95 |
| 4380.53 | 4379.75 | Zr II | -0.36 | 12359.661 | 0.90 |
| 4383.28 | 4382.51 | Fe III | -3.02 | 66522.952 | 0.96 |
| 4383.60 | 4382.83 | Cr I | -1.59 | 21856.929 | 0.95 |
| 4384.30 | 4383.83 | Fe I | -2.97 | 34039.515 | 0.69 |
| 4384.84 | 4384.07 | Fe II | -2.28 | 50212.823 | 0.94 |
| 4385.07 | 4384.30 | Fe II | -3.50 | 21430.359 | 0.83 |
| 4385.41 | 4384.64 | Mg II | -0.79 | 80619.500 | 0.82 |
| 4385.47 | 4384.80 | Sc II | -1.56 | 4802.870 | 0.94 |
| 4386.13 | 4385.36 | Fe II | -2.57 | 22409.852 | 0.59 |
| 4387.62 | 4386.85 | Ti II | -1.26 | 20951.620 | 0.72 |
| 4391.34 | 4390.57 | Mg II | -1.42 | 80650.022 | 0.78 |
| Mg II | -0.52 | 80650.022 | |||
| 4391.78 | 4391.02 | Ti II | -2.75 | 9930.690 | 0.88 |
| 4392.56 | 4391.79 | Cr II | -2.60 | 44307.091 | 0.93 |
| 4394.82 | 4394.06 | Ti II | -1.59 | 9850.900 | 0.74 |
| 4395.78 | 4395.02 | Ti II | -0.66 | 8744.260 | 0.48 |
| 4396.60 | 4395.83 | Ti II | -2.17 | 10024.730 | 0.79 |
| 4398.76 | 4397.99 | Y II | -1.00 | 1045.083 | 0.79 |
| 4399.05 | 4398.28 | Ti II | -2.39 | 9872.730 | 0.89 |
| 4400.55 | 4399.77 | Ti II | -1.27 | 9975.920 | 0.58 |
| 4400.84 | 4400.06 | Cr II | -1.13 | 93966.448 | 0.97 |
| 4401.15 | 4400.37 | Sc II | -0.51 | 4883.570 | 0.72 |
| 4403.62 | 4402.84 | Fe II | -2.72 | 49506.935 | 0.93 |
| 4405.52 | 4404.74 | Fe I | -0.14 | 12560.933 | 0.81 |
| 4408.93 | 4408.15 | Cr II | -1.63 | 93574.441 | 0.93 |
| 4408.54 | 4407.76 | Ti II | -2.47 | 9850.900 | 0.96 |
| 4410.27 | 4409.49 | Ti II | -2.57 | 9930.690 | 0.89 |
| 4411.82 | 4411.04 | Ti II | -1.06 | 24961.031 | 0.72 |
| 4412.70 | 4411.92 | Ti II | -2.41 | 9872.730 | 0.94 |
| 4414.68 | 4413.90 | Co II | 40695.028 | 0.96 | |
| 4415.29 | 4414.51 | Zr II | -1.17 | 9968.650 | 0.98 |
| 4415.51 | 4414.73 | Cr II | -3.18 | 42897.990 | 0.97 |
| 4415.88 | 4415.10 | Fe I | -0.62 | 12968.554 | 0.91 |
| 4416.31 | 4415.53 | Sc II | -0.64 | 4802.870 | 0.76 |
| 4417.59 | 4416.81 | Fe II | -2.60 | 22409.852 | 0.60 |
| 4418.49 | 4417.71 | Ti II | -1.43 | 9395.710 | 0.58 |
| 4419.09 | 4418.31 | Ti II | -2.46 | 9975.290 | 0.80 |
| 4420.35 | 4419.57 | Fe III | -2.22 | 66464.680 | 0.97 |
| 4421.88 | 4421.10 | Fe I | -3.13 | 29356.430 | 0.98 |
| 4422.70 | 4421.91 | Ti II | -1.77 | 16625.110 | 0.85 |
| 4423.11 | 4422.33 | Cr II | -1.28 | 93966.448 | 0.94 |
| 4424.34 | 4423.56 | Fe II | -3.15 | 73395.932 | 0.84 |
| 4428.76 | 4427.98 | Mg II | -1.21 | 80619.500 | 0.89 |
| 4431.22 | 4430.44 | Cr II | -2.32 | 44307.091 | 0.96 |
| 4431.80 | 4431.02 | Fe III | -2.57 | 66522.952 | 0.98 |
| 4432.13 | 4431.35 | Sc II | -1.88 | 4883.570 | 0.98 |
| 4432.35 | 4431.57 | Fe II | -1.77 | 64040.884 | 0.96 |
| 4432.87 | 4432.09 | Ti II | -2.10 | 9975.920 | 0.98 |
| 4434.75 | 4433.97 | Mg II | -0.91 | 80650.022 | 0.85 |
| 4441.21 | 4440.45 | Fe II | -2.91 | 54063.459 | 0.96 |
| Zr II | -1.13 | 9742.800 | |||
| 4442.53 | 4441.74 | Ti II | -2.41 | 9518.060 | 0.86 |
| 4443.09 | 4442.31 | Fe I | -1.25 | 17726.988 | 0.89 |
| 4443.77 | 4442.98 | Zr II | -0.42 | 11984.460 | 0.89 |
| 4445.33 | 4444.54 | Ti II | -2.03 | 8997.710 | 0.83 |
| 4447.02 | 4446.23 | Fe II | -2.40 | 48039.087 | 0.94 |
| 4449.76 | 4448.97 | ? | 0.95 | ||
| 4450.38 | 4449.59 | Fe II | -1.59 | 63948.792 | 0.96 |
| 4450.83 | 4450.04 | Ti I | 15156.802 | 0.97 | |
| 4451.06 | 4450.27 | Fe II | -2.90 | 50187.813 | 0.98 |
| 4452.30 | 4451.51 | Fe II | -1.84 | 49506.935 | 0.84 |
| 4454.53 | 4453.73 | Ti I | -0.01 | 15108.110 | 0.90 |
| 4455.57 | 4454.78 | Zr II | -1.60 | 6467.610 | 0.96 |
| 4456.04 | 4455.25 | Fe II | -2.14 | 50212.823 | 0.89 |
| 4457.41 | 4456.62 | Ti II | -1.41 | 25192.791 | 0.95 |
| 4458.18 | 4457.39 | Zr II | -1.22 | 9553.100 | 0.97 |
| 4460.72 | 4459.93 | Fe I | -4.00 | 21999.129 | 0.98 |
| 4460.97 | 4460.18 | Ne I | -2.28 | 149657.046 | 0.98 |
| 4461.98 | 4461.19 | Zr II | -1.18 | 8152.000 | 0.96 |
| 4462.20 | 4461.41 | Fe II | -4.11 | 20830.582 | 0.95 |
| 4462.47 | 4461.68 | Fe II | -2.05 | 50212.823 | 0.89 |
| 4462.78 | 4461.99 | Mn I | 0.32 | 24802.250 | 0.98 |
| 4463.74 | 4462.95 | Nd II | 0.07 | 4512.495 | 0.98 |
| 4464.36 | 4463.57 | S II | 0.13 | 128599.162 | 0.98 |
| 4465.85 | 4465.06 | Nd II | -1.64 | 0.000 | 0.97 |
| 4466.04 | 4465.25 | Y II | 0.00 | 33336.718 | 0.96 |
| 4466.53 | 4465.74 | Cr II | -1.18 | 52321.010 | 0.89 |
| 4467.33 | 4466.54 | Fe I | -0.59 | 22838.320 | 0.96 |
| 4468.66 | 4467.87 | Fe II | -2.33 | 64090.884 | 0.97 |
| 4469.93 | 4469.14 | Ti II | -2.10 | 8744.340 | 0.89 |
| 4471.62 | 4470.83 | Ti II | -2.28 | 9395.250 | 0.81 |
| 4472.22 | 4471.43 | He I | hfs | 0.84 | |
| 4473.69 | 4472.90 | Fe II | -3.83 | 22939.357 | 0.85 |
| 4474.93 | 4474.11 | Fe II | -3.14 | 44929.549 | 0.97 |
| 4475.33 | 4474.54 | Cr II | -2.08 | 44307.091 | 0.96 |
| 4479.41 | 4478.62 | Mn II | -0.95 | 53997.132 | 0.90 |
| 4481.48 | 4479.68 | Fe I | -1.61 | 29732.735 | 0.91 |
| 4481.91 | 4481.12 | Mg II | 0.75 | 71490.190 | 0.45 |
| 4482.10 | 4481.31 | Mg II | -0.55 | 71490.190 | 0.47 |
| 4487.59 | 4486.79 | Fe II | -2.09 | 91199.744 | 0.97 |
| 4488.27 | 4487.47 | Fe II | -2.14 | 62049.023 | 0.97 |
| 4488.46 | 4487.66 | Si I | -2.22 | 38955.052 | 0.93 |
| 4489.08 | 4488.29 | Ti II | -0.82 | 25192.791 | 0.68 |
| 4489.96 | 4489.17 | Fe II | -2.97 | 22810.356 | 0.70 |
| 4490.68 | 4489.88 | Al II | -1.84 | 125869.015 | 0.91 |
| 4492.16 | 4491.37 | Fe II | -2.70 | 23031.299 | 0.66 |
| 4493.86 | 4493.06 | Cr II | -1.83 | 94001.557 | 0.97 |
| 4494.31 | 4493.31 | Cr II | -3.92 | 68476.918 | 0.91 |
| 4495.18 | 4494.38 | Zr II | -0.48 | 19439.239 | 0.96 |
| 4495.33 | 4494.53 | Fe I | -1.14 | 17726.988 | 0.97 |
| 4496.23 | 4495.43 | Zr II | -1.20 | 9742.800 | 0.97 |
| 4497.74 | 4496.94 | Zr II | -0.89 | 5752.920 | 0.92 |
| . 4502.05 | 4501.25 | Ti II | -0.75 | 8937.710 | 0.51 |
| 4507.86 | 4507.06 | Fe II | -1.92 | 62689.878 | 0.96 |
| 4509.06 | 4508.26 | Fe II | -2.21 | 23031.299 | 0.58 |
| 4512.56 | 4511.76 | Cr II | -1.37 | 52297.808 | 0.93 |
| 4512.84 | 4512.04 | Fe II | -2.18 | 61974.931 | 0.98 |
| 4514.61 | 4513.81 | Cr I | -3.68 | 27222.942 | 0.91 |
| 4515.26 | 4514.46 | Cr II | -2.84 | 45730.581 | 0.98 |
| 4515.94 | 4515.14 | Fe I | -3.23 | 23192.500 | 0.98 |
| 4516.12 | 4515.32 | Fe II | -2.48 | 22939.357 | 0.62 |
| 4516.37 | 4515.57 | Cr II | -1.11 | 67369.139 | 0.96 |
| 4516.57 | 4515.77 | Cr II | -1.57 | 52297.808 | 0.95 |
| 4517.41 | 4516.61 | Co II | -2.56 | 27902.370 | 0.97 |
| 4519.11 | 4518.31 | Ti II | -2.55 | 8710.440 | 0.91 |
| 4519.73 | 4518.93 | Mn II | -1.33 | 53597.132 | 0.96 |
| 4521.00 | 4520.20 | Fe II | -2.60 | 22637.205 | 0.62 |
| 4521.90 | 4521.10 | Cr I | -1.69 | 33762.662 | 0.90 |
| 4523.41 | 4522.61 | Fe II | -2.03 | 22939.357 | 0.57 |
| 4524.25 | 4523.45 | Cr II | -3.14 | 53321.010 | 0.97 |
| 4525.45 | 4524.65 | S II | 0.08 | 121528.718 | 0.96 |
| Ti II | -2.34 | 9930.630 | |||
| 4525.72 | 4524.92 | Ba II | -0.36 | 20261.562 | 0.95 |
| S II | 0.08 | 121530.021 | |||
| 4527.89 | 4527.09 | Cr II | -1.57 | 0.96 | |
| 4529.38 | 4528.58 | Fe I | -0.82 | 17550.180 | 0.96 |
| 4530.27 | 4529.57 | Fe II | -3.19 | 41929.549 | 0.75 |
| 4532.61 | 4531.81 | Cr II | -1.19 | 67448.568 | 0.97 |
| 4533.22 | 4532.42 | O I | -2.55 | 86631.453 | 0.91 |
| 4533.44 | 4532.64 | Cr I | 35501.177 | 0.94 | |
| 4534.00 | 4533.20 | Co II | -1.74 | 41314.200 | 0.97 |
| 4534.74 | 4533.94 | Ti II | -0.77 | 9975.920 | 0.48 |
| 4534.95 | 4534.15 | Fe II | -3.47 | 23031.299 | 0.79 |
| 4540.38 | 4539.58 | Cr II | -2.53 | 32603.400 | 0.75 |
| 4540.62 | 4539.82 | Cr II | -2.79 | 52297.808 | 0.98 |
| 4540.78 | 4539.98 | ? | 0.92 | ||
| 4541.48 | 4540.68 | Cr I | 0.03 | 25038.500 | 0.97 |
| 4542.30 | 4541.50 | Fe II | -3.05 | 23031.299 | 0.70 |
| 4544.80 | 4544.00 | Ti II | -2.40 | 10024.730 | 0.93 |
| 4545.48 | 4544.68 | Cr II | -4.02 | 25042.811 | 0.97 |
| 4545.92 | 4545.12 | Ti II | -1.87 | 9118.260 | 0.91 |
| 4547.41 | 4546.61 | Cr II | -1.18 | 62688.949 | 0.95 |
| 4548.45 | 4547.65 | Cr II | -4.30 | 95938.960 | 0.94 |
| 4549.97 | 4548.17 | Mn II | -1.52 | 86190.180 | 0.80 |
| 4550.26 | 4549.46 | Fe II | -1.75 | 22810.356 | 0.55 |
| 4550.41 | 4549.61 | Ti II | -0.45 | 12774.689 | 0.48 |
| 4550.61 | 4549.81 | Ti II | -2.32 | 9518.060 | 0.88 |
| 4553.09 | 4552.29 | Cr II | -2.71 | 50687.621 | 0.95 |
| 4553.31 | 4552.51 | N II | 0.33 | 189335.161 | 0.92 |
| 4554.27 | 4553.47 | Ti I | -0.78 | 24694.892 | 0.95 |
| 4554.82 | 4554.02 | Ba II | 0.02 | 0.000 | 0.54 |
| 4555.78 | 4554.98 | Cr II | -1.38 | 32836.680 | 0.56 |
| 4556.68 | 4555.88 | Fe II | -2.29 | 22810.356 | 0.60 |
| 4557.92 | 4557.12 | Cr II | -3.76 | 85778.690 | 0.90 |
| 4559.44 | 4558.64 | Cr II | -0.66 | 32854.311 | 0.48 |
| 4559.59 | 4558.79 | Cr II | -2.46 | 32854.949 | 0.85 |
| 4563.03 | 4562.23 | ? | 0.92 | ||
| 4564.55 | 4563.75 | Ti II | -0.96 | 9850.900 | 0.51 |
| 4565.01 | 4564.31 | Cr II | -1.27 | 62701.671 | 0.96 |
| 4566.53 | 4565.73 | Cr II | -2.11 | 32603.400 | 0.63 |
| 4569.11 | 4568.31 | Ti II | -2.65 | 9872.730 | 0.95 |
| 4570.04 | 4569.24 | Co II | -2.50 | 27469.131 | 0.94 |
| 4571.26 | 4570.46 | V I | -0.62 | 15770.789 | 0.90 |
| 4572.77 | 4571.97 | Ti II | -0.53 | 12676.970 | 0.48 |
| 4575.27 | 4574.47 | Zr II | -0.95 | 19613.540 | 0.97 |
| 4575.61 | 4574.81 | La II | -1.14 | 1394.46 | 0.92 |
| 4577.13 | 4576.32 | Fe II | -3.04 | 22939.357 | 0.70 |
| 4578.80 | 4578.00 | Fe II | -2.98 | 61974.331 | 0.97 |
| 4579.34 | 4578.54 | Ca I | -0.56 | 20335.360 | 0.97 |
| 4580.31 | 4579.51 | Fe II | -2.51 | 50212.823 | 0.92 |
| 4580.84 | 4579.64 | ? | 0.90 | ||
| 4582.09 | 4581.29 | Fe II | 50142.811 | 0.93 | |
| 4583.62 | 4582.81 | Fe II | -3.10 | 22939.357 | 0.77 |
| 4584.21 | 4583.40 | Ti II | 9395.802 | 0.95 | |
| 4584.62 | 4583.81 | fe II | -2.02 | 22637.205 | 0.53 |
| 4584.79 | 4583.99 | Fe II | -4.22 | 21812.055 | 0.96 |
| 4588.06 | 4587.26 | Cr II | -1.65 | 52321.010 | 0.93 |
| 4589.00 | 4588.19 | Cr II | -0.63 | 32836.680 | 0.46 |
| 4589.22 | 4588.42 | Cr II | -4.32 | 25035.399 | 0.95 |
| 4590.73 | 4589.92 | Ti II | -1.79 | 9975.920 | 0.65 |
| 4591.31 | 4590.50 | V II | -0.78 | 30613.920 | 0.94 |
| 4592.85 | 4592.04 | Cr II | -1.22 | 32854.949 | 0.54 |
| 4595.27 | 4594.46 | Nd II | -1.65 | 1650.205 | 0.97 |
| 4599.29 | 4598.47 | Fe II | -1.50 | 62945.040 | 0.93 |
| 4602.18 | 4601.36 | N I | -1.90 | 94770.879 | 0.97 |
| 4617.43 | 4616.51 | Cr II | -1.29 | 32844.760 | 0.57 |
| 4619.61 | 4618.79 | Cr II | -1.11 | 32854.949 | 0.49 |
| 4619.77 | 4618.95 | Cr II | -4.22 | 30298.510 | 0.94 |
| 4621.31 | 4620.49 | Fe II | -3.28 | 22810.356 | 0.80 |
| 4626.70 | 4625.88 | Fe II | -2.20 | 48039.087 | 0.94 |
| 4629.58 | 4628.76 | Fe II | -1.74 | 63272.974 | 0.94 |
| 4630.12 | 4629.30 | Fe II | -2.37 | 22637.205 | 0.61 |
| 4634.87 | 4634.05 | Cr II | -1.24 | 32844.760 | 0.50 |
| 4636.11 | 4635.29 | Fe II | -1.65 | 48039.087 | 0.74 |
| 4657.79 | 4656.97 | Fe II | -3.63 | 23317.632 | 0.89 |
| 4658.00 | 4657.18 | Ti II | -2.15 | 10024.730 | 0.89 |
| 4663.85 | 4663.03 | Al II | -0.28 | 85481.348 | 0.88 |
| 4664.53 | 4663.71 | Fe II | -4.27 | 23317.632 | 0.93 |
| 4667.56 | 4666.75 | Fe II | -3.33 | 22810.356 | 0.79 |
| 4670.98 | 4670.16 | Fe II | -4.10 | 20830.582 | 0.93 |
| 4671.21 | 4670.39 | Cr II | -2.38 | 47354.440 | 0.84 |
| 4683.13 | 4682.31 | Y II | -1.51 | 3296.184 | 0.91 |
| 4685.56 | 4684.74 | Cr II | -3.77 | 45730.581 | 0.93 |
| 4698.41 | 4697.59 | Cr II | -1.88 | 45730.581 | 0.88 |
| 4709.49 | 4708.66 | Ti II | -2.21 | 9975.920 | 0.89 |
| 4724.15 | 4723.32 | Cr II | -2.71 | 33618.941 | 0.90 |
| 4731.20 | 4730.37 | Mn II | -2.15 | 43329.420 | 0.93 |
| 4732.28 | 4731.45 | Fe II | -3.36 | 23317.632 | 0.76 |
| 4737.81 | 4736.98 | Cr II | -2.78 | 33521.110 | 0.93 |
| 4756.55 | 4755.71 | Mn II | -1.24 | 43528.639 | 0.86 |
| 4762.26 | 4761.42 | Cr II | -2.54 | 45730.581 | 0.94 |
| 4764.71 | 4763.87 | Ti II | -2.45 | 9850.900 | 0.90 |
| 4765.35 | 4764.51 | Ti II | -2.77 | 9975.920 | 0.95 |
| 4765.55 | 4764.71 | Mn II | -1.35 | 43537.180 | 0.86 |
| 4765.93 | 4765.09 | Cr II | -2.72 | 45569.369 | 0.93 |
| 4780.80 | 4779.96 | Ti II | -1.37 | 16515.860 | 0.71 |
| 4787.42 | 4786.58 | Y II | -1.29 | 8328.041 | 0.88 |
| 4799.36 | 4798.51 | Ti II | -2.43 | 8710.440 | 0.92 |
| 4805.92 | 4805.07 | Ti II | -1.10 | 16625.110 | 0.65 |
| 4813.17 | 4812.32 | Cr II | -1.80 | 31168.581 | 0.65 |
| 4824.13 | 4823.28 | Y II | -1.11 | 8003.121 | 0.88 |
| 4824.96 | 4824.11 | Cr II | -1.22 | 31219.350 | 0.49 |
| 4837.06 | 4836.21 | Cr II | -2.25 | 31117.390 | 0.62 |
| 4849.08 | 4848.22 | Cr II | -1.14 | 31168.581 | 0.44 |
| 4855.70 | 4854.84 | Y II | -0.38 | 8003.121 | 0.50 |
| 4857.02 | 4856.16 | Cr II | -2.26 | 31082.940 | 0.47 |
| 4865.17 | 4864.31 | Cr II | -1.37 | 31117.390 | 0.37 |
| 4874.84 | 4873.98 | Ti II | -0.79 | 24961.031 | 0.67 |
| 4877.24 | 4876.38 | Cr II | -1.46 | 31082.940 | 0.50 |
| Cr II | -1.46 | 31168.581 | |||
| Fe I | -0.14 | 22996.673 | |||
| 4884.52 | 4883.66 | Y II | 0.07 | 8743.316 | 0.60 |
| 4885.44 | 4884.50 | Cr II | -2.08 | 31117.390 | 0.66 |
| 4892.34 | 4891.48 | Cr II | -3.04 | 31350.901 | 0.89 |
| 4900.97 | 4900.10 | Y II | -0.09 | 8328.042 | 0.64 |
| 4902.46 | 4901.59 | Cr II | -0.83 | 52321.010 | 0.77 |
| 4906.76 | 4905.89 | Fe II | -3.62 | 78690.849 | 0.93 |
| 4912.02 | 4911.15 | Ti II | -0.34 | 25192.791 | 0.72 |
| 4913.30 | 4912.43 | Cr II | -0.95 | 52297.808 | 0.82 |
| 4914.14 | 4913.27 | Fe II | 0.01 | 82078.679 | 0.90 |
| 4921.35 | 4920.48 | Mn II | -2.09 | 44138.961 | 0.89 |
| 4924.79 | 4923.92 | Fe II | -1.32 | 23317.632 | 0.49 |
| 4934.33 | 4934.06 | Ba II | hfs | 0.000 | 0.61 |
| 4952.43 | 4951.56 | Fe II | 0.18 | 83136.488 | 0.88 |
| 4953.66 | 4952.79 | Cr II | -1.14 | 50667.242 | 0.88 |
| 4958.45 | 4957.58 | Fe I | 0.13 | 22650.414 | 0.88 |
| 4977.90 | 4977.03 | Fe II | 0.04 | 83598.539 | 0.92 |
| 4982.98 | 4982.11 | Y II | -1.29 | 8328.041 | 0.93 |
| 4985.35 | 4984.48 | Fe II | 0.01 | 83308.193 | 0.92 |
| 4991.36 | 4990.49 | Fe II | 0.18 | 83308.193 | 0.89 |
| 4994.21 | 4993.24 | Fe II | -3.65 | 22637.005 | 0.88 |
| 5001.06 | 5000.18 | Fe I | -1.65 | 37409.551 | 0.90 |
| 5002.81 | 5001.92 | Fe II | 0.92 | 82853.660 | 0.76 |
| 5005.05 | 5004.16 | Fe II | 0.50 | 82853.660 | 0.83 |
| 5007.70 | 5006.81 | Fe II | -0.43 | 83713.536 | 0.95 |
| 5008.32 | 5007.43 | Fe II | -0.36 | 83726.362 | 0.90 |
| 5014.56 | 5013.67 | Ti II | -1.93 | 12758.110 | 0.48 |
| 5019.32 | 5018.43 | Fe II | -1.22 | 23317.632 | 0.95 |
| 5020.32 | 5019.43 | Fe II | -2.70 | 44915.046 | 0.95 |
| 5022.450 | 5021.56 | Fe II | -0.30 | 82978.679 | 0.95 |
| 5023.280 | 5022.39 | Fe II | -0.06 | 83459.671 | 0.93 |
| 5023.66 | 5022.77 | Fe II | -0.02 | 82978.679 | 0.92 |
| 5025.400 | 5024.51 | Cr II | -1.54 | 50687.621 | 0.90 |
| 5031.490 | 5030.60 | Fe II | 0.40 | 82978.679 | 0.84 |
| 5031.880 | 5030.99 | Sc II | -0.40 | 10944.560 | 0.79 |
| 5033.570 | 5032.68 | Fe II | 0.11 | 83812.317 | 0.91 |
| 5036.570 | 5035.68 | Fe II | 0.61 | 82978.679 | 0.82 |
| 5041.890 | 5041.00 | Si II | 0.03 | 81191.341 | 0.69 |
| 5048.510 | 5047.62 | Fe II | -0.07 | 83136.488 | 0.92 |
| 5056.850 | 5055.96 | Si II | 0.52 | 81251.320 | 0.66 |
| 5057.190 | 5056.30 | Si II | -0.49 | 81521.320 | 0.81 |
| 5057.580 | 5056.69 | Cr II | -1.68 | 69954.088 | 0.96 |
| 5062.580 | 5061.69 | Fe II | 0.22 | 83136.488 | 0.89 |
| 5071.760 | 5070.86 | Fe II | 0.24 | 83136.488 | 0.88 |
| 5073.150 | 5072.25 | Ti II | -0.75 | 25192.791 | 0.83 |
| 5076.640 | 5075.74 | Fe II | 0.28 | 84326.910 | 0.90 |
| 5083.100 | 5082.20 | Fe II | -0.10 | 83990.065 | 0.94 |
| 5087.190 | 5086.29 | Fe II | -0.48 | 83990.065 | 0.97 |
| 5088.290 | 5087.39 | Y II | -0.17 | 8743.316 | 0.72 |
| 5094.450 | 5093.55 | Fe II | 0.11 | 83713.536 | 0.91 |
| 5098.180 | 5097.28 | Fe II | 0.31 | 83713.536 | 0.80 |
| 5101.500 | 5100.60 | Fe II | 0.17 | 83726.362 | 0.89 |
| 5101.620 | 5100.72 | Fe II | 0.72 | 83726.362 | 0.81 |
| 5101.730 | 5100.83 | Fe II | -1.78 | 47674.718 | 0.88 |
| 5106.990 | 5106.09 | Fe II | -0.93 | 83812.317 | 0.95 |
| Fe II | -0.28 | 83308.193 | |||
| 5117.910 | 5117.00 | Fe II | -0.13 | 84131.364 | 0.95 |
| 5120.000 | 5119.10 | Y II | -1.36 | 8003.121 | 0.94 |
| 5124.090 | 5123.18 | Fe II | -0.37 | 62125.601 | 0.85 |
| Y II | -0.83 | 8003.121 | |||
| 5128.750 | 5127.84 | Fe II | -2.53 | 44929.549 | 0.91 |
| 5130.040 | 5129.13 | Ti II | -1.39 | 15257.430 | 0.74 |
| 5133.550 | 5132.64 | Fe II | -4.18 | 22637.205 | 0.95 |
| 5137.960 | 5137.05 | Cr II | -1.53 | 55023.098 | 0.93 |
| 5144.760 | 5143.85 | Fe II | 0.10 | 84266.557 | 0.94 |
| 5145.250 | 5144.34 | Fe II | 0.28 | 84424.972 | 0.90 |
| 5147.010 | 5146.10 | Fe II | -3.91 | 22810.356 | 0.95 |
| 5146.710 | 5145.80 | Fe II | -0.17 | 83990.065 | 0.94 |
| 5150.350 | 5149.44 | Fe II | 0.40 | 84266.557 | 0.87 |
| 5151.370 | 5150.46 | Fe II | -0.12 | 84266.557 | 0.95 |
| 5154.380 | 5153.47 | Cr II | -2.70 | 30307.439 | 0.78 |
| 5154.960 | 5154.05 | Ti II | -1.98 | 12628.731 | 0.80 |
| 5168.210 | 5167.30 | Mg I | -1.03 | 21850.405 | 0.81 |
| 5169.940 | 5169.03 | Fe II | -0.87 | 23317.632 | 0.48 |
| 5181.220 | 5180.30 | Fe II | 0.04 | 83812.317 | 0.93 |
| 5184.500 | 5183.58 | Mg I | -0.18 | 21911.178 | 0.74 |
| 5185.070 | 5184.15 | Fe II | -1.82 | 84685.198 | 0.97 |
| 5186.790 | 5185.87 | Ti II | -1.35 | 15265.619 | 0.76 |
| 5189.590 | 5188.67 | Ti II | -1.21 | 12758.110 | 0.63 |
| 5198.470 | 5197.55 | Fe II | -2.10 | 26055.422 | 0.63 |
| 5200.020 | 5199.10 | Fe II | 0.10 | 83713.536 | 0.90 |
| 5201.310 | 5200.39 | Y II | -0.57 | 8003.121 | 0.82 |
| 5204.530 | 5203.61 | Fe II | -0.05 | 83812.317 | 0.93 |
| 5205.410 | 5204.49 | Cr I | -0.21 | 7593.150 | 0.93 |
| 5206.620 | 5205.70 | Y II | -0.34 | 8328.041 | 0.75 |
| 5206.930 | 5206.01 | Cr I | 0.02 | 7593.150 | 0.90 |
| 5209.320 | 5208.40 | Cr I | 0.16 | 7593.150 | 0.86 |
| 5211.440 | 5210.52 | Fe I | -3.02 | 40404.516 | 0.96 |
| 5211.750 | 5210.83 | Cr II | -3.91 | 32603.400 | 0.86 |
| 5212.440 | 5211.52 | Ti II | -1.36 | 20891.660 | 0.88 |
| 5216.240 | 5215.32 | Fe II | -0.01 | 83713.536 | 0.93 |
| 5217.740 | 5216.82 | Fe II | 0.39 | 84710.686 | 0.84 |
| Fe II | 0.61 | 84527.779 | |||
| 5227.450 | 5226.53 | Ti II | -1.30 | 12628.731 | 0.68 |
| 5228.230 | 5227.31 | Fe II | -0.03 | 84844.832 | 0.92 |
| 5228.390 | 5227.47 | Fe II | 0.85 | 84296.829 | 0.82 |
| 5233.400 | 5232.48 | Cr II | -2.09 | 32836.680 | 0.76 |
| 5235.180 | 5234.26 | Fe II | -2.05 | 25981.630 | 0.95 |
| 5235.520 | 5234.59 | Fe II | -2.05 | 25981.630 | 0.63 |
| 5236.470 | 5235.54 | Cr II | -3.12 | 55023.098 | 0.94 |
| 5238.230 | 5237.30 | Cr II | -1.16 | 32854.311 | 0.57 |
| 5238.860 | 5237.93 | Fe II | 0.13 | 84266.557 | 0.93 |
| 5240.720 | 5239.79 | Fe II | -0.46 | 84910.326 | 0.88 |
| 5244.370 | 5243.44 | Cr II | -3.45 | 32603.400 | 0.87 |
| 5247.670 | 5246.74 | Cr II | -2.45 | 29951.880 | 0.78 |
| 5248.860 | 5247.93 | Fe II | 0.55 | 84938.177 | 0.88 |
| 5250.340 | 5249.41 | Cr II | -2.43 | 30307.439 | 0.82 |
| 5252.130 | 5251.20 | Fe II | 0.51 | 84844.832 | 0.88 |
| 5254.560 | 5253.63 | Fe II | -0.09 | 84296.829 | 0.95 |
| 5255.300 | 5254.37 | Fe II | -0.77 | 84685.198 | 0.97 |
| 5255.820 | 5254.89 | Fe II | -3.23 | 26055.422 | 0.85 |
| 5258.040 | 5257.11 | Fe II | 0.03 | 84685.198 | 0.93 |
| 5261.160 | 5260.23 | Fe II | 1.09 | 84035.139 | 0.76 |
| 5263.060 | 5262.12 | Ti II | -2.11 | 12758.110 | 0.91 |
| 5265.100 | 5264.17 | Fe II | 0.36 | 84710.680 | 0.89 |
| Mg II | -0.38 | 93310.590 | |||
| 5267.950 | 5267.02 | Cr II | -3.32 | 32603.400 | 0.92 |
| 5269.530 | 5268.60 | Ti II | -1.62 | 20951.620 | 0.89 |
| 5261.160 | 5260.23 | Fe II | 1.09 | 84035.139 | 0.76 |
| 5265.720 | 5264.79 | Fe II | -3.19 | 26055.422 | 0.78 |
| 5273.310 | 5272.38 | Fe II | -2.03 | 48039.087 | 0.86 |
| 5276.910 | 5275.98 | Fe II | -3.97 | 87572.430 | 0.63 |
| 5275.890 | 5274.96 | Cr II | -1.29 | 32836.680 | 0.57 |
| 5280.800 | 5279.87 | Cr II | -2.10 | 32854.311 | 0.71 |
| 5280.980 | 5280.05 | Cr II | -2.01 | 32854.949 | 0.75 |
| 5285.040 | 5284.11 | Fe II | -3.19 | 23317.632 | 0.80 |
| 5292.570 | 5291.63 | Fe II | 0.58 | 84257.779 | 0.86 |
| 5402.980 | 5402.03 | Fe II | 0.50 | 85184.734 | 0.89 |
| 5403.710 | 5402.76 | Y II | -0.91 | 14832.854 | 0.88 |
| 5408.540 | 5407.58 | Cr II | -2.09 | 30864.459 | 0.77 |
| 5415.010 | 5414.05 | Fe II | -3.79 | 25981.630 | 0.92 |
| 5415.790 | 5414.83 | Fe II | -0.31 | 84863.363 | 0.93 |
| Cr II | -1.78 | 55023.098 | |||
| 5419.710 | 5418.75 | Ti II | -2.00 | 12758.110 | 0.89 |
| 5421.850 | 5420.89 | Cr II | -2.36 | 30307.439 | 0.78 |
| 5426.190 | 5425.23 | Fe II | -3.36 | 25805.329 | 0.85 |
| 5428.770 | 5427.81 | Fe II | -1.66 | 54232.193 | 0.90 |
| 5430.920 | 5429.96 | Fe II | 0.46 | 85462.859 | 0.89 |
| 5433.910 | 5432.95 | Fe II | -3.63 | 26352.767 | 0.90 |
| 5456.830 | 5455.87 | Mg II | -1.60 | 97468.917 | 0.93 |
| 5466.880 | 5465.91 | Fe II | 0.52 | 85679.698 | 0.90 |
| 5467.850 | 5466.88 | Si II | -0.04 | 101024.349 | 0.92 |
| 5473.550 | 5472.58 | Cr II | -2.88 | 33521.110 | 0.93 |
| 5474.320 | 5473.35 | Y II | -1.02 | 14018.259 | 0.94 |
| 5476.770 | 5475.80 | Fe II | -0.18 | 84685.198 | 0.96 |
| 5478.440 | 5477.47 | Cr II | -2.99 | 33417.931 | 0.95 |
| 5479.320 | 5478.35 | Cr II | -1.91 | 33694.151 | 0.70 |
| 5481.680 | 5480.71 | Y II | -0.99 | 13883.373 | 0.94 |
| 5483.260 | 5482.29 | Fe II | 0.43 | 85184.734 | 0.90 |
| 5488.570 | 5487.60 | Fe II | 0.36 | 85442.859 | 0.92 |
| 5493.350 | 5492.38 | Fe II | -0.06 | 84685.198 | 0.95 |
| 5494.790 | 5493.82 | Fe II | 0.21 | 84685.198 | 0.91 |
| 5495.320 | 5494.35 | Fe II | -3.79 | 88209.451 | 0.96 |
| 5498.350 | 5497.38 | Y II | -0.98 | 14098.066 | 0.87 |
| 5503.040 | 5502.07 | Cr II | -1.99 | 33618.941 | 0.73 |
| 5503.610 | 5502.64 | Fe II | -0.14 | 85184.734 | 0.96 |
| 5504.170 | 5503.20 | Cr II | -2.31 | 93417.991 | 0.79 |
| 5507.160 | 5506.19 | Fe II | 0.86 | 84863.353 | 0.83 |
| 5508.010 | 5507.04 | Fe II | -0.32 | 84870.863 | 0.96 |
| 5509.560 | 5508.59 | Cr II | -2.11 | 33521.110 | 0.77 |
| 5510.840 | 5509.87 | Y II | -1.01 | 8003.121 | 0.91 |
| 5511.670 | 5510.70 | Cr II | -2.45 | 30864.459 | 0.80 |
| 5522.510 | 5521.53 | Cr II | -3.49 | 52321.010 | 0.95 |
| 5527.760 | 5526.78 | Sc II | 0.02 | 14261.230 | 0.77 |
| 5535.800 | 5534.82 | Fe II | -2.93 | 26170.181 | 0.77 |
| 5542.720 | 5541.740 | Fe II | -4.29 | 42401.302 | 0.93 |
| 5545.570 | 5544.60 | Y II | -1.09 | 14018.259 | 0.94 |
| 5546.960 | 5545.98 | Y II | -1.10 | 14098.066 | 0.95 |
| 5579.090 | 5578.10 | Mn II | -1.40 | 49889.858 | 0.94 |
| 5589.200 | 5588.21 | Fe II | 0.09 | 85062.859 | 0.93 |
| 5607.090 | 5606.10 | S II | 0.16 | 110766.562 | 0.97 |
| 5614.730 | 5613.74 | Fe II | -2.70 | 90901.125 | 0.96 |
| 5616.610 | 5615.62 | Fe I | -0.14 | 26874.347 | 0.98 |
| 5621.610 | 5620.62 | Cr II | -1.14 | 52321.010 | 0.88 |
| 5625.360 | 5624.37 | Fe II | -3.16 | 44915.046 | 0.98 |
| 5644.840 | 5643.84 | Fe II | -1.46 | 61726.078 | 0.95 |
| 5646.370 | 5645.37 | Fe II | 0.08 | 85184.734 | 0.93 |
| 5658.860 | 5657.86 | Sc II | -0.50 | 12154.419 | 0.86 |
| Fe II | -4.10 | 27620.411 | |||
| 5663.900 | 5662.90 | Y II | 0.34 | 15682.898 | 0.74 |
| 5679.390 | 5678.39 | Cr II | -1.24 | 52297.808 | 0.90 |
| 5685.160 | 5684.16 | Sc II | -1.05 | 12154.419 | 0.94 |
| 5719.560 | 5718.55 | Ce II | -1.07 | 15134.049 | 0.96 |
| 5727.530 | 5726.52 | Fe II | -0.02 | 86416.331 | 0.95 |
| 5729.870 | 5728.86 | Y II | -1.12 | 14832.854 | 0.95 |
| 5781.120 | 5780.10 | Fe II | 0.32 | 86124.299 | 0.92 |
| 5784.620 | 5783.60 | Fe II | 0.21 | 86416.331 | 0.93 |
| 5828.240 | 5827.21 | Cr II | -2.04 | 53271.087 | 0.96 |
| 5854.680 | 5853.645 | Ba II | hfs | 4873.850 | 0.91 |
| 5876.120 | 5875.08 | Fe II | -2.36 | 87572.430 | 0.95 |
| 5876.630 | 5875.59 | He I | hfs | 169086.769 | 0.89 |
| 6000.130 | 5999.07 | Ti I | -0.95 | 17540.188 | 0.98 |
| 6054.510 | 6053.44 | Cr II | -2.16 | 38069.590 | 0.88 |
| 6090.700 | 6089.62 | Cr II | -1.27 | 52321.010 | 0.91 |
| 6104.560 | 6103.48 | Fe II | -2.17 | 50142.788 | 0.95 |
| 6130.270 | 6129.19 | Cr II | -2.44 | 38314.859 | 0.92 |
| 6142.770 | 6141.68 | Ba II | hfs | 5674.824 | 0.77 |
| 6148.800 | 6147.71 | Fe II | -2.72 | 31364.440 | 0.85 |
| 6150.300 | 6149.21 | Fe II | -2.72 | 31368.450 | 0.86 |
| 6157.080 | 6155.99 | O I | -1.40 | 86625.757 | 0.87 |
| 6157.840 | 6156.75 | O I | -0.93 | 86627.777 | 0.84 |
| 6159.250 | 6158.16 | O I | -0.44 | 86631.453 | 0.81 |
| 6176.210 | 6175.12 | Fe II | -1.98 | 50187.813 | 0.93 |
| 6178.040 | 6176.95 | Cr II | -2.84 | 38314.859 | 0.96 |
| 6180.170 | 6179.08 | Cr II | -1.36 | 52297.808 | 0.93 |
| 6180.470 | 6179.38 | Fe II | -2.60 | 44915.046 | 0.96 |
| 6196.250 | 6195.16 | Cr II | -2.80 | 38362.431 | 0.96 |
| 6241.030 | 6239.93 | Fe II | -3.44 | 31368.450 | 0.96 |
| 6246.540 | 6245.47 | Fe II | -1.49 | 90839.485 | 0.94 |
| 6248.430 | 6247.33 | Fe II | -2.08 | 50075.908 | 0.94 |
| 6248.640 | 6247.54 | Fe II | -2.33 | 31387.949 | 0.80 |
| 6249.970 | 6248.87 | Fe II | -2.70 | 44446.879 | 0.97 |
| 6333.060 | 6331.94 | Fe II | -1.98 | 50142.788 | 0.93 |
| 6348.200 | 6347.08 | Si II | 0.25 | 65500.472 | 0.59 |
| 6358.260 | 6357.14 | Fe II | 0.17 | 87985.630 | 0.96 |
| 6370.350 | 6369.22 | Fe I | -3.22 | 44022.522 | 0.92 |
| 6370.600 | 6369.47 | Fe II | -4.25 | 23317.632 | 0.96 |
| 6372.460 | 6371.33 | Si II | -0.08 | 65500.472 | 0.63 |
| 6384.800 | 6383.67 | Fe II | -2.27 | 44784.760 | 0.94 |
| 6386.550 | 6385.42 | Fe II | -2.62 | 44784.760 | 0.96 |
| 6418.050 | 6416.92 | Fe II | -2.74 | 31387.949 | 0.86 |
| 6431.640 | 6430.50 | Cr II | 0.10 | 105559.577 | 0.97 |
| 6433.810 | 6432.67 | Fe II | -3.71 | 23317.632 | 0.92 |
| 6447.520 | 6446.38 | Mn II | hfs | 98423.398 | 0.94 |
| 6455.350 | 6454.21 | ? | 0.94 | ||
| 6457.090 | 6455.95 | O I | -0.99 | 86631.453 | 0.92 |
| 6457.500 | 6456.36 | Fe II | -2.07 | 31483.176 | 0.74 |
| 6458.850 | 6457.71 | Cr I | -0.91 | 47189.914 | 0.95 |
| 6459.650 | 6458.51 | Mn II | -2.59 | 66676.782 | 0.97 |
| 6523.800 | 6522.65 | Cr II | -1.86 | 59526.729 | 0.87 |
| 6532.330 | 6531.18 | Fe II | -0.12 | 89119.456 | 0.84 |
| 6543.880 | 6542.72 | Fe II | -0.36 | 88723.398 | 0.77 |
| 6548.600 | 6547.44 | Cr II | -2.02 | 92653.278 | 0.79 |
| 6552.600 | 6551.44 | Cr II | 0.23 | 90725.870 | 0.73 |
| 6557.150 | 6555.99 | Fe II | -1.93 | 88157.118 | 0.69 |
| 6572.070 | 6570.91 | Ti II | -0.82 | 66794.008 | 0.73 |
| 6574.840 | 6573.68 | Fe II | -1.14 | 88157.118 | 0.73 |
| 6580.750 | 6579.59 | Cr II | 0.22 | 90850.958 | 0.88 |
| 6586.500 | 6585.34 | Cr II | 0.83 | 90850.958 | 0.90 |
| 6614.860 | 6613.69 | Y II | -1.11 | 14098.066 | 0.95 |
| 6628.400 | 6627.23 | Fe II | -1.61 | 58666.256 | 0.95 |
| 6681.280 | 6680.10 | Ti II | -1.85 | 24961.231 | 0.96 |