FAST polarization mapping of the SNR VRO 42.05.01
Abstract
We have obtained the polarization data cube of the VRO 42.05.01 supernova remnant at 1240 MHz using the Five-hundred-meter Aperture Spherical radio Telescope (FAST). Three-dimensional Faraday Synthesis is applied to the FAST data to derive the Faraday depth spectrum. The peak Faraday depth map shows a large area of enhanced foreground RM of 60 rad m-2 extending along the remnant’s “wing” section, which coincides with a large-scale HI shell at km s-1. The two depolarization patches within the “wing” region with RM of 97 rad m-2 and 55 rad m-2 coincide with two HI structures in the HI shell. Faraday screen model fitting on the Canadian Galactic Plane Survey (CGPS) 1420 MHz full-scale polarization data reveals a distance of in front of the SNR with enhanced regular magnetic field there. The highly piled-up magnetic field indicates that the HI shell at km s-1 could originate from an old evolved SNR.
1 Introduction
A supernova remnant shock compresses the magnetic field in the interstellar medium (ISM) with a factor of four or more in the evolved stage (Fürst & Reich 2004; Helder et al. 2012), which generates enhanced synchrotron emission and retains the information of ambient interacted medium. Radio polarization observations directly detect the perpendicular magnetic field configuration across supernova remnants (SNRs), and give the line-of-sight component of the magnetic field by measuring the Faraday rotation of the polarization angles at different frequencies. It provides important magnetic field configuration information for understanding the dynamics of shock, post-shock gas, and the interaction with the ISM.
VRO 42.05.01 (G166.04.3) is a shell-type SNR with a peculiar morphology consisting of a semicircular “shell” and a triangular “wing” structure (Pineault et al. 1985, 1987). It has been observed in various bands to investigate the evolution in the inhomogeneous medium with two different densities (Summary review in Arias et al. (2019a)). Radio observations from low to high frequencies have indicated different indices and compression ratios in these two sections (Leahy & Tian 2005; Gao et al. 2011; Arias et al. 2019b; Xiao et al. 2022). The polarized emission has been observed in the Canadian Galactic Plane Survey (CGPS) at 1420 MHz, with most regions depolarized (Kothes et al. 2006). A large-scale HI shell at km s-1 with the corresponding footprint on the map extends across the remnant, probably acting as a foreground Faraday screen (Kothes & Landecker 2004). The remnant has also been observed in the Sino-German Galactic plane survey at 4.8 GHz (Gao et al. 2011). The magnetic field vectors in the two “wing” shock shells show different deviations from tangential to the shock front, indicating different rotation measures.
In this paper, we present the polarization observation of VRO 42.05.01 at 1240 MHz with the Five-hundred-meter Aperture Spherical radio Telescope (FAST). FAST has the advantage of a large aperture with high resolution and high sensitivity (Jiang et al. 2020) and has produced good scientific outputs (Qian et al. 2020). The 19-beam wide band multi-channel polarization receiver from 10501450 MHz enables it to measure the polarization of extended SNRs at multi frequencies simultaneously (Sun et al. 2022; Gao et al. 2022). Through the Faraday rotation synthesis technology (Brentjens & de Bruyn 2005), we can efficiently obtain the Faraday depth spectrum and retrieve the polarization properties towards VRO 42.05.01.
The paper is organized as follows. The observation and data reduction are described in Sect. 2. The comparison of the FAST polarization map with the CGPS map is shown in Sect. 3.1. The Faraday rotation synthesis and depolarization analysis are presented in Sect. 3.2 and 3.3. In Sect. 4, we make a discussion on the depolarization feature in the southern wing region. Conclusions are summarized in Sect. 5.
2 Observations and Data reduction
The FAST polarized continuum mapping of VRO 42.05.01 was observed twice using the multibeam on-the-fly mode (2RA + 2DEC) in 2020 April and 2021 February, respectively. The observation setting and parameters are listed in paper I (Xiao et al. 2022). 3C138 is observed as the calibrator. The spectral backend with a 65536 channel covering the 10501450 MHz band recorded the four polarization outputs (, , , ) from the FAST 19-beam linear feeds. After intensity calibration, the data were converted to antenna temperature (K ), and the Stokes parameters are derived as , , and . The leakage caused by the mismatch between the amplitudes and phases of the gains of the two linear feeds is small and corrected using the 10 K injected reference signal injected every two seconds following the method in Sun et al. (2021).
For the , , and data along the R.A. or decl. direction, a baseline correction was first made by linearly fitting the two ends of each scan and subsequently subtracted to remove unrelated large-scale emissions. Radio frequency interference (RFI) caused by communication satellites and navigation satellites (1160-1280 MHz) and other interference were flagged the same as that in in the frequency zone. Then we converted the antenna temperature to the main-beam brightness temperature (K ) by dividing the main beam efficiency () calculated from the calibrator (Sun et al. 2021), and smoothed each channel map to a common 4 angular resolution.
Finally, all four maps and maps were binned every 20 channels to improve the noise level and weaved together to destripe the scanning effects in the Fourier domain (Emerson & Graeve 1988). We averaged the data over the full FAST band by taking medians of all the frequency channels to form the combined and maps. The polarized intensity corrected from the positive noise bias was calculated as (Wardle & Kronberg 1974), where the rms noise measured from the average combined , maps are both about 4 mK Tb. The polarization angle is derived as .
3 Results
3.1 Comparison with the CGPS 1420 MHz polarization map
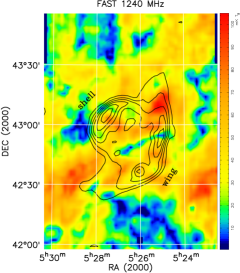
The FAST full-bandwidth 1240 MHz polarization intensity map of VRO 42.05.01 derived from the averaged and data is presented in Fig. 1. There is a weak polarization emission counterpart for the shock “shell”. The polarized patches in the center of VRO 42.05.01 with a comparable 10 mK Tb intensity with that in the outer region, might originate from the foreground diffuse polarization emission. A zero-polarized intensity canal structure with a length of 27 passes across the wing region. It has a width of about , similar to the beam size, and might be caused by different polarization angles of the polarized patches on each side.
For comparison, the combined Canadian Galactic Plane Survey (CGPS) 1420 MHz polarization intensity map of VRO 42.05.01 (Landecker et al. 2010) is shown in the right panel of Fig. 1. It has an angular resolution of , and has restored the large-scale polarized emission by combing data from Effelsberg and the Dominion Radio Astrophysical Observatory (DRAO) 26-m single antenna telescopes. Polarized emission is present only in the shell peak and the tip edge of the triangle wing region in the CGPS synthesis map (Fig.13 in Kothes et al. (2006)), which turns into voids after baselevel restoration. The depolarization feature in the southern wing region (two depolarization patches separated with a filament) is also identical in a way of opposite values to the FAST 1240 MHz polarization intensity map. The canal structure becomes polarized filaments in the CGPS 1420 MHz map, while the polarization patches on both sides turned into depolarized regions.
The large-scale emission component is important for the interpretation of polarized structures caused by Faraday rotation in the interstellar medium (Reich 2006). The FAST 1240 MHz polarization data lacks the large-scale polarized emission due to the baselevel subtraction. After adding the large-scale polarization vectors in the CGPS map, the polarized canals become polarized filament emission. The polarized patches in the southern wing region become depolarized regions, indicating there exists Faraday rotation effect. The polarization angle of the background polarization emission has been modulated and canceled the foreground polarization emission to cause a depression in the polarization intensity (detail discussion in Sect. 4.1).
3.2 the Faraday Synthesis analysis
We used the widely used RM synthesis to reconstruct the Faraday depth spectrum from the frequency cubes of and (Brentjens & de Bruyn 2005). The method is based on that the observed polarization intensity and the Faraday dispersion function are Fourier transform pairs (Burn 1966)
| (1) |
where is the wavelength and the is the Faraday depth defined as , integral of the thermal electron density with the magnetic field along the line-of-sight from the source to the observer. By fitting the peak of the Faraday depth spectrum, we can obtain the Faraday depth integrated towards the source, which is equivalent to the rotation measure (RM).
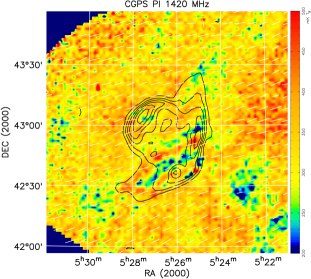
We applied the RM synthesis to the FAST data of VRO 42.05.01 for each pixel using the RM-Tools package (Purcell et al. 2020). The algorithm returns the peak Faraday depth , the peak polarized intensity , and the polarized intensity cube along Faraday depth . For the FAST frequency range and sampling, the width of the RM spread function is about 90 rad m-2, and the Faraday depth has a step interval of 14 rad m-2. We displayed Faraday spectra and fitted peak components towards six polarized patches as marked in the maxPI map in Fig. 2. Most of the Faraday spectra show one peak above 3 level. The spectra towards the polarized patches in the northern wing and in the southeast outside peak at 0 rad m-2 indicate, that they come from the foreground and the polarized emission of the remnant is fully depolarized. The spectrum in the shell shows a peak of 14 rad m-2. The spectra towards the polarized patches in the southern wing (4, 5) and in the southwest outside (6) show large RM peaks of 55, 97, and 97 rad m-2, respectively. The spectrum 6 also shows another weak negative RM component, which might come from a foreground local feature. Here we just discuss the positive RM.
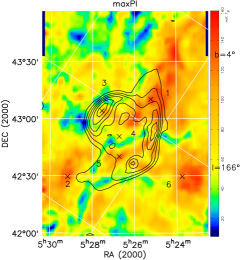
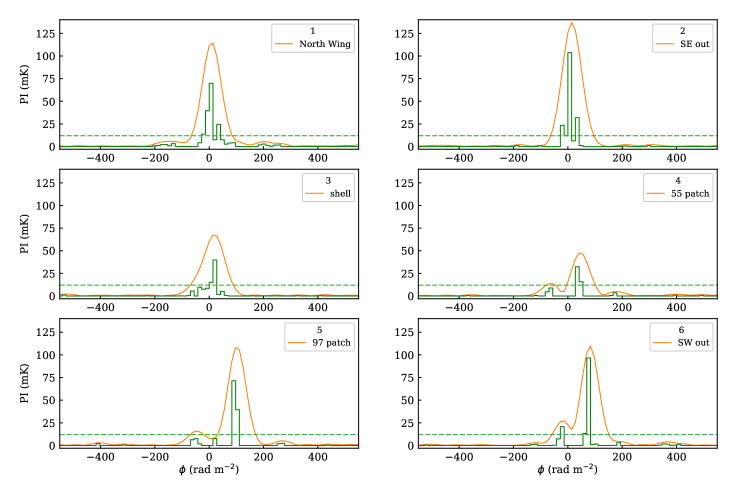
The peak Faraday depth map towards VRO 42.05.01 is presented in Fig. 3. It shows the large Faraday depth area ( 60 rad m-2) in the southwest extending along the wing region (also the Galactic longitude direction). The depolarization patches within the wing region in the CGPS map of Fig. 1 correspond to a maximum Faraday depth of 97 rad m-2 and 55 rad m-2, respectively. The polarized intensity at these two values in the Faraday depth cube are shown separately in Fig. 3.
We presented the maximum polarized intensity map in Fig. 4. The canal and polarized patches in the wing region are almost the same as in the polarization map averaged from and . However, in the southern and western edges, the maxPI map shows some weak polarized patches, which are depolarized in the averaged polarization map. Considering the large foreground RM of 60 rad m-2, averaging over all the frequency channels might have caused some bandwidth depolarization towards these regions.
3.3 Depolarization in the shell
In most regions of VRO 42.05.01 the polarization has been smeared out. Only weak polarized emission is detected in the shell region both in FAST 1240 and CGPS 1420 MHz maps. For a medium where synchrotron emission and Faraday rotation co-exist, depth depolarization is the main mechanism to cause depolarization. Polarized emission at different depths experiences different Faraday rotations, which reduce or even cancel the polarization intensity when added together. Following Sokoloff et al. (1998), it is wavelength-dependent and the depolarization , the ratio of the observed polarization percentage at to intrinsic is related to RM as
| (2) |
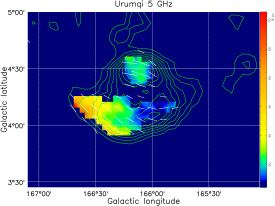
We presented the Urumqi 4.8 GHz polarization percentage map (Gao et al. 2011) in Fig. 5. At 4.8 GHz, the depth depolarization is negligible and it traces approximately the intrinsic polarization emission. The polarization percentage in the shell region is about 20%. The wing region has a different distribution, with the southern section having a higher of 24%, and a lower of 15% in the northern area. By comparing the polarization degree in the shell at 1240 MHz () with that at 4.8 GHz, we obtained a relative depolarization of 0.85. It corresponds to an intrinsic RM of 20 rad m-2 in the shell peak. The positive sign of RMs is adopted based on the deviation of polarization angles at 4.8 GHz. The value is comparable with the Faraday synthesis result in Fig. 3.
4 Discussion
4.1 depolarization feature caused by Faraday screens
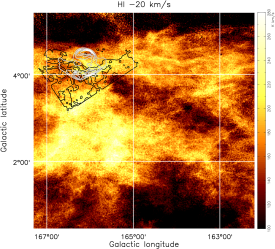
VRO 42.05.01 was reported to overlap with a partial large-scale HI shell with a radius of 4 at km s-1 in the CGPS polarization survey (Kothes & Landecker 2004). As shown in Fig. 6, the HI shell seems to go across and have separated the “shell” and “wing” region. This is consistent with the RM peak distribution derived from the FAST polarization data of Fig. 3. The large foreground RM component at 55 rad m-2 in the wing section also extends along the HI shell.
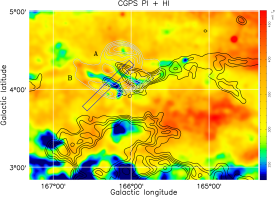
The depolarized patches in the wing region of VRO 42.05.01 seem to coincide with two HI sheet structures in the HI shell. As revealed in the CGPS restored polarization intensity map smoothed to 4 in Fig. 7, the lower end of the depolarized patch (B) with a width of 5.0 overlaps with the HI cloud below and extends upward. The depolarized arc (A) with a width of 2.4 goes along the left periphery of the upper HI cloud and gradually extends to coincide with the right side of the cloud. It seems that the HI sheet structures have enhanced rotation measures and acted as Faraday screens, which rotated the background polarized emission and caused depolarization after adding up with the foreground emission.
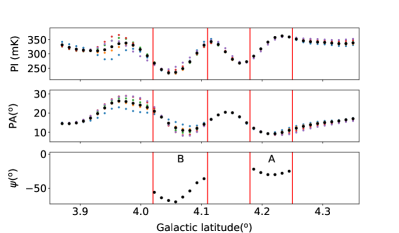
We tried to apply the Faraday screen model to the CGPS 1420 MHz polarization map. We extracted data along the slice in Fig.7. The and distribution in the rectangle region along the slice direction is presented in Fig. 8. The distance of VRO 42.05.01 is 3.24 kpc from the optical extinction of background stars (Zhao et al. 2020). The total depolarization in the wing region indicates that all detected polarized emission at 1.24 GHz comes from the foreground, closer to us than the remnant. It is consistent with the CGPS polarization horizon estimation of 3.0 kpc at (Kothes & Landecker 2004) from depolarization properties of HII regions and SNRs. Assuming that the Galactic disk has a uniform polarized emissivity and rotation measure distribution, we fitted the ratio of polarization intensity and polarization angle (, ) through the Faraday screens with that in the off surrounding region according to the formulas in (Sun et al. 2011), to obtain their relative distances with the remnant and the rotated angles. The fitted distances of these two Faraday screens are 0.70.8. The depths of the Faraday screens assuming equal to the mean width are then estimated about 1.8 and 3.8 pc. The fitted maximum rotated angles shown in Fig. 8 are about 30 and 70, with an ambiguity of (n=0, 1, 2, ). Based on the RM synthesis results of 55 and 97 rad m-2 towards these two regions, the corresponding rotated angles are 150 and 290, respectively.
The non-detection of radiation from the Faraday screens in the total intensity gives a limit on the electron density. According to Rohlfs & Wilson (2004), the contribution of warm thermal gas to the FAST 1240 MHz brightness temperature could be estimated as mK, where is the opacity, is the radiation depth in pc and is the electron temperature taken to be 8000 K. Take (12 mK) in the total intensity as the non-detection level, the upper limits of electron density in the Faraday screens are derived as 1.7 and 1.2 cm-3. The resulting lower limits for the regular magnetic field strength along the line of sight are about 22 and 26 G. However, the value is inversely proportional to the square root of the depth and thus largely depends on the geometry of the depolarized screens. If the depolarized structures are sheets or a shell periphery with ten times large depths, the magnetic field upper limit will go down to G.
The large-scale HI shell at km s-1 was suggested to be swept up by an old SNR evolved into the dissipation phase (Kothes & Landecker 2004). The thermal and radio emission in the shocked shell has declined and the interior temperature drops, while the piled-up regular magnetic field and HI shell remain. A similar case of HI bubbles associated with old remnants has been reported in Xiao & Zhu (2014).
4.2 The RM in the wing region
The large foreground RM (97 rad m-2) filament extending across the northern wing shell explains the different polarization angles in the northern wing shock shell in the Urumqi 4.8 GHz map of Fig. 5. Based on the polarization angle deviation from the alignment with the shocked shell at 4.8 GHz, we can roughly estimate the RM in the wing region. In the outer northern wing shock-shell of VRO 42.05.01, the polarization angle deviates less than 20, indicating a lower RM of 80 rad m-2. After subtracting the foreground contribution, the RM in the northern shell is about 20 rad m-2. The polarization angle deviation in the southern wing shock-shell is small. The high polarization percentage there indicates enhanced regular magnetic field with less random magnetic field than other regions.
5 Summary
We have obtained the polarization data cube of the SNR VRO 42.05.01 at 1240 MHz using the FAST radio telescope and applied RM-Synthesis to derive the Faraday depth spectrum. Only the “shell” in the low RM region shows weak polarization emission. The peak Faraday depth map shows a large foreground RM region of 60 rad m-2 extending along the wing section, which coincides with a large-scale HI shell at km s-1. The two depolarization patches in the wing region with RM of 97 and 55 rad m-2 coincide with two HI structures in the HI shell. Faraday screen model fitting on the CGPS 1420 MHz full-scale polarization data reveals that it lies at 2.2-2.6 kpc in the Perseus arm with an enhanced regular magnetic field. The highly piled-up magnetic field indicates that the HI shell at km s-1 could originate from an evolved old SNR.
References
- Arias et al. (2019a) Arias, M., Domček, V., Zhou, P., & Vink, J. 2019a, A&A, 627, A75
- Arias et al. (2019b) Arias, M., Vink, J., Iacobelli, M., et al. 2019b, A&A, 622, A6
- Brentjens & de Bruyn (2005) Brentjens, M. A. & de Bruyn, A. G. 2005, A&A, 441, 1217
- Burn (1966) Burn, B. J. 1966, MNRAS, 133, 67
- Emerson & Graeve (1988) Emerson, D. T. & Graeve, R. 1988, A&A, 190, 353
- Fürst & Reich (2004) Fürst, E. & Reich, W. 2004, in The Magnetized Interstellar Medium, ed. B. Uyaniker, W. Reich, & R. Wielebinski, 141–146
- Gao et al. (2011) Gao, X. Y., Han, J. L., Reich, W., et al. 2011, A&A, 529, A159
- Gao et al. (2022) Gao, X. Y., Reich, W., Sun, X. H., et al. 2022, Science China Physics, Mechanics, and Astronomy, 65, 129705
- Helder et al. (2012) Helder, E. A., Vink, J., Bykov, A. M., et al. 2012, Space Sci. Rev., 173, 369
- Jiang et al. (2020) Jiang, P., Tang, N.-Y., Hou, L.-G., et al. 2020, RAA, 20, 064
- Kothes et al. (2006) Kothes, R., Fedotov, K., Foster, T. J., & Uyanıker, B. 2006, A&A, 457, 1081
- Kothes & Landecker (2004) Kothes, R. & Landecker, T. L. 2004, in The Magnetized Interstellar Medium, ed. B. Uyaniker, W. Reich, & R. Wielebinski, 33–38
- Landecker et al. (2010) Landecker, T. L., Reich, W., Reid, R. I., et al. 2010, A&A, 520, A80
- Leahy & Tian (2005) Leahy, D. & Tian, W. 2005, A&A, 440, 929
- Pineault et al. (1987) Pineault, S., Landecker, T. L., & Routledge, D. 1987, ApJ, 315, 580
- Pineault et al. (1985) Pineault, S., Pritchet, C. J., Landecker, T. L., Routledge, D., & Vaneldik, J. F. 1985, A&A, 151, 52
- Purcell et al. (2020) Purcell, C. R., Van Eck, C. L., West, J., Sun, X. H., & Gaensler, B. M. 2020, RM-Tools: Rotation measure (RM) synthesis and Stokes QU-fitting, Astrophysics Source Code Library, record ascl:2005.003
- Qian et al. (2020) Qian, L., Yao, R., Sun, J., et al. 2020, The Innovation, 1, 100053
- Reich (2006) Reich, W. 2006, Article for Review Book ”Cosmic Polarization”, ed. R. Fabbri (Research Signpost), astro-ph/0603465
- Rohlfs & Wilson (2004) Rohlfs, K. & Wilson, T. L. 2004, Tools of radio astronomy
- Sokoloff et al. (1998) Sokoloff, D. D., Bykov, A. A., Shukurov, A., et al. 1998, MNRAS, 299, 189
- Sun et al. (2022) Sun, X. H., Gao, X. Y., Reich, W., et al. 2022, Research in Astronomy and Astrophysics, 22, 125011
- Sun et al. (2021) Sun, X. H., Meng, M. N., Gao, X. Y., et al. 2021, RAA, 21, 282
- Sun et al. (2011) Sun, X. H., Reich, W., Han, J. L., et al. 2011, A&A, 527, A74
- Wardle & Kronberg (1974) Wardle, J. F. C. & Kronberg, P. P. 1974, ApJ, 194, 249
- Xiao & Zhu (2014) Xiao, L. & Zhu, M. 2014, MNRAS, 438, 1081
- Xiao et al. (2022) Xiao, L., Zhu, M., Sun, X. H., Jiang, P., & Sun, C. 2022, RAA, 22, 035003
- Zhao et al. (2020) Zhao, H., Jiang, B., Li, J., et al. 2020, ApJ, 891, 137