Estimating Semantic Similarity between In-Domain and Out-of-Domain Samples
Abstract
Prior work typically describes out-of-domain (OOD) or out-of-distribution (OODist) samples as those that originate from dataset(s) or source(s) different from the training set but for the same task. When compared to in-domain (ID) samples, the models have been known to usually perform poorer on OOD samples, although this observation is not consistent. Another thread of research has focused on OOD detection, albeit mostly using supervised approaches. In this work, we first consolidate and present a systematic analysis of multiple definitions of OOD and OODist as discussed in prior literature. Then, we analyze the performance of a model under ID and OOD/OODist settings in a principled way. Finally, we seek to identify an unsupervised method for reliably identifying OOD/OODist samples without using a trained model. The results of our extensive evaluation using 12 datasets from 4 different tasks suggest the promising potential of unsupervised metrics in this task.
1 Introduction
What happens when you train a machine learning model on a dataset and use it to predict a sample whose source is unknown? Would you fully rely on the model’s prediction on the test sample? Basically, this situation is encountered in most real-world scenarios where the test sample may differ considerably from the training samples. Recent works show that models perform poorer on the samples that come from a different distribution (Gokhale et al., 2022). In many real-world scenarios, such as health and law, false predictions or misclassified results could have significant consequences, and as such identifying out-of-domain or out-of-distribution data beforehand is critical.
| Paper | Setup | Term | Metrics | Task |
|---|---|---|---|---|
| Chrysostomou and Aletras (2022) | A | OOD | - | Sentiment classification |
| Le Berre et al. (2022) | A | OOD | Accuracy | MCQ |
| Lin et al. (2022) | A | OODist | - | Extractive QA |
| Nejadgholi et al. (2022) | A | OOD | AUC, F1 | Sentiment classification |
| Chiang and Lee (2022) | A | OODist | Cosine similarity, Confidence score, Probability distribution | Sentiment classification |
| Mishra and Arunkumar (2022) | A | OODist | NLI diagnostics | NLI |
| Varshney et al. (2022) | A | OOD | Accuracy | NLI, Duplicate detection, Sentiment analysis, MCQ, Commonsense Reasoning |
| Omar et al. (2022) | A | OODist | Accuracy, Success rate, Error rate, Diversity, Fairness, IBP tightness, Robustness | Classification, Paraphrasing, NLI |
| Adila and Kang (2022) | A | OODist | Confidence, Variability | NLI |
| Singhal et al. (2022) | A | OOD | Accuracy | NLI, Phrase identification |
| Agrawal et al. (2022) | A | OOD | Accuracy | Visual QA |
| Aghazadeh et al. (2022) | A, B | OODist | Accuracy | Metaphorical knowledge |
| Chen et al. (2023) | A, B | OODist | Accuracy | Sentiment analysis, Toxicity detection, News Classification, Dialogue Intent Classification |
| Mai et al. (2022) | B | OODist | - | Anomaly detection |
| Garg et al. (2022) | B | OOD | Accuracy | Rating generation, Toxicity classification |
| Jin et al. (2021) | B | OOD | False Positive Ratio, AUROC, AUPR | Text Classification |
| Atwell et al. (2022) | C | OOD | h-discrepancy | Discourse parsing |
| Gokhale et al. (2022) | C | OOD | Accuracy, EM | NLI, QA, Image classification |
Previous works have defined OOD and OODist data in different ways or used them interchangeably. Early works define data that comes from a related but different domain as OOD (Dai et al., 2007), whereas OODist data has been defined as the data that might have been collected at a different time (Ovadia et al., 2019). In recent studies, (Chrysostomou and Aletras, 2022) use the term OOD to describe different datasets for the same task (e.g., SST, IMDb, and Yelp for sentiment classification), whereas (Lin et al., 2022) use OODist to describe the datasets that are not in the training set, including those that are subsets of the same dataset (e.g., PDTB 2.0 (Carlson et al., 2002)). In this paper, we first present a focused analysis of all the various terminologies used in this context in recent works.
Another thread of research has focused on identifying OOD/OODist samples, mostly through supervised methods (Varshney et al., 2022; Chiang and Lee, 2022; Gokhale et al., 2022). However, considering that trained models may not always be available, we take a complementary approach in this work to identify metric(s) that may be able to support OOD detection in an unsupervised manner.
The first part of our methodology focuses on establishing to what extent performance (e.g., accuracy) can inform the detection of OOD samples111As formally distinguishing between the two terms remains beyond the scope of this paper, in this work we use the terms OOD and OODist interchangeably.. Our results indicate that indeed performance can serve as a reliable metric for estimating OODness, however, this requires a supervised model. To address this limitation, in the second part of this work, we explore several unsupervised metrics for estimating semantic similarity between the training and test samples. We hypothesize that an unsupervised metric which sufficiently correlates with performance, may be considered as a feasible alternative for detecting OOD samples.
The major contributions of this paper are:
-
•
an in-depth exploration of the usage of the terms OOD and OODist in recent works;
-
•
a systematic assessment of the effectiveness of performance in estimating OODness, and an investigation of unsupervised approaches for identifying OODness;
-
•
an extensive evaluation across four different tasks using a total of twelve datasets; we will also make our code available for facilitating reproducibility.
| Task | Datasets | train/ val/ test |
|---|---|---|
| Sentiment | IMDb, SST2, Yelp | 3310/ 428/ 909 |
| MCQ | SCIQ, CS, QASC | 8134/ 926/ 920 |
| Extractive QA | SQUAD, News, Trivia | 61688/ -/ 4212 |
| NLI | MNLI, WNLI, QNLI | 635/ 71/ 146 |
2 Related Work
Prior research has often used the terms OOD and OODist interchangeably. In some works, dataset is described to be OODist to dataset if they are different datasets, but support the same task (Lin et al., 2022; Aghazadeh et al., 2022; Chiang and Lee, 2022; Mishra and Arunkumar, 2022; Omar et al., 2022; Adila and Kang, 2022), while in other works, the term OOD is used to describe the similar setting Chrysostomou and Aletras (2022); Le Berre et al. (2022); Nejadgholi et al. (2022); Varshney et al. (2022). Beyond that, while some consider different subsets of the same dataset to be OODist Mai et al. (2022); Garg et al. (2022); Jin et al. (2021), others refer to these as OOD to describe distributionally different datasets Atwell et al. (2022); Gokhale et al. (2022).
When it comes to detecting OOD or OODist samples, using the model’s accuracy (Le Berre et al., 2022; Aghazadeh et al., 2022; Gokhale et al., 2022; Omar et al., 2022), input features, hidden features representations, and output probability distribution of the network layers Chiang and Lee (2022), or AUC and F1 score Nejadgholi et al. (2022) have been well-studied. Table 1 presents a brief summary of some recent works.
3 Method
3.1 Problem Definition
Given two datasets, and , the goal is to assess the correlation between the performance of the two datasets under ID/OOD settings and their (semantic) similarity. The performance is measured by training a model on one of the datasets, say, and testing it on the test set which represents the ID setting, and representing the OOD setting. The ID similarity is computed by averaging the similarity between the instances of and , while OOD similarity is measured between and .
3.2 Datasets
We study four different tasks using a total of 12 datasets (3 datasets for per task). We include the most common tasks that have been used in prior work.
(i) Sentiment Analysis: given a text, classify its sentiment as negative or positive.
(ii) Multiple Choice Question Answering (MCQ): given a question and a context, select the correct answer from a pool of possible answers.
(iii) Extractive Question Answering (QA): given a question and a context, find the answer to the question from the context.
(iv) Natural Language Inference (NLI): given a premise and a hypothesis, determine whether the hypothesis contradicts, entails, or is neutral with respect to the premise.
Table 2 presents the details of the datasets and the tasks. For sentiment classification, we use IMDb (Maas et al., 2011), SST2 (Socher et al., 2013), and Yelp (Zhang et al., 2015) datasets. We experiment with SCIQ Welbl et al. (2017), CommonsenseQA (CS) (Talmor et al., 2019), and QASC (Khot et al., 2020) for the MCQ task. For the Extractive QA task, SQUAD, News, and Trivia (Fisch et al., 2019) datasets are selected from the MRQA dataset (note that since these datasets do not have a separate test set, we use the validation data as the test set). The NLI datasets include MNLI, QNLI, and WNLI from the GLUE benchmark Wang et al. (2018). All the other datasets were accessed from the HuggingFace repository222https://huggingface.co/datasets/.
Data preparation: Prior work has largely overlooked the effect of an important aspect – dataset size – in such studies. As such, we control the dataset size as a variable in our study by maintaining the size of all train, validation (when available), and test splits for all three datasets per task by downsampling them to match the size of the smallest dataset in each set. For instance, all the splits of all three sentiment analysis datasets are downsampled to be of equal size. Additionally, we balance the number of instances for each class when possible (e.g., in the sentiment datasets).
3.3 Metrics
We use three categories of metrics, one for measuring the performance of the model, another for estimating the similarity between the two datasets, and the third for computing the correlation between performance and similarity.
Performance Metrics. We report accuracy for the classification tasks, i.e., sentiment analysis, MCQ, and NLI tasks, and F1 score for extractive Question Answering task to measure the correctness of model predictions.
| Trained on | Tested on | Performance |
|---|---|---|
| IMDb-train | IMDb-test | 0.90 |
| Yelp-test | 0.87 | |
| SST2-test | 0.17 | |
| SST2-train | SST2-test | 0.89 |
| IMDb-test | 0.21 | |
| Yelp-test | 0.16 | |
| Yelp-train | Yelp-test | 0.93 |
| IMDb-test | 0.86 | |
| SST2-test | 0.19 | |
| SCIQ-train | SCIQ-test | 0.64 |
| QASC-test | 0.18 | |
| CS-test | 0.34 | |
| CS-train | CS-test | 0.49 |
| SCIQ-test | 0.58 | |
| QASC-test | 0.84 | |
| QASC-train | QASC-test | 0.92 |
| SCIQ-test | 0.51 | |
| CS-test | 0.48 | |
| SQUAD-train | SQUAD-test | 0.86 |
| News-test | 0.51 | |
| Trivia-test | 0.55 | |
| News-train | News-test | 0.66 |
| SQUAD-test | 0.77 | |
| Trivia-test | 0.56 | |
| Trivia-train | Trivia-test | 0.66 |
| SQUAD-test | 0.52 | |
| News-test | 0.31 | |
| MNLI-train | MNLI-test | 0.57 |
| WNLI-test | 0.56 | |
| QNLI-test | 0.54 | |
| WNLI-train | WNLI-test | 0.42 |
| MNLI-test | 0.26 | |
| QNLI-test | 0.47 | |
| QNLI-train | QNLI-test | 0.83 |
| MNLI-test | 0.43 | |
| WNLI-test | 0.56 |
Similarity Metrics. To estimate the closeness among the ID and OOD datasets, we use metrics related to semantic similarity (higher value means the samples are from nearby distributions) and semantic distance (higher value indicates less similarity). These include: (i) Cosine Similarity: measures the distance between the samples from two sources333We estimate this using word2vec embeddings.. (ii) Mauve Score: measures the similarity between two texts444We use the default embeddings (GPT-2) https://pypi.org/project/mauve-text/. (Pillutla et al., 2021). (iii) Wasserstein Distance (Wstn): measures the distance between the two distributions and if the distributions overlap enough, then they are close to each other555We use the universal sentence encoder for estimating this. (Weng, 2019). (iv) Jensen Shannon Distance (JSD): quantifies the similarity between two probability distributions, where the smaller the value, the closer the distributions666We used word2vec embeddings. (Manning and Schutze, 1999).
Correlation Metrics. Lastly, we use two commonly used correlation metrics – Kendall Tau and Pearson777https://pandas.pydata.org/docs/reference/api/pandas.DataFrame.corr.html (we also experimented with Spearman which gave similar results), with the goal of understanding the relationship between performance and similarity of datasets under ID/OOD settings.
3.4 Measuring Performance and Similarity
For measuring the performance, we fine-tune a BERT base uncased model for 2 epochs on each and test it on (ID) and (OOD). For estimating the similarity between the ID and OOD datasets, we randomly sample two sets of 20 instances, and , and estimate pairwise similarity between all of these samples, obtaining a total of 400 similarity scores which are then averaged to compute the similarity.
4 Results and Discussion
Performance analysis: Table 3 presents the results of the performance experiments, where we observe that the model performance under ID settings is generally better than under OOD settings, except for three exceptions, suggesting that performance can indeed serve as a reasonably dependable metric for detecting OOD. However, this requires a supervised model, which motivates us to explore unsupervised approaches for estimating OODness. It is worth noting that while Garg et al. (2022) found that OOD accuracy is less than the ID accuracy, this observation does not always hold true according to our analysis.
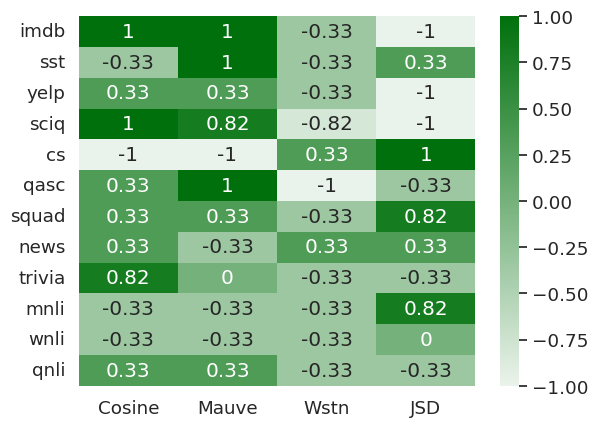
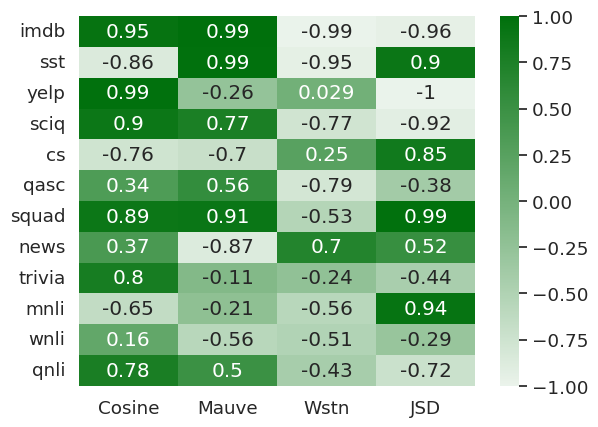
Correlation between performance and similarity: Figure 1 presents the heatmap visualizing the correlation (Kendall and Pearson) between performance and similarity metrics, across all 12 datasets for the four tasks (the full set of results is included in Appendix A). In looking at the results, we observe that according to Kendall Tau correlation analysis, Wasserstein distance (Wstn) shows the most consistent correlation (in 10 out of 12 cases), whereas according to Pearson correlation, both Wasserstein and Cosine are acceptable metrics (in 9 out of 12 cases). In all the scenarios, however, JSD is clearly the least correlated metric. This suggests the potential of unsupervised approaches in estimating OOD samples.
5 Conclusion
In this work, we aim to identify unsupervised approaches for identifying OOD samples. We conducted an in-depth analysis of different unsupervised similarity metrics and estimated their correlation with performance of a model under ID/OOD settings. Our findings indicate that Wasserstein distance presents a promising metric for determining OOD samples. The natural question of how to determine the appropriate threshold, however, remains to be explored in future work. Another direction worth exploring is to verify the robustness of these similarity metrics when estimated using different embeddings.
Limitations
While our analysis suggests some promising results, we acknowledge some limitations of this work such as:
-
•
on some datasets, the ID performance was observed to be less than the OOD performance, and further investigation is needed to study this observation in detail and bring additional insights.
-
•
all the analysis in this study focuses on datasets in English language, and it will be interesting to investigate whether our findings will generalize to other languages.
Acknowledgements
We are thankful to the anonymous reviewers for their valuable feedback.
References
- Adila and Kang (2022) Dyah Adila and Dongyeop Kang. 2022. Understanding out-of-distribution: A perspective of data dynamics. In Proceedings on "I (Still) Can’t Believe It’s Not Better!" at NeurIPS 2021 Workshops, volume 163 of Proceedings of Machine Learning Research, pages 1–8. PMLR.
- Aghazadeh et al. (2022) Ehsan Aghazadeh, Mohsen Fayyaz, and Yadollah Yaghoobzadeh. 2022. Metaphors in pre-trained language models: Probing and generalization across datasets and languages.
- Agrawal et al. (2022) Aishwarya Agrawal, Ivana Kajić, Emanuele Bugliarello, Elnaz Davoodi, Anita Gergely, Phil Blunsom, and Aida Nematzadeh. 2022. Rethinking evaluation practices in visual question answering: A case study on out-of-distribution generalization. arXiv preprint arXiv:2205.12191.
- Atwell et al. (2022) Katherine Atwell, Anthony Sicilia, Seong Jae Hwang, and Malihe Alikhani. 2022. The change that matters in discourse parsing: Estimating the impact of domain shift on parser error. In Findings of the Association for Computational Linguistics: ACL 2022, pages 824–845, Dublin, Ireland. Association for Computational Linguistics.
- Carlson et al. (2002) Lynn Carlson, Mary Ellen Okurowski, and Daniel Marcu. 2002. RST discourse treebank. Linguistic Data Consortium, University of Pennsylvania.
- Chen et al. (2023) Sishuo Chen, Wenkai Yang, Xiaohan Bi, and Xu Sun. 2023. Fine-tuning deteriorates general textual out-of-distribution detection by distorting task-agnostic features. arXiv preprint arXiv:2301.12715.
- Chiang and Lee (2022) David Cheng-Han Chiang and Hung-Yi Lee. 2022. Understanding, detecting, and separating out-of-distribution samples and adversarial samples in text classification. CoRR, abs/2204.04458.
- Chrysostomou and Aletras (2022) George Chrysostomou and Nikolaos Aletras. 2022. An empirical study on explanations in out-of-domain settings.
- Dai et al. (2007) Wenyuan Dai, Gui-Rong Xue, Qiang Yang, and Yong Yu. 2007. Co-clustering based classification for out-of-domain documents. In Proceedings of the 13th ACM SIGKDD international conference on Knowledge discovery and data mining, pages 210–219.
- Fisch et al. (2019) Adam Fisch, Alon Talmor, Robin Jia, Minjoon Seo, Eunsol Choi, and Danqi Chen. 2019. MRQA 2019 shared task: Evaluating generalization in reading comprehension. In Proceedings of 2nd Machine Reading for Reading Comprehension (MRQA) Workshop at EMNLP.
- Garg et al. (2022) Saurabh Garg, Sivaraman Balakrishnan, Zachary C Lipton, Behnam Neyshabur, and Hanie Sedghi. 2022. Leveraging unlabeled data to predict out-of-distribution performance. arXiv preprint arXiv:2201.04234.
- Gokhale et al. (2022) Tejas Gokhale, Swaroop Mishra, Man Luo, Bhavdeep Sachdeva, and Chitta Baral. 2022. Generalized but not Robust? comparing the effects of data modification methods on out-of-domain generalization and adversarial robustness. In Findings of the Association for Computational Linguistics: ACL 2022, pages 2705–2718, Dublin, Ireland. Association for Computational Linguistics.
- Jin et al. (2021) Di Jin, Shuyang Gao, Seokhwan Kim, Yang Liu, and Dilek Hakkani-Tür. 2021. Towards textual out-of-domain detection without in-domain labels. IEEE/ACM Transactions on Audio, Speech, and Language Processing.
- Khot et al. (2020) Tushar Khot, Peter Clark, Michal Guerquin, Peter Jansen, and Ashish Sabharwal. 2020. Qasc: A dataset for question answering via sentence composition. arXiv:1910.11473v2.
- Le Berre et al. (2022) Guillaume Le Berre, Christophe Cerisara, Philippe Langlais, and Guy Lapalme. 2022. Unsupervised multiple-choice question generation for out-of-domain Q&A fine-tuning. In Proceedings of the 60th Annual Meeting of the Association for Computational Linguistics (Volume 2: Short Papers), pages 732–738, Dublin, Ireland. Association for Computational Linguistics.
- Lin et al. (2022) Bill Yuchen Lin, Sida Wang, Xi Lin, Robin Jia, Lin Xiao, Xiang Ren, and Scott Yih. 2022. On continual model refinement in out-of-distribution data streams. In Proceedings of the 60th Annual Meeting of the Association for Computational Linguistics (Volume 1: Long Papers), pages 3128–3139, Dublin, Ireland. Association for Computational Linguistics.
- Maas et al. (2011) Andrew L. Maas, Raymond E. Daly, Peter T. Pham, Dan Huang, Andrew Y. Ng, and Christopher Potts. 2011. Learning word vectors for sentiment analysis. In Proceedings of the 49th Annual Meeting of the Association for Computational Linguistics: Human Language Technologies, pages 142–150, Portland, Oregon, USA. Association for Computational Linguistics.
- Mai et al. (2022) Kimberly T. Mai, Toby Davies, and Lewis D. Griffin. 2022. Self-supervised losses for one-class textual anomaly detection.
- Manning and Schutze (1999) Christopher Manning and Hinrich Schutze. 1999. Foundations of statistical natural language processing. MIT press.
- Mishra and Arunkumar (2022) Swaroop Mishra and Anjana Arunkumar. 2022. A proposal to study "is high quality data all we need?".
- Nejadgholi et al. (2022) Isar Nejadgholi, Kathleen Fraser, and Svetlana Kiritchenko. 2022. Improving generalizability in implicitly abusive language detection with concept activation vectors. In Proceedings of the 60th Annual Meeting of the Association for Computational Linguistics (Volume 1: Long Papers), pages 5517–5529, Dublin, Ireland. Association for Computational Linguistics.
- Omar et al. (2022) Marwan Omar, Soohyeon Choi, DaeHun Nyang, and David Mohaisen. 2022. Robust Natural Language Processing: Recent Advances, Challenges, and Future Directions. arXiv e-prints, page arXiv:2201.00768.
- Ovadia et al. (2019) Yaniv Ovadia, Emily Fertig, Jie Ren, Zachary Nado, David Sculley, Sebastian Nowozin, Joshua Dillon, Balaji Lakshminarayanan, and Jasper Snoek. 2019. Can you trust your model’s uncertainty? evaluating predictive uncertainty under dataset shift. Advances in neural information processing systems, 32.
- Pillutla et al. (2021) Krishna Pillutla, Swabha Swayamdipta, Rowan Zellers, John Thickstun, Sean Welleck, Yejin Choi, and Zaid Harchaoui. 2021. MAUVE: Measuring the gap between neural text and human text using divergence frontiers. In Advances in Neural Information Processing Systems.
- Singhal et al. (2022) Prasann Singhal, Jarad Forristal, Xi Ye, and Greg Durrett. 2022. Assessing out-of-domain language model performance from few examples. arXiv preprint arXiv:2210.06725.
- Socher et al. (2013) Richard Socher, Alex Perelygin, Jean Wu, Jason Chuang, Christopher D. Manning, Andrew Ng, and Christopher Potts. 2013. Recursive deep models for semantic compositionality over a sentiment treebank. In Proceedings of the 2013 Conference on Empirical Methods in Natural Language Processing, pages 1631–1642, Seattle, Washington, USA. Association for Computational Linguistics.
- Talmor et al. (2019) Alon Talmor, Jonathan Herzig, Nicholas Lourie, and Jonathan Berant. 2019. CommonsenseQA: A question answering challenge targeting commonsense knowledge. In Proceedings of the 2019 Conference of the North American Chapter of the Association for Computational Linguistics: Human Language Technologies, Volume 1 (Long and Short Papers), pages 4149–4158, Minneapolis, Minnesota. Association for Computational Linguistics.
- Varshney et al. (2022) Neeraj Varshney, Swaroop Mishra, and Chitta Baral. 2022. ILDAE: Instance-level difficulty analysis of evaluation data. In Proceedings of the 60th Annual Meeting of the Association for Computational Linguistics (Volume 1: Long Papers), pages 3412–3425, Dublin, Ireland. Association for Computational Linguistics.
- Wang et al. (2018) Alex Wang, Amanpreet Singh, Julian Michael, Felix Hill, Omer Levy, and Samuel R Bowman. 2018. Glue: A multi-task benchmark and analysis platform for natural language understanding. arXiv preprint arXiv:1804.07461.
- Welbl et al. (2017) Johannes Welbl, Nelson F Liu, and Matt Gardner. 2017. Crowdsourcing multiple choice science questions. arXiv preprint arXiv:1707.06209.
- Weng (2019) Lilian Weng. 2019. From gan to wgan. ArXiv, abs/1904.08994.
- Zhang et al. (2015) Xiang Zhang, Junbo Zhao, and Yann LeCun. 2015. Character-level Convolutional Networks for Text Classification. arXiv:1509.01626 [cs].
Appendix A Experimental Results
| Trained | Tested | Model Accuracy | Cosine | Mauve | Wstn | JSD |
|---|---|---|---|---|---|---|
| IMDb | IMDb | 0.90 | 0.92 | 1 | 0.004 | 0.21 |
| IMDb | Yelp | 0.87 | 0.87 | 0.91 | 0.0039 | 0.26 |
| IMDb | SST2 | 0.17 | 0.78 | 0.42 | 0.0052 | 0.36 |
| SST2 | SST2 | 0.89 | 0.66 | 0.99 | 0.0032 | 0.46 |
| SST2 | IMDb | 0.21 | 0.77 | 0.22 | 0.0051 | 0.38 |
| SST2 | Yelp | 0.16 | 0.72 | 0.004 | 0.0046 | 0.41 |
| Yelp | Yelp | 0.93 | 0.86 | 0.98 | 0.0036 | 0.26 |
| Yelp | IMDb | 0.86 | 0.87 | 0.76 | 0.0041 | 0.27 |
| Yelp | SST2 | 0.19 | 0.73 | 0.94 | 0.0038 | 0.4 |
| SCIQ | SCIQ | 0.64 | 0.82 | 1 | 0.004 | 0.33 |
| SCIQ | QASC | 0.18 | 0.66 | 0.01 | 0.008 | 0.46 |
| SCIQ | CS | 0.34 | 0.78 | 1 | 0.004 | 0.37 |
| CS | CS | 0.49 | 0.71 | 0.94 | 0.003 | 0.45 |
| CS | SCIQ | 0.58 | 0.62 | 0.01 | 0.007 | 0.48 |
| CS | QASC | 0.84 | 0.61 | 0.004 | 0.005 | 0.49 |
| QASC | QASC | 0.92 | 0.75 | 1 | 0.003 | 0.4 |
| QASC | SCIQ | 0.51 | 0.78 | 0.99 | 0.004 | 0.38 |
| QASC | CS | 0.48 | 0.66 | 0.004 | 0.006 | 0.48 |
| SQUAD | SQUAD | 0.86 | 0.84 | 0.99 | 0.0037 | 0.34 |
| SQUAD | NEWS | 0.51 | 0.82 | 0.32 | 0.0041 | 0.33 |
| SQUAD | TRIVIA | 0.55 | 0.81 | 0.04 | 0.0059 | 0.33 |
| NEWS | NEWS | 0.66 | 0.89 | 0.91 | 0.0036 | 0.23 |
| NEWS | SQUAD | 0.77 | 0.86 | 0.11 | 0.0046 | 0.31 |
| NEWS | TRIVIA | 0.56 | 0.84 | 0.89 | 0.0039 | 0.27 |
| TRIVIA | TRIVIA | 0.66 | 0.88 | 0.99 | 0.0031 | 0.23 |
| TRIVIA | SQUAD | 0.52 | 0.82 | 0.04 | 0.0062 | 0.34 |
| TRIVIA | NEWS | 0.31 | 0.82 | 0.99 | 0.0042 | 0.29 |
| MNLI | MNLI | 0.57 | 0.72 | 0.97 | 0.0035 | 0.43 |
| MNLI | WNLI | 0.56 | 0.71 | 0.27 | 0.0032 | 0.43 |
| MNLI | QNLI | 0.54 | 0.73 | 0.99 | 0.0037 | 0.42 |
| WNLI | WNLI | 0.42 | 0.74 | 0.79 | 0.0032 | 0.41 |
| WNLI | MNLI | 0.26 | 0.68 | 0.66 | 0.0036 | 0.46 |
| WNLI | QNLI | 0.47 | 0.67 | 0.004 | 0.0035 | 0.46 |
| QNLI | QNLI | 0.83 | 0.75 | 0.97 | 0.0036 | 0.41 |
| QNLI | MNLI | 0.43 | 0.64 | 0.66 | 0.0039 | 0.45 |
| QNLI | WNLI | 0.56 | 0.58 | 0.01 | 0.0034 | 0.48 |