latex-latex \tikzsetbase/.style = inner sep=5pt, text centered, thin, font=, round/.style = base, rectangle, rounded corners=1ex, draw=black, fill=gray!20, minimum height=0.35in
Estimating WebRTC Video QoE Metrics Without Using Application Headers
Abstract.
The increased use of video conferencing applications (VCAs) has made it critical to understand and support end-user quality of experience (QoE) by all stakeholders in the VCA ecosystem, especially network operators, who typically do not have direct access to client software. Existing VCA QoE estimation methods use passive measurements of application-level Real-time Transport Protocol (RTP) headers. However, a network operator does not always have access to RTP headers, particularly when VCAs use custom RTP protocols (e.g., Zoom) or due to system constraints (e.g., legacy measurement systems). Given this challenge, this paper considers the use of more standard features in the network traffic, namely the IP and UDP headers, to provide per-second estimates of key VCA QoE metrics such as frame rate and video resolution. We develop a method that uses machine learning with a combination of flow statistics (e.g., throughput) and features derived based on the mechanisms used by the VCAs to fragment video frames into packets. We evaluate our method for three prevalent VCAs running over WebRTC: Google Meet, Microsoft Teams, and Cisco Webex. Our evaluation consists of 54,696 seconds of VCA data collected from both (1) controlled in-lab network conditions and (2) 15 real-world access networks. We show that our approach yields similar accuracy compared to the RTP-based baselines despite using only IP/UDP data. For instance, we can estimate frame rate within 2 FPS for up to 83.05% of one-second intervals in the real-world data, which is only 1.76% lower than using the RTP headers.
1. Introduction
As users continue to depend on video conferencing applications (VCAs) for remote participation in work, education, healthcare, and recreation, ensuring a high quality of experience (QoE) when using VCAs is critical. Although QoE depends to some degree on the specific circumstances of end users, network operators can often play an important role in mitigating QoE degradation resulting from poor local network conditions. A network operator who can observe a VCA’s QoE metrics may be able to diagnose and react to QoE degradation, potentially preventing even transient congestion events from affecting user experience. Unfortunately, network operators lack direct access to application QoE, and must infer QoE from the encrypted application traffic as it traverses the network. Methods exist to infer QoE from video-on-demand applications, but these methods do not apply to inferring QoE for VCAs, which is a different problem. An important distinction between VCAs and video-on-demand applications is that video-on-demand applications react to delay or loss by relying on a large playout buffer (i.e., of at least a few seconds); on the other hand, VCAs must keep a short jitter buffer (specifically, less than 100 ms) and thus are susceptible to a wide range of incidents that can disrupt or degrade network quality.
In this paper, we explore how to enable network operators to infer objective VCA QoE metrics at a per-second time granularity from passive measurements of network traffic. QoE is inherently subjective (Hossfeld et al., 2016), making it challenging to infer on a large scale, even for service providers, let alone network operators who have no data from the instrumentation of the client, which can be useful for directly inferring the user experience. To address this challenge, objective application metrics are commonly employed as a substitute for subjective QoE. The precise relationship between these application-level metrics and user QoE can be determined through user studies or data-driven methods (Banitalebi-Dehkordi et al., 2015) – this is complementary to the estimation of objective application metrics and is out of scope of this paper. Furthermore, although VCA performance is determined by both audio and video, past work has extensively examined audio QoE as a function of network quality of service metrics (Chen et al., 2006; Aggarwal et al., 2014). Our primary focus, therefore, is to infer objective metrics (described in Section 2) that impact VCA video quality.
Recent work has proposed data-driven techniques, often leveraging machine learning, to estimate VCA QoE metrics from network-layer metrics (Yan et al., 2017; Nikravesh et al., 2016; Carofiglio et al., 2021). However, most of these studies assume the ability to parse application-level headers, which is not always the case. Some VCAs, like Zoom, use proprietary application protocols, posing challenges for extracting information using standard network monitors (Marczak and Scott-Railton, 2021). In recent work, Michel et al. (Michel et al., 2022) develop a method to detect Zoom application traffic and extract encapsulated application headers. Yet, the proposed approach will not work if Zoom changes its protocol format (e.g., if it starts using a more complex encapsulation mechanism in the future). Moreover, application headers are encrypted in certain scenarios, such as when traffic is routed over a virtual private network (VPN), and it is likely that all application headers will eventually be encrypted even for regular traffic (Uberti et al., 2023). Thus, this paper proposes methods to estimate video QoE using more standard features of the network traffic, specifically only IP/UDP headers. A notable advantage of using IP/UDP headers is that existing network monitoring systems can readily extract such information at scale (Sonchack et al., 2018).
The QoE inference method we develop uses the semantics of video delivery in VCA network protocols: Due to VCAs’ real-time nature, each video frame is encoded and transmitted immediately. These transmission characteristics give rise to packet sizes and inter-arrival times containing important signal about various QoE metrics, such as frame rate. By leveraging these insights, we develop a heuristic as well as a machine learning-based model that estimates VCA QoE metrics at a fine time granularity. We evaluate our approach on three popular VCAs (Meet, Teams, and Webex) that use WebRTC, an open-source framework providing real-time communication capabilities to browsers and smartphones 111We focus on WebRTC-based VCAs as WebRTC provides mechanisms to collect ground truth QoE metrics, which are essential to evaluate the method we have developed. Our approach, however, applies to all VCAs that use Real-time Transport Protocol (RTP). To evaluate our approach, we collect data from in-lab under diverse emulated network conditions as well as from 15 households spanning different ISPs and speed tiers over a period of two weeks. Our evaluation demonstrates that the proposed method achieves high accuracy in estimating video QoE metrics for VCAs.
We make the following contributions:
-
•
We develop a machine learning-based method that uses features informed by mechanisms used by VCAs to fragment a frame into packets and infer VCA QoE metrics at finer time granularity using only the IP/UDP headers.
-
•
We develop an automated browser-based, VCA data collection framework and use it to evaluate our approach by collecting data under controlled in-lab network conditions as well as data from 15 households spanning a variety of ISP and speed tiers over two weeks. Both the code and data from the paper have been made public (Sharma et al., 2023).
-
•
We demonstrate that using only IP/UDP headers can yield frame rate estimates within 1.50 frames of the ground truth QoE on average. To put it in perspective, we also compare accuracy using RTP headers, 1.33 of the ground truth QoE on average, a difference of only 0.17 frames.
-
•
We show that a predictive model trained on data from controlled lab settings transfers to real-world networks. More specifically, the model transfers with a marginal drop in accuracy for two out of three VCAs. Furthermore, we characterize the network conditions under which the model has high errors and the potential reasons for errors.
2. Problem Context
We provide background on video conferencing applications, the QoE metrics, and detail the QoE inference problem.
2.1. Video Conferencing Applications
VCAs typically use Real-Time Transport Protocol (RTP) (Schulzrinne et al., 2003) for sending audio and video data and Real-Time Transport Control Protocol (RTCP) (Huitema, 2003) for control traffic. Although VCAs can independently implement each of these protocols in the application, the WebRTC open-source real-time communication framework has become extremely prevalent, as it is supported by most modern browsers and devices (e.g., Android). We focus on WebRTC-based VCAs.
QoE metrics.
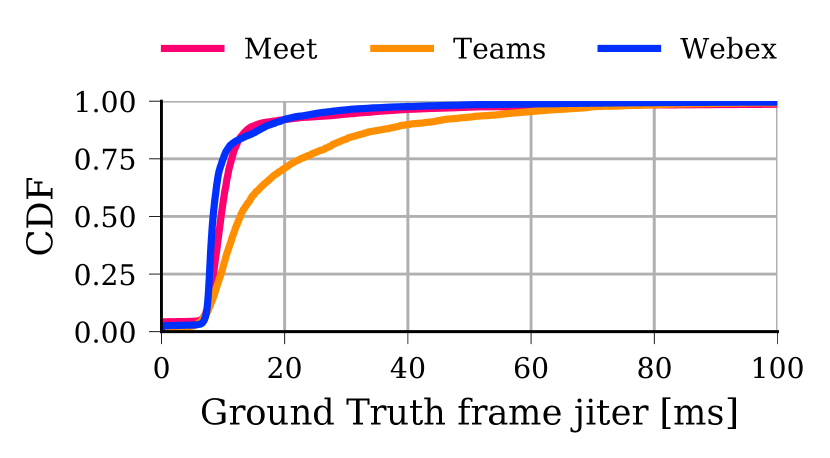
We focus on inferring objective metrics pertaining to the video quality of conferencing. More specifically, we focus on the following four metrics: (1) Video bitrate, defined as the total number of bits received per second, with a lower bitrate indicating lower video quality.; (2) Frame rate, defined as the number of video frames the application receives per second. A low frame rate leads to reduced smoothness and realism of viewing experience ; (3) Frame jitter calculated as the standard deviation of the time gaps between consecutive frames or inter-frame delay. A high frame jitter also affects the smoothness of video playback, resulting in a jerky playback. and (4) Resolution, the number of pixels in a video frame, with lower resolution indicating lesser details in the video.
Additional metrics can affect a VCA’s QoE, including end-to-end network latency, as well as the resulting quality of the audio (Garcia et al., 2019). End-to-end network latency can be challenging to measure from a single vantage point for UDP-based traffic; previous work already estimates audio QoE for VoIP (Chen et al., 2006).
2.2. Inference Problem
Problem Statement.
We take as input a sequence of packets collected from access nodes (e.g., border router) and output the desired QoE metrics at a -second granularity. The choice of ultimately depends on the network operator’s ability to react to the inferred QoE degradation by, for example, reconfiguring the network to mitigate the inferred QoE degradation incidents. We also assume that the input consists only of RTP packets from the VCA and contains no other traffic. We can safely make this assumption because previous work has developed traffic classification methods to identify packets associated with a specific VCA session (Nistico et al., 2020).
Measurement Context.
We consider the case when operators use only IP and UDP headers. This scenario is motivated by several observations: First, for some VCAs that use non-standard versions of RTP (e.g., the native Zoom client (Marczak and Scott-Railton, 2021)), network operators do not have access to RTP headers as these VCAs. Second, as has transpired with many other applications and protocols (e.g., DNS (Borgolte et al., 2019), TLS (Chai et al., 2019)), we expect VCAs to encrypt the RTP headers in the future. Finally, extracting IP and UDP headers is much more efficient and scalable than extracting RTP headers; in fact, many existing network monitoring systems (Sonchack et al., 2018) already support extracting IP/UDP headers along with packet sizes and times.
3. Method
In this section, we describe our QoE estimation method that uses only IP/UDP headers. We assume access to traffic from a single VCA session and it consists of two steps. The first step involves isolating the video traffic from the audio component. Given the distinct transmission techniques (e.g., encoding, error control) used for audio and video, it becomes important to differentiate audio and video packets. Once the video traffic is identified, the second step involves using information from this traffic to infer the video QoE metrics. We first describe these two steps for our method. This is followed by a description of RTP baselines used for comparison.
3.1. Media Classification
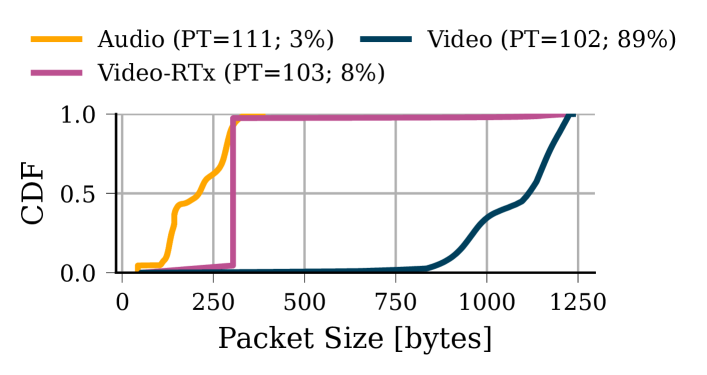
Past work to distinguish media type relies on RTP headers (Marczak and Scott-Railton, 2021; Nistico et al., 2020). More specifically, a seven-bit RTP header called payload type can be used to identify the payload format. For example, in case of Teams, we observe three different payload types (PT): (1). PT = 111 for audio encoded using OPUS, (2) PT=102 for video encoded using H.264, and (3) PT = 103 for video retransmissions. However, with no access to RTP headers, it becomes challenging to identify the media type of an RTP packet.
To overcome this challenge, we use the insight that voice samples can be encoded in fewer bits than images. As a result, the audio packets are typically smaller than video packets. Figure 1 illustrates this phenomenon, showing the CDF of packet sizes corresponding to audio, video, and video retransmissions from seconds of Teams calls (see Section 4 for details). The actual packet media type is identified using the RTP Payload Type header. The audio packet sizes range between bytes; the video packets are significantly larger, with 99% of packets being larger than bytes. Among video retransmissions, which constitute 8% of video packets, we find a significant proportion (92%) of packets with a packet length of . These are likely keep-alive messages for the retransmission transport stream as retransmissions are typically only sent in the case of packet losses. Because these packets do not contain any video payload, it makes sense to filter them out from the QoE inference step. The remaining video retransmission packets are significantly larger.
This characteristic allows us to use a size threshold denoted as to identify video packets. Any packet with size greater than or equal to is tagged as a video packet, while the remaining packets are not considered. The value of can be determined by inspecting a few VCA traces collected in the lab.
3.2. QoE inference
We develop two approaches to infer QoE metrics from video traffic using only IP/UDP headers. The first approach, referred to as IP/UDP Heuristic, utilizes VCA video delivery semantics. We find that relying solely on the heuristic approach can lead to errors, particularly under high network jitter and loss. We thus propose a machine learning(ML)-based approach called IP/UDP ML that relies on a combination of network features, including both statistics on network traffic and features derived using insights from the IP/UDP Heuristic.
3.2.1. Heuristic
Because VCAs are real-time and low latency application, each video frame generated at the sender is transmitted over the network as soon as it has been encoded. From the network perspective, each frame comprises one or more RTP packets. The VCA client transmits these packets immediately, without waiting for additional frames. As a result, a VCA session can be abstracted as a sequence of video frames, with each frame transmitted sequentially over a group of RTP packets separate from other frames. Identifying the video frame boundaries (by identifying frame end time) and frame size can enable inference of key QoE metrics described in Section 2. Past work has relied on using RTP headers to identify frame boundaries (Marczak and Scott-Railton, 2021). Without access to the RTP headers, it is challenging to identify the frame boundaries.
Key Insights:
To identify frame boundaries using IP/UDP headers, we use insights from the mechanisms that VCAs use to divide frames into packets. We first consider whether there are patterns in packet inter-arrival times (IAT). A frame is packetized and transmitted immediately, which leads to microbursts on the network, causing the inter-departure times to be shorter for packets within the frame as compared to packets across frames. Unfortunately, this insight is challenging to apply reliably to determine frame boundaries as packet timings can change when packets traverse along the network. Thus, the patterns in the inter-departure times may not appear in the inter-arrival time (IAT) at the receiver.
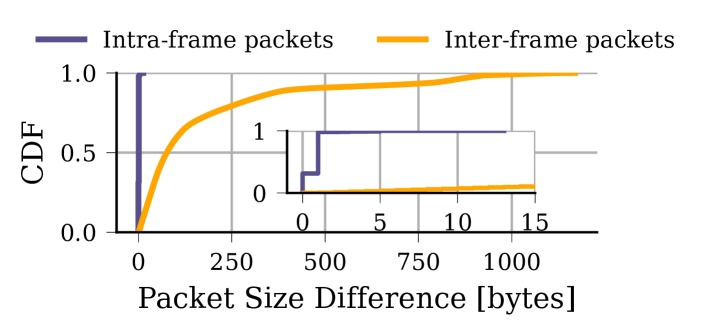
We next consider whether there are unique patterns in packet sizes. An advantage of using packet size is that it does not change during packet transmission over the network. Interestingly, we find a unique pattern in the packet sizes, i.e., packet sizes tend to resemble those within the same frame and differ from packet sizes in consecutive frames. This phenomenon occurs because VCAs typically fragment a frame into equal-sized packets. This is done because the Forward Error Correction (FEC) mechanisms used to protect against network losses are most bandwidth-efficient when packets in a frame have equal length (Li, 2007; Jesup, 2011). Furthermore, due to dynamic nature of the underlying video content along with variable bitrate encoding used by VCAs, consecutive frames exhibit different sizes and, consequently different packet sizes.
Figure 2 illustrates this characteristic, showing the CDF of size difference in consecutive intra-frame and inter-frame packets, for more than 360,000 frames. The true frame boundaries are identified based on the RTP timestamp header as explained in Section 3.3. For frames with more than two packets, we show only the maximum size difference across all packets. The inter-frame size difference is the absolute size difference between the first and the last packets of two consecutive frames. We find that the intra-frame packet size difference is less than two bytes for all but one packet. The inter-frame packet size difference on the other hand is at least 2 bytes for more than 99.4% of the frames.
Frame boundary estimation
: Thus, we use a packet size difference threshold and declare frame boundary if the size difference between consecutive packets is greater than . However, it is not sufficient to compare only consecutive packets as packets can arrive out of order. Therefore, instead of comparing with only the last packet, we iteratively compare with up to packets that arrived before this packet, beginning with the most recent packet. If the size difference of the current packet is within for any of these packets, it is considered as part of the same frame as the matching packet. Otherwise, the packet is assigned as a part of new frame. The exact heuristic is described in Algorithm 1 in the Appendix.
The parameters of the heuristic, i.e., and , can be determined by inspecting few traces for a given VCA in the lab. Intuitively, a large value of can account for all out-of-order packet arrivals. However, it also increases the probability of incorrectly combining a packet from a new frame to an earlier frame with a similar size. Thus, the value of should be set carefully. We analyze the sensitivity of the heuristic to different values of in our evaluation.
QoE estimation from frames
: Once the frame boundaries have been identified, for a single session S, we obtain a sequence of frames along with their sizes. We use this information to estimate the key QoE metrics over a window of duration seconds in the following manner:
-
•
Video bitrate: It is simply the time average of the total bits across all frames transmitted in the window W.
-
•
Frame rate: It is simply the number of frames transferred per second in the window W. More specifically, Frame rate = . Here, indicator function equals one if the frame end time is within the window, and zero otherwise.
-
•
Frame jitter: It is calculated as the standard deviation of difference in end times ( - ) of consecutive frames received over the window W.
We do not estimate frame resolution using this method as there is no direct signal in the frame reflecting its resolution. Intuitively, one can design a machine learning-based method that uses frame sizes and FPS from the heuristic to predict video resolution. This, however, is similar in principle to the machine learning-based method described in Section 3.2.2; hence, we skip implementing the approach for simplicity.
| Category | Features |
|---|---|
| Flow-level statistics | Bytes per second, packets per second, packet size (5) and inter-arrival statistics (5) |
| IP/UDP features based on VCA semantics | # unique packet sizes, # microbursts |
| RTP Headers | # unique RTP timestamps (4), marker bit sum (1), out-of-order sequence numbers (1), RTP lag (5) |
3.2.2. Machine Learning Approach
Why use machine learning?
: The heuristic described in Section 3.2.1 relies on assumptions that can break under certain conditions. For instance, under high latency jitter or packet loss, packets can arrive out of order leading to incorrect estimation of frame boundaries. Although we add parameters (e.g., use a packet lookback 1) that alleviate the errors to some extent, it still does not completely solve the problem. More importantly, there are other, complimentary, signals in the network data that can inform QoE estimation. For instance, given the real-time nature of the VCAs, throughput is a potential indicator of few QoE metrics such as video bitrate. Including multiple such signals into a heuristic can quickly make it complicated. Therefore, we consider a data-driven approach that considers multiple features derived from the network data along with supervised machine learning models. We now describe our approach.
Input features
: We use a common set of features to predict all QoE metrics. The features considered can be divided into two categories:
-
•
VCA semantics-based
: These include two features that are informed by how VCAs fragment frame into packets as described in Section 3.2.1. The first feature is the number of unique packet sizes observed in the prediction window . The second feature is the number of microbursts of packets in the prediction window . A microburst is defined as a sequence of packets with the consecutive inter-arrival times within a threshold . Therefore, the microburst count is simply the number of consecutive packets with inter-arrival time . Intuitively, these features can help inform the frame boundaries and consequently the key video QoE metrics.
-
•
Flow-level statistics
: We also derive a set of key statistics from the IP/UDP headers of video packets. These include number of bytes and packets per second as well as five statistics on packet sizes and inter-arrival times namely mean, standard deviation, median, minimum and maximum. Intuitively, given the real-time nature of VCAs, any transient degradation in the VCA QoE metrics would also be evident in one or more of these statistics.
In total, we compute 14 features for each prediction window as summarized in Table 1.
3.3. RTP Baselines
To benchmark the accuracy of our approach using IP/UDP headers, we also consider two RTP-based approaches as baselines. The first approach is a heuristic approach, called RTP Heuristic, and the other is a machine learning-based approach called RTP ML. We now describe both of these approaches.
RTP Heuristic
: This is similar to the approach used by Michel et al. to estimate QoE metrics for Zoom (Michel et al., 2022) and is based on the same insight as the IP/UDP Heuristic approach, i.e., a VCA session can be modeled as a sequence of frames. To identify frame boundaries, it uses the RTP timestamp field from the packet headers. The RTP timestamp is used to determine the correct order for media playback, as well as to synchronize audio and video streams. Packets belonging to the same frame receive the same RTP Timestamp, and thus the field can be used to identify frame boundaries. To detect the end of frames, the approach also uses the Marker bit in the RTP header. This bit is set only for the last packet of each frame and is used to detect the end of frames.
Using this approach, we can identify the sequence of frames in the prediction window , along with frame completion time and frame size. We then use similar method as described in Section 3.2.1 to estimate frame rate, frame jitter and bitrate.
RTP ML
: This is similar to the IP/UDP ML approach and uses machine learning-based methods to estimate QoE metrics. The input features, however, are derived from RTP headers. We consider the following set of RTP-based features:
-
•
RTP timestamps: We calculate the number of unique RTP timestamps over each stream individually as well as their intersection and union.
-
•
Marker bit sum: It is the sum of marker bit for all packets in the prediction window. We calculate this feature separately for video and retransmission streams.
-
•
Number of out-of-order video sequence numbers: We calculate the total number of discontinuities in video packet RTP sequence numbers over the prediction window. It is used as a signal for packet re-ordering and loss.
-
•
RTP Lag: It captures the delays in frame transmission. We assume that the first frame had zero delay. For each frame , we calculate the transmission delay as the difference between its reception time and transmission time, which is calculated as . Here, is the sampling frequency for generating RTP timestamps and is typically 90,000 for most video codecs (Jesup, 2011). We then calculate the five statistics across frame transmission delays.
In addition, we also use the flow-level statistics as summarized in Table 1. This is done for similar reasons as described for the IP/UDP ML approach.
4. Experiment Setup and Datasets
This section describes our experimentation framework and the different datasets we use to evaluate our methodology.
We consider WebRTC-based VCAs for evaluation as WebRTC is a popular framework used by most VCAs for their browser version. Moreover, it is possible to obtain ground truth QoE metrics for WebRTC-based VCAs using the webrtc-internals API provided by Google Chrome (web, 2023). To collect data for evaluation, we build an automated browser-based framework that initiates calls for a given VCA over a browser. The framework uses PyAutoGUI, a UI automation framework, for starting and ending the calls. We collect data for three popular VCAs, namely Meet, Teams, and Webex. The framework, however, is extensible to other VCAs.
We conduct 2-person calls, each lasting for a variable duration. For consistency, we use a virtual web camera at one of the endpoints streaming a predefined short video on loop and log the QoE metrics on the other endpoint. At the end of the call, we collect both network traces and WebRTC logs.
4.1. Matching ground truth with estimates.
We compare our QoE estimates with per-second metrics reported by webrtc-internals. We match the two datasets using the timestamp fields in the two datasets. The webrtc-internals reports only the start and end times of data collection. We assume that the reported per-second metrics are collected at one-second interval; this matching approach may not be perfect in certain cases, such as when WebRTC logs contain time intervals that are slightly out of phase. To address this as much as possible, during our analysis, we filter out logs where we observe fewer per-second logs compared to the duration of the call.
4.2. Network Conditions
To evaluate under diverse network conditions, we collect two kinds of data: (1). in-lab data under emulated network conditions, and (2). data from 15 households under real-world network conditions.
In-lab Data
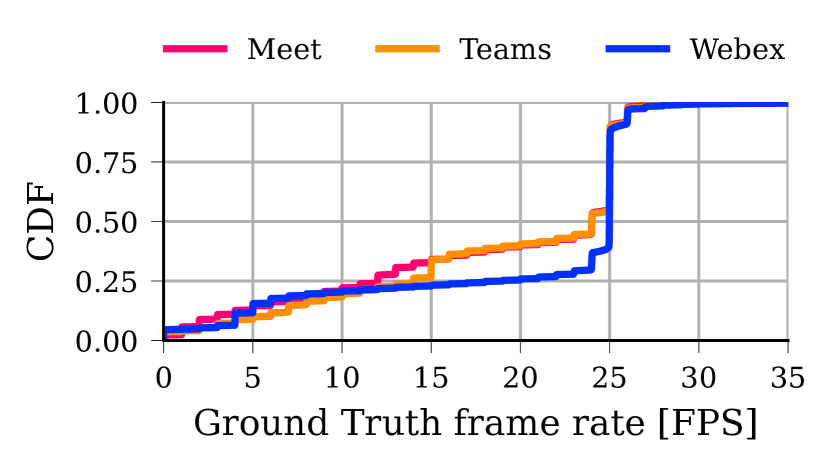
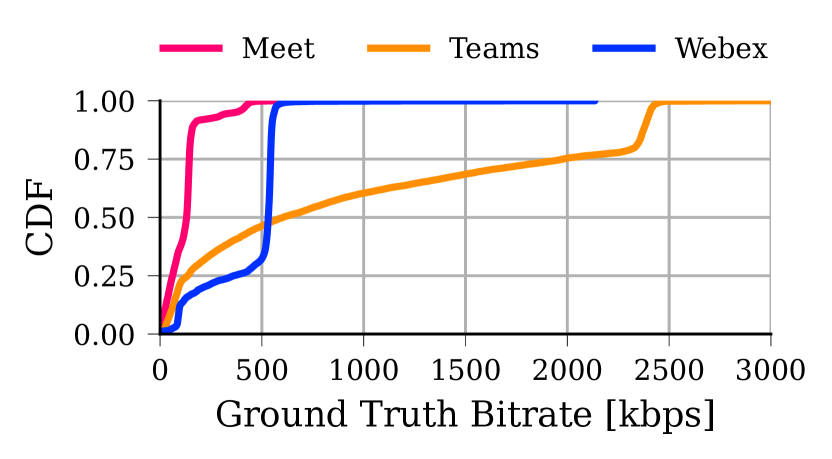
The data is collected by conducting calls between two machines in the lab under emulated network conditions. We emulate dynamic network conditions using the tcp-info stats dataset from the Measurement Lab’s Network Diagnostic Test (NDT), a public dataset containing speed tests taken by real users across the world (mla, 2022). The test measures TCP throughput by flooding the link for ten seconds. We use the samples of instantaneous throughput and RTT, called tcp-info stats, collected multiple times during the test (tcp, 2022). More specifically, we emulate the same sequence of RTT and packet loss values as observed in a single test, while the throughput values are sampled from a normal distribution with the same mean and variance as the test throughput. We did not use the throughput samples directly as they include throughput observed during the TCP slow-start period. Each throughput, delay, and loss value is emulated for a period of 1 second. We only use traces with average speeds below 10 Mbps to create challenging network conditions. We collect around k seconds, k seconds, and k seconds of Meet, Teams, and Webex data, respectively. As expected, we find differences in ground truth QoE metrics across the VCAs despite the presence of similar network conditions. For instance, the median bitrate is 500 kbps for Webex, whereas it is 1700 kbps for Teams (see Figure A.1 in Appendix for other metrics). These differences can be attributed to design variations within the VCAs. Conducting evaluation across multiple VCAs can help us understand the generalizability of our methodology.
Real-world Data
. We note that the in-lab data is not a perfect emulation of the real-world networks; therefore, we complement our data with real-world VCA data. For this purpose, we deploy Raspberry Pi (RPi) devices in 15 households, directly connected to the home router. These households are recruited with the help from community organizations and are located in a major city, spanning different neighborhoods, ISPs, and speed tiers (Sharma et al., 2022; MacMillan et al., 2023). Although our sample size is limited, it serves as an additional independent data source, capturing real-world network conditions, which allows us to thoroughly test our methods.
The RPi collects VCA data by initiating a 15-25s call every 30 minutes to an end point located inside a cloud network. The VCA is selected randomly from the three VCAs. The cloud endpoint and the RPi both join the VCA call as two different participants. During the call, the video on the RPi is kept off while the cloud-network end point streams a predefined video over a virtual camera interface, same as in the lab experiments. We do not stream video on the RPi as it increases the CPU utilization, leading to degradation in call quality due to non-network reasons. For each call, we log the ground truth QoE metrics and the network traffic on the RPi and export the data to a centralized server at the end of the call.
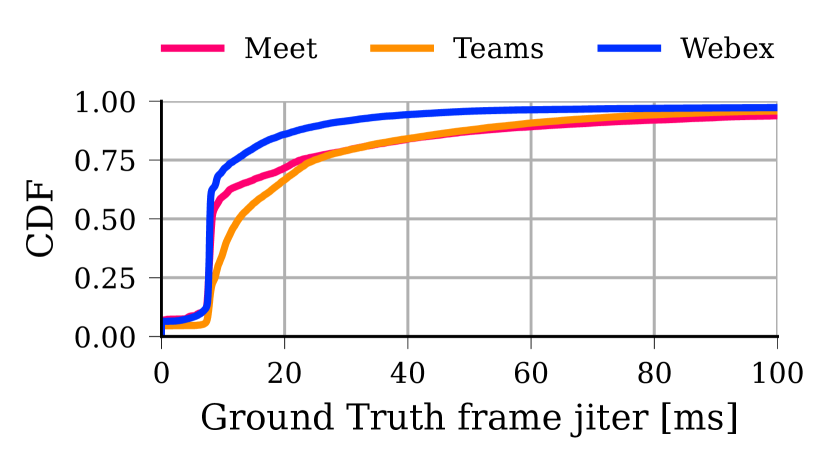
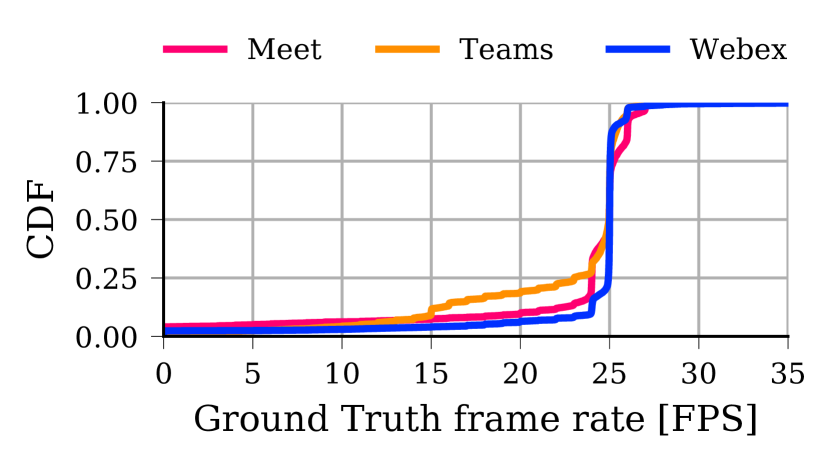
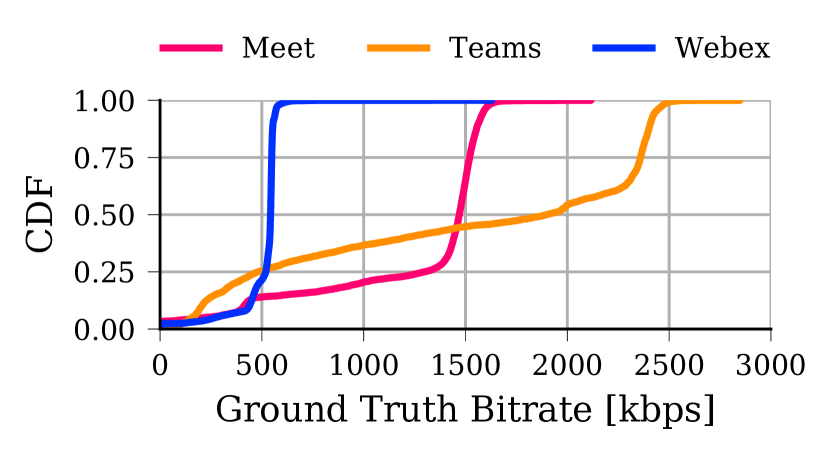
The data collection spanned over a period of two weeks and includes 320 Meet calls, 178 Teams calls, and 417 Webex calls. Compared to the in-lab data, the average QoE metrics exhibit higher values (see Figure A.2 in Appendix for the distribution). This improvement is expected as the download speeds of access networks, likely to be the bottleneck in this case, have significantly improved. We also, however, observe a small fraction of calls with low QoE, indicating the presence of variability in the real-world network conditions.
4.3. Parameter Setting and Model Training
The IP/UDP Heuristic uses two parameters, and , that are VCA-specific. We set these parameters by sampling a few sessions for each VCA. We use a value of 2 bytes for across all VCAs. The value of is set to 3, 2, and 1 for Meet, Teams, and Webex, respectively. For the ML methods, we use random forests as it was the most accurate among the classical supervised machine learning models. The accuracy numbers for these methods are reported over a 5-fold cross validation.
For the ML methodology, we experiment with several classical supervised ML models, specifically Support Vector Machines (SVMs), decision trees, and random forests. However, in this paper, we present the results obtained using only random forests, as they consistently yield the highest accuracy. This finding aligns with prior research within the field that has leveraged ML-based techniques for network data analysis (Farnaaz and Jabbar, 2016; Dimopoulos et al., 2016; Mangla et al., 2020; Carofiglio et al., 2021). In addition, the accuracy numbers for ML-based techniques are reported after 5-fold cross-validation.
5. Evaluation
| Actual | Predicted | Total | |
| Non-Video | Video | ||
| Non-video | 98.3% | 1.7% | 67,830 |
| Video | 0% | 100% | 360,481 |
Our evaluation analyzes the accuracy of IP/UDP methods, particularly in comparison to the RTP baselines, using both in-lab and real-world datasets. Furthermore, we examine the potential sources of errors as well as identify the most important features of ML methods. Later, we analyze the transferability of ML models, characterize the network conditions where the models err, and quantify the impact of the prediction window on model accuracy.
5.1. In-lab Data Results
We describe the accuracy of our methods in classifying media and estimating each QoE metric for in-lab data.
5.1.1. Media Classification Accuracy
Identifying video packets is a common step for both the IP/UDP methods. The ground truth is obtained by inspecting the Payload Type RTP Header. Table 2 shows the normalized confusion matrix for video packet identification for Meet. The accuracy of identifying video packets is generally high. However, a small fraction of non-video packets get misclassified as video. Upon closer inspection, we find that these misclassified packets are server hello messages over DTLSv1.2 and the key exchanges at the beginning of the call.
Impact of misclassification on QoE estimation
. For IP/UDP Heuristic, these additional packets can result in false frame boundaries, leading to an overestimation of the number of frames. On the other hand, the IP/UDP ML method may be more resilient to minor errors in video traffic classification as it relies on multiple signals in the network traffic.
5.1.2. Frame Rate
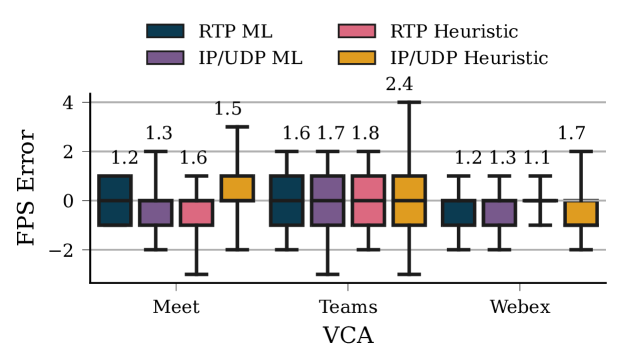
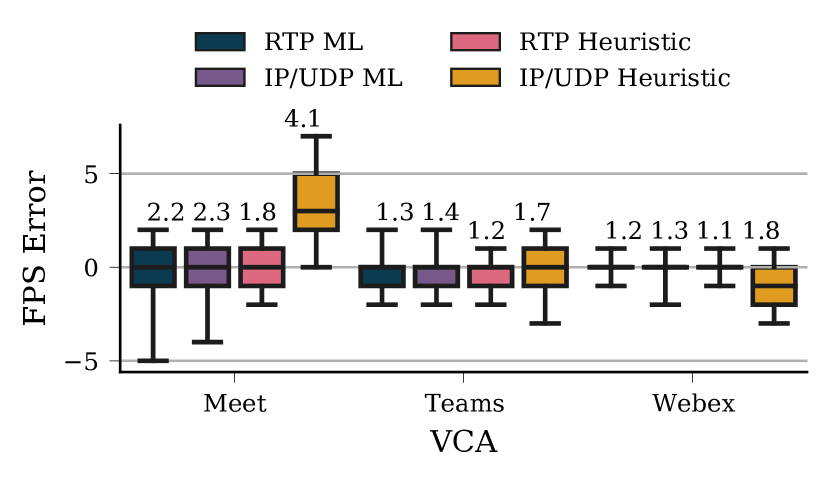
Figure 3 shows the error distribution in frame rate along with the Mean Absolute Error (MAE) values across VCAs. We observe a consistent trend in MAE values across all VCAs: RTP ML ¡ IP/UDP ML ¡ RTP Heuristic ¡ IP/UDP Heuristic. However, we observe a deviation from this trend in Webex, where the MAE of the RTP Heuristic is lower than that of both RTP ML and IP/UDP ML approaches, and in Meet where the MAE of the IP/UDP Heuristic is lower than that of RTP Heuristic. Moreover, the MAE remains within a 2 FPS margin in all cases, except for the IP/UDP Heuristic over Teams.
In general, both heuristics tend to have higher errors than ML-based methods. One potential reason for this could be that the WebRTC frame rate is reported after accounting for additional application-level delays, such as jitter buffer delays, which are not observable directly from the network traffic. The ML-based methods trained on application-level ground truth can potentially calibrate their prediction to account for such mismatch, while that is not possible for the two heuristics.
Interestingly, the IP/UDP ML method errors have a similar distribution as RTP ML. This indicates that IP/UDP headers can estimate frame rate with comparable accuracy to RTP headers. In contrast, the IP/UDP Heuristic has the highest errors. This is surprising as we expect the IP/UDP Heuristic to have similar accuracy as the RTP Heuristic. We now examine the error causes for the IP/UDP Heuristic approach.
Why does the IP/UDP Heuristic exhibit higher errors?
The IP/UDP Heuristic relies on the observation that the inter-frame packet size difference is larger than the intra-frame packet size difference. However, this is not true for a few cases:
Case 1.
If two consecutive frames are similar in size, it will end up combining them.
Case 2.
If the packets within a frame have a size difference greater than , they will be split into multiple frames. We observe this primarily for Meet, where a fraction of frames contains packets with large intra-frame packet size differences.
Case 3.
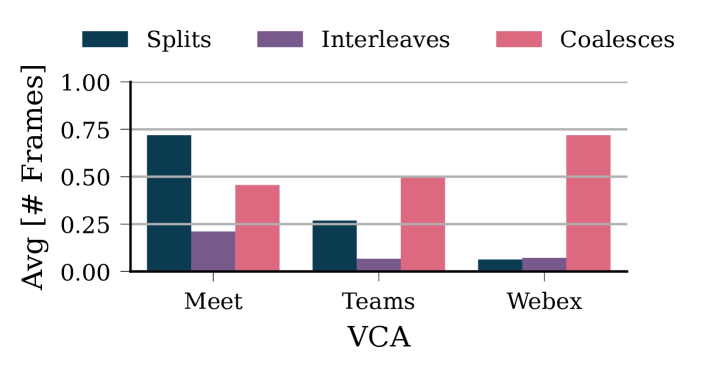
If packets arrive out-of-order, the frames will get interleaved. As a result, the heuristic will create false frame boundaries and overestimate the frame rate.
We analyze the frequency of each type of error in our data as shown in Figure 4. For Meet, we observe a greater number of splits for about 0.72 frames in one prediction window on average, leading to overestimation (see Figure 3). We detect these splits by calculating the number of frames where the intra-frame packet size is greater than . In Figure 4, we also see that a higher percentage of erroneous coalesces leads to underestimation of FPS in Webex. We calculate these by estimating the number of frames to which more than one RTP timestamp was assigned by the IP/UDP Heuristic in the prediction window.
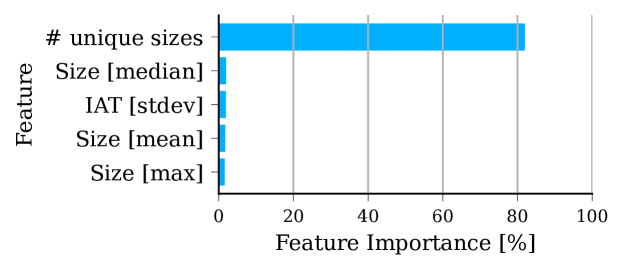
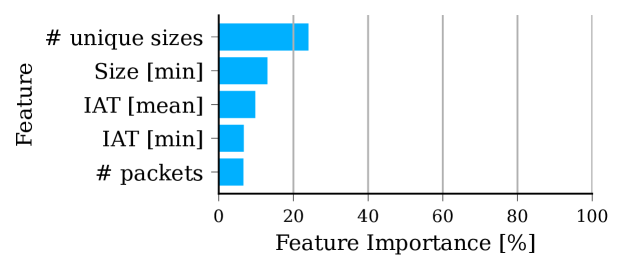
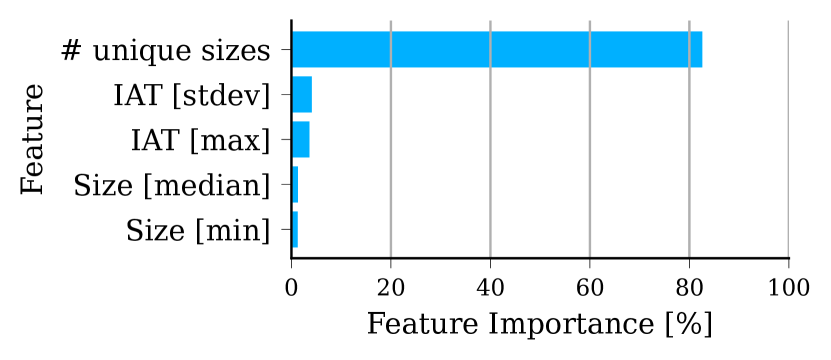
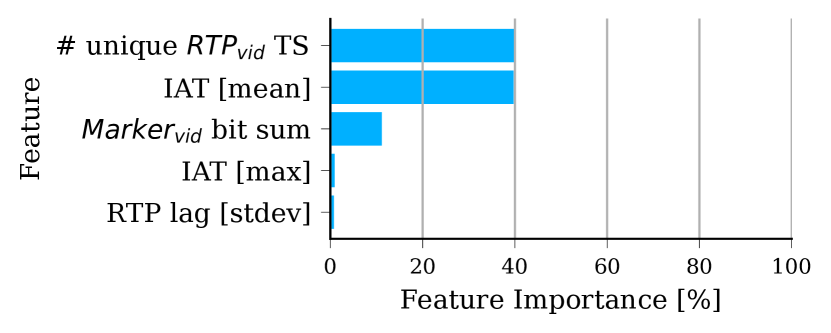
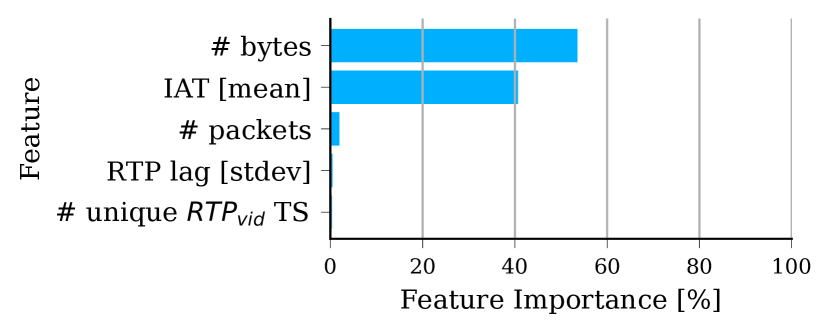
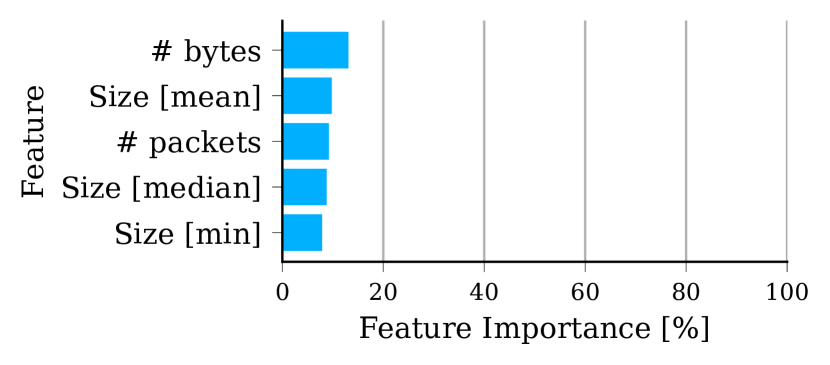
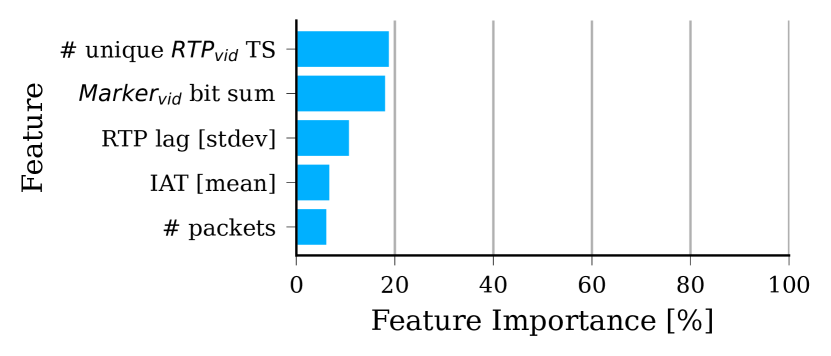
Feature importance for IP/UDP ML method
. Figure 5 shows the top 5 features for frame rate prediction in the case of Teams. We observe a high feature importance for the # unique sizes feature. We also observe the significant importance of this feature for Meet and Webex (see Figure A.4 in the Appendix). The prevalence of # unique sizes among the top 5 features of all VCAs suggests a strong correlation between frame rate and unique packet sizes, enabling accurate frame prediction even without utilizing the RTP headers.
Notably, the other semantic-based feature, # microbursts, does not appear among the top 5 features. This suggests that there is a significant distortion of inter-packet times along the network path. Furthermore, an ML approach, like IP/UDP ML, can take advantage of other signals in the network, which is absent in the IP/UDP Heuristic. For example, the most important feature is IAT [min] for Meet and # bytes for Webex.
5.1.3. Bitrate
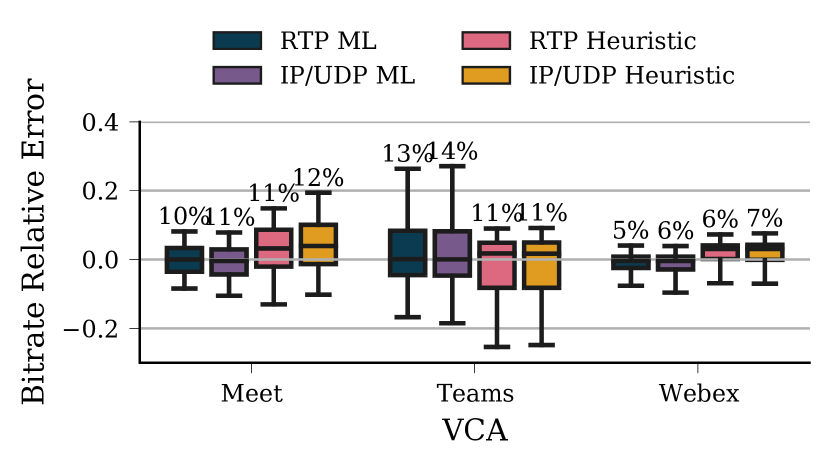
We calculate the relative bitrate error, defined as the ratio of bitrate error and the ground truth bitrate. Using relative values facilitates the comparison of errors across VCAs, especially because the ground truth bitrate distributions differ significantly across VCAs. Figure 6(a) shows the box plot of relative bitrate error distribution across the VCAs. The numbers displayed on the whiskers represent the mean relative absolute error (MRAE). The error distribution and the MRAE values exhibit similar values for both IP/UDP ML and RTP ML methods across all three VCAs. For example, in the case of Meet, the IP/UDP ML predictions are within 25% of theground truth bitrate in 87% of cases, while in Teams, it is 89%, and in Webex, it is 95%. Comparatively, in the RTP ML method, these percentages are 89%, 91%, and 95% for Meet, Teams, and Webex, respectively.
We observe higher errors for both heuristics compared to the ML methods, except in the case of Teams. Moreover, the errors are systemic, with median relative bitrate error consistently exceeding zero across all VCAs for both heuristics. This is because neither of these heuristics considers any application-layer overheads, such as due to encoding metadata. It should be noted that we do consider the overhead due to the fixed portion of the RTP headers, i.e., 12 bytes. However, incorporating encoding overheads remains challenging even with RTP headers, as those parts of the traffic are encrypted. The ML methods, on the other hand, can address these systemic errors by training on video bitrate values observed at the application level.
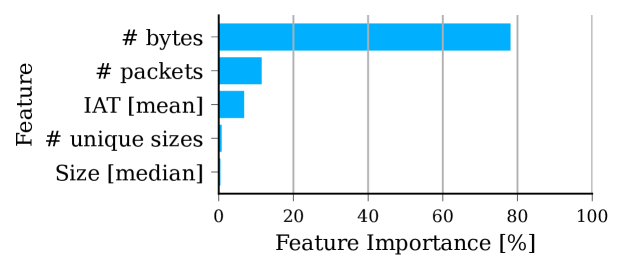
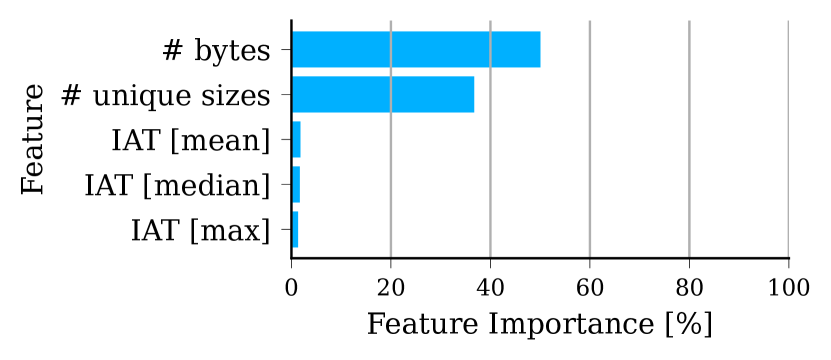
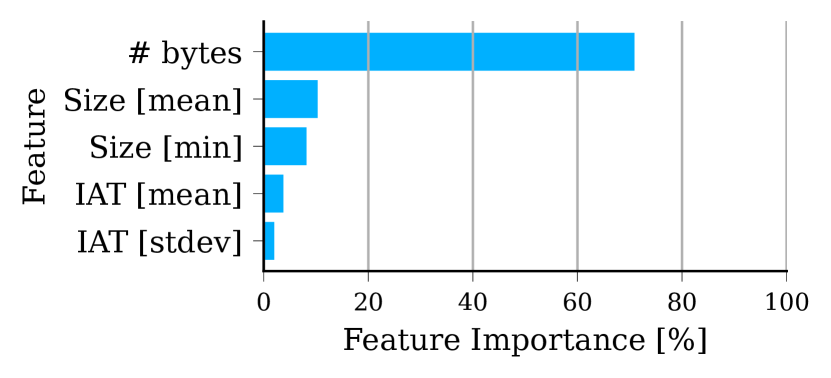
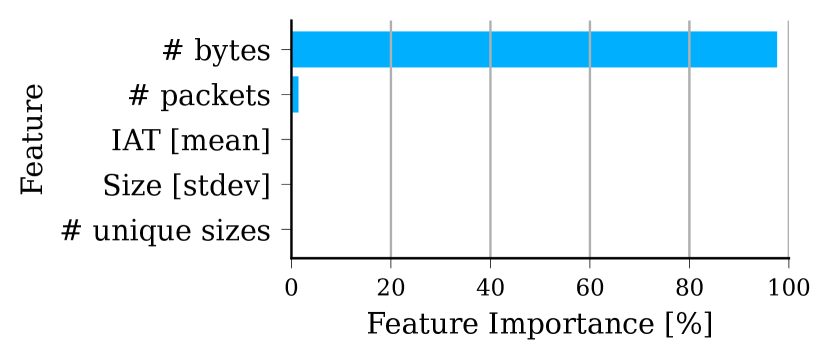
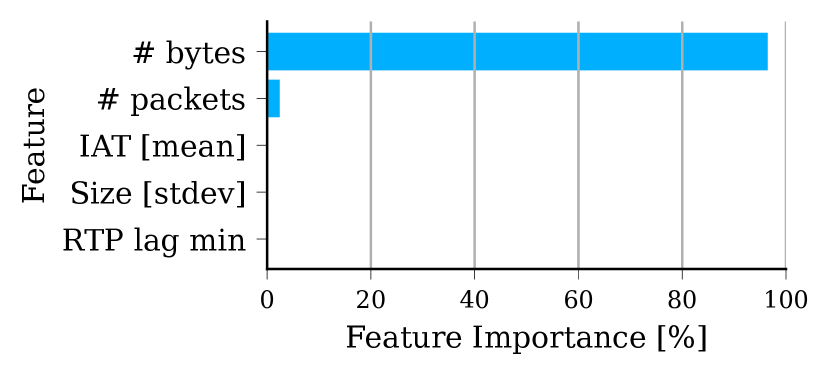
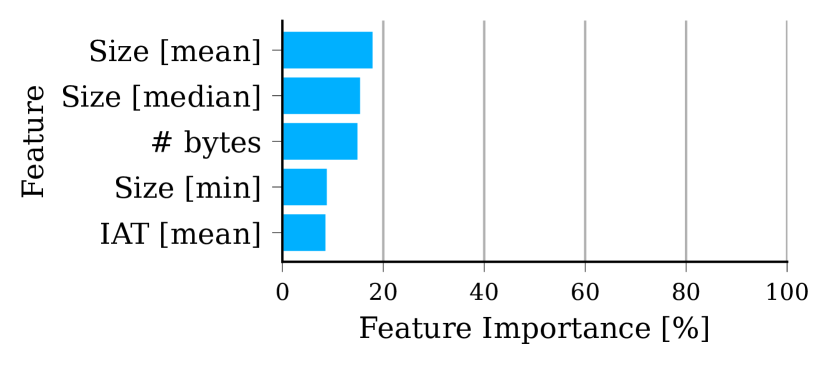
Feature importance for IP/UDP ML method
. Figure LABEL:fig:_fimp-bitrate-webex-ip shows the top 5 important features of the IP/UDP ML method in the case of Webex. As expected, the feature # bytes has the highest importance. In fact, that is the case across all three VCAs. Most of the other important features also relate to data volumes, such as Size [mean] and # packets. Interestingly, we do not observe any semantics-based features among the top-5 features, except for # unique sizes, which appears as the fourth most important feature for Webex. This is because video bitrate is inherently correlated with observed throughput. In fact, the top 5 features of the RTP ML method are also found to be derived from flow statistics (see Figure A.7 in Appendix).
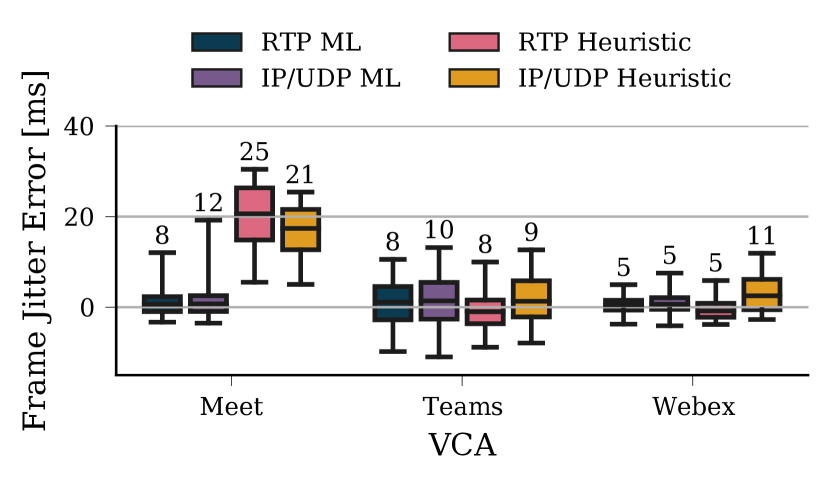
5.1.4. Frame Jitter
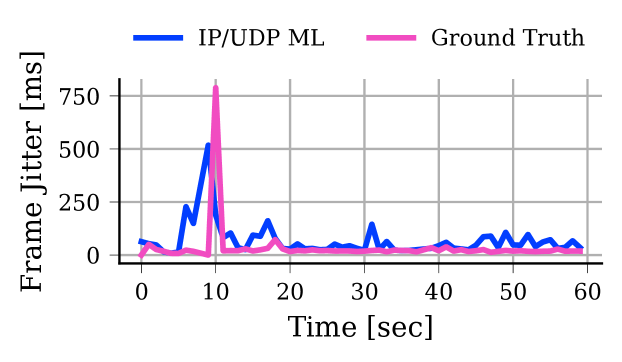
Figure 6(b) shows the boxplot of the errors in frame jitter predictions for the three VCAs. It is evident that all methods, including the RTP-based approaches, tend to overestimate frame jitter in most cases. Furthermore, we find that the MAE values are unusually high for this metric. The average ground truth frame jitter observed across all three VCAs falls within the range of 27-33 ms, which is comparable to the MAE values obtained from all methods. Upon further examination, we discover that the WebRTC ground-truth statistic reports the jitter over decoded frames, encompassing additional application delays such as jitter buffer and decoding delays. The jitter buffer introduces variable delays to ensure smooth video playback, while decoding delays vary based on the client’s computational resources. Capturing these variable application-level delays can be challenging using only the network data.
Figure 8 illustrates this phenomenon with the frame jitter values reported by the IP/UDP ML and WebRTC for a Meet call. The IP/UDP ML method reports several spikes in frame jitter throughout the call. While most of the smaller spikes seem to be smoothed out in the WebRTC data, there is a significant spike around t=10s that appears in both cases. The IP/UDP ML method estimates spikes before t=10s, indicating significant jitter in frame arrival around that time. The application jitter buffer might have attempted to mitigate this frame jitter by emitting frames at a constant rate until it is emptied, resulting in a larger spike later.
From a network operator’s perspective, it is more important to predict and respond to network-level frame jitter. Ensuring a smooth frame arrival will automatically lead to low frame jitter. In future work, we plan to modify our experiment methods to collect ground truth frame jitter calculated before the frame is enqueued to the jitter buffer. This will allow us to assess the error of our method more accurately by providing a reliable basis for comparison.
5.1.5. Resolution
| Method | Accuracy | ||
|---|---|---|---|
| Meet | Teams | Webex | |
| IP/UDP ML | 97.74% | 87.22% | 99.30% |
| RTP ML | 97.87% | 87.78% | 99.31% |
| Actual | Predicted | Total | ||
| Low | Medium | High | ||
| Low | 96.41% | 1.65% | 1.95% | 5038 |
| Medium | 8.08% | 45.40% | 46.52% | 1782 |
| High | 1.20% | 7.85% | 90.95% | 7588 |
We use frame height as the measure for resolution. Within our dataset, we observe 3 distinct frame height values for Meet: 180, 270, and 360; 11 distinct values for Teams ranging from 90 to 720; and only 2 distinct values for Webex: 180 and 360. For Meet and Webex, we apply classification on a per-value basis. For Teams, we bin the frame height into three classes: low ( 240), medium ((240, 480]), and high ( 480). Table 3 shows the overall resolution accuracies across all VCAs. In all cases, the accuracy is comparable to that of the RTP ML method.
Table 4 shows the confusion matrix for Teams using the IP/UDP ML method. It is evident that the IP/UDP ML method accurately predicts the low and high resolution classes. However, it misclassifies 46.52% of medium resolution intervals as high resolution. This discrepancy could be attributed to either class imbalance in one or more of the 5-fold cross-validation splits or the inherent difficulty in distinguishing between the medium and high resolution classes. Notably, within the medium resolution bin, 70% of the intervals have a frame height of 404, which is close to the threshold of 480 used to differentiate medium and high resolution classes.
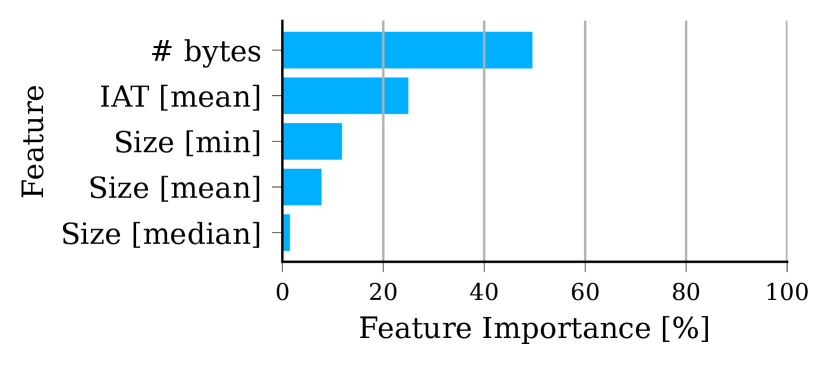
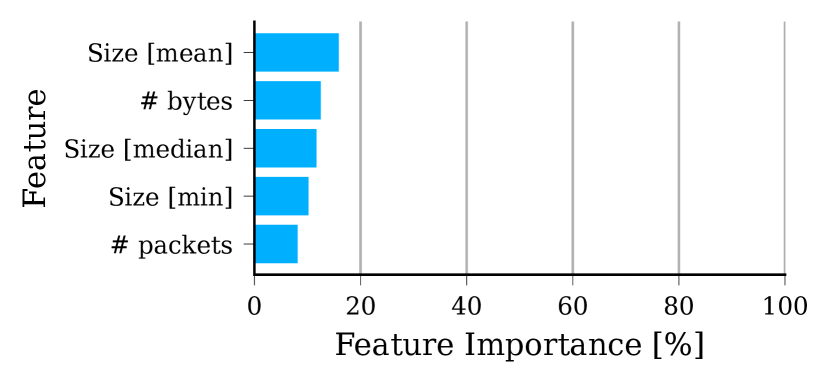
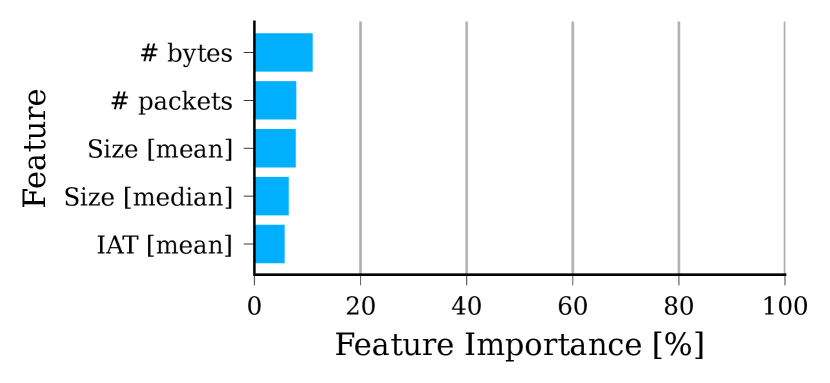
Feature importance.
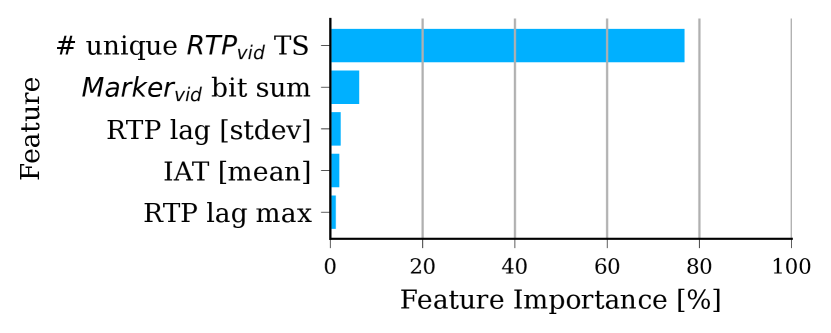
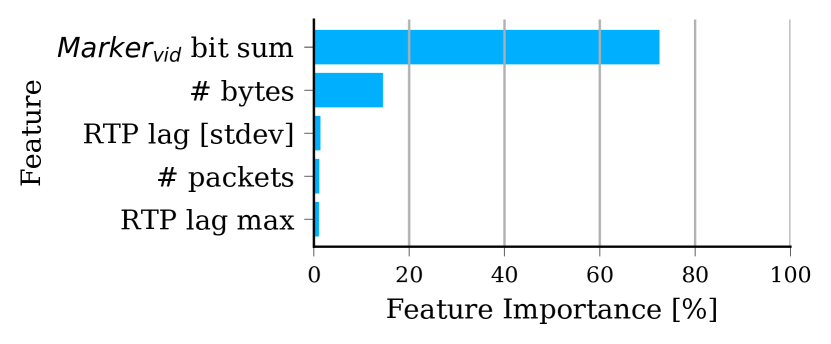
For the IP/UDP ML method, packet size statistics consistently appear in the top 5 features for all VCAs. In fact, for Meet and Teams, 3 out of top 5 features are related to packet sizes, suggesting a strong correlation between frame resolution and packet sizes. For Webex (see Figure 9), the most important feature is # unique sizes, indicating a correlation between frame rate and frame resolution. We find similar patterns in feature importance plots for the RTP ML method (see Figure A.9 in Appendix). The only exception is Webex, where the # unique sizes feature is replaced by and bit sum features. This finding re-affirms that packet size difference is valuable for identifying frame boundaries.
5.2. Real-world data
This section describes the results of the data collected from 15 access networks. We observe a few differences in the real-world dataset compared to the in-lab dataset. The payload type in Teams and Webex is different: For Teams, we observe a payload type of 100 for video, 101 for video retransmission, while for Webex, the payload type for video is 100, with no retransmissions as in the lab data. We adjust the media classification approach for the RTP methods accordingly, while the remaining methodology remains the same as for the in-lab data.
5.2.1. Frame Rate
Figure 10(a) shows the boxplot of frame rate estimation errors. The overall accuracy is high for the IP/UDP ML method and is comparable to the RTP ML method, a difference of 0.1 FPS across all VCAs. Interestingly, the RTP Heuristic has the highest accuracy among all methods. We believe it could be because network conditions are more stable in real-world data, thus reducing any errors in RTP Heuristic due to application-level delays such as jitter buffer delay.
The IP/UDP Heuristic, on the other hand, has the highest errors among all methods. While the MAE difference between the IP/UDP Heuristic and RTP Heuristic is only 0.5 FPS and 0.7 FPS for Teams and Webex, it is 2.3 FPS for Meet. Upon further inspection, we find that the higher errors for Meet are because of a higher fraction of frames in the real-world data where the intra-frame packet size difference is greater than the , the threshold used to determine frame boundaries. More specifically, in the lab data, the intra-frame size difference exceeded for only 4.26% of frames, while this number is 14.48% in the real-world data. This also explains consistent overestimation for Meet. Note that using a higher value for will not help as it will lead to underestimation due to combining frames with similar sizes. The discrepancy in Meet could be a codec-specific issue; Meet uses VP8 or VP9, while both Teams and Webex use H.264, leading to the fragmentation of frames into unequal-sized packets. We will examine this further in our future work.
We also notice this anomaly in the IP/UDP ML feature importance analysis. While # unique sizes is among the top 5 features for Teams and Webex, it is not the case for Meet. Instead, this is replaced by the IAT statistics, indicating that packet arrival patterns are better signals for detecting frame boundaries. This finding confirms that # unique sizes is not as strongly correlated with frame rate for Meet in the real-world data. This also shows the resiliency of ML models as they can rely on multiple features together more effectively.
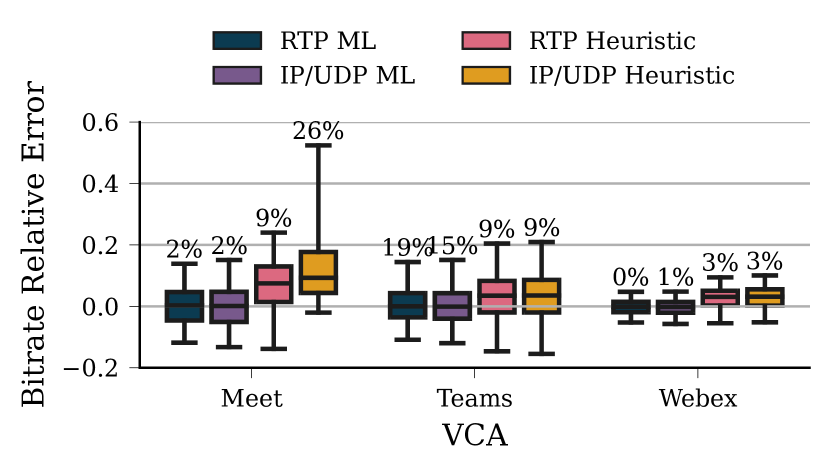
5.2.2. Bitrate
Figure 10(b) shows the boxplot of relative error distribution with overall MRAE values mentioned over the top whisker. The MRAE values in the real-world data are smaller than the in-lab data across all methods. For example, the IP/UDP ML method can estimate bitrate within 25% of ground truth in 92.17% of the intervals for Meet, 82.43% for Teams, and 95.14% for Webex. This is likely because the bitrate values are more stable, making predictions easier. The feature importance trends for bitrate are similar to in-lab data for each VCA. The most important features for both RTP ML and IP/UDP ML are again derived from flow statistic and correspond to data volume features such as # bytes and # packets.
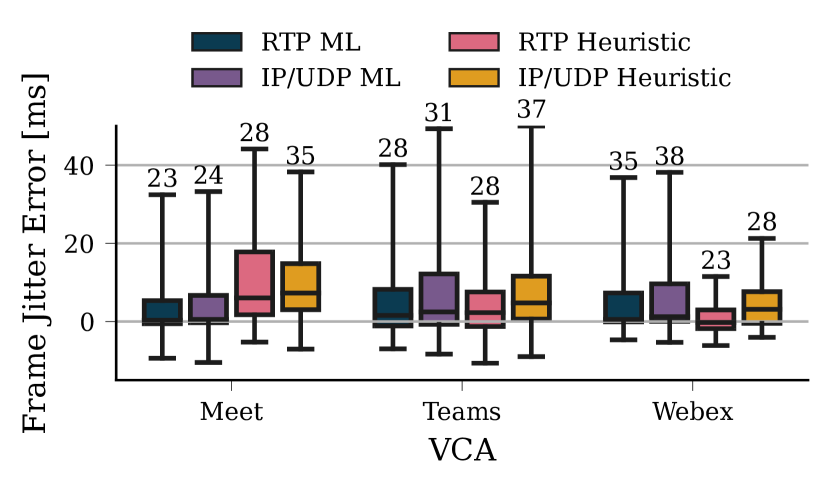
5.2.3. Frame Jitter
We observe that the overall frame jitter errors are lower in the real-world data than the in-lab data for most methods (see Figure 10(c) and Figure 6(b)). For example, when analyzing the IP/UDP ML MAE value for Meet, the MAE is 9.3 ms for real-world data, whereas it is 22.6 ms for in-lab data. This difference is likely because the network conditions are more stable in the real-world dataset. This leads to a lower network-level frame jitter, reducing the smoothening effect of the application-level delay jitter buffer. Thus, the differences between the predicted frame jitter (only network-data) and the WebRTC frame jitter (that includes effect of application delay jitter buffer) will be smaller, leading to reduced overall errors. The remaining trends are similar to the in-lab data.
5.2.4. Resolution
The real-world dataset for Meet contains two additional frame height values: 540 and 720. This is likely because of greater throughput availability and explains the greater overall bitrate values for Meet. For Teams, the same set of resolution values were observed as in-lab data. We only observe a single resolution for Webex, and thus skip its accuracy computation.
The accuracy for resolution classification using IP/UDP ML is 96.26% and 86.82% for Meet and Teams, respectively. This is comparable to the RTP ML accuracy – 96.75% for Meet and 87.11% for Teams, respectively. Similar to the in-lab data, the IP/UDP ML model can distinguish extreme resolution values (see Table A.3 for Teams) with high accuracy, while the accuracy is low for medium resolution intervals.
5.3. Model Transferability
| Method | VCA | ||
|---|---|---|---|
| Meet | Teams | Webex | |
| IP/UDP ML | 12.41 | 2.07 | 1.56 |
| RTP ML | 3.11 | 2.51 | 1.51 |
We examine the transferability of ML models by testing the in-lab trained ML models with the real-world dataset. Table 5 shows the overall MAE values for frame rate estimation. When considering the IP/UDP ML approach, MAE increases marginally for both Teams and Webex, specifically by 0.7 FPS and 0.3 FPS, respectively, compared to using models trained on real-world data. However, for Meet, the MAE significantly increases by 10 FPS. Upon further inspection, we find that IAT [min] is the most important feature for the in-lab-trained IP/UDP ML model. Considering the disparity in bitrates between real-world and lab data for Meet, it is likely that the IAT distribution also differs, leading to errors in frame rate prediction. Interestingly, the decline in performance for Meet using the RTP ML method is not as pronounced as observed in the IP/UDP ML method. This disparity can be attributed to the higher importance of the number of unique RTP timestamps as a feature, which in some sense is a more direct indicator of frame rate compared to IAT.
The trend persists for video bitrate and resolution, with a significant drop in accuracy for Meet but only a slight decrease for Teams and Webex (see Tables A.4 and A.5 in the Appendix). The non-transferability for Meet can again be attributed to the presence of a distinct distribution that was not previously encountered, i.e., calls with high bitrate and high resolution. This discrepancy suggests that the model cannot effectively extrapolate to unseen distributions.
5.4. Effect of Network Conditions
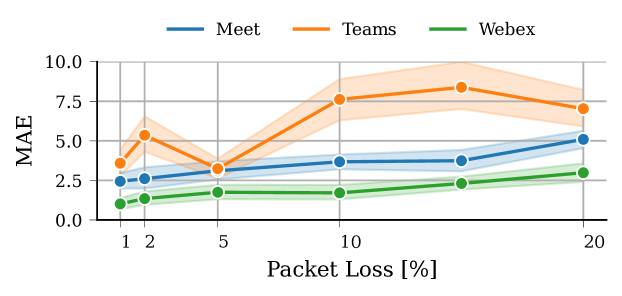
We next characterize the network conditions under which the models yield high errors. To do so, we collect data under synthetic network conditions by varying one of the following five network parameters: throughput (1500 kbps), throughput jitter (0 kbps), latency (50 ms), latency jitter (0 ms), and packet loss (0%). The numbers in parentheses represent the default values. For example, to analyze the impact of loss, other parameters are set to default values, and loss is varied from 0% to 20% following a Bernoulli loss model. Each combination of network conditions is repeated for four calls. For training ML models, we use 50% of data, sampling uniformly randomly from each combination of network condition. The remaining 50% data is used for testing.
Figure 11 shows the accuracy under varying loss for the IP/UDP ML method. Barring few exceptions, we observe an increasing trend in errors as network loss increases. On further inspection, we found that losses lead to retransmissions for video packets, leading to packet reordering. It is not possible to determine the correct order of the packets using only IP/UDP headers which causes higher errors. We find that the errors are even higher for the IP/UDP Heuristic as it relies only on packet sizes, and is more severely impacted by packet reordering. We also observe similar behavior under high latency or throughput jitter likely because both also lead to packet reordering. However, this occurs at very high values of jitter, indicating some robustness to minor jitters in the network. The errors do not change significantly with varying mean throughput or mean latency.
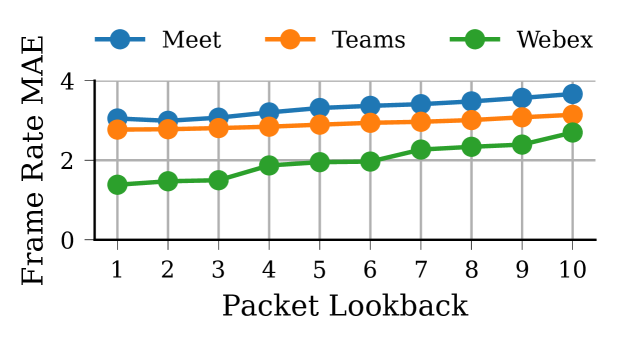
5.5. Effect of Prediction Window Size
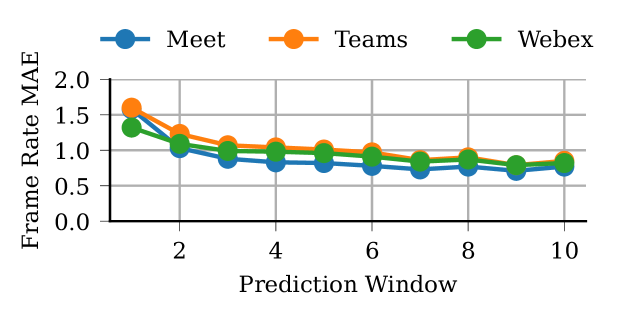
We analyze the impact of prediction window size on QoE estimation accuracy. Figure 12 shows the IP/UDP ML MAE values for frame rate under varying prediction window. The errors decrease as the prediction window size increases. This can be attributed to two reasons: (1). larger window sizes reduce the impact of sub-second-level window misalignment between packet traces and WebRTC logs, and (2). the frame rate values become more stable as they are smoothed out over larger window, making the prediction task easier. We observe similar patterns across other methods and metrics.
6. Related Work
QoE Inference for Video Streaming
. Past research has made substantial progress in inferring QoE for on-demand video streaming. One set of approaches propose heuristics that model a video session relying on the properties of the underlying streaming protocol (Dimopoulos et al., 2013; Schatz et al., 2012; Mangla et al., 2018). The second set of approaches propose using supervised machine learning and use features derived from network data to estimate QoE metrics (Mazhar and Shafiq, 2018; Bronzino et al., 2019; Krishnamoorthi et al., 2017; Aggarwal et al., 2014). Inferring QoE for video conferencing is a fairly distinct problem from video streaming due to the differences in the nature of two applications, consequently leading to differences in the underlying application and transport protocols, and the metrics that determine user QoE. This paper tackles the problem of QoE inference for VCAs and proposes both heuristic- and ML-based approaches.
VCA measurement studies. Early VCA measurement studies focused on understanding the design and network performance of Skype, one of the first and the most popular VCA of the time (Baset and Schulzrinne, 2004; Guha and Daswani, 2005; Hoßfeld and Binzenhöfer, 2008). More recent studies have revisited similar questions for modern VCAs (MacMillan et al., 2021; Nistico et al., 2020; Jansen et al., 2018; Chang et al., 2021; He et al., 2023). Most of these studies rely on controlled experiments and assume access to end-hosts to collect VCA performance data. For instance, He et al. (He et al., 2023) identify the functional differences (e.g., congestion control mechanisms) among modern VCAs using controlled measurements. Our work considers a different question, i.e., how to infer video QoE metrics without access to end-hosts? Answering this question can enable network operators to understand VCA performance for a wide-variety of application and network contexts and appropriately manage their networks.
VCA QoE inference. Past work has proposed data-driven techniques, based on supervised machine learning, to estimate QoE for Voice over IP (Chen et al., 2006; Aggarwal et al., 2014). More recent works propose similar techniques but focus on video performance over VCAs. These works differ, however, in the set of inferred QoE metrics as well as the network features used for inference. For instance, Garcia et al. infer metrics assuming access to an unimpaired reference video(García et al., 2020). Similarly, Yan et al.(Yan et al., 2015) use WiFi-specific features to predict “good versus bad” QoE over the entire VCA session. We focus on inferring no-reference, objective VCA QoE metrics using measurements of passive network traffic. Works by Nikravesh et al.(Nikravesh et al., 2016) and Carofigilo et al. (Carofiglio et al., 2021) are similar in spirit in that regard. However, both of these works assume access to RTP headers which may not be practical in many cases such as with custom RTP protocols (e.g., Zoom), encrypted application-layer headers (e.g., VPN), or legacy monitoring systems. Recent work by Oliver et al. (Marczak and Scott-Railton, 2021) uses entropy-based header analysis to infer Zoom’s RTP encapsulation mechanisms. However, the approach may not work if VCAs use complex encapsulation mechanisms or encrypt application-layer headers altogether. Morevoer, it requires network monitoring systems that can process arbitrary portions of the traffic. This may not be feasible for several network operators due to practical considerations. This paper considers whether more standard features of the network traffic, i.e., IP/UDP headers, can be used to infer the VCA QoE metrics.
7. Limitations and Future Work
Generalizability to other VCAs.
Our paper’s evaluation is focused on WebRTC-based VCAs, although our methodology can be applied to any RTP-based VCA. The reason to focus on WebRTC is the lack of methods to obtain application-level QoE metrics for native VCA clients. Additionally, we do not include the WebRTC version of Zoom, one of the most popular VCAs, as its implementation uses the datachannel API meant for non-audiovisual communication. As a result, the video QoE metrics are no longer available for Zoom through the webrtc-internals API. Past work has considered other metrics to obtain QoE metrics from the applications. Michel et al. (Michel et al., 2022) used a custom Zoom client, but this approach will not work for the native client of other VCAs. Another method to obtain application-level logs is through screen capture of annotated video (Fouladi et al., 2018; Varvello et al., 2022), but this method is resource intensive. Future work will explore generalizable and lightweight methods to obtain application-level QoE logs for native VCA clients and assess the accuracy of proposed QoE estimation methods for these clients.
Cost of ML models
. Using supervised ML models can be costly due to the expense of acquiring labeled data for training. We present one solution to gather labeled data, i.e., through automated data collection frameworks, deployed either in-lab or across multiple network vantage points. The framework is easily extensible to other WebRTC-based VCAs. Another solution to explore in future would be whether direct or calibrated estimations from non-machine learning methods like IP/UDP Heuristic or RTP Heuristic can be used as alternatives to labeled data.
Impact of application modes
. We only evaluate our methodology in a two-person call scenario. However, modern VCAs offer various other application modes, such as disabling video, multi-party conferencing, and screen sharing. Determining whether user video is disabled seems possible by analyzing UDP packet size distribution, but the other two modes pose challenges in QoE estimation, especially using only IP/UDP headers. In multi-party scenarios, multiple video streams may be transmitted over the same UDP flow. This may require an additional step in our methods to estimate the number of participants before estimating QoE. Similarly, when screen sharing is enabled, adjustments to the media classification steps will be required. These adjustments may be based on insights from differences in encoding of video and screen sharing data. Additionally, a machine learning-based QoE inference approach such as IP/UDP ML, when trained with appropriate data, could accurately estimate QoE metrics even across different application modes. Further research will explore this question and quantify the impact of application modes on the accuracy of our methods.
System considerations
. In theory, our approach relies on lightweight features from the IP/UDP headers of network traffic. However, we have not tested the scalability of our methods on a network-wide level, particularly when it comes to real-time QoE estimation. Additional optimization might be required in the implementation of our methods such as using efficient data structures or implementation of streaming versions of the methods. In future work, we plan to implement these approaches within a real-world network, such as campus network, to assess the scalability of our approach.
8. Conclusion
We have developed and evaluated two methods to infer QoE for WebRTC-based VCAs at per-second granularity. Evaluation of our method under diverse network conditions demonstrates the model’s ability to estimate QoE metrics with high accuracy, even if the methods relies on only IP/UDP headers. This approach represents a significant advance over previous work, which uses information in the RTP headers. Future work will explore the generalizability of our methods to a broader set of clients (e.g., device, operating systems, native clients) and application modes (e.g., multi-party calls).
Acknowledgements
We would like to thank our shepherd, Gianni Antichi and the anonymous reviewers for their valuable feedback. We also thank Guilherme Martins for helping with the real-world data collection and Irene Pattarachanyakul for her efforts towards earlier version of this research. The work was supported by National Science Foundation (NSF) awards CNS-2124393, CNS-2223610, CNS-2224687, OAC-2126327, CNS-2146496, CNS-2131826, and CNS-2313190 at the University of Chicago, and Intel and NSF Awards CNS-2003257, OAC-2126327, and OAC-2126281 at UCSB.
References
- (1)
- tcp (2022) 2022. The M-Lab TCP INFO Data Set. https://measurementlab.net/tests/tcp-info
- mla (2022) 2022. Measurement Lab – Network Diagnostic Test (NDT7). https://www.measurementlab.net/tests/ndt/ndt7/
- web (2023) 2023. Chrome WebRTC Internals. chrome://webrtc-internals
- Aggarwal et al. (2014) Vaneet Aggarwal, Emir Halepovic, Jeffrey Pang, Shobha Venkataraman, and He Yan. 2014. Prometheus: Toward Quality-of-experience Estimation for Mobile Apps from Passive Network Measurements. In Proc. of ACM HotMobile.
- Banitalebi-Dehkordi et al. (2015) Amin Banitalebi-Dehkordi, Mahsa T Pourazad, and Panos Nasiopoulos. 2015. The effect of frame rate on 3D video quality and bitrate. 3D Research 6, 1 (2015), 1–13.
- Baset and Schulzrinne (2004) Salman A Baset and Henning Schulzrinne. 2004. An analysis of the skype peer-to-peer internet telephony protocol. arXiv preprint cs/0412017 (2004).
- Borgolte et al. (2019) Kevin Borgolte, Tithi Chattopadhyay, Nick Feamster, Mihir Kshirsagar, Jordan Holland, Austin Hounsel, and Paul Schmitt. 2019. How dns over https is reshaping privacy, performance, and policy in the internet ecosystem. In TPRC47: The 47th Research Conference on Communication, Information and Internet Policy.
- Bronzino et al. (2019) Francesco Bronzino, Paul Schmitt, Sara Ayoubi, Guilherme Martins, Renata Teixeira, and Nick Feamster. 2019. Inferring streaming video quality from encrypted traffic: Practical models and deployment experience. Proceedings of the ACM on Measurement and Analysis of Computing Systems 3, 3 (2019), 1–25.
- Carofiglio et al. (2021) Giovanna Carofiglio, Giulio Grassi, Enrico Loparco, Luca Muscariello, Michele Papalini, and Jacques Samain. 2021. Characterizing the Relationship Between Application QoE and Network QoS for Real-Time Services. In Proceedings of the ACM SIGCOMM 2021 Workshop on Network-Application Integration.
- Chai et al. (2019) Zimo Chai, Amirhossein Ghafari, and Amir Houmansadr. 2019. On the Importance of Encrypted-SNI (ESNI)) to Censorship Circumvention. In 9th USENIX Workshop on Free and Open Communications on the Internet (FOCI 19).
- Chang et al. (2021) Hyunseok Chang, Matteo Varvello, Fang Hao, and Sarit Mukherjee. 2021. Can you see me now? A measurement study of Zoom, Webex, and Meet. In Proceedings of the 21st ACM Internet Measurement Conference. 216–228.
- Chen et al. (2006) Kuan-Ta Chen, Chun-Ying Huang, Polly Huang, and Chin-Laung Lei. 2006. Quantifying Skype user satisfaction. In Proceedings of the 2006 conference on Applications, technologies, architectures, and protocols for computer communications (Pisa, Italy) (SIGCOMM ’06). ACM, 399–410. https://doi.org/10.1145/1159913.1159959
- Dimopoulos et al. (2013) G. Dimopoulos, P. Barlet-Ros, and J. Sanjuas-Cuxart. 2013. Analysis of YouTube user experience from passive measurements. In Proc. CNSM.
- Dimopoulos et al. (2016) Giorgos Dimopoulos, Ilias Leontiadis, Pere Barlet-Ros, and Konstantina Papagiannaki. 2016. Measuring video QoE from encrypted traffic. In Proceedings of the 2016 Internet Measurement Conference. 513–526.
- Farnaaz and Jabbar (2016) Nabila Farnaaz and MA Jabbar. 2016. Random forest modeling for network intrusion detection system. Procedia Computer Science 89 (2016), 213–217.
- Fouladi et al. (2018) Sadjad Fouladi, John Emmons, Emre Orbay, Catherine Wu, Riad S. Wahby, and Keith Winstein. 2018. Salsify: Low-Latency Network Video through Tighter Integration between a Video Codec and a Transport Protocol. In 15th USENIX Symposium on Networked Systems Design and Implementation (NSDI 18). USENIX Association, Renton, WA, 267–282. https://www.usenix.org/conference/nsdi18/presentation/fouladi
- Garcia et al. (2019) Boni Garcia, Micael Gallego, Francisco Gortazar, and Antonia Bertolino. 2019. Understanding and estimating quality of experience in WebRTC applications. Computing 101, 11 (2019), 1585–1607.
- García et al. (2020) Boni García, Francisco Gortázar, Micael Gallego, and Andrew Hines. 2020. Assessment of qoe for video and audio in webrtc applications using full-reference models. Electronics 9, 3 (2020), 462.
- Guha and Daswani (2005) Saikat Guha and Neil Daswani. 2005. An experimental study of the skype peer-to-peer voip system. Technical Report. Cornell University.
- He et al. (2023) Jia He, Mostafa Ammar, and Ellen Zegura. 2023. A Measurement-Derived Functional Model for the Interaction Between Congestion Control and QoE in Video Conferencing. In Passive and Active Measurement: 24th International Conference, PAM 2023, Virtual Event, March 21–23, 2023, Proceedings. Springer, 129–159.
- Hoßfeld and Binzenhöfer (2008) Tobias Hoßfeld and Andreas Binzenhöfer. 2008. Analysis of Skype VoIP traffic in UMTS: End-to-end QoS and QoE measurements. Computer Networks (2008).
- Hossfeld et al. (2016) Tobias Hossfeld, Poul E Heegaard, Martin Varela, and Sebastian Möller. 2016. Formal definition of QoE metrics. arXiv preprint arXiv:1607.00321 (2016).
- Huitema (2003) C Huitema. 2003. RFC3605: Real Time Control Protocol (RTCP) Attribute in Session Description Protocol (SDP).
- Jansen et al. (2018) Bart Jansen, Timothy Goodwin, Varun Gupta, Fernando Kuipers, and Gil Zussman. 2018. Performance evaluation of WebRTC-based video conferencing. ACM SIGMETRICS Performance Evaluation Review 45, 3 (2018), 56–68.
- Jesup (2011) R Jesup. 2011. RTP Payload Format for H. 264 Video. Internet Eng. Task Force, RFC 6184 (2011).
- Krishnamoorthi et al. (2017) Vengatanathan Krishnamoorthi, Niklas Carlsson, Emir Halepovic, and Eric Petajan. 2017. BUFFEST: Predicting Buffer Conditions and Real-time Requirements of HTTP(S) Adaptive Streaming Clients. In Proc. of ACM MMSys.
- Li (2007) A Li. 2007. RTP Payload Format for Generic Forward Error Correction, RFC 5109. (2007).
- MacMillan et al. (2021) Kyle MacMillan, Tarun Mangla, James Saxon, and Nick Feamster. 2021. Measuring the performance and network utilization of popular video conferencing applications. In Proceedings of the 21st ACM Internet Measurement Conference.
- MacMillan et al. (2023) Kyle MacMillan, Tarun Mangla, James Saxon, Nicole P Marwell, and Nick Feamster. 2023. A Comparative Analysis of Ookla Speedtest and Measurement Labs Network Diagnostic Test (NDT7). Proceedings of the ACM on Measurement and Analysis of Computing Systems 7, 1 (2023), 1–26.
- Mangla et al. (2018) Tarun Mangla, Emir Halepovic, Mostafa Ammar, and Ellen Zegura. 2018. eMIMIC: Estimating HTTP-based Video QoE Metrics from Encrypted Network Traffic. In Proc. of IEEE/IFIP TMA.
- Mangla et al. (2020) Tarun Mangla, Emir Halepovic, Ellen Zegura, and Mostafa Ammar. 2020. Drop the packets: using coarse-grained data to detect video performance issues. In Proceedings of the 16th International Conference on emerging Networking EXperiments and Technologies. 71–77.
- Marczak and Scott-Railton (2021) Bill Marczak and John Scott-Railton. 2021. Move Fast and Roll Your Own Crypto: A Quick Look at the Confidentiality of Zoom Meetings. https://citizenlab.ca/2020/04/move-fast-roll-your-own-crypto-a-quick-look-at-the-confidentiality-of-zoom-meetings/
- Mazhar and Shafiq (2018) M. H. Mazhar and Z. Shafiq. 2018. Real-time Video Quality of Experience Monitoring for HTTPS and QUIC. In Proc. of IEEE INFOCOM.
- Michel et al. (2022) Oliver Michel, Satadal Sengupta, Hyojoon Kim, Ravi Netravali, and Jennifer Rexford. 2022. Enabling passive measurement of zoom performance in production networks. In Proceedings of the 22nd ACM Internet Measurement Conference. 244–260.
- Nikravesh et al. (2016) Ashkan Nikravesh, David Ke Hong, Qi Alfred Chen, Harsha V Madhyastha, and Z Morley Mao. 2016. QoE inference without application control. In Proceedings of the 2016 workshop on QoE-based Analysis and Management of Data Communication Networks. 19–24.
- Nistico et al. (2020) Antonio Nistico, Dena Markudova, Martino Trevisan, Michela Meo, and Giovanna Carofiglio. 2020. A comparative study of RTC applications. In 2020 IEEE International Symposium on Multimedia (ISM). 1–8.
- Schatz et al. (2012) R. Schatz, T. Hossfeld, and P. Casas. 2012. Passive YouTube QoE Monitoring for ISPs. In Proc. of IMIS.
- Schulzrinne et al. (2003) Henning Schulzrinne, Steven Casner, R Frederick, and Van Jacobson. 2003. RFC3550: RTP: A transport protocol for real-time applications.
- Sharma et al. (2022) Ranya Sharma, Tarun Mangla, James Saxon, Marc Richardson, Nick Feamster, and Nicole P Marwell. 2022. Benchmarks or Equity? A New Approach to Measuring Internet Performance. A New Approach to Measuring Internet Performance (August 3, 2022) (2022).
- Sharma et al. (2023) Taveesh Sharma, Tarun Mangla, Arpit Gupta, Junchen Jiang, and Nick Feamster. 2023. vcaml. https://github.com/noise-lab/vcaml Estimating WebRTC Video QoE Metrics Without Using Application Headers.
- Sonchack et al. (2018) John Sonchack, Oliver Michel, Adam J Aviv, Eric Keller, and Jonathan M Smith. 2018. Scaling Hardware Accelerated Network Monitoring to Concurrent and Dynamic Queries With * Flow. In 2018 USENIX Annual Technical Conference (USENIX ATC 18). 823–835.
- Uberti et al. (2023) J Uberti, C Jennings, and S Murillo. 2023. RFC 9335: Completely Encrypting RTP Header Extensions and Contributing Sources.
- Varvello et al. (2022) Matteo Varvello, Hyunseok Chang, and Yasir Zaki. 2022. Performance characterization of videoconferencing in the wild. In Proceedings of the 22nd ACM Internet Measurement Conference. 261–273.
- Yan et al. (2015) Suying Yan, Yuchun Guo, Yishuai Chen, Feng Xie, Chenguang Yu, and Y. Liu. 2015. Enabling QoE Learning and Prediction of WebRTC Video Communication in WiFi Networks. https://api.semanticscholar.org/CorpusID:30220021
- Yan et al. (2017) Suying Yan, Yuchun Guo, Yishuai Chen, Feng Xie, Chenguang Yu, and Yong Liu. 2017. Enabling QoE learning and prediction of WebRTC video communication in WiFi networks. In Proceedings of the ICC, Vol. 2017.
Appendix A Statement of Ethics
The real-world network traces used in this paper are collected after obtaining approvals from our Institutional Review Board (IRB). We prioritize the protection of user privacy and take extensive measures to ensure it. Our deployment setup solely permits the collection of active measurement data from participants’ homes; we can not monitor any user network traffic. More specifically, the Raspberry Pi (RPi) devices used for this study are connected to the home router using a wired connection like any other device. We do not sit in the middle of the user device and the home router. Additionally, we remove any personally identifiable information, such as physical address and demographics, before analyzing the collected data.
The network trace data that we make public corresponds to the VCA calls between the Raspberry Pi and the cloud endpoint. As an additional privacy measure, the IP addresses of both these endpoints have been hashed in the network traces as well as the JSON files obtained via webrtc-internals. The remaining datasets used in this paper are collected within controlled lab setting and do not pose any privacy-related issues.
Appendix B Methodology
Appendix C Datasets
C.1. Data Description
Figure A.1 and Figure A.2 show the CDF of ground truth QoE metrics for in-lab and real-world datasets respectively.
| Actual | Prediction | Total | |
| Non-Video | Video | ||
| Non-video | 98.2% | 1.8% | 50,799 |
| Video | 0% | 100% | 946,769 |
| Actual | Prediction | Total | |
| Non-Video | Video | ||
| Non-video | 98.5% | 1.5% | 378,249 |
| Video | 0% | 100% | 1,818,689 |
Appendix D Evaluation
D.1. In-lab Data
D.1.1. Media classification accuracy
D.1.2. Frame rate
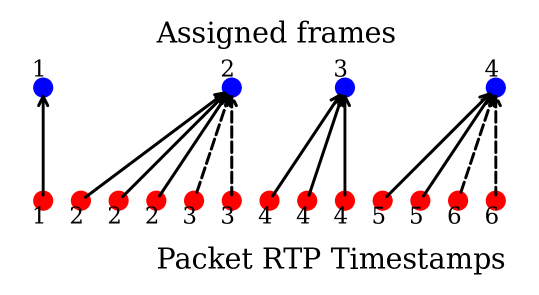
Figure A.3 illustrates a case of frame coalescing from one of the Teams sessions. The red dots represent sequence of packets over time with their respective RTP timestamp, while the blue dots show the frame assignment by the IP/UDP Heuristic. Packets with RTP timestamp 2 and 3 have a size of 1022 bytes and 1020 bytes, respectively, leading to these packets grouped into a single frame. Similar is the case for packets with RTP timestamp 5 and 6.
Feature Importance
. Figure A.4 and A.5 show the feature importance plots for IP/UDP ML and RTP ML methods, respectively.
D.1.3. Video bitrate
Feature Importance
. Figure A.6 and A.7 show the feature importance plots for IP/UDP ML and RTP ML methods, respectively.
D.1.4. Frame Resolution
Feature Importance
D.2. Real-world Data
| Actual | Predicted | Total | ||
| Low | Medium | High | ||
| Low | 90.23% | 5.58% | 4.19% | 573 |
| Medium | 14.32% | 30.87% | 54.81% | 447 |
| High | 0.89% | 3.34% | 95.77% | 2576 |
D.2.1. Resolution
Table A.3 shows the IP/UDP ML confusion matrix for resolution prediction for Teams on real-world data.
D.3. Model Transferability
| Method | VCA | ||
|---|---|---|---|
| Meet | Teams | Webex | |
| IP/UDP ML | 889.93 | 114.06 | 29.53 |
| RTP ML | 793.86 | 167.18 | 29.22 |
| Method | VCA | ||
|---|---|---|---|
| Meet | Teams | Webex | |
| IP/UDP ML | 89.74 | 64.36 | 29.78 |
| RTP ML | 30.31 | 19.87 | 95.43 |
D.4. Effect of Network Conditions
| Impairment | Throughput [kbps] | Delay [ms] | Packet Loss |
|---|---|---|---|
| Mean Throughput | : [100, 200, 500,1000, 2000, 4000], : 0 | : 50, : 0 | 0% |
| Throughput stdev. | : 1500, : [0, 100, 200, 500, 1000, 1500] | : 50, : 0 | 0% |
| Mean Latency | : 1500, : 0 | : [50, 100, 200, 300, 400, 500], : 0 | 0% |
| Latency stdev. | : 1500, : 0 | : 50, : [10, 20, 30, 40, 50, 60, 70, 80, 90, 100] | 0% |
| Packet Loss % | : 1500, : 0 | : 50, : 0 | [1, 2, 5, 10, 15, 20]% |
Table A.6 summarizes the synthetic network conditions emulated to study the effect of network conditions on the accuracy of ML models.
D.5. Effect of IP/UDP Heuristic packet lookback
The IP/UDP Heuristic packet lookback parameter was tuned on a sample of 50 in-lab traces each for Meet, Teams and Webex. Figure A.10 shows the variation of frame rate MAE with the number of packets we look back to match a packet with already assembled frames. For Webex we see a clear increasing trend, while for Meet and Teams we observe minima at lookbacks of 3 and 2 respectively. Webex has an optimal lookback of 1 because 99.70% frames have a maximum intra-frame size difference of 2 bytes, and 99.38% of the frames are of size less than or equal to 3 packets. Our algorithm is thus able to merge similarly sized frames together by not looking too far back. For Teams, even though 98.56% of the frames have an intra-frame size difference of 2 bytes, only 43.82% have a size less than or equal to 3 packets. Thus, a greater lookback is required to merge similarly sized packets together. For Meet, these percentages are slightly lower than Webex (95.73% and 95.18%), thus the optimal lookback is 2 packets.