The Population of the Galactic Center Filaments: Position Angle Distribution
Reveal a Degree-scale Collimated Outflow from Sgr A* along the Galactic Plane
Abstract
We have examined the distribution of the position angle (PA) of the Galactic center filaments with lengths and as well as their length distribution as a function of PA. We find bimodal PA distributions of the filaments, long and short populations of radio filaments. Our PA study shows the evidence for a distinct population of short filaments with PA close to the Galactic plane. Mainly thermal short radio filaments () have PAs concentrated close to the Galactic plane within . Remarkably, the short filament PAs are radial with respect to the Galactic center at , and extend in the direction toward Sgr A*. On a smaller scale, the prominent Sgr E HII complex G358.7-0.0 provides a vivid example of the nearly radial distribution of short filaments. The bimodal PA distribution suggests different origin for two distinct filament populations. We argue that alignment of the short filament population results from the ram pressure of a degree-scale outflow from Sgr A* that exceeds the internal filament pressure, and aligns them along the Galactic plane. The ram pressure is estimated to be 2 cm K at a distance of 300pc, requiring biconical mass outflow rate yr-1 with an opening angle of . This outflow aligns not only the magnetized filaments along the Galactic plane but also accelerates thermal material associated with embedded or partially embedded clouds. This places an estimate of 6 Myr as the age of the outflow.
1 Introduction
The prototype magnetized radio filaments in the Galactic center (GC) were discovered close to 40 years ago (Yusef-Zadeh, Morris & Chance, 1984). Since then, VLA, Nobeyama 45m-telescope, Mologlo and ATCA observations have shown linearly polarized synchrotron emission tracing nucleus-wide cosmic ray activity throughout the inner few hundred parsecs of the Galaxy (Liszt, 1985; Bally & Yusef-Zadeh, 1989; Gray, et al., 1991; Sofue, Murata, & Reich, 1992; Lang et al., 1999; Reich et al., 2000; LaRosa et al., 2005; Yusef-Zadeh, Hewitt, & Cotton, 2004; Nord et al., 2004; Law, Yusef-Zadeh & Cotton, 2008; Pound & Yusef-Zadeh, 2018; Staguhn et al., 2019; Arendt et al., 2019). Chandra, XMM and NuSTAR have also detected X-ray emission from a handful of nonthermal radio filaments. (Sakano, et al., 2003; Lu, Wang & Lang, 2003; Yusef-Zadeh, et al., 2005; Zhang, et al., 2014, 2020; Yusef-Zadeh et al., 2021)
High temperature molecular clouds with large turbulent linewidths also characterize this region, the Central Molecular Zone (CMZ). Furthermore, H absorption line observations show that high cosmic ray ionization rates permeate the CMZ at levels a thousand times that of the solar neighborhood (Oka & Geballe, 2020). These observations indicate that cosmic ray pressure in the CMZ is significant when compared to the interstellar gas pressure of the Galactic center.
Recent MeerKAT observations have provided a remarkable mosaic of the inner few degrees of the Galactic center (GC) with exquisite details at spatial resolution (Heywood, et al., 2019; Heywood et al., 2022). Statistical properties of the population of GC filaments such as morphology, mean spectral index, equipartition magnetic field, filament spacing and their associations with stellar candidates have recently been studied in detail in a series of papers (Yusef-Zadeh et al., 2022a, b, c). VLA observations showed the bright and long filaments emitting non-thermal emission whereas MeerKAT data showed a great deal of fainter filaments and filamentary structures that are shorter. MeerKAT has also surveyed a large number of galaxy clusters, some of which show exceptional isolated filamentary structures in the intracluster medium (ICM). These filaments appear to be linked to radio jets, tails and lobes of radio galaxies (Shimwell et al., 2016; Ramatsoku et al., 2020; Condon et al., 2021; Rudnick et al., 2022). For the first time, a population of magnetized ICM filaments, with an underlying physical mechanism similar to that of GC filament population, is identified in external galaxies (Yusef-Zadeh, Arendt, & Wardle, 2022d).
With the new and sensitive MeerKAT images of the Galactic center, we continue examining the physical properties of the GC filaments, focusing on their position angle (PA). This physical characteristic could potentially provide additional insight into the origin of the enigmatic GC filaments. Previous VLA observations of the brightest GC filaments showed that they are mainly oriented perpendicular to the Galactic plane (Yusef-Zadeh, Hewitt, & Cotton (2004) and references therein). Using high sensitivity of MeerKAT data, we examine statistical properties of the PA of the GC filament population. We present evidence that short filaments located on the negative Galactic longitudes, have PAs that run mainly within of the Galactic plane. An extension of the filament PAs show radial distribution, pointing in the direction toward Sgr A* at the Galactic center. The orientation of a large number of filaments within a few hundred pc of Sgr A* is similar to those found in radio continuum and recombination line images of the inner few arcminutes of Sgr A* (Royster et al., 2019; Yusef-Zadeh et al., 2020). In addition, ALMA observations of the Sgr E molecular cloud shows parallel filamentary structure along the Galactic plane (Wallace et al., 2022). Here we consider a picture in which a collimated outflow, most likely arising from Sgr A*, is responsible for distorting and aligning the shape of molecular, thermal and nonthermal features along the Galactic plane.
2 Data Reduction
Details of the MeerKAT observations can be found in Heywood et al. (2022). Here we briefly describe the observations and data processing. The final image is constructed from 20 MeerKAT pointings for a total of 144 hours on-source. The L-band (8561712 MHz) system was used, with the correlator configured to deliver 4,096 frequency channels. The 1.28 GHz mosaic covers the inner 3.5∘ 2.5∘ ( ) of the Galactic center. Spectral index () measurements (where ) have used 16 sub-bands between 856 and 1712 MHz. The in-band spectral index values are measured simultaneously centered at 1.28 GHz (Heywood et al., 2022).
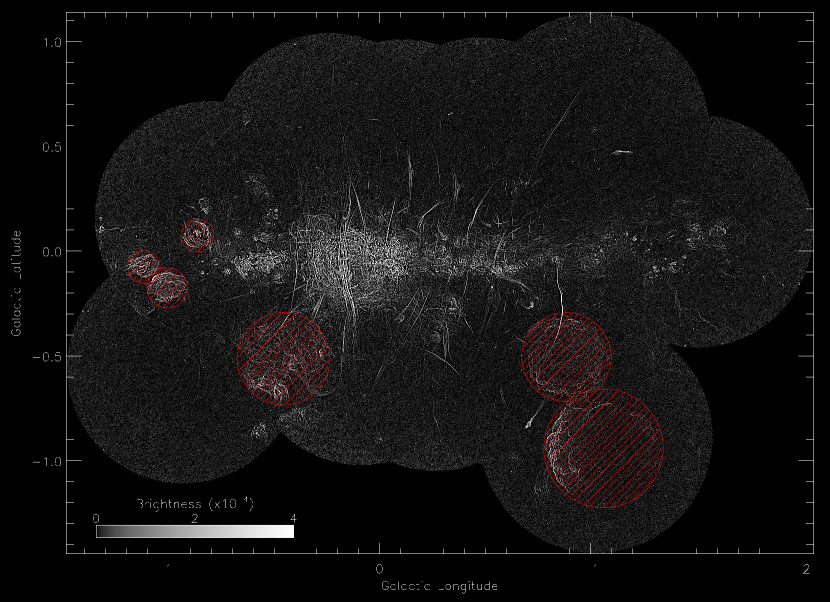
To enhance the visibility of the filaments, the mosaic image is filtered using a difference of Gaussians to smooth noise and remove large scale backgrounds, as described in detail in Yusef-Zadeh et al. (2022a). Numerous fainter filaments are uncovered and stand out in the filtered image. To confirm the reality of faint filaments in the filtered image, we have found their counterparts in the unfiltered image. There are a large number of twisted short features associated with HII regions and nonthermal filaments. Our analysis includes the long and short filaments, both of which consist of a mixture of thermal and nonthermal features. The lengths () and mean PAs of the filaments are measured by application of the procedure (Aschwanden, 2010). A detailed account of this procedure will be given elsewhere.
3 Results
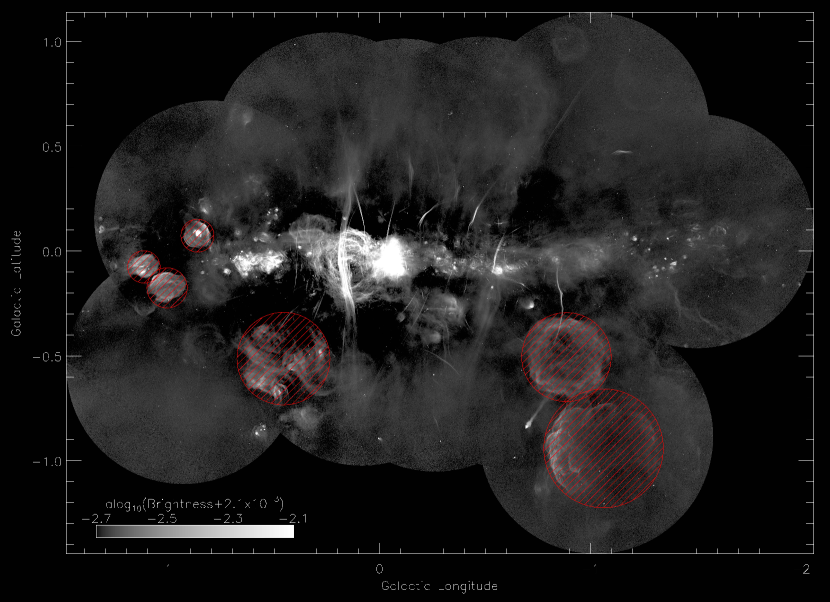
The 4′′-resolution MeerKAT image of the Galactic center is shown in Figure 1a. A filtered image of the same mosaic image is shown in Fig. 1b with a resolution of . SNRs and foreground HII complexes are drawn with red circles on Figures 1a,b. Our analysis excludes these features that would otherwise contaminate our analysis of individual filaments in the Galactic center.
3.1 Filament length as function of the PA
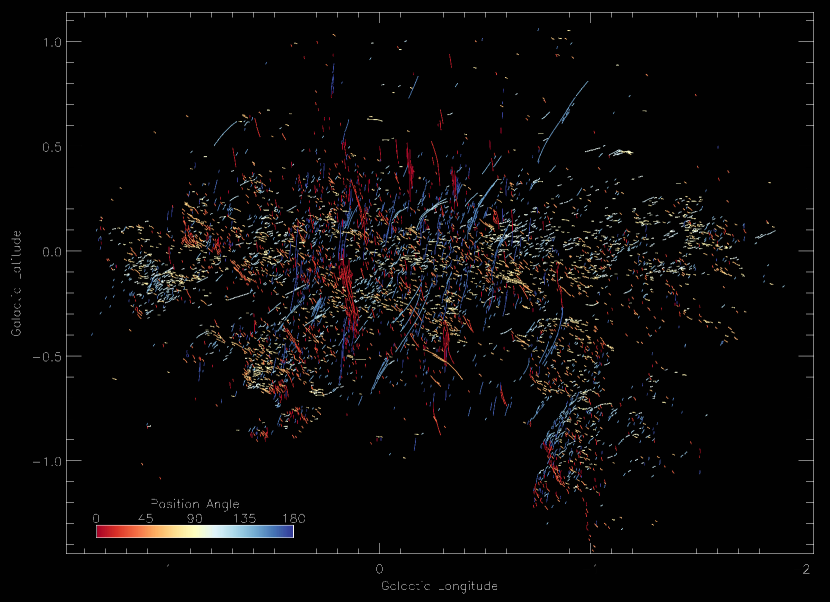
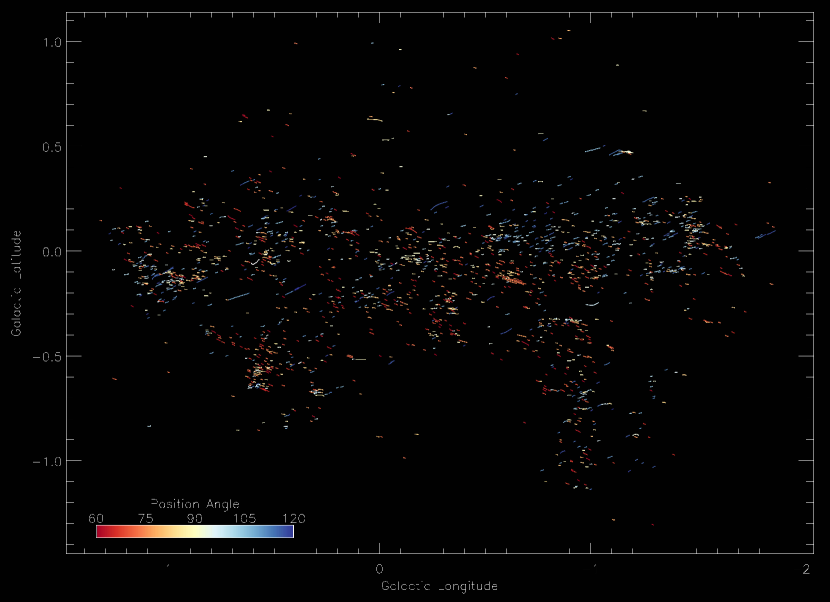
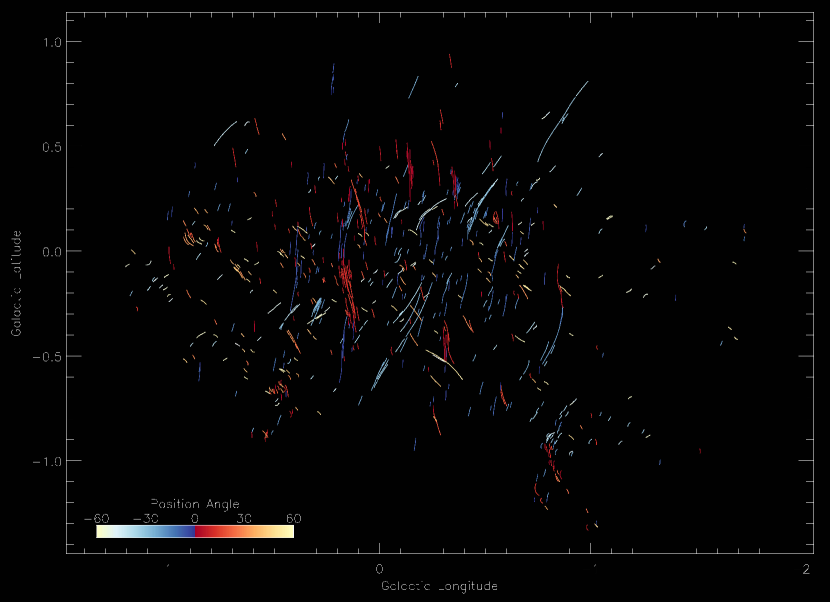
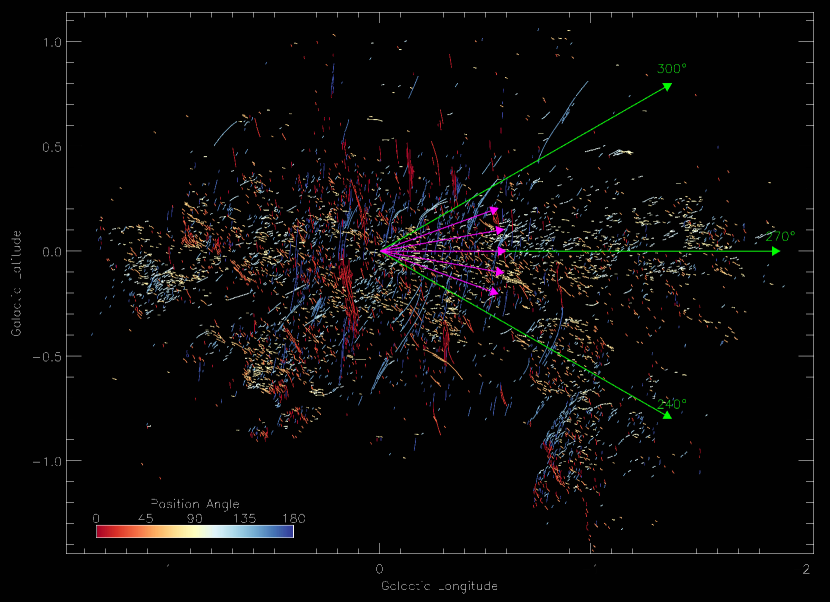
Figure 2 shows three different representations of color-coded identified filaments with different PA ranges with respect to Galactic North (PA=), traced by different color tables. Figure 2a shows the full range of filament PAs between and (or equivalently, to ) with different colors. Color tables are used in order to distinguish between the filaments with positive (red) negative (blue) PAs. The distribution suggests that the filaments oriented perpendicular to the Galactic plane tend to be long. On the other hand, filaments with PAs running parallel to the Galactic plane are short. Figure 2b shows the distribution of short filaments with PAs being preferred along the Galactic plane 60 PA . This distribution is more obvious at negative longitudes where short filaments with PA appear blue and point toward the Galactic center. Figure 2c displays the filaments with PA indicating that vertical filaments are dominated by long filaments at positive and negative latitudes. An extension of the long filaments toward the Galactic plane do not converge toward a single origin such as Sgr A* but to the inner degree of the Galactic center.
3.2 Long filaments PA
Another way to characterize the distribution of filament PAs is by restricting their lengths rather than their PAs, as was described above. There is generally a continuum of filament lengths, and 66′′ was chosen as a lower limit that eliminated most filaments associated with known thermal sources such as HII regions. An even cleaner selection at 132′′ was discussed, but the sample size starts to become small (Yusef-Zadeh et al., 2022a). This convenient division was selected using 60 pixels with a pixel size of 1.1′′ in the original MeerKAT image with a resolution of 4′′ (Yusef-Zadeh et al., 2022a).
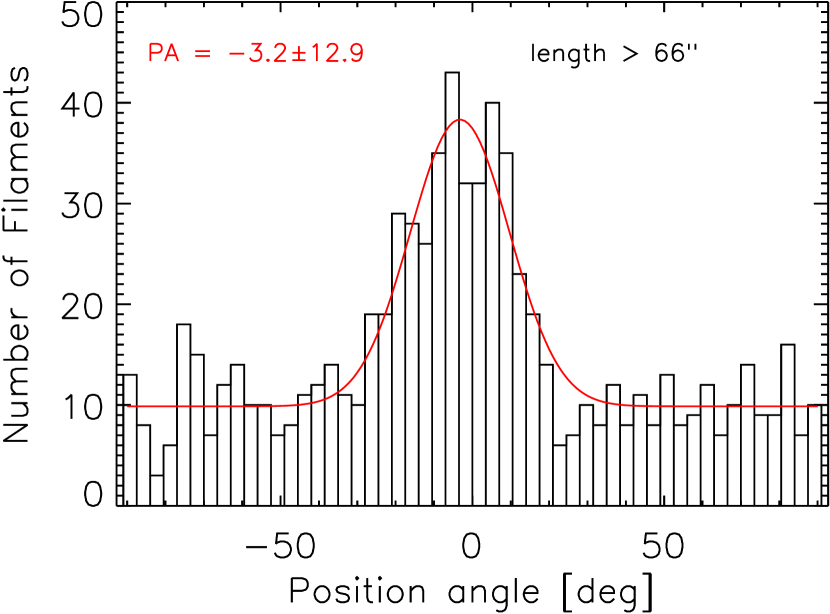
Figure 3a shows a histogram of long filaments with as a function of PA, emphasizing long nonthermal filaments, and largely excluding thermal features. A Gaussian fit to this histogram peaks at -3.2∘ with 1 error of 12.9∘. Figure 3b shows a histogram of long filaments with restricted PAs ranging between and . We note that long filaments have a negative spectral indices the spectral index consistent with being nonthermal. There are also a number of long filaments with . These also are most likely associated with a network of filaments associated with the Radio Arc near , which are known to have a flat spectral index (Yusef-Zadeh et al. (2022a) and references therein).
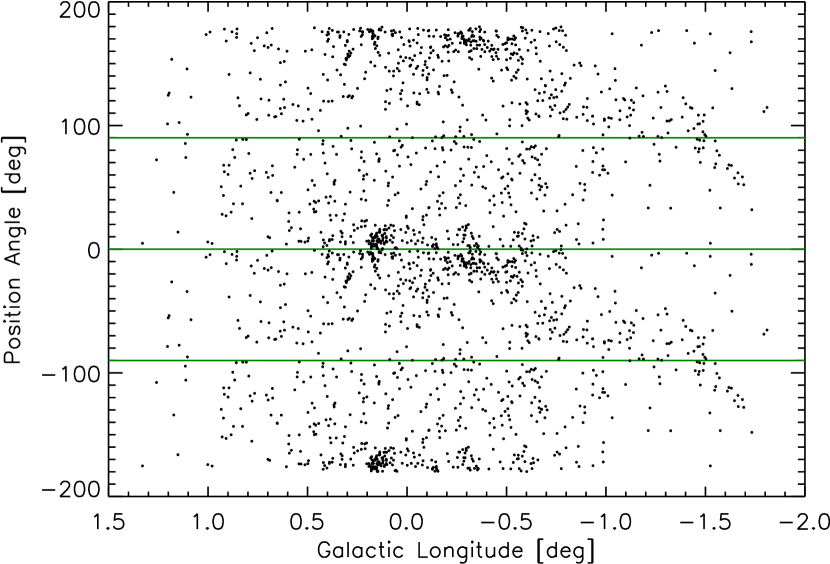
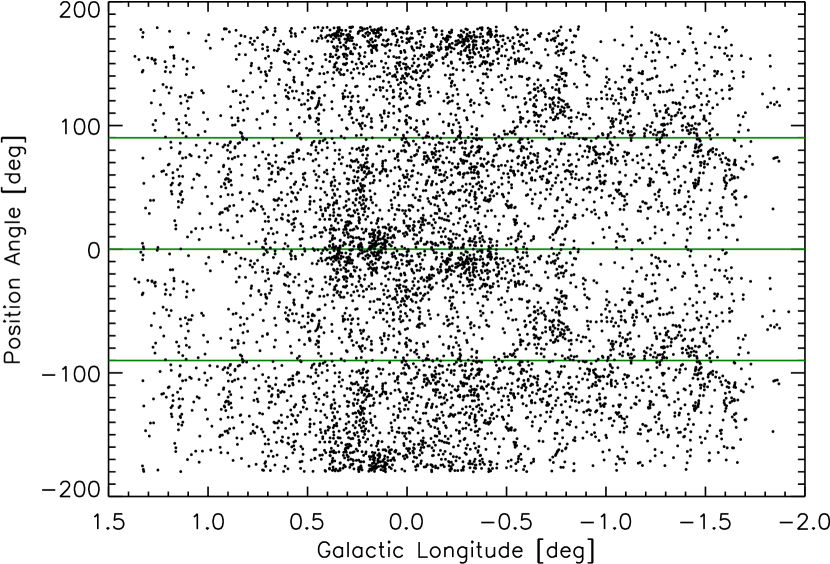
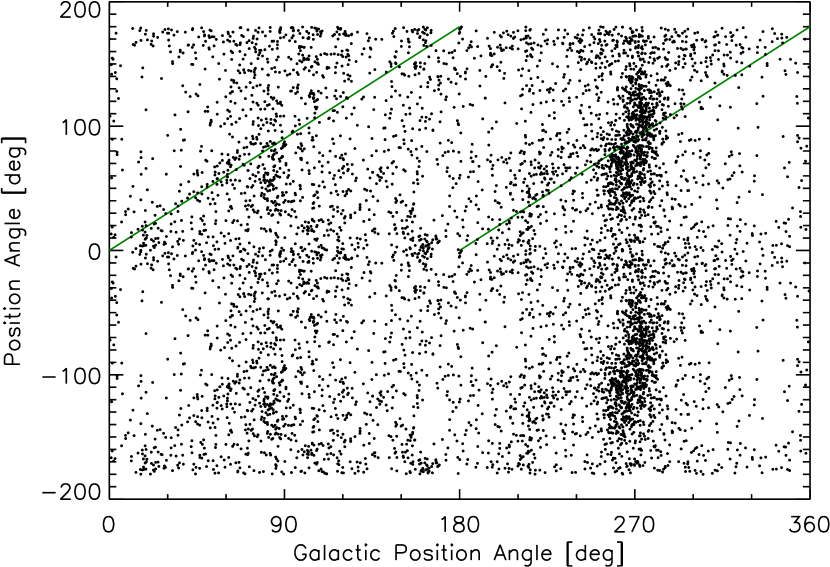
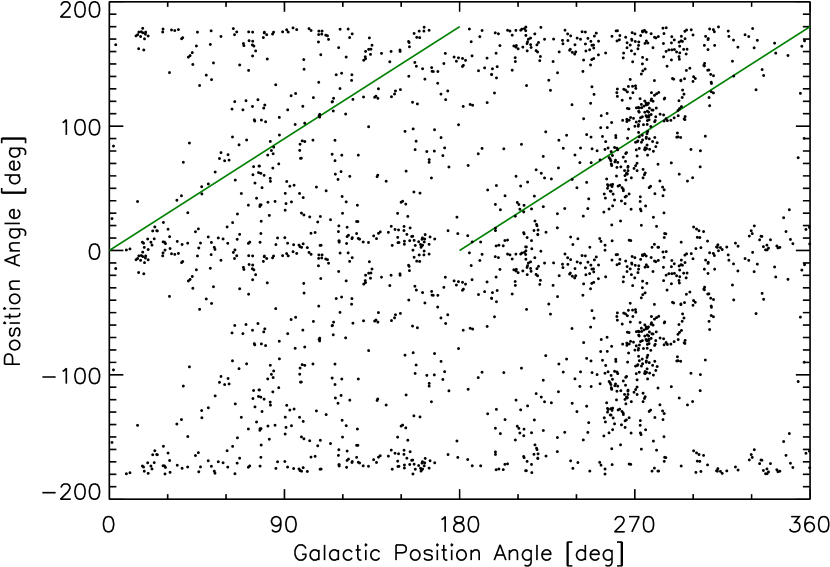
Another view of the PA distribution of the filaments is presented by plotting them as a function of Galactic longitude. The PA distribution of long filaments as a function of Galactic longitude is displayed in Figure 4a whereas the same distribution only for short filaments is shown on Figure 4b. Each black dot represents the PA of a filament. If the filament PAs were randomly distributed, there would not be any concentration. We note a high concentration of PAs in two clusters, one near PA, and the other near PA, . A higher concentration of filaments at is due to a larger number of filaments associated with the radio Arc near . An additional concentration of short filaments is noted near with PAs along the Galactic plane, as demonstrated in Figure 4b.
We also note that similar to Figure 2c, the two concentrations in Figure 4a, show that the PA of the long filaments are tilted away from the Galactic North. We note that at the filament PAs of the concentrations are more widely distributed than those at . Figure 4a shows that within the range , long filaments generally are found with , indicating a vertical orientation. For , the long filaments have random orientations. For , long filaments are loosely clustered around .
3.3 Short filaments PA
One of the most striking aspects of our PA study of the GC filaments is the evidence for a distinct population of filaments with PA close to the Galactic plane. This distribution is orthogonal to the PA distribution of long filaments that are aligned close to the Galactic North-South orientation. Figure 5a shows the PA distribution of short () filaments. The short filament PAs are modulated by two peaks near 70∘ and . The filaments in the peak at PAs with a width of are distributed mainly within of the the Galactic plane whereas the filaments that peak close to PAs are oriented closer to the Galactic North-South direction, having a distribution similar to that of the long filaments. In some cases the filaments can only be reliably traced over partial segments of the filament due to limited S/N and confusion.
Another characteristic that distinguishes short from long filaments is their spectral index. Figure 5b shows a histogram of the spectral indices of short filaments , restricted to angles within of the Galactic plane (). The majority of short filaments have spectral indices consistent with thermal emission, though we can not exclude that they could be nonthermal filaments similar to the filaments of the radio Arc near . This histogram also indicates that some short filaments are nonthermal with a steep spectrum.
The distribution of PAs is also examined as a function of the Galactic Position Angle (GPA) defined as . corresponds to the NE quadrant of the GC, and subsequent intervals are the SE, SW, and NW quadrants. The black points represent the PA of short- and long-identified filaments in Figures 6a,b, respectively. The dark diagonal line shows the expected PA distribution along a radial direction following a PA which is equal to its GPA. Filaments along these lines are oriented radially with respect to the Galactic center.However, we note a concentration of points close to GPA (close to the Galactic plane and W of Sgr A*) along the Galactic plane. There is a tendency that filament PAs in the third GPA and fourth quadrant GPA display horizontal components with PAs and , respectively. This range of filament PAs follow the diagonal line that points in the direction of Sgr A*. The width of the group of filaments following the diagonal line is about 20∘ above and below the Galactic plane. These trends indicate that filaments PAs both N and S of the Galactic plane tend to be slightly more normal (rather the parallel) to the Galactic plane than would be expected for a purely radial distribution of filaments. Figure 6c schematically indicates that this trend could result from a strong radial trend (long magenta arrows). Deviations of filament PAs from radial direction could result from the direction of orbital motion of individual sources when superimposed with radial direction of the outflow.
3.3.1 Short filaments PA in Sgr E
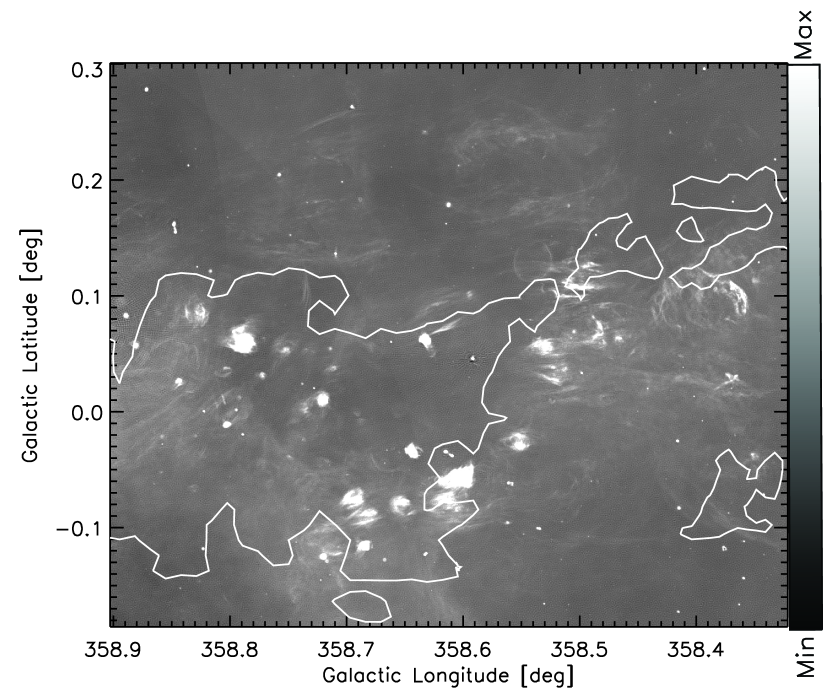
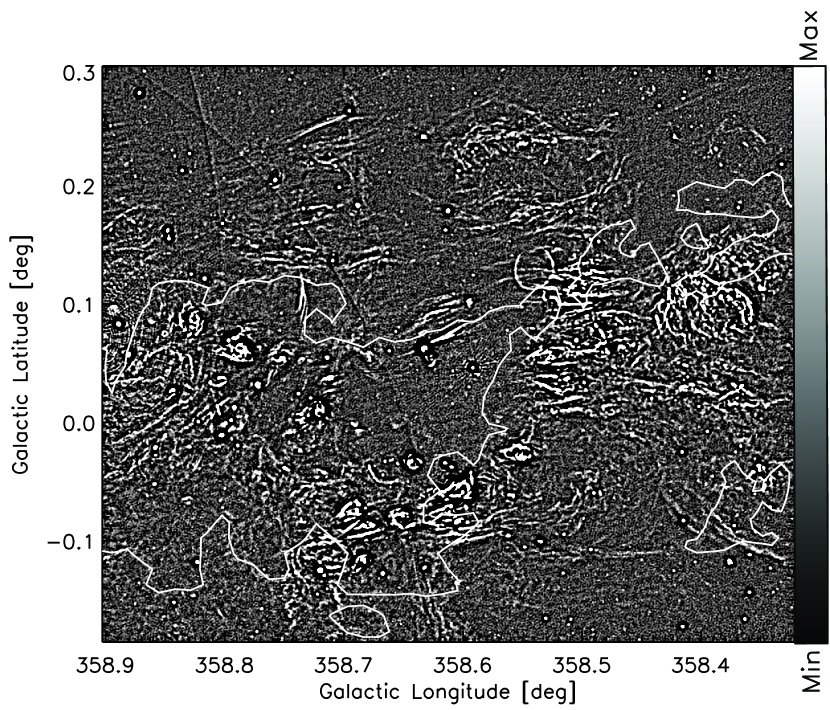
A more detailed representation of the radial distribution of short filament PA pointing toward the Galactic center can be viewed in the spatial distribution of filaments PA in the prominent Sgr E HII complex G358.7-0.0, providing a vivid example of the nearly radial distribution of short filaments. This star forming cloud contains a number of discrete HII regions which have been imaged using the VLA, GBT and MeerKAT (Gray et al., 1993; Gray, 1994; Cram et al., 1996; Yusef-Zadeh, Hewitt, & Cotton, 2004; Law et al., 2008). Figure 7a displays an unfiltered 20cm continuum MeerKAT image of the Sgr E discrete HII regions distributed around the southern half of a 0.4∘ ring-shaped structure (Yusef-Zadeh, Hewitt, & Cotton, 2004). The northern half of Sgr E is dominated by extended diffuse emission. Some filamentary features in Sgr E appear to be correlated with structure in IR emission. There is no correlation in structure between traditional nonthermal radio filaments and IR emission. This is one reason that we argued that short filaments could be thermal.
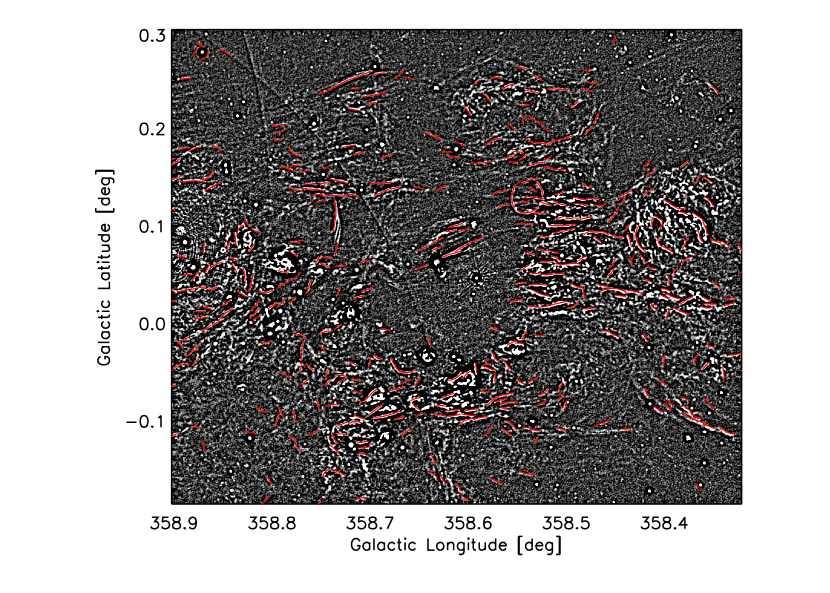
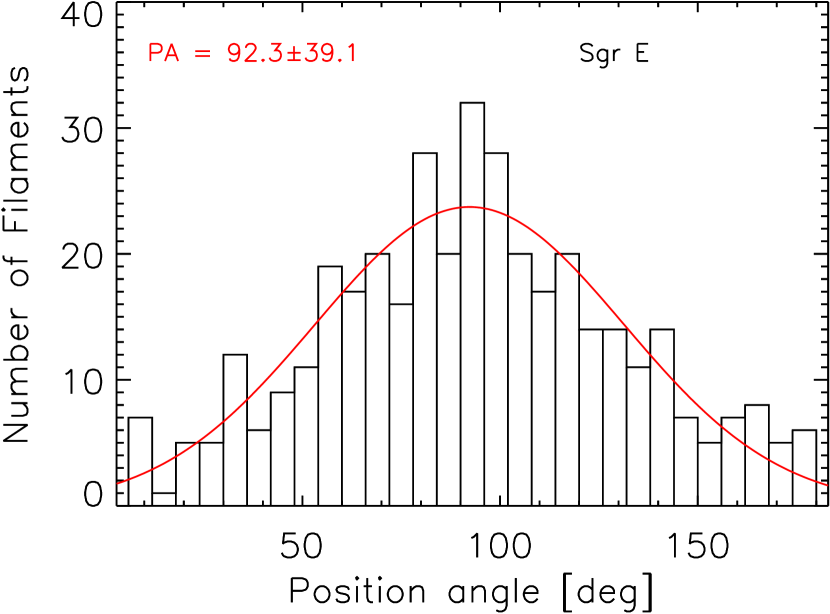
Figure 7b is similar to 7a except that a filtered image more clearly shows the large number of filamentary features. The white contour shows the outer boundary of 13CO (2-1) emission from the Sgr E cloud with a mass of 3 (Anderson et al., 2020). The 13CO mean velocity is km s-1 in the southeast, becoming more negative to –220 km s-1 toward northwest (Anderson et al., 2020). The identification of specific filaments with measured PAs are indicated by red lines in Figure 7c. The histogram of of PAs of these filaments in Sgr E, as shown in Figure 7d, indicates that filament PAs peak near PA within , as the Gaussian fit (red) shows. The PA distribution in Sgr E is consistent with larger-scale distribution of filament PAs at negative Galactic longitudes, thus implying that the same mechanism is responsible for the origin of the filaments on this smaller, sub-degree scale.
This pattern of radial structure close to the Galactic plane is seen on even small scale observations of some of the compact molecular clouds in the region. Recent ALMA observations of CO associated with the Sgr E complex finds two molecular filaments running close to the Galactic plane within ALMA’s 52′′ field of view. These molecular filaments have an aspect ratio of to 1 and show alignment within 2∘ of the Galactic plane (Wallace et al., 2022) appear to align radially toward the Galactic center. The origin of this filamentary structure is suggested to be due to stretching of the Sgr E cloud by the gravitational field of the Galactic bar potential. The PAs of the CO filaments resemble those found in our radio continuum study, so it is possible that they are produced by the mechanism responsible for aligning the radio filaments. MeerKAT radio image shows a short filament G358.712+0.027 with an extent of and a position angle of (a deviation of from a radial orientation), possibly associated with the molecular filament.
Figures 7a,b also display a broadly triangular dark feature bounded by the lines of H II regions on the SE and SW, and also the CO contours on the SW and N. The mean brightness of 47 Jy beam-1, corresponding to brightness temperature of K, coincident with contours of molecular CO in the southern half of the ring-shaped structure. To examine if this dark feature is real, we examined radio continuum image of the Galactic center at 8 GHz observed with the GBT (Law et al., 2008). The dark feature is clearly seen toward the Sgr E cloud and the estimated brightness temperature toward the cloud, Jy beam-1, is a factor of 2 lower than the background diffuse emission. The deficit of mJy per GBT beam is equivalent to an emission measure drop of for a line of sight through the radio-dark cloud. Adopting a pathlength through the cloud, equivalent to 0.1∘ at 8 kpc, we find an equivalent electron density deficit . Making the reasonable assumption that the scale of external ionized medium has similar path length, it provides a rough estimate of the density of the external ionized medium surrounding the cloud.
The dark feature in the continuum MeerKAT and GBT images is anti-correlated with the Sgr E CO cloud. This dark feature shows similar appearance to many Galactic center molecular clouds that have been identified as Radio Dark Clouds (RDCs) (Yusef-Zadeh, 2012). We interpret that the dark feature in Sgr E surrounded by compact HII regions is produced by a deficiency in radio continuum emission from molecular clouds that are embedded in a bath of UV radiation. The deficit of the continuum emission from the volume occupied by molecular gas results in dark features that trace embedded molecular clouds.
4 Discussion
Our analysis of the Galactic center filaments PA distribution indicate two different filament populations. The PAs of the long and short filaments tend to lie in the directions perpendicular and parallel to the Galactic plane, respectively. The vertical and horizontal filaments are characterized to have nonthermal and thermal properties (Yusef-Zadeh et al., 2022a), respectively, based on their spectral indices. While there is clearly an overlap in their properties (e.g., PA, spectral index) a key question is the origin of the bimodal PA distribution of Galactic center filaments.
4.1 Vertical Population of Galactic center filaments PA
One population of filaments has orientations that are vertical to within of the Galactic North. The negative and positive PAs tend to be found in positive and negative Galactic longitudes, respectively. There is slightly reduced number of filaments at PAs, giving roughly a bimodal distribution in the histogram. We also note that vertical filaments dominated by long filaments have nonthermal spectra. Considering global distribution of vertical filament PAs, there is no evidence that extension of all filaments PA converge toward Sgr A* or any other compact sources. This suggests that the creation of roughly symmetric PA distribution is in the Galactic plane within a degree of Sgr A*. This is consistent with a trend noticed in the spectral index of nonthermal filaments as they become steeper with increasing absolute Galactic latitude (Yusef-Zadeh et al., 2022a). If synchrotron aging is responsible for the steepening the spectrum, it implies that the vertical filaments are powered in the Galactic plane (Yusef-Zadeh et al., 2022a).
A scenario for the creation of nonthermal radio filaments uses the high cosmic ray pressure in the Galactic center estimated from H measurements (e.g. Geballe, et al., 1999; Oka, et al., 2005; Oka & Geballe, 2020). This extreme pressure drives a large-scale wind away from the Galactic plane creating the bipolar X-ray and radio emission (Heywood, et al., 2019; Ponti et al., 2019; Yusef-Zadeh & Wardle, 2019). The non-thermal radio filaments result from the interaction of the large-scale wind and obstacles embedded within the flow creating the filaments by wrapping of the wind’s magnetic field around the obstacles (Yusef-Zadeh & Wardle, 2019). However, there are alternate models explaining the origin of the vertical filaments (see (Yusef-Zadeh et al., 2022a; Sofue, 2023) and references therein). This begs the question of the origin of the high cosmic-ray pressure which is usually attributed to the explosive event a few million years ago that created Fermi bubbles and the bipolar X-ray and radio emission (Heywood, et al., 2019; Ponti et al., 2019; Yusef-Zadeh & Wardle, 2019).
4.2 Radial population of filaments PA in the Galactic plane
The most interesting result of our study is the discovery of a new population of short filaments’ PAs that are found along the Galactic plane only at . There is statistical evidence that short filaments PA point toward Sgr A* with the cone in which the filaments are found has FWHM, but the deviations of filament directions from radial is much broader, over a large scale of pc from Sgr A* at . This large-scale anisotropy in the filaments PA is interpreted in the context of a large-scale collimated outflow from Sgr A* along the plane. A wind- or jet-driven outflow from Sgr A* has been suggested to explain evidence for outflow in the plane of the Galaxy within few arcminutes of Sgr A*.
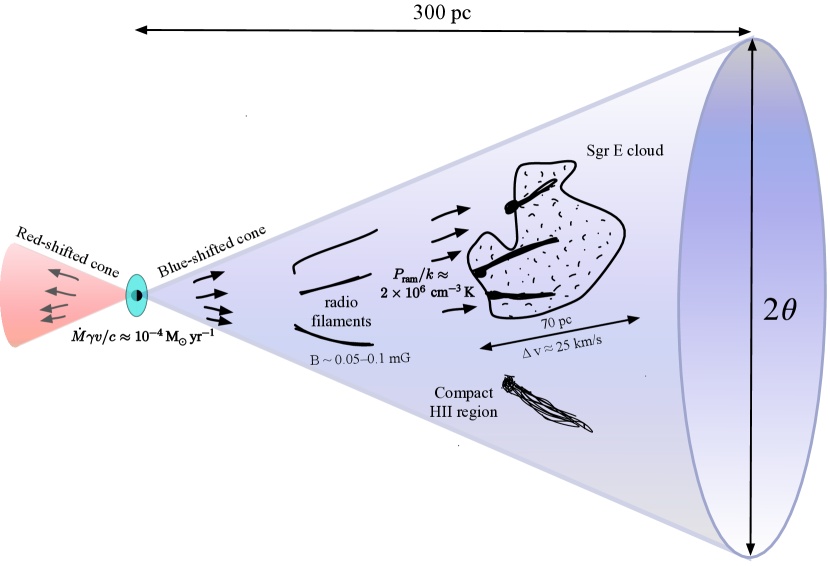
There are eight different spectroscopic, polarimetric and broad-band continuum measurements over a wide range of angular scales extending from to 25 pc from Sgr A* have inferred a jet-driven outflow along the Galactic plane (see Yusef-Zadeh et al. (2012, 2020) and references therein). In this picture the jet emerges perpendicular to the equatorial plane of the accretion flow and is aligned roughly E-W in Galactic coordinates. A schematic diagram in Figure 8 showing the interaction of the outflow from Sgr A* with filaments, ionized and molecular gas being aligned along roughly along the Galactic flow. For example, blue- and red-shifted features in radio recombination line observations on a scale within 14′′ (0.56 pc) of Sgr A* invoke an interpretation in terms of the interaction of a collimated outflow driven outflow from Sgr A* along of the Galactic plane (Royster et al., 2019). In this picture, the blue-shifted arm of the jet emerges to the west of Sgr A* making an angle to the line of sight.
This small-scale geometry of the jet is consistent with our analysis of filaments PA if the two opposing cones of outflowing material are extrapolated to a scale of 300 pc. Thus, the blue-shifted component of the jet projected along negative longitudes and is tilted toward us with respect the line of sight whereas the red-shifted component is tilted away from the line of sight projected toward the positive longitudes. However, there is a lack of strong radial filament PAs at positive longitudes in the direction away from the line of sight. This could be explained by confusion due to crowding of radio continuum features in the inner Galaxy.
Velocity profiles of H and CO lines toward the Galactic center indicate diffuse gas in the CMZ is expanding radially at a velocity of 150 km s-1(Oka & Geballe, 2020). This expanding radial outflow could originate from the jet interacting with molecular gas in the CMZ, as described below. The geometry of the biconical outflow implies that the locations of Sgr B2 and Sgr E are on the back and fronts sides of Sgr A* (see below). The jet picture quantified below can also be applied to molecular filaments running parallel to the Galactic plane in Sgr E (Wallace et al., 2022) (see Fig. 8). An alternative suggestion that has been put forth is that stretching of molecular gas in Sgr E is due to its motion along orbits. The Sgr E complex lies at the intersection of CMZ and the Galactic dust lane, so it is possible that the gravitational potential of the bar is responsible for stretching the Sgr E cloud into filaments (Wallace et al., 2022). This suggestion is based on limited ALMA observations over a small region showing CO filaments on a length scale of 2pc. It is not clear if this suggestion can explain the radial distribution of filament PAs pointing toward Sgr A* on a scale of 300 pc.
4.3 A Model of an outflow from Sgr A* along the Galactic plane
We consider a model in which Sgr A* is the source of an outflow that has sufficient ram pressure to distort and stretch thermal, and nonthermal materials that are embedded within the outflow. In this picture, the outflow has mass loss rate , velocity , Lorentz factor and is assumed to be directed into opposing cones, each with half-opening angle (see Figure 8 for a schematic diagram). The outflow delivers momentum at rate into solid angle . The ram pressure within an outflow cone at distance from Sgr A* is , i.e.
| (1) |
Adopting nominal values M⊙ yr-1, and consistent with outflow parameters invoked on smaller scales (Yusef-Zadeh et al., 2012; Royster et al., 2019; Yusef-Zadeh et al., 2020), we find that the ram pressure within the cones is cm-3 K at pc. In order for the outflow to align nonthermal radio filaments with the outflow direction, the ram pressure must exceed the internal filament pressure. Assuming that the magnetic field BG, the mass outflow rate has to exceed M⊙ yr-1.
There are also ionized and molecular clouds, such as the Sgr E complex, that are embedded within the outflow. To estimate the velocity gradient that this outflow might induce in an embedded or partially embedded cloud, we note that cloud material with surface density experiences acceleration . From a standing start, the velocity acquired after being accelerated through distance is . Clouds typically exhibit order-unity surface density variations, so the difference in the ram-pressure induced velocity across the cloud is of order , and we write (see Fig. 8).
We now apply this scenario to the Sgr A E cloud, which exhibits km s-1 over a scale of 0.5 degrees (Anderson et al., 2020, see their Fig 10), ie pc at 8 kpc. We use the outflow parameters adopted above, M⊙ yr-1. The mean integrated 13CO 2-1 line intensity is 17 K km s-1(Anderson et al., 2020), and using cm-2 (K km s-1)-1 (Schuller et al., 2017), we obtain a hydrogen column and compute the clouds surface density using . Then we find that the acceleration , yielding km s-1, consistent with the observed velocity gradient. The time scale needed to accelerate the material in this scenario is Myr, places a lower limit on the age of the outflow.
One advantage of this model is that the large-scale jet-driven outflow is consistent with a picture that has independently suggested to explain multiple observations at small scales from to 25pc from Sgr A* where a relativistic jet had previously been proposed (see Yusef-Zadeh et al. (2012); Royster et al. (2019); Yusef-Zadeh et al. (2020) and references therein).
5 Conclusion
In summary, we have presented an analysis of the position angle distribution of the entire system of thermal and nonthermal radio filaments in the Galactic center. We use filtered MeerKAT images to determine the position angle distributions of the population of nonthermal and thermal radio filaments. We noted alignment of filament directions within 20∘ of the Galactic plane that that suggested a scenario in which a collimated outflow from Sgr A* in the direction along the Galactic plane. The inferred jet is estimated to have a a mass flow rate of yr-1 in order to align nonthermal radio filaments and accelerate thermal gas along the Galactic plane. This outflow emerges perpendicular to the equatorial plane of the accretion flow of Sgr A* and runs along the Galactic plane. The opening angle of the outflow is estimated to be with respect to the Galactic plane where the relativistic jet lies, and the age of the outflow is at least 6 Myr.
References
- Anderson et al. (2020) Anderson L. D., Sormani M. C., Ginsburg A., Glover S. C. O., Heywood I., Rammala I., Schuller F., et al., 2020, ApJ, 901, 51. doi:10.3847/1538-4357/abadf6
- Arendt et al. (2019) Arendt R. G., Staguhn J., Dwek E., Morris M. R., Yusef-Zad eh F., Benford D. J., Kovács A., et al., 2019, ApJ, 885, 71. doi:10.3847/1538-4357/ab451c
- Aschwanden (2010) Aschwanden M. J., 2010, SoPh, 262, 399
- Bally & Yusef-Zadeh (1989) Bally J., Yusef-Zadeh F., 1989, ApJ, 336, 173. doi:10.1086/167003
- Condon et al. (2021) Condon J. J., Cotton W. D., White S. V., Legodi S., Goedhart S., McAlpine K., Ratcliffe S. M., et al., 2021, ApJ, 917, 18. doi:10.3847/1538-4357/ac0880
- Cram et al. (1996) Cram L. E., Claussen M. J., Beasley A. J., Gray A. D., Goss W. M., 1996, MNRAS, 280, 1110. doi:10.1093/mnras/280.4.1110
- Geballe, et al. (1999) Geballe T. R., McCall B. J., Hinkle K. H., Oka T., 1999, ApJ, 510, 251
- Gray et al. (1993) Gray A. D., Whiteoak J. B. Z., Cram L. E., Goss W. M., 1993, MNRAS, 264, 678. doi:10.1093/mnras/264.3.678
- Gray, et al. (1991) Gray A. D., Cram L. E., Ekers R. D., Goss W. M., 1991, Natur, 353, 237
- Gray (1994) Gray A. D., 1994, MNRAS, 270, 822 doi:10.1093/mnras/270.4.822
- Heywood, et al. (2019) Heywood I. et al. 2019, Nature, 10.1038
- Heywood et al. (2022) Heywood I., Rammala I., Camilo F., Cotton W. D., Yusef-Zadeh F., Abbott T. D., Adam R. M., et al., 2022, ApJ, 925, 165. doi:10.3847/1538-4357/ac449a
- Lang et al. (1999) Lang C. C., Anantharamaiah K. R., Kassim N. E., Lazio T. J. W., 1999, ApJL, 521, L41. doi:10.1086/312180
- LaRosa et al. (2005) LaRosa T. N., Brogan C. L., Shore S. N., Lazio T. J., Kassim N. E., Nord M. E., 2005, ApJL, 626, L23. doi:10.1086/431647
- Law, Yusef-Zadeh & Cotton (2008) Law C. J., Yusef-Zadeh F., Cotton W. D., 2008, ApJS, 177, 515
- Law et al. (2008) Law C. J., Yusef-Zadeh F., Cotton W. D., Maddalena R. J., 2008b, ApJS, 177, 255. doi:10.1086/533587
- Liszt (1985) Liszt H. S., 1985, ApJ, 293, L65
- Lu, Wang & Lang (2003) Lu F. J., Wang Q. D., Lang C. C., 2003, AJ, 126, 319
- Nord et al. (2004) Nord M. E., Lazio T. J. W., Kassim N. E., Hyman S. D., LaRosa T. N., Brogan C. L., Duric N., 2004, AJ, 128, 1646.
- Oka, et al. (2005) Oka T., Geballe T. R., Goto M., Usuda T., McCall B. J., 2005, ApJ, 632, 882
- Oka & Geballe (2020) Oka T., Geballe T. R., 2020, ApJ, 902, 9. doi:10.3847/1538-4357/abb1b5
- Ponti et al. (2019) Ponti, G., Hofmann, F., Churazov, E., et al. 2019, Nature, 567, 347
- Pound & Yusef-Zadeh (2018) Pound M. W., Yusef-Zadeh F., 2018, MNRAS, 473, 2899. doi:10.1093/mnras/stx2490
- Ramatsoku et al. (2020) Ramatsoku M., Murgia M., Vacca V., Serra P., Makhathini S., Govoni F., Smirnov O., et al., 2020, A&A, 636, L1. doi:10.1051/0004-6361/202037800y
- Reich et al. (2000) Reich, W., Sofue, Y., & Matsuo, H. 2000, PASJ, 52, 355. doi:10.1093/pasj/52.2.355
- Royster et al. (2019) Royster M. J., Yusef-Zadeh F., Wardle M., Kunneriath D., Cotton W., Roberts D. A., 2019, ApJ, 872, 2. doi:10.3847/1538-4357/aafd38
- Rudnick et al. (2022) Rudnick L., Brüggen M., Brunetti G., Cotton W. D., Forman W., Jones T. W., Nolting C., et al., 2022, ApJ, 935, 168. doi:10.3847/1538-4357/ac7c76
- Sakano, et al. (2003) Sakano M., Warwick R. S., Decourchelle A., Predehl P., 2003, MNRAS, 340, 747
- Schuller et al. (2017) Schuller F., Csengeri T., Urquhart J. S., Duarte-Cabral A., Barnes P. J., Giannetti A., Hernandez A. K., et al., 2017, A&A, 601, A124. doi:10.1051/0004-6361/201628933
- Shimwell et al. (2016) Shimwell T. W., Luckin J., Brüggen M., Brunetti G., Intema H. T., Owers M. S., Röttgering H. J. A., et al., 2016, MNRAS, 459, 277. doi:10.1093/mnras/stw661
- Sofue, Murata, & Reich (1992) Sofue Y., Murata Y., Reich W., 1992, PASJ, 44, 367
- Staguhn et al. (2019) Staguhn J., Arendt R. G., Dwek E., Morris M. R., Yusef-Z adeh F., Benford D. J., Kovács A., et al., 2019, ApJ, 885, 72. doi:10.3847/1538-4357/ab451b
- Sofue (2023) Sofue Y., 2023, MNRAS, 518, 6273. doi:10.1093/mnras/stac3137
- Wallace et al. (2022) Wallace J., Battersby C., Mills E. A. C., Henshaw J. D., Sormani M. C., Ginsburg A., Barnes A. T., et al., 2022, ApJ, 939, 58. doi:10.3847/1538-4357/ac951a
- Yusef-Zadeh (2012) Yusef-Zadeh F., 2012, ApJL, 759, L11. doi:10.1088/2041-8205/759/1/L11
- Yusef-Zadeh et al. (2012) Yusef-Zadeh F., Arendt R., Bushouse H., Cotton W., Haggard D., Pound M. W., Roberts D. A., et al., 2012, ApJL, 758, L11. doi:10.1088/2041-8205/758/1/L11
- Yusef-Zadeh et al. (2022a) Yusef-Zadeh F., Arendt R. G., Wardle M., Heywood I., Cotton W., Camilo F., 2022a, ApJL, 925, L18. doi:10.3847/2041-8213/ac4802
- Yusef-Zadeh et al. (2022b) Yusef-Zadeh F., Arendt R. G., Wardle M., Boldyrev S., Heywood I., Cotton W., Camilo F.,2022b, MNRAS, 515, 3059. doi:10.1093/mnras/stac1696
- Yusef-Zadeh et al. (2022c) Yusef-Zadeh F., Arendt R. G., Wardle M., Heywood I., Cotton W., 2022c, MNRAS, 517, 294. doi:10.1093/mnras/stac2415
- Yusef-Zadeh, Arendt, & Wardle (2022d) Yusef-Zadeh F., Arendt R. G., Wardle M., 2022d, ApJL, 939, L21. doi:10.3847/2041-8213/ac982a
- Yusef-Zadeh, Hewitt, & Cotton (2004) Yusef-Zadeh F., Hewitt J. W., Cotton W., 2004, ApJS, 155, 421. doi:10.1086/425257
- Yusef-Zadeh, Morris & Chance (1984) Yusef-Zadeh F., Morris M., Chance D., 1984, Natur, 310, 557
- Yusef-Zadeh et al. (2020) Yusef-Zadeh F., Royster M., Wardle M., Cotton W., Kunneriath D., Heywood I., Michail J., 2020, MNRAS, 499, 3909. doi:10.1093/mnras/staa2399
- Yusef-Zadeh & Wardle (2019) Yusef-Zadeh F., Wardle M., 2019, MNRAS, 490, L1
- Yusef-Zadeh, et al. (2005) Yusef-Zadeh F., Wardle M., Muno M., Law C., Pound M., 2005, AdSpR, 35, 1074
- Yusef-Zadeh et al. (2021) Yusef-Zadeh F., Wardle M., Heinke C., Heywood I., Arendt R., Royster M., Cotton W., et al., 2021, MNRAS, 500, 3142. doi:10.1093/mnras/staa3257
- Zhang, et al. (2020) Zhang S., et al., 2020, ApJ, 893, 3
- Zhang, et al. (2014) Zhang S., et al., 2014, ApJ, 784, 6