The Supersonic Project: Star Formation in Early Star Clusters without Dark Matter
Abstract
The formation mechanism of globular clusters (GCs) has long been debated by astronomers. It was recently proposed that Supersonically Induced Gas Objects (SIGOs)–which formed in the early Universe due to the supersonic relative motion of baryons and dark matter at recombination–could be the progenitors of early globular clusters. In order to become GCs, SIGOs must form stars relatively efficiently despite forming outside of dark matter halos. We investigate the potential for star formation in SIGOs using cosmological hydrodynamic simulations, including the aforementioned relative motions of baryons and dark matter, molecular hydrogen cooling in primordial gas clouds, and explicit star formation. We find that SIGOs do form stars and that the nascent star clusters formed through this process are accreted by dark matter halos on short timescales ( a few hundred Myr). Thus, SIGOs may be found as intact substructures within these halos, analogous to many present-day GCs. From this result, we conclude that SIGOs are capable of forming star clusters with similar properties to globular clusters in the early Universe and we discuss their detectablity by upcoming JWST surveys.
1 Introduction
Globular clusters (GCs) are very old ( Gyr, Trenti et al., 2015) and dense structures whose formation mechanism has long been debated (see e.g., Gunn, 1980; Peebles, 1984; Ashman & Zepf, 1992; Harris & Pudritz, 1994; Kravtsov & Gnedin, 2005; Mashchenko & Sills, 2005; Saitoh et al., 2006; Gray & Scannapieco, 2011; Bekki & Yong, 2012; Kruijssen, 2015; Mandelker et al., 2018). Observations indicate that GCs are likely enriched in baryons relative to the overall Universe (e.g., Heggie & Hut, 1996; Bradford et al., 2011; Conroy et al., 2011; Ibata et al., 2013), and that older GCs possess properties that may distinguish them from younger GCs (see for a review Bastian & Lardo, 2018). These properties create some uncertainty regarding the formation of GCs within the hierarchical picture of structure formation. To address this uncertainty, several formation scenarios have been proposed in the literature.
One such formation mechanism for globular clusters posits that they formed at the high-efficiency end of normal galactic star formation, evolving from particularly dense giant molecular clouds (GMCs) (e.g., Elmegreen & Efremov, 1997; Kravtsov & Gnedin, 2005; Shapiro et al., 2010; Grudić et al., 2022). This is supported by observations of massive young clusters in the merging Antennae system (Whitmore & Schweizer, 1995; Whitmore et al., 1999). This picture is attractive in part because it naturally explains why GCs tend to be very old, from a time in the Universe when these particularly dense GMCs were more common. However, it is not obvious whether the age distribution of GCs from this model is compatible with observations, nor why the GC luminosity function appears similar across environments given this model.
A second theory suggests that GCs form inside DM halos, as suggested by Peebles (1984), which were then stripped by the tidal field of their present-day host galaxies (e.g., Bromm & Clarke, 2002; Mashchenko & Sills, 2005; Saitoh et al., 2006; Bekki & Yong, 2012; van Donkelaar et al., 2023). The primary strength of this theory is its natural connection between the properties (for example, the total mass) of a galaxy’s GCs with its dark matter. It intuitively explains the scaling of these properties with the halo mass, and explains GC ages. However, this theory struggles to explain the observed presence of stellar tidal tails from some GCs, as the extended DM halos this model predicts should help to shield the formed clusters from tidal effects (e.g., Grillmair et al., 1995; Moore, 1996; Odenkirchen et al., 2003; Mashchenko & Sills, 2005).
In this work, we explore star formation within a third formation mechanism for GCs proposed by Naoz & Narayan (2014). In this theory, at the time of recombination, as baryons decoupled from the photon field and cooled, the average sound speed in the Universe dropped precipitously. This drop caused the average relative velocity111Also known as the streaming velocity due to its coherence on few-Mpc scales between baryons and DM in the Universe (about km s-1) to become highly supersonic (Tseliakhovich & Hirata, 2010; Tseliakhovich et al., 2011). Following recombination, in the standard model of structure formation, baryon overdensities began to collapse, driven by existing DM overdensities that by this time were about times larger than baryon overdensities (e.g. Naoz & Barkana, 2005). The significant relative velocity between baryons and DM complicated this process. Naoz & Narayan (2014) showed analytically that a sufficiently large relative velocity between baryons and their parent DM halo would create a spatial offset between the collapsing baryon overdensity and its parent halo. This effect is particularly important to understanding our local Universe, as Uysal & Hartwig (2022) recently estimated that our Local Group formed in a region of the Universe with a high () value of the streaming velocity. In certain instances (especially at high gas masses, such as M M⊙), the spatial offset produced by the effect is smaller than the virial radius of the parent DM halo, leading to an offset between the centers of gas and DM within halos. The resulting objects are known as Dark Matter + Gas Halos Offset by Streaming (DM GHOSTs Williams et al., 2022), and have unique morphological and kinematic properties.
In other instances, especially when M M⊙, the spatial offset between DM and gas within these overdensities is large enough that the baryon overdensity collapses outside the virial radius of its parent halo. Naoz & Narayan (2014) showed that this process would create a gas object with a characteristic mass of – a few M⊙, which would be depleted of dark matter. This would put the formed objects squarely in the mass range of globular clusters, and given their early Universe nature and presumably low metallicities (any metals they have before star formation must originate from pollution from nearby halos), is suggestive of a connection to the low-metallicity sub-population of GCs (Lake et al., 2021). As SIGOs form from pristine gas, this also could lead to star clusters formed partially or entirely of Population III stars. Because our Local Group likely formed in a region with a large streaming velocity, the evolved forms of these objects are theoretically expected to be present in the Milky Way (Uysal & Hartwig, 2022).
Follow-up studies of these objects–known as Supersonically Induced Gas Objects (or SIGOs)–found them in simulations (Popa et al., 2016; Chiou et al., 2018, 2019, 2021; Lake et al., 2021), and predicted distinctive observational signals from these objects (Lake et al., 2021). However, the connection between SIGOs and GCs is still not firmly established and depends in no small part on the star formation efficiency and stellar properties of SIGOs. Work by Nakazato et al. (2022) using hydrodynamic simulations established that SIGOs are indeed capable of forming stars, following one such SIGO in a zoom-in simulation to Jeans collapse and demonstrating that molecular hydrogen cooling is sufficient to form stars in SIGOs. Lake et al. (2023) expanded upon this, providing initial estimates of the abundance of star-forming SIGOs and of the timescales important to their ability to form stars outside of halos. However, this work left open many questions about the properties of star-forming SIGOs, such as the efficiency of star formation in SIGOs that do form stars, and the fraction of SIGOs that form stars at redshifts later than .
When considering star formation in SIGOs, it is vital to consider molecular hydrogen cooling (e.g., Glover, 2013; Schauer et al., 2021; Nakazato et al., 2022). H2 cooling allows the temperature of primordial gas clouds to lower to K, which lowers their Jeans masses to M⊙, potentially allowing these primordial gas clouds to collapse and form stars (Yoshida et al., 2008). With these factors in mind, in the present letter we present the results of a suite of AREPO simulations including the streaming velocity and incorporating molecular hydrogen cooling, with the aim of constraining some of the properties of star-forming SIGOs, including their star-formation efficiency.
This letter is organized as follows: in Section 2 we detail the simulation setup. In Section 3 we discuss the bulk properties of star formation in SIGOs, as well as comparing star formation in SIGOs to more classical star formation within DM halos. Lastly, in Section 5 we summarize our work, as well as discuss avenues for future work to build on these results.
For this work, we have assumed a CDM cosmology with , , , , and .
2 Methodology
We use the moving-mesh code AREPO (Springel, 2010) for our simulations. We present two simulations with a Mpc box size, DM particles with mass M M⊙, and Voronoi mesh cells with gas mass MM⊙, evolved from to . Gas mesh cells in the simulation become eligible for collapse to form stars when their mass exceeds the Jeans mass on the scale of the cell. Subsequently, using the stochastic procedure described in Marinacci et al. (2019), eligible gas cells are converted into star particles on the free-fall timescale. Star particles are implemented as collisionless particles with the mass of the gas cell that gave rise to them.
We use a modified version of CMBFAST (Seljak & Zaldarriaga, 1996) to generate transfer functions for our initial conditions, incorporating first-order scale-dependent temperature fluctuations (Naoz & Barkana, 2005), and the effect of the streaming velocity. Following the methods of Chiou et al. (2019, 2021); Lake et al. (2021); Nakazato et al. (2022); Lake et al. (2023), we generate initial conditions setting . This choice allows us to simulate a rare, overdense region where structure forms early, which increases our statistical power. This environment is similar to those that form galaxy clusters. As discussed in Park et al. (2020), this choice is also similar in effect to increasing the redshift of structure formation compared to the Universe overall by a factor of . We would, for example, expect corresponding structures to those in our simulation at to form in a region with the bulk properties of the Universe at .
We present simulations in this paper, labelled as v and v. We use 2v and 0v here to indicate the stream velocity in the simulation. v simulations use a streaming velocity of = 11.8 km s-1 at the initial redshift , applied as a uniform boost to the x velocity of the baryons, as in Popa et al. (2016). v runs use the same initial conditions, but do not include a streaming velocity.
We use the chemistry and cooling library GRACKLE (Smith et al., 2017; Chiaki & Wise, 2019) to track non-equilibrium chemical reactions and their associated radiative cooling explicitly in the gas. This includes molecular hydrogen and HD cooling, as well as chemistry for 15 primordial species: e-, H, H+, He, He+, He++, H-, H2, H, D, D+, HD, HeH+, D-, and HD+. The cooling rate of molecular hydrogen includes both rotational and vibrational transitions (Chiaki & Wise, 2019).
In this letter, we use the object classifications from Chiou et al. (2018) to identify SIGOs and DM halos. DM halos are identified using an FOF algorithm with a linking length that is 20% of the mean DM particle separation, or about 650 cpc. This algorithm calculates the location and virial radius of DM halos in the simulation output, assuming sphericity for simplicity (although DM halos at these times are distinctly aspherical e.g., Sheth et al., 2001; Lithwick & Dalal, 2011; Vogelsberger & White, 2011; Schneider et al., 2012; Vogelsberger et al., 2020). The same FOF algorithm run on the gas component of the output then allows us to identify gas-primary objects. Star particles are associated with the gas-primary object that their nearest-neighbor gas cell belongs to. We require these objects to contain a minimum of 100 gas cells and star particles to be considered as SIGOs (Chiou et al., 2021).
SIGOs are generally quite elongated in gas streams, so each gas-primary object is next fit to an ellipsoid, by identifying an ellipsoidal surface that encloses every particle in the object (Popa et al., 2016). These ellipsoids are tightened by shrinking their axes by 5% until either the ratio of the axes lengths of the tightened ellipsoid to those of the original ellipsoid is greater than the ratio of the number of gas cells contained in each, or 20% of their particles have been removed, following Popa et al. (2016). We then apply a final filter requiring that SIGOs be located outside the virial radius of all DM objects, and have a gas+stars mass fraction of above 60%, as in Nakazato et al. (2022) and Lake et al. (2023) 222Below the gas+stars mass fraction threshold of %, there are a variety of objects falsely identified by the FOF as SIGOs outside of halos in the no-streaming-velocity case (which may be nuclear star clusters, or compact gas objects in extended halos). At and above this threshold, many objects present in the run with the streaming velocity but absent in the run without it (true SIGOs) are removed, but very few objects falsely identified as SIGOs remain to be removed in the no-streaming-velocity run, as shown by Lake et al. (2023).. This limits false detections of SIGOs, as the filamentary nature of gas in runs with molecular hydrogen cooling enabled tends to result in the misidentification of SIGOs with a lower gas+stars fraction.
3 Star Cluster Formation in SIGOs
In the classical description of structure formation (i.e., no streaming velocity) stars often form inside, and at the centers of, DM halos (e.g., Tegmark et al., 1997). However, the streaming velocity acts to separate gas and eventually stars from the centers of these halos (e.g., Tseliakhovich & Hirata, 2010; Williams et al., 2022). In Lake et al. (2023), we suggested that it may be straightforward for SIGOs to form stars. In this section, we analyze the evolution of a characteristic SIGO as it becomes a star cluster in the early Universe (z).
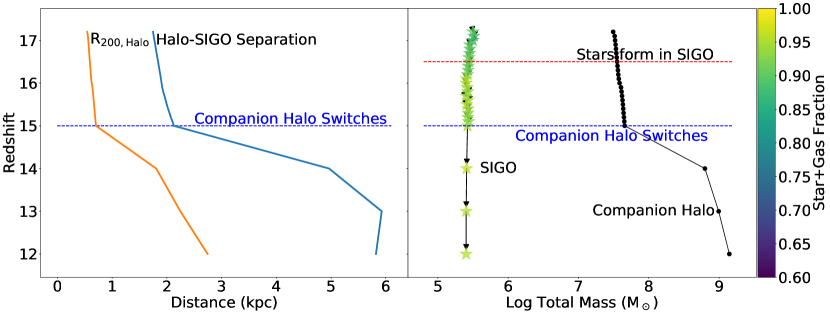
Figure 1 shows this SIGO at the redshift () of its peak star formation in the two runs, i.e., the streaming velocity run (v, middle and right panels) and the no streaming velocity run (v, left panel) at . As shown, the SIGO is not present in the run without streaming velocity (v, left panel). While a small gas overdensity is present near the top left of the frame, it is associated with a DM overdensity missed by the FOF and the baryon fraction within 0.15 kpc of the center of the gas overdensity is , confirming that it is not a spurious object related to the SIGO. At all snapshots before and during star formation in the streaming velocity runs, the SIGO contains less than the mean DM density. The SIGO begins forming stars at in run v.
As depicted in Figure 1, the predominant DM halos exist in both runs. However, as mentioned, the SIGO only exists in the presence of the streaming velocity and is embedded in the gas stream (e.g., Nakazato et al., 2022; Lake et al., 2023; Williams et al., 2022). The SIGO in Figure 1 contains M⊙ of stars in run v at . It is also apparent that the gas is shifted between the left and middle panels, similarly as noted by Nakazato et al. (2022) and Williams et al. (2022).
The SIGO’s mass evolution can be seen in the right panel of Figure 2, and its surface density evolution is shown in Figure 3 in context. In Figure 2, the example SIGO (yellow-green star in the right panel) is associated with progressively larger nearby halos (in black), as the halos undergo a process of hierarchical mergers and accretion. The companion halo, defined as the nearest halo to the SIGO as a function of the halo’s , changes just after , marked in the Figure with a blue horizontal line. The SIGO’s mass is comprised of both gas and stars and is only slightly shrinking, due to the loss of some gas (likely due to -body interactions between particles at our simulation’s limited resolution, e.g. Lake et al., 2023). We note that the stars and gas are gravitationally bound.
The left panel of Figure 2 shows the evolution of the physical separation between the centers of mass of the SIGO and its companion halos (in blue), as well as the evolution of the of the SIGO’s companion halos, defined as the radius around the halo that encloses times the critical density of the Universe. As one can see, the SIGO is slightly drifting away from its first companion halo at and before , but the SIGO begins to fall into its second, much larger (and growing) companion halo by redshift . At , the SIGO is outside this halo at a center-of-mass separation , or about kpc.
The SIGO and companion DM halos’ evolutionary processes are visualized in the left column of Figure 3, which shows physical kpc boxes, left column, and a zoomed-in region ( pc) in the right column. The different rows show three redshifts: , and . As shown in this Figure, the nearby large DM halo at is in the process of merging with a larger DM halo located at the right top corner of the image. This tidally separates the SIGO from the nearby DM halo: we see this DM halo slightly further away from the SIGO at . This process may give the SIGO more time to cool and form stars outside of the halo before accretion, as well as limiting tidal forces from the halo on this SIGO. Stars start forming at (see Figure 2), when the central pc has a gas surface density of about M⊙ pc-2. Significantly, tidal forces on this SIGO from its companion halo at this time are more than an order of magnitude smaller than the forces of self-gravity within this SIGO, allowing this SIGO’s collapse to occur mostly unaffected by tides (e.g. Jog, 2013). These results are subject to the exact configuration of a SIGO, and it may be possible that tides impact the collapse of other SIGOs, though that is beyond the scope of this paper.
Subsequently, the halo is accreted onto another nearby protogalaxy (also referred to as the second companion halo), soon after z=. In the bottom panel of Figure 3, the star cluster is located just outside of this large protogalaxy but has remained intact with the longest axis radius (from an ellipsoid fit) on the order of pc, and shortest axis of pc. This nascent star cluster is comprised in its entirety of stars that originated within the SIGO, and is now gravitationally bound to the M⊙ (total mass) protogalaxy, which also has stars of its own. The star cluster contains no dark matter and has a stellar mass of M⊙. We subsequently refer to this as a globular-cluster-like object.
In order to answer whether the SIGO is expected to be hosted by the protogalaxy, we ran a two-body simulation of the subsequent evolution of the SIGO and protogalaxy including cosmological expansion, confirming that the SIGO’s orbital path enters the virial radius of the protogalaxy on a bound orbit. This analysis suggests that the SIGO is likely to fall within the virial radius of this protogalaxy within Myr of the end of our AREPO hydrodynamic N-body simulation.
The end state of this SIGO as a cluster residing within a halo is commonplace. As shown in Lake et al. (2023), star-forming SIGOs are expected to be accreted onto nearby halos shortly after forming stars. The hierarchical merging of these halos allows the most massive halos to accrete SIGO-derived star clusters. The protogalaxy which accretes this particular SIGO-derived star cluster is one of the largest protogalaxies in the simulation at all snapshots and could potentially host several SIGO-derived objects at later redshifts as it accretes nearby systems. On Gyr timescales, based on these results and those of Lake et al. (2023), we expect more massive halos to host more SIGO-derived star clusters, gained through hierarchical formation. This particular cluster, as well as other low-mass star clusters derived from this process, eventually likely disperses through relaxation within its host halo on these Gyr timescales, while more massive clusters may survive (e.g., Naoz & Narayan, 2014).
An additional important property of this cluster is the degree of rotational support compared to random motion within its constituent stars. It is general consensus that local globular clusters are supported by random motion rather than ordered rotation, and this SIGO is not exceptional in that regard. Similarly to Chiou et al. (2018), we express the spin parameter as
| (1) |
where is the total stellar mass in the star cluster, is the circular velocity at a distance from the center of the cluster, and is the maximum axis radius of the star cluster determined by an ellipsoid fit. At , this SIGO’s star cluster has , which is comparable to the spin parameter of many present-day globular clusters (e.g., Kamann et al., 2018).
Note that the streaming velocity for the v case is km s-1 at z= (comparable to km s-1 at the time of recombination, and km s-1 at z, when the SIGO’s overdensity initially formed). This streaming velocity injects turbulence into the gas, forming the SIGO (Lake et al., 2023). As such, one expects a signature of this turbulence to be left in the SIGO’s velocity dispersion. The velocity dispersion of the stars in the cluster is estimated as km s-1 at z= (comparable to that of present-day globular clusters, e.g., Kamann et al., 2018), suggesting that other sources of velocity dispersion also play major roles in the cluster.
4 Detectability by JWST
At high redshifts, one primary mechanism by which objects like these SIGO-derived star clusters could be detected is UV emission from young massive stars (e.g., Sun & Furlanetto, 2016; Hegde & Furlanetto, 2023; Senchyna et al., 2023). As a proof of concept examining whether SIGOs could be observed with JWST, we use a semi-analytical model based on the example SIGO in this simulation to examine the flux from these young, massive stars in SIGOs forming at later redshifts. As a proof of concept, we model the emission from these test SIGOs, assuming that they share the star formation rate of our example SIGO333Though note that the trend of star formation rates with redshift in SIGOs is not established, and could be impacted by decreasing gas densities with redshift., but form at various redshifts immediately prior to and during Reionization (). The UV luminosity of these SIGOs is given approximately by Sun & Furlanetto (2016):
| (2) |
where we take to be the average star formation rate in our example SIGO in the Myr period following the start of its star formation (after which, in a simulation with feedback, star formation may be quenched). See Appendix A for further discussion of the effect of this time duration. is the rest-frame UV luminosity at Å. here is a fiducial constant, which following Sun & Furlanetto (2016) we set to be approximately , which assumes a Saltpeter IMF. It is important to note here that this constant most likely underestimates the luminosity at a given star formation rate, as SIGOs have extremely low metallicities and would be likely to have a top-heavy IMF.
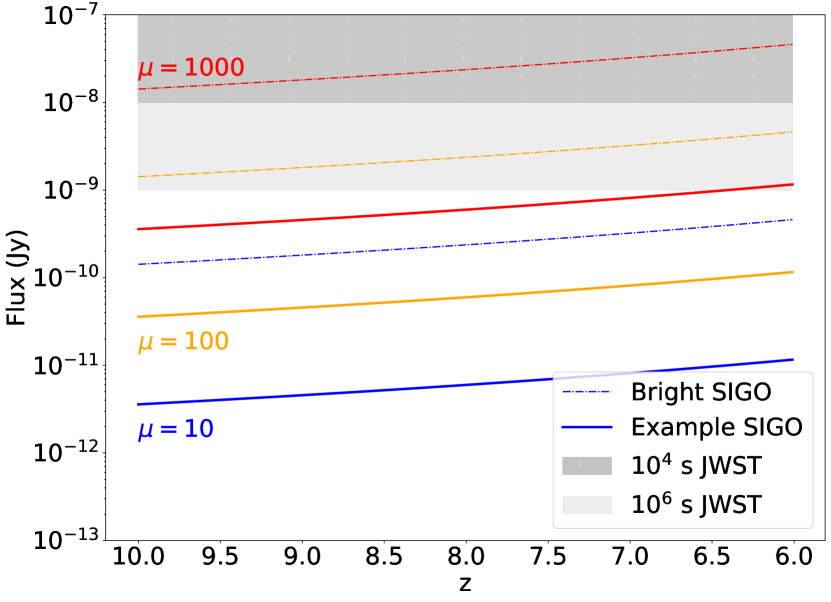
The solid lines in Figure 4 show the flux from test SIGOs with this star formation history, placed at varying redshifts. Three solid lines are shown, representing three different gravitational lens magnifications ( and , bottom to top). Characteristic detectability from JWST at two exposure times is shown as gray-shaded regions. As seen in the Figure, an object with properties of our example SIGO, forming stars at the end of Reionization and magnified by a factor of a thousand or more, would only just be observable in a JWST field. UV emission from SIGOs similar to our example SIGO would likely not be observable with JWST at all.
However, the SIGO we study in this letter is likely not the most luminous possible SIGO, so to understand whether any SIGO would be detectable by JWST requires a model for the most luminous possible SIGO. The most massive SIGOs found have gas masses approaching M⊙ (Lake et al., 2023), exceeding the gas mass of this SIGO at the start of star formation by a factor of . We argue that an approximate value for the star formation rate of the most luminous SIGO can, then, be given by multiplying the star formation rate of our example SIGO by this factor of ratio in the SIGOs’ gas masses (based on the SFR-mass relation, e.g., Lada et al., 2012). This assumes that the star formation efficiency of SIGOs of different masses is the same.
We overplot the simulated observed flux from this characteristic most luminous SIGO in Figure 4 with dashed lines. As one can see, in a very deep JWST field, strong lensing with a magnification of around or better may allow a particularly luminous SIGO to be observable even at very high redshift, given sufficient exposure time. This result is not surprising, in the context of the recent observations of even individual stars or star systems at high redshift in such lensed fields (e.g., Welch et al., 2022).
5 Discussion
SIGOs (Supersonically Induced Gas Objects) are a natural consequence of early structure formation in CDM (Naoz & Narayan, 2014). These gas objects form in the early Universe (), with little to no dark matter, in the patches of the Universe with non-negligible streaming velocity between the dark matter and the baryons. Interestingly, it was recently suggested that our own Local Group formed in a region with a large streaming velocity (Uysal & Hartwig, 2022), implying that the small-scale structure in our vicinity was greatly impacted by the streaming velocity. Investigating the star formation of these objects is critical for predicting future local and high redshift observations. While previous studies expected that these objects would eventually form stars (e.g., Chiou et al., 2019; Nakazato et al., 2022; Lake et al., 2023), until now, no study investigated the formation of stars in these objects.
Here we present, for the first time, a study of the outcomes of star formation in SIGOs. We estimate the stellar mass of SIGOs, and follow the evolution of a SIGO after star formation. We present a streaming velocity run v, and a control run without the streaming velocity (v) for comparison. See Figure 1 for a comparison of these runs.
We find that some SIGOs form stars. As expected (see Lake et al., 2023), many other SIGOs accrete onto nearby DM halos prior to forming stars, forming diffuse structures akin to DM GHOSts (Williams et al., 2022). In total, out of 5325 unique SIGOs found at integer redshifts, 9 SIGOs formed stars outside of a DM halo before 444The latter number is visually verified, ensuring that the SIGO is outside of concentrations of dark matter missed by the FOF and that the candidate SIGO did not originate/form stars in the nucleus of a halo at earlier times. We also verify that the star particles formed within the SIGO., and others form DM GHOSt analogs or may form stars later (Williams et al., 2022). We explore the population and overall star formation efficiency in Lake et al. in prep.
Here we focused on an example SIGO as a detailed case study of the formation and evolution of a GC-like star cluster. Figure 1 depicts this process in context, showing that simulation runs with the streaming velocity effect form a gas object in a location where there is none in the no-stream-velocity runs, and that the object is capable of cooling to form stars while fully outside of nearby DM halos.
Figure 3 depicts the evolution of a SIGO and its vicinity as it forms stars. By , the resultant GC-like star cluster is bound to a large, M⊙ protogalaxy (although it lies beyond its , as shown by Figure 2). Based on a simple two-body simulation, the SIGO is likely to merge with the halo to form a bound cluster within the halo on a timescale of about Myr following the end of our AREPO hydrodynamic N-body simulation.
The SIGO formed stars at while still outside its closest DM halo. The SIGO was separated from this nearby halo through a tidal interaction with a third, larger halo, possibly allowing it to remain outside of the nearby halo as it formed stars. Subsequent evolution may yield a cluster that resembles a cluster resultant from a more classical evolution (e.g. Sameie et al., 2022). The SIGO-derived clusters may have some differing characteristics, such as their velocity profiles (e.g., Williams et al., 2022). The resulting cluster could also have a high galactocentric distance compared to clusters that formed locally, owing to its accreted nature.
Note that in this study we do not include feedback or the effects of metal enrichment on the SIGO. Although radiative feedback will act to reduce the efficiency and duration of star formation within the SIGO, even low levels of metal enrichment can significantly increase cooling rates within it (such as from pair-instability supernovae in nearby halos, Schauer et al., 2021). In addition, the limited mass resolution of these simulations results in a significant underestimation of the effectiveness of molecular hydrogen cooling in SIGOs (Nakazato et al., 2022). Furthermore, our softening scale of pc is a significant fraction of the radius of the star cluster, which is expected to lower our simulated star formation rates, acting together with our underestimation of the effectiveness of molecular hydrogen cooling to make star formation in SIGOs seem slower than it is. Taken together, these processes will have an ambiguous effect on the stellar mass of SIGOs. Higher stellar masses will increase both the longevity of star clusters derived from SIGOs as well as the potential for binary black hole mergers and gravitational wave events as these clusters evolve.
Already, early JWST observations have found potential candidates for high-z clusters, some with high galactocentric distances (e.g. Pascale et al., 2022; Senchyna et al., 2023). Figure 4 explores this possibility, considering whether a SIGO-derived star cluster with properties similar to the cluster explored in this letter would be observable by JWST in the Reionization epoch and whether a SIGO that is especially massive and bright may be observable in the same epoch. We find that a SIGO with properties similar to the one in this letter would likely be unobservable with JWST (even considering lensing). However, a more massive SIGO similar to the most massive SIGOs in simulations may be detectable via lensing, presenting the possibility of direct detections.
Appendix A Effect of Time on Cumulative Star Formation Rate
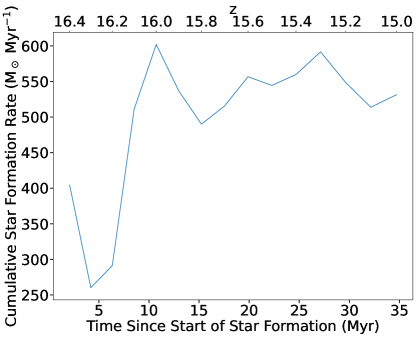
We estimate the star formation rate directly from the rate at which star particles are formed in our simulation. This is shown in Figure 5. We note that we do not include radiative feedback, which eventually acts to quench star formation. As mentioned in Section 5, the effects of feedback on our simulation may be balanced on timescales shorter than the quenching timescale by our cooling mechanism, which serves as a lower bound to the true cooling rate in SIGOs for the reasons given in the aforementioned section. The likely quenching timescale is Myr, so in order to estimate the star formation rate in the SIGO during its initial starburst, we need to select a star formation rate over this period. As shown in Figure 5, the star formation rate over this period is not a large source of uncertainty, as it varies only by about a factor of two over the timespan. As such, we use a period of Myr following the start of star formation in the SIGO to calculate a star formation rate, .
References
- Ashman & Zepf (1992) Ashman, K. M., & Zepf, S. E. 1992, ApJ, 384, 50, doi: 10.1086/170850
- Bastian & Lardo (2018) Bastian, N., & Lardo, C. 2018, Annual Review of Astronomy and Astrophysics, 56, 83, doi: 10.1146/annurev-astro-081817-051839
- Bekki & Yong (2012) Bekki, K., & Yong, D. 2012, MNRAS, 419, 2063, doi: 10.1111/j.1365-2966.2011.19856.x
- Bradford et al. (2011) Bradford, J. D., Geha, M., Muñoz, R. R., et al. 2011, ApJ, 743, 167, doi: 10.1088/0004-637X/743/2/167
- Bromm & Clarke (2002) Bromm, V., & Clarke, C. J. 2002, ApJ, 566, L1, doi: 10.1086/339440
- Chiaki & Wise (2019) Chiaki, G., & Wise, J. H. 2019, MNRAS, 482, 3933, doi: 10.1093/mnras/sty2984
- Chiou et al. (2019) Chiou, Y. S., Naoz, S., Burkhart, B., Marinacci, F., & Vogelsberger, M. 2019, ApJ, 878, L23, doi: 10.3847/2041-8213/ab263a
- Chiou et al. (2021) —. 2021, ApJ, 906, 25, doi: 10.3847/1538-4357/abc88f
- Chiou et al. (2018) Chiou, Y. S., Naoz, S., Marinacci, F., & Vogelsberger, M. 2018, MNRAS, 481, 3108, doi: 10.1093/mnras/sty2480
- Conroy et al. (2011) Conroy, C., Loeb, A., & Spergel, D. N. 2011, ApJ, 741, 72, doi: 10.1088/0004-637X/741/2/72
- Elmegreen & Efremov (1997) Elmegreen, B. G., & Efremov, Y. N. 1997, ApJ, 480, 235, doi: 10.1086/303966
- Glover (2013) Glover, S. 2013, in Astrophysics and Space Science Library, Vol. 396, The First Galaxies, ed. T. Wiklind, B. Mobasher, & V. Bromm, 103, doi: 10.1007/978-3-642-32362-1_3
- Gray & Scannapieco (2011) Gray, W. J., & Scannapieco, E. 2011, ApJ, 742, 100, doi: 10.1088/0004-637X/742/2/100
- Grillmair et al. (1995) Grillmair, C. J., Freeman, K. C., Irwin, M., & Quinn, P. J. 1995, AJ, 109, 2553, doi: 10.1086/117470
- Grudić et al. (2022) Grudić, M. Y., Hafen, Z., Rodriguez, C. L., et al. 2022, arXiv e-prints, arXiv:2203.05732. https://arxiv.org/abs/2203.05732
- Gunn (1980) Gunn, J. E. 1980, in Globular Clusters, ed. D. Hanes & B. Madore, 301
- Harris & Pudritz (1994) Harris, W. E., & Pudritz, R. E. 1994, ApJ, 429, 177, doi: 10.1086/174310
- Hegde & Furlanetto (2023) Hegde, S., & Furlanetto, S. R. 2023, arXiv e-prints, arXiv:2304.03358, doi: 10.48550/arXiv.2304.03358
- Heggie & Hut (1996) Heggie, D. C., & Hut, P. 1996, in IAU Symposium, Vol. 174, Dynamical Evolution of Star Clusters: Confrontation of Theory and Observations, ed. P. Hut & J. Makino, 303
- Ibata et al. (2013) Ibata, R., Nipoti, C., Sollima, A., et al. 2013, MNRAS, 428, 3648, doi: 10.1093/mnras/sts302
- Jog (2013) Jog, C. J. 2013, MNRAS, 434, L56, doi: 10.1093/mnrasl/slt077
- Kamann et al. (2018) Kamann, S., Husser, T. O., Dreizler, S., et al. 2018, MNRAS, 473, 5591, doi: 10.1093/mnras/stx2719
- Kravtsov & Gnedin (2005) Kravtsov, A. V., & Gnedin, O. Y. 2005, ApJ, 623, 650, doi: 10.1086/428636
- Kruijssen (2015) Kruijssen, J. M. D. 2015, MNRAS, 454, 1658, doi: 10.1093/mnras/stv2026
- Lada et al. (2012) Lada, C. J., Forbrich, J., Lombardi, M., & Alves, J. F. 2012, ApJ, 745, 190, doi: 10.1088/0004-637X/745/2/190
- Lake et al. (2021) Lake, W., Naoz, S., Chiou, Y. S., et al. 2021, ApJ, 922, 86, doi: 10.3847/1538-4357/ac20d0
- Lake et al. (2023) Lake, W., Naoz, S., Burkhart, B., et al. 2023, ApJ, 943, 132, doi: 10.3847/1538-4357/acac8d
- Lithwick & Dalal (2011) Lithwick, Y., & Dalal, N. 2011, ApJ, 734, 100, doi: 10.1088/0004-637X/734/2/100
- Mandelker et al. (2018) Mandelker, N., van Dokkum, P. G., Brodie, J. P., van den Bosch, F. C., & Ceverino, D. 2018, ApJ, 861, 148, doi: 10.3847/1538-4357/aaca98
- Marinacci et al. (2019) Marinacci, F., Sales, L. V., Vogelsberger, M., Torrey, P., & Springel, V. 2019, Monthly Notices of the Royal Astronomical Society, 489, 4233, doi: 10.1093/mnras/stz2391
- Mashchenko & Sills (2005) Mashchenko, S., & Sills, A. 2005, ApJ, 619, 243, doi: 10.1086/426132
- Moore (1996) Moore, B. 1996, ApJ, 461, L13, doi: 10.1086/309998
- Nakazato et al. (2022) Nakazato, Y., Chiaki, G., Yoshida, N., et al. 2022, ApJ, 927, L12, doi: 10.3847/2041-8213/ac573e
- Naoz & Barkana (2005) Naoz, S., & Barkana, R. 2005, MNRAS, 362, 1047, doi: 10.1111/j.1365-2966.2005.09385.x
- Naoz & Narayan (2014) Naoz, S., & Narayan, R. 2014, ApJ, 791, L8, doi: 10.1088/2041-8205/791/1/L8
- Odenkirchen et al. (2003) Odenkirchen, M., Grebel, E. K., Dehnen, W., et al. 2003, AJ, 126, 2385, doi: 10.1086/378601
- Park et al. (2020) Park, H., Ahn, K., Yoshida, N., & Hirano, S. 2020, ApJ, 900, 30, doi: 10.3847/1538-4357/aba26e
- Pascale et al. (2022) Pascale, M., Frye, B. L., Diego, J., et al. 2022, arXiv e-prints, arXiv:2207.07102. https://arxiv.org/abs/2207.07102
- Peebles (1984) Peebles, P. J. E. 1984, ApJ, 277, 470, doi: 10.1086/161714
- Pontoppidan et al. (2016) Pontoppidan, K. M., Pickering, T. E., Laidler, V. G., et al. 2016, in Society of Photo-Optical Instrumentation Engineers (SPIE) Conference Series, Vol. 9910, Observatory Operations: Strategies, Processes, and Systems VI, ed. A. B. Peck, R. L. Seaman, & C. R. Benn, 991016, doi: 10.1117/12.2231768
- Popa et al. (2016) Popa, C., Naoz, S., Marinacci, F., & Vogelsberger, M. 2016, MNRAS, 460, 1625, doi: 10.1093/mnras/stw1045
- Saitoh et al. (2006) Saitoh, T. R., Koda, J., Okamoto, T., Wada, K., & Habe, A. 2006, ApJ, 640, 22, doi: 10.1086/500104
- Sameie et al. (2022) Sameie, O., Boylan-Kolchin, M., Hopkins, P. F., et al. 2022, arXiv e-prints, arXiv:2204.00638. https://arxiv.org/abs/2204.00638
- Schauer et al. (2021) Schauer, A. T. P., Bromm, V., Boylan-Kolchin, M., Glover, S. C. O., & Klessen, R. S. 2021, ApJ, 922, 193, doi: 10.3847/1538-4357/ac27aa
- Schneider et al. (2012) Schneider, A., Smith, R. E., Macciò, A. V., & Moore, B. 2012, MNRAS, 424, 684, doi: 10.1111/j.1365-2966.2012.21252.x
- Seljak & Zaldarriaga (1996) Seljak, U., & Zaldarriaga, M. 1996, ApJ, 469, 437, doi: 10.1086/177793
- Senchyna et al. (2023) Senchyna, P., Plat, A., Stark, D. P., & Rudie, G. C. 2023, arXiv e-prints, arXiv:2303.04179, doi: 10.48550/arXiv.2303.04179
- Shapiro et al. (2010) Shapiro, K. L., Genzel, R., & Förster Schreiber, N. M. 2010, MNRAS, 403, L36, doi: 10.1111/j.1745-3933.2010.00810.x
- Sheth et al. (2001) Sheth, R. K., Mo, H. J., & Tormen, G. 2001, MNRAS, 323, 1, doi: 10.1046/j.1365-8711.2001.04006.x
- Smith et al. (2017) Smith, B. D., Bryan, G. L., Glover, S. C. O., et al. 2017, MNRAS, 466, 2217, doi: 10.1093/mnras/stw3291
- Springel (2010) Springel, V. 2010, MNRAS, 401, 791, doi: 10.1111/j.1365-2966.2009.15715.x
- Sun & Furlanetto (2016) Sun, G., & Furlanetto, S. R. 2016, MNRAS, 460, 417, doi: 10.1093/mnras/stw980
- Tegmark et al. (1997) Tegmark, M., Silk, J., Rees, M. J., et al. 1997, ApJ, 474, 1, doi: 10.1086/303434
- Trenti et al. (2015) Trenti, M., Padoan, P., & Jimenez, R. 2015, ApJ, 808, L35, doi: 10.1088/2041-8205/808/2/L35
- Tseliakhovich et al. (2011) Tseliakhovich, D., Barkana, R., & Hirata, C. M. 2011, MNRAS, 418, 906, doi: 10.1111/j.1365-2966.2011.19541.x
- Tseliakhovich & Hirata (2010) Tseliakhovich, D., & Hirata, C. 2010, Phys. Rev. D, 82, 083520, doi: 10.1103/PhysRevD.82.083520
- Uysal & Hartwig (2022) Uysal, B., & Hartwig, T. 2022, arXiv e-prints, arXiv:2211.12838. https://arxiv.org/abs/2211.12838
- van Donkelaar et al. (2023) van Donkelaar, F., Mayer, L., Capelo, P. R., et al. 2023, Monthly Notices of the Royal Astronomical Society, 522, 1726, doi: 10.1093/mnras/stad946
- Vogelsberger et al. (2020) Vogelsberger, M., Marinacci, F., Torrey, P., & Puchwein, E. 2020, Nature Reviews Physics, 2, 42, doi: 10.1038/s42254-019-0127-2
- Vogelsberger & White (2011) Vogelsberger, M., & White, S. D. M. 2011, MNRAS, 413, 1419, doi: 10.1111/j.1365-2966.2011.18224.x
- Welch et al. (2022) Welch, B., Coe, D., Diego, J. M., et al. 2022, Nature, 603, 815, doi: 10.1038/s41586-022-04449-y
- Whitmore & Schweizer (1995) Whitmore, B. C., & Schweizer, F. 1995, AJ, 109, 960, doi: 10.1086/117334
- Whitmore et al. (1999) Whitmore, B. C., Zhang, Q., Leitherer, C., et al. 1999, AJ, 118, 1551, doi: 10.1086/301041
- Williams et al. (2022) Williams, C. E., Naoz, S., Lake, W., et al. 2022, arXiv e-prints, arXiv:2211.02066. https://arxiv.org/abs/2211.02066
- Yoshida et al. (2008) Yoshida, N., Omukai, K., & Hernquist, L. 2008, Science, 321, 669, doi: 10.1126/science.1160259