The influence of charge ordering in the microscopic structure of monohydroxy alcohols
Abstract
While radiation scattering data provides insight inside the microstructure of liquids, the Debye relation relating the scattering intensity to the atom-atom structure factors shows that, ultimately, it is these individual structure correlation functions which contain the relevant information about the micro-structure. However, these quantities are not observables, except in few cases where one can invert the Debye relation in order to obtain the structure functions. In the majority of other cases, the need for model dependent computer simulations is unavoidable. The resulting calculations reveal that the scattering pre-peak is the result of cancellations between positive pre-peaks and negative anti-peaks contributions from the atom-atom structure factors. What of systems where this cancellation is such that it entirely suppresses the scattering pre-peak? One would be tempted to falsely conclude that there is no uderlying micro-heterogeneity. Hence, the structure functions appear as hidden variables, and it is important to understand the relation between their features and the micro-structure of the system. Through the computer simulation study of various mono-ols, ranging from methanol to 1-nonanol, as well as the branched octanols, we show how the features of the atom-atom pair correlation function affect that of the structure factors , and reveal that the micro-structure is ultimately the result of the charge ordering between different atoms in the system.
‡Department of Physics, Faculty of Science, University of Split, Ruđera Boškovića 33, 21000, Split, Croatia.
†Laboratoire de Physique Théorique de la Matière Condensée (UMR CNRS 7600), Sorbonne Université, 4 Place Jussieu, F75252, Paris cedex 05, France.
1 Introduction
Radiation scattering provides an experimental way of probing the micro-structure of liquids and mixtures [1, 2, 3], but with disputable insights about the exact nature of this microstructure. For instance, the intensity of scattering experiments on colloids are usually interpreted in terms of the sole colloid structure factor using the expression [4]:
| (1) |
where is the form factor of the colloid, reflecting its shape, and neglecting all other other molecules present in the solution, such as the solvent, for example. In the case when the colloid is a micelle, the proper expression would be the Debye formula [5, 6]:
| (2) |
where the sum would run over all pairs of atoms and present in the molecules which make the colloidal solution, and where the are the atoms form factors and the atom-atom structure factor, including the intra-molecular contributions from the various molecules in the solution. As to how Eq.(1) emerges from Eq.(2) is an open problem. For instance, one could separate in Eq.(2) the sum over atoms which making up the molecules found in the micellar colloids, and would require to neglect the other atom contributions, namely that of the solvent, ions and co-ions, as well as the cross-terms between these molecules and those of the colloidal micelles. It is difficult to imagine how this could justified, and moreover how the “shape” of the micelle would emerge from those terms retained in Eq.(2). Yet, it is an experimental fact that both expressions are found equivalent in many cases. Clearly, in view of the massive amount of data confirming Eq.(1), it would be important to show the equivalence of these 2 equations.
Another similar problem concerns the radiation scattering data from aqueous mixtures of small surfactant like molecules, such as nonionic polyoxy- ethylene monoalkyl ether surfactants. The experiments [7, 8] show a variety of behaviour for the at small , namely Ornstein-Zernike (OZ) type behaviour and Teubner-Strey (TS) type behaviour. The former has a large peak at , while the latter has a well defined pre-peak. One might conclude that the corresponding latter mixtures may have aggregated structures which are responsible for the pre-peak, while the former may not have such structures. Yet, computer simulations of aqueous mixtures with simpler alcohols, such as tertbutyl alcohol, for example, shows micro-domain separation [9, 10, 11, 12, 13]. In this context, it is quite clear that, while various types of aggregative structure may exist, these may not necessarily lead to the pre-peak feature, hence posing the question of the exact origin of the presence or absence of the pre-peak in Eq.(2).
2 Theoretical and simulation details
2.1 Charge order and pre-peak
Charge order in liquids have been documented since the first studied of ionic melts [24, 25], and more recently in room temperature ionic liquids (RTILs) [26, 27, 28, 29, 30], particularly in relation to the radiation scattering pre-peak. Model calculations [31] show that the pre-peak, which does not exist in simple ionic melts, comes from the charge ordering in presence of uncharged groups attached to them. Alcohols also have such a scattering pre-peak [18, 32, 33, 34, 16, 19, 17, 35, 36, 37, 38]. Since charges in alcohol are tied into the hydroxyl head group, while these are detached in RTILs into anion and cation groups, it is clear that charge ordering has nothing to do with polar/apolar order. It is a very simply the basic Coulomb fact that unlike charges attract each other while like charges repell. With complex molecules bearing partial charges, this leads to several near neigbour positioning possibilities, thus sampling a variety of micro-states. The presence of uncharged groups introduces a supplementary constraint, since both types of charged groups try to avoid them. In absence of bonds tying the uncharged groups to the charged ones, one would quite simply observe a phase separation, with pre-transitional scattering raise at . The scattering pre-peak can be interpreted as a consequence of the avoided phase separation, induced by the covalent bonding of the various groups. In fact, we have demonstrated [39] that charge order with bond constraints leads to a non-uniform near neighbour positioning of the charged group, often in form of a chain of oppositely charges sitting in alternance. This local molecular conformation leads to typical features in the pair correlation functions , between 2 charged atomic sites of opposite valences, which we have described elsewhere: the strong pair Coulomb interaction raises the first contact peak in the , while the lack of uniform spherical distribution of next and higher order neighbours leads to a depletion correlation feature below one for medium distance in . The first feature gives, by Fourier transform, a wide and high peak in the corresponding structure factor while the second feature leads to a narrow and small negative anti-peak at . The total contribution to is then a positive pre-peak. Anti-peaks in happen in a similar way, but for pair of sites that are weakly correlated or fully uncorrelated, such as a charged and an uncharged site. For instance, the case of alcohols, the hydroxyl head group atoms tend to be uncorrelated with the hydrophobic tail atoms. In this case the first neighbour correlations are depleted, and mostly below , and raise again above one at medium distances. This combination leads to a total negative anti-peak, as we will discuss in the Results section below.
The total radiation scattered intensity by molecular liquids is given by the Debye expression similar to Eq.(2), in terms of all the site-site structure factors:
| (3) |
where the first sum runs over all the molecular species and , and the second sum over all the atoms of molecular species and of molecular species , the are the form factor for atom type of molecular species , and are radiation dependent, is a radiation dependent coefficient, is the mole fraction of species , and the total static intermediate scattering function (also called total structure factor in our previous papers [22, 40]) is defined as:
| (4) |
where the self-part is in fact the intra-molecular structure factor, and the distinct part is defined in terms of the atom-atom structure factors as
| (5) |
with
| (6) |
The self intermediate scattering function, defined only for atoms of the same species , has a simple expression for rigid molecules, in terms of the atom-atom intra-molecular distances , as:
| (7) |
where is a Kronecker symbol and is the zeroth-order spherical Bessel function. For non-rigid-molecules, one must compute the self intra-molecular function by computer simulations, much the same way one computes the inter molecular pair distribution function by building the histogram of neighbouring atoms:
| (8) |
where ) is the number of atoms in a spherical shell of radii and thickness , centered on atom , is the number of molecules of species in a volume V, and is the normalised volume of the shell.
Eq.3 shows that positive pre-peaks and negative anti-peaks can cancel each other, to leave either no peak, or a residual pre-peak in . It is this residual pre-peak which is interpreted in terms of the existence of clusters in scattering experiments. However, it is clear that it is the and the which are the true indicators of the preferred molecular dispositions inside the liquid. Interestingly, it is the which is the ultimate structure indicator, since, as discussed above, the pre-peak of the structure factor is itself the result of a cancellation of 2 features of the Therefore, it is perhaps more important to analyse these functions, rather than the scattering intensity . Molecular simulation allows to do that, albeit with the price of representing the true liquids by molecular models, with all the bias that it introduces.
2.2 Molecular models and simulation details
The simulations were performed with the program package Gromacs [41, 42], using the following protocol for all alcohols. The Packmol program [43] was used to generate random configurations of 2048 molecules for all systems. This system size is sufficient for studying the structure of monools with long alkyl tails, as shown in our previous work [22]. After minimizing the energy, we equilibrated the systems by doing two consecutive runs of 1 ns, first in the canonical (NVT) and then in the isobaric-isothermal (NpT) ensemble. The latter ensemble was used in the following production runs, which lasted 5 ns and sampled at least 2000 congurations for the subsequent calculations of the site-site correlation functions
All alcohols were simulated in ambient conditions, at the temperature of T = 300 K and pressure p = 1 bar. The temperature was maintained with the Nose-Hoover thermostat (time constant of 0.1 ps) [44, 45], whereas the pressure was achieved with the Parrinello- Rahman barostat (time constant of 1 ps) [46, 47]. The time step of 2 fs was used for all systems and the integration algorithm was leap-frog [48]. For short-range interactions the cut-off radius was 1.5 nm. For the long-range Coulomb interactions we used the particle mesh Ewald (PME) method [49], with FFT grid spacing of 0.12 nm and interpolation order of 4. The LINCS algorithm [50] was utilized for the constraints.
All of the alcohols were modeled as united-atom, using the classic OPLS forcefield for alcohols [51].
3 Results
3.1 Non-branched mono-ols
Fig.1 shows the oxygen-oxygen pair correlation functions in the left panel and the corresponding structure factors in the right panel, for simulated monohydroxy alcohol ranging from methanol to 1-nonanol. The left panel shows very cleary how the O-O correlations increase dramatically from methanol to 1-nonanol, even though the partial charges on the oxygen and hydrogen sites remain the same across models, and the contact position remains the same. The reason for this increase is that, for the same packing fraction of atoms, there are much less hydroxyl groups in 1-nonanol than in methanol. Hence, their contact probability increases in inverse proportion to their rarity, which is just a statistical effect. In contrast, the depletion part, shown in the inset, increases both in width an strength when going from methanol to 1-nonanol, suggesting longer hydroxyl chains in 1-nonanol than in methanol.
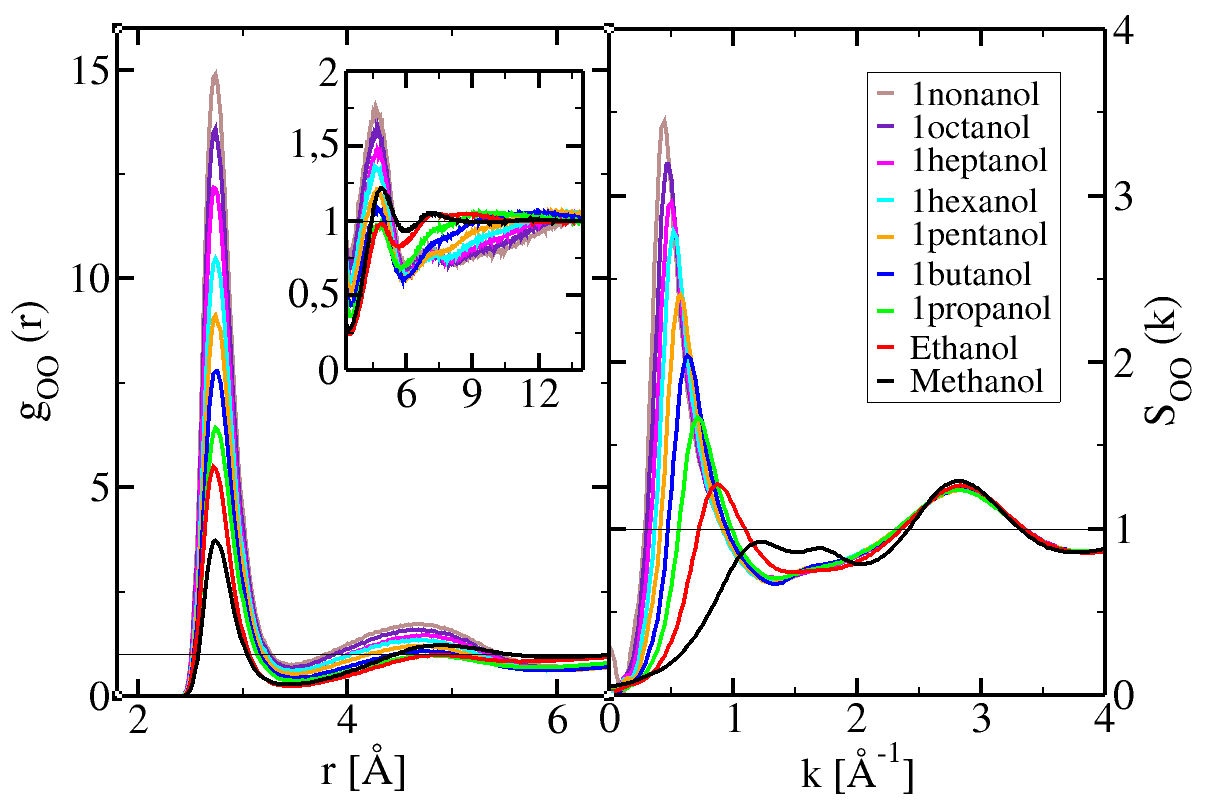
Both observations are corroborated in the analysis of the structire factors. The Hbond peak at is related to the distance hydrogen bonding distance between oxygen and hydrogen ) (see Fig.2 for an explanation). The peak at , which is quite visible for methanol, and barely marked for the other alcohols, corresponds to the distance which is the diameter of the oxygen atom in the OPLS model [51]. The weakness of this peak indicates that the direct, non-bonding, contact between the two oxygen is not very likely, since it is the Hbond mediated contact which is preferred. The prominent feature is the pre-peak, which is at up to for 1-nonanol, shows the increase of the hydroxyl chains with alcohol size. This is confirmed by the snapshots from the simulations, which show clear long chains in the case of longer alcohols. However, the direct cluster analysis [22] shows that the average cluster size remain more or less constant across all monohydroxy alcohols, with about 5 hydroxyl groups per chain. We have no explanation for this puzzling fact.
Fig.2 shows the oxygen-hydrogen correlations for the same cases as in previous figure 1. Although the first peak of the and the pre-peak of the offer strong similarities with the previous case, we note that the are positioned at the O-H bonding distance, as expected. But the most important feature is the charge order between like and unlike charges. This is seen from the peak/anti-peak features which characterise charge order correlations, as demonstrated in our previous work [31, 52].
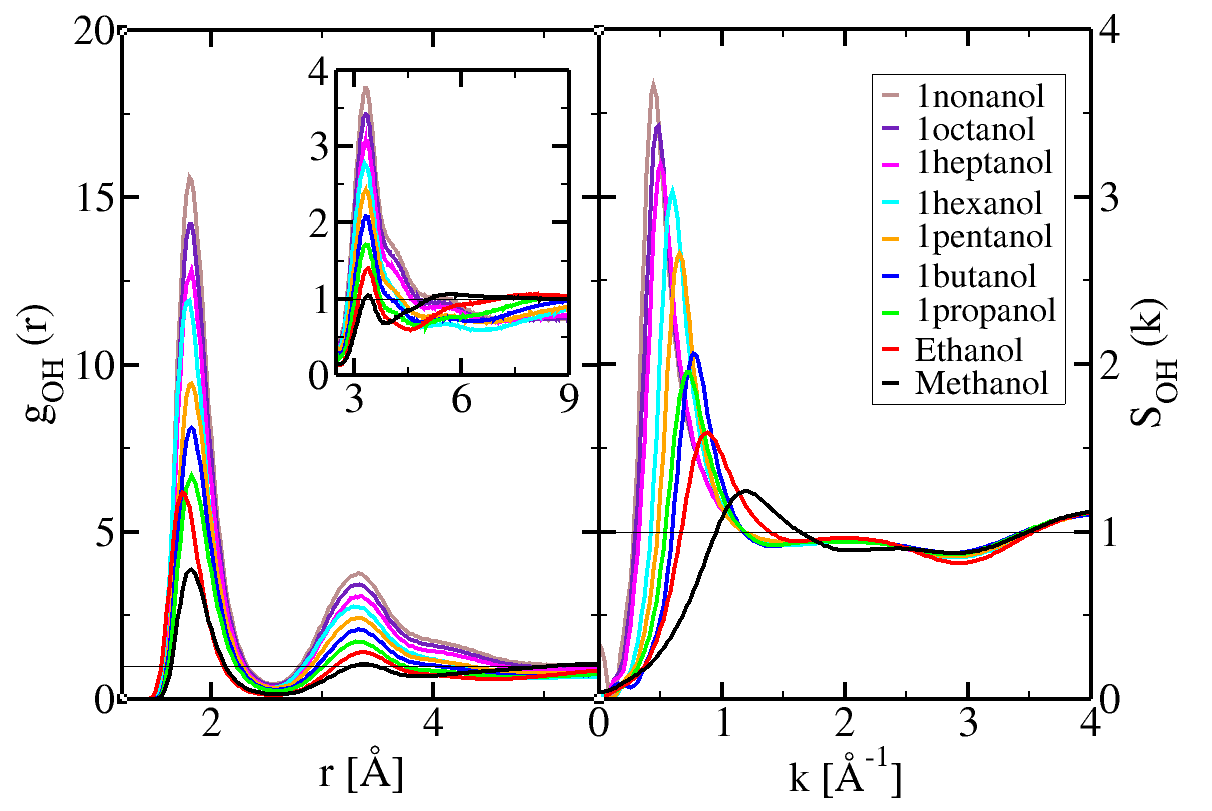
Accordingly, we note that the second neighbour OH peak at in Fig.2 coincides with the first minimum of the OO in Fig.1. This is even more striking in k-space, when the peak at coincides with the minimum at the same k-value in Fig.2 right panel. This would be more apparent if both plots would be superimposed, but aside from this, it would be also unreadable. These features are simple translation of the alternation of the O and H atoms along the hydroxyl group chain aggregates.
It is instructive to look at the oxygen atom correlation with the first carbon of the alkyl chain. In all force field model, this atom is weakly charged, essentially to neutralize the total charge on the molecule. The valence is too weak to speak of charge ordering. Nevertheless, it is important to confirm if this is true. Fig.3 shows the and . We note that the generic patterns of the correlations are very similar to that of OO correlations in Fig.1, albeit with reduced magnitudes. This is compatible with the weak charge of the carbon. In addition, since this carbon is the closest to the hydroxyl head group, it seem natural that the correlations are slaved to that between the oxygens. This would happen even of the carbon was not charged.
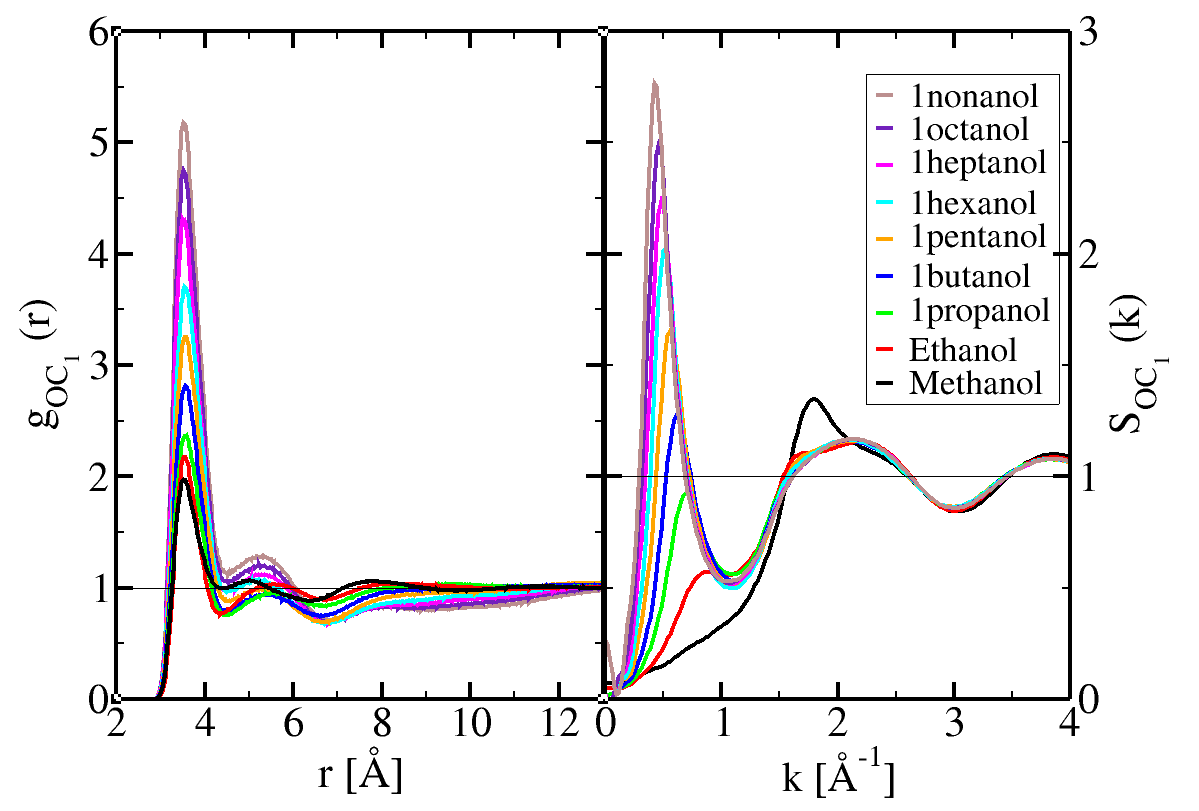
The left panel shows the corresponding structure factors . We observe again features very similar to that in the left panel of Fig.1, albeit with lesser magnitude.
Now, we look at the inter-molecular correlations between the head oxygen atom and the last (uncharged) carbon atom of the methyl group of the alkyl tail. Fig.4 shows the and . What we observe in the left panel is that, when the alcohol is short, from methanol until 1-butanol, there is a dual first neighbour/second neighbour contact high probability, and the first contact decays rapidly, while the second survives until 1-butanol. Ethanol is interesting since it shows equal probablity for both contacts. For longer alcohols, the correlations are essentially depleted. We note that the 3rd correlation peak is in the range , and is more pronounced for longer alkyl chains than for the shorter ones. This is somewhat surprizing, since one would imagine exactly the opposite behaviour. We interpret this as an indication that the self-assembled objects have better defined shapes and in particular well defined boundaries for longer alkyl chains. This would be consistent with the “inverse line micelle” picture, with the center of the cylinder occupied by the hydroxyl chain, and the alkyl tails protruding all around. The resulting alcohol would then appear as a melt of such self-assembled line-micelles.
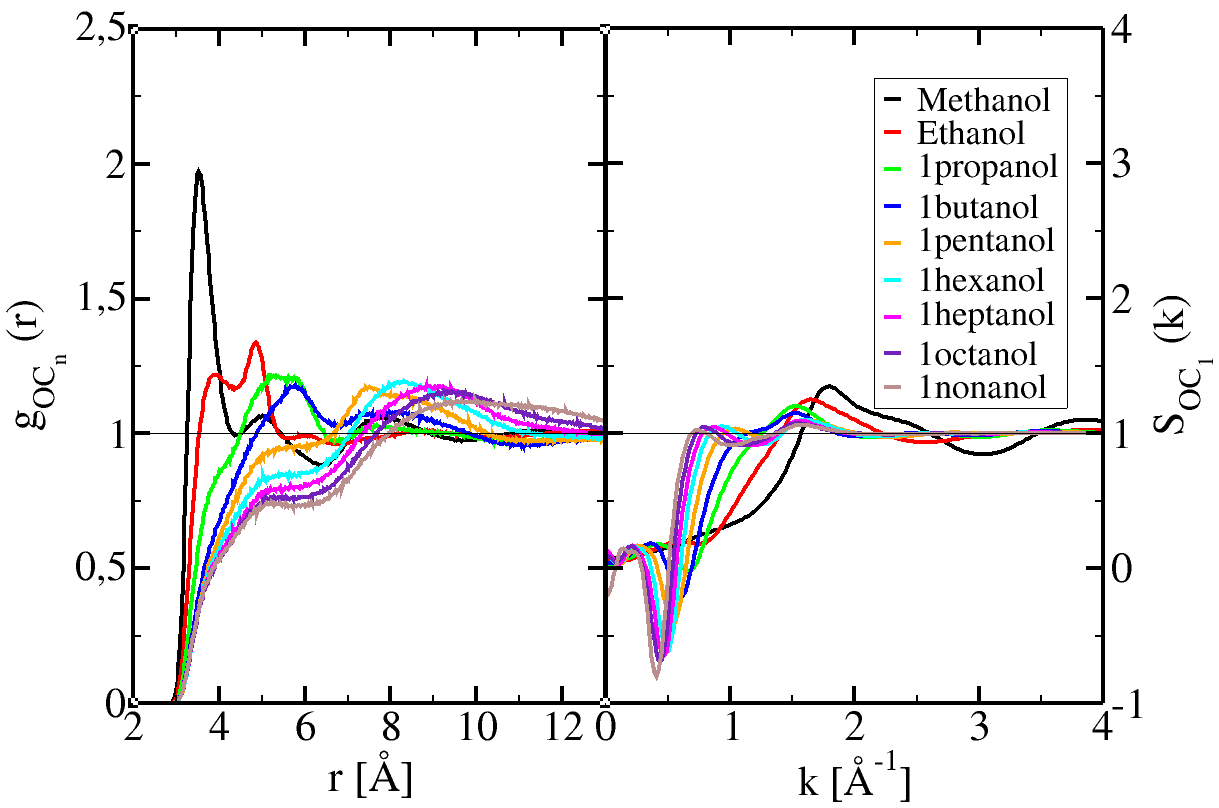
The structure factors in the right panel are a good illustration of the generic anti-peak description provided in Section 2.1. We observe the negative anti-peaks, which are the consequence of the depletion correlations described in the left panel. These are deeper and narrower for longer alcohols, in proportion of the depth and width of the depletion correlations.
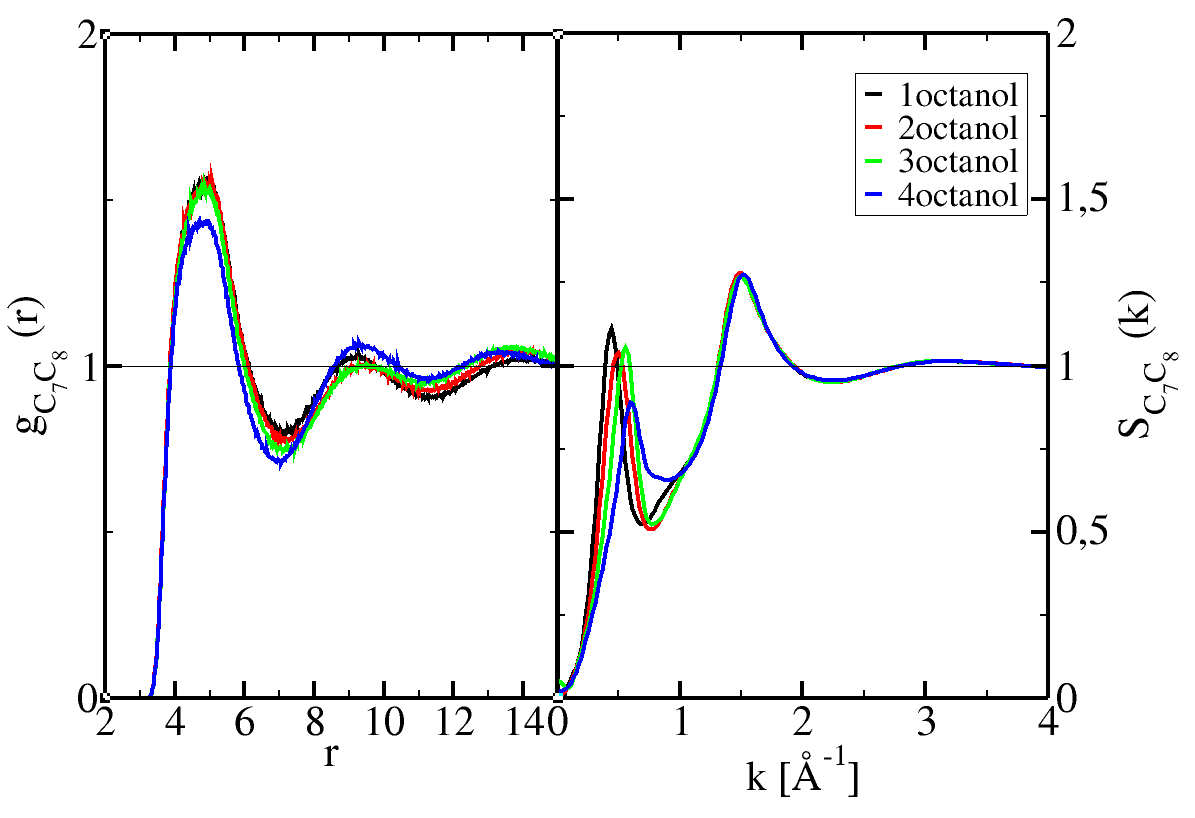
We turn finally towards the carbon-carbon correlations, and we have picked those between the last and one before the last carbons of the alkyl tails. Fig.5 shows the corresponding and functions. We observe that these correlations are strikingly reminiscent of those in a Lennard-Jones liquid for ethanol and for dimer Lennard-Jones for all others. Since these sites do not bear any charges, these results appear consistent with the charge order hypothesis that the main features of the correlations are slaved to the presence or absence of charge order. However, for longer alcohols we observe a small depression of high order neighbours.
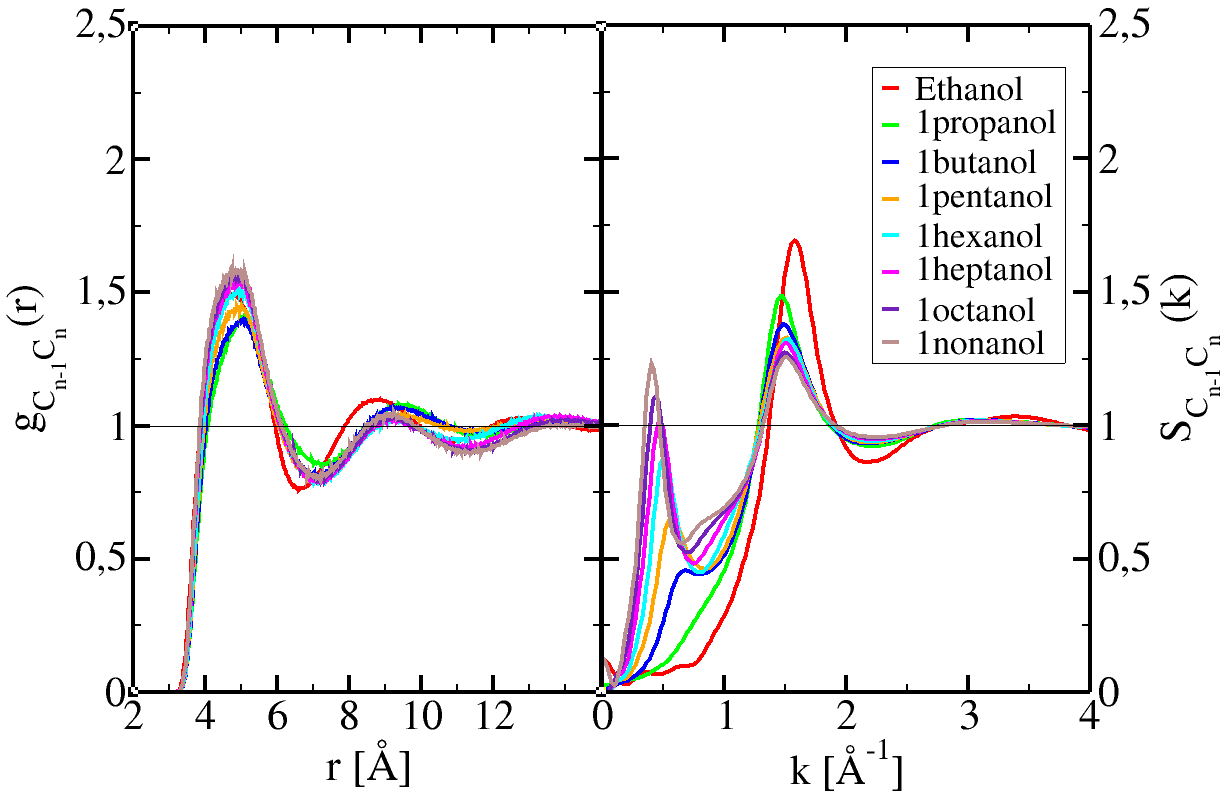
This latter trend is further confirmed by the pre-peak in the corresponding structure factors in the right panel. In fact, the structure factors bears quite some resemblance with the in Fig.1 , at the exception that now both the pre-peak and main peak are about the same height, at least for the longer alcohols above ethanol. This is very interesting because it witnesses the fact that the tail atoms share both the simple disorder distribution of Lennard-Jones liquids, while keeping a memory that they are slaved to the self-assembly of the head groups. Hence, the role of the tails appears as important in some aspect. This is further confirmed when looking at branched alkyl tails, where entropic effects are expected to play an important role on the self-assembly of the charged head groups.
3.2 Branched octanolsoctanol
The n-octanol molecules are a good example to study alkyl tail branching. The chains are sufficiently long to expect to observe chain packing entropic effects. The computer simulations reveal that most of the hydroxyl groups are clustered into chain-like aggregates. Hence, a good picture of this liquid is that of either a melt of line-like micelles, or chains “floating” in a “solvent” of methyl/methylene super atoms. We expect two types of effects: the influence of the branching of the tails on the hydroxyl chains formation, and the way the irrepressible chain formation of the hydroxyl groups affect the packing of the alkyl tails. Correlation functions are an excellent observable to answer these questions.
Fig.6 shows the O-O correlations (left panel) and the corresponding structure factors (right panel). Perhaps the most intringuing feature is the non-linear behaviour of these curves as a function of branching. 2-octanol, which is the “less branched” of these octanols, stands out as very different from the others. This is particularly striking in the first peak of the , which is smaller for 2-octanol, while all others coincide almost exactly. In contrast, both 3-octanol and 4-octanol offer strong similarities (similar depletion correlations and pre-peak heights). The depletion correlation for the branched octanols are more marked: the more the branching, the wider and deeper the depletion. This is a perfect illustration of the packing entropic problems posed by branching.
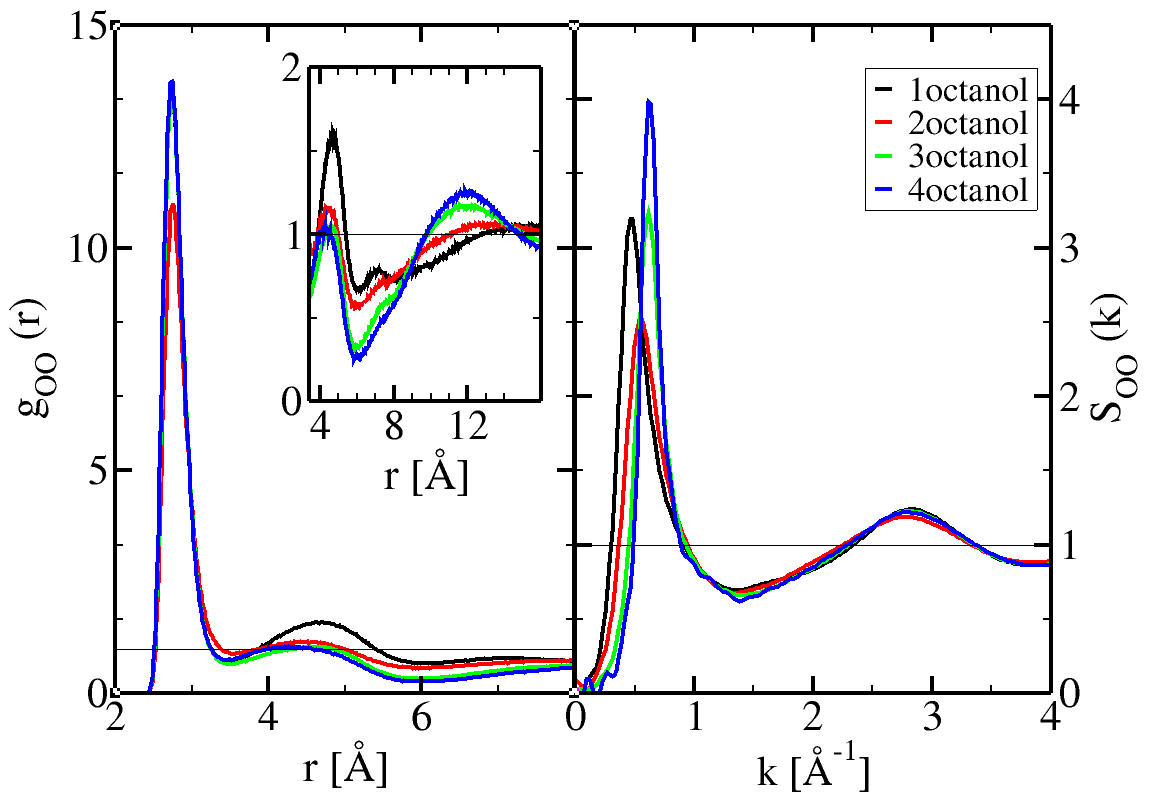
We tentatively explain the case of 2-octanol as the difficulty of aggregating the hydroxyl groups versus the rigidity/flexibility of the alkyl tail. Indeed, if we consider the idea of a “sea” of methyl/methylene “solvent”, this poses the problem of packing these super atoms, while keeping the hydroxyl groups attached together. The correlation seems to indicate that these problems are maximised for the case of 2octanol.
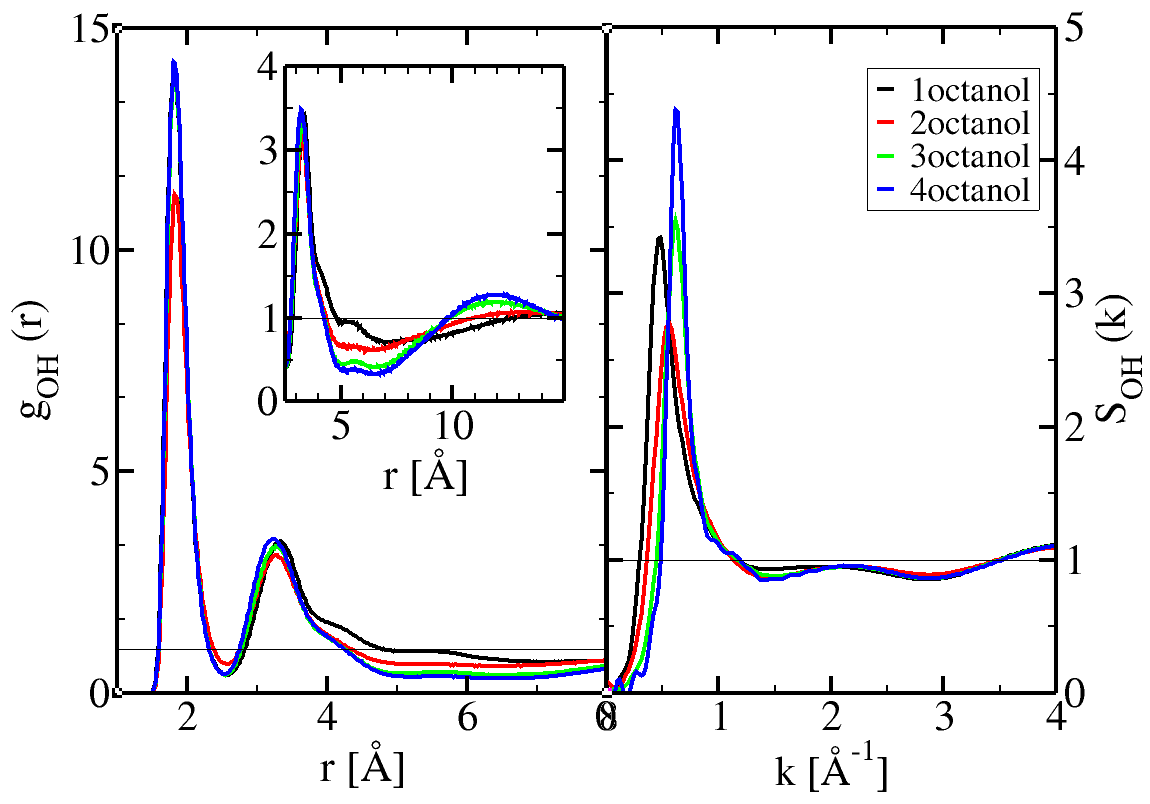
Fig.7 shows the O-H correlations for the same cases as in Fig.7. The charge order based alternation that we observed in Figs.1 and 2 is more pronounced with increasing branching. This is directly reflected in the structure factor pre-peak for 4-octanol being higher than the others. However, the positions of the pre-peaks change in a non-linear manner: the k-value decreases from 1-octanol to 3-octanol, and then seems to saturate since it is nealy the same between 3-octanol and 4-octanol.
The influence of the tail length and branching can be appreciated as before by comparing the correlations from the head oxygen to the last carbon. This is shown in Fig.8. We observe that there are no net pre-peaks. Instead, the shoulder structure at small value for 1-octanol, tends to disappear, while the correlation heights increase from 1-octanol to 4-octanol, suggesting that these correlations are quite Lennard-Jones like. We tentatively interpret this trend as as randomisation of correlations between the oxygen atom and the tail atoms because of increased branching order. We observe again this saturation of curves at 3-octanol and 4-octanol, since they appear quite similar.
.
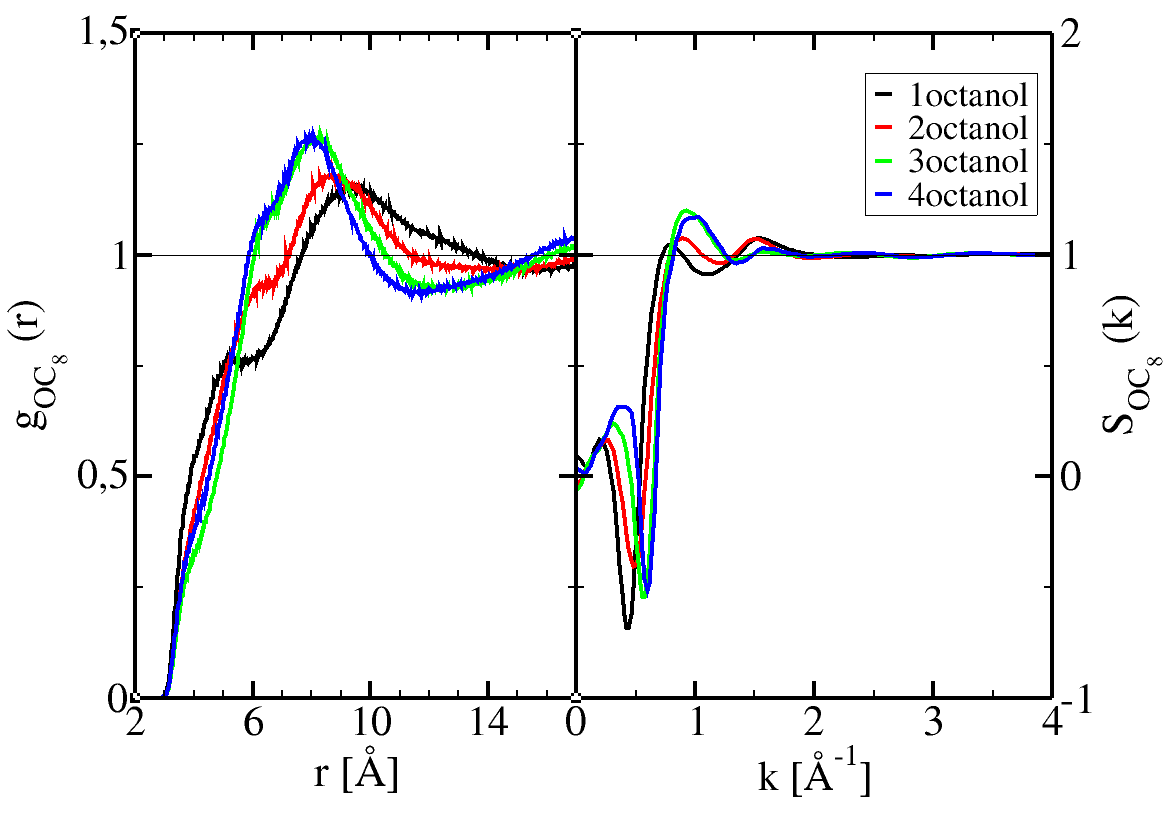
The structure factors show well marked anti-peaks, but of smaller magnitude than those observed for the shorter and medium lenght non-branched monools in Fig.2. Basically, these results reflect the decorrelation between head groups and tail atoms.
Fig.9 shows the and in order to appreciate the correlations between the tail atoms that the farthest from the charge order constraints. The figures show quite clearly that the correlations are both Lennard-Jones like and depleted in the -range . This is confirmed by a net pre-peak in the corresponding structure factors.
If we recoup these observations with that of the previous figure, we are forced to conclude that, while head and tail atoms appear randomized, the tail atoms themselves are still constrained by the charge order imposed by the head atoms. This is not very surprizing, but it shows that “internal” correlations between aggregated atoms are different from those outside. This enforces the picture of a coherent self-assembled object. We can conjecture that self-assembled objects with better shape visibility, such as micelles will show similar change of correlations between atoms belonging to the “inside” of the object and those outside.
4 Calculated scattering intensities
The X-ray scattering experiments provide a biased information on the microscopic structure of the complex disorder liquids, such as those with aggregates. This is because of the cancelling contributions from the various structure factors in the k-range , where corresponds to the mean atomic diameter size of all the atoms in the molecular system, and which corresponds also to the main peak in the wide angle x-ray scattering experiments.
X-ray spectra calculated from simulations using Eq.(3) are also biased for several reasons. First of all, the model dependence is strong, as illustrated in our previous studies [22, 23]. Secondly, The intra-molecular correlations are an important ingredient since they affect the small- region. Fig.10 illustrates this. The left panel shows a comparison the between the oxygen and last carbon atom in the case of 1-octanol, between the rigid model (in red) and that (in black) obtained by explicit calculation in the course of the simulation using the flexible OPLS model. We see that there is quite a strong dephasing between the 2 calculations.
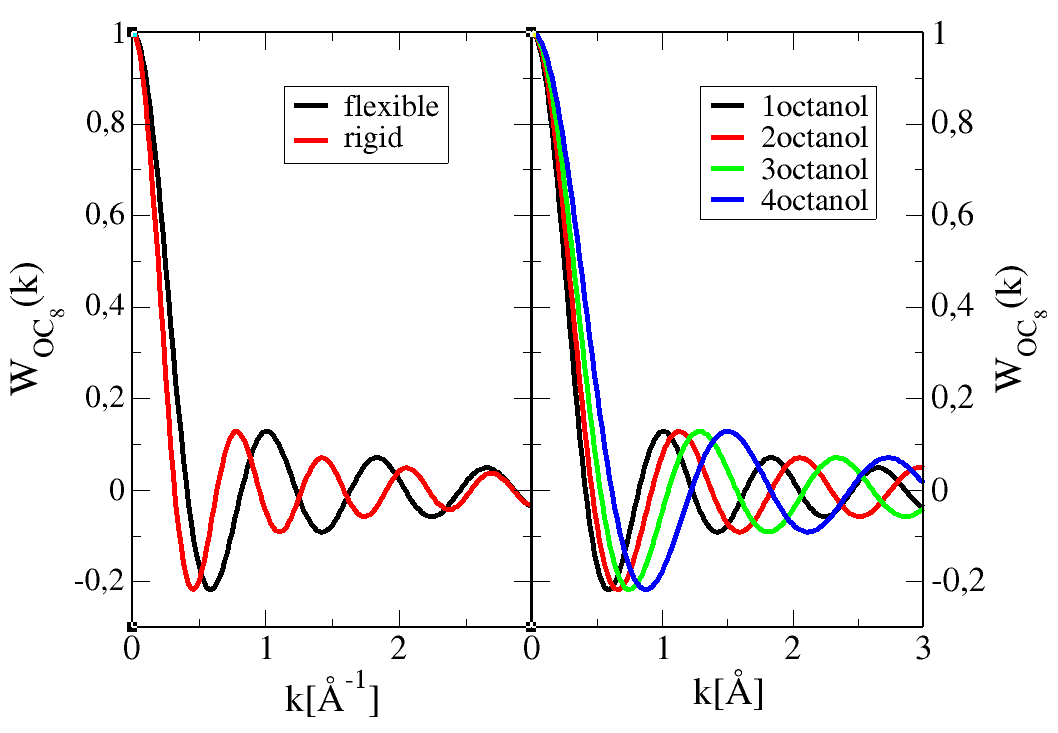
In case of long molecules, the rigid model approximation becomes a problem. To avoid that, we sample the mean atom-atom distance , as obtained from the simulations, and use the rigid atom approximation with The right panel shows the intra-molecular correlations of the flexible models of various branched octanols. A larger dephasing corresponds to a shorted distance , which is consistent in what concerns 1-octanol, but is less trivial for the others.
Fig.11 illustrates the charge order induced pre-peak anti-peak compensations for 1 and 2-octanol. It shows that the anti-peak does not quite compensate the pre-peak, in both cases, which is the reason why a net pre-peak would appear in the scattering intensity . But, there are cases where these peaks exactly compensate, and this happen for more spherical aggregative shapes, where the depletion gains more depth.
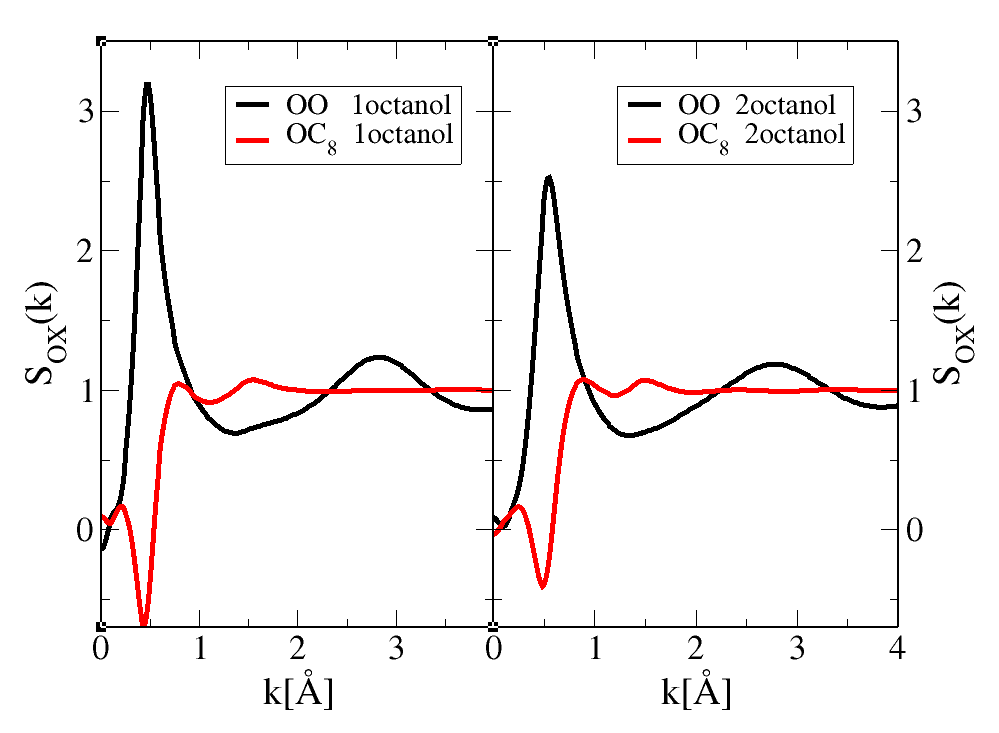
Fig.12 shows the x-ray scattering intensities, from experiments (red lines) and calculated (black) for 1 and 2-octanol. The net like-atom (green) and cross-atom (blue) contributions are equally shown. We see that both contributions are positive for the main peaks (), while they have opposite signs for the pre-peaks (). These opposting contributions are directly related to those illustrated in Fig.11 in the particular case of and atoms.
.
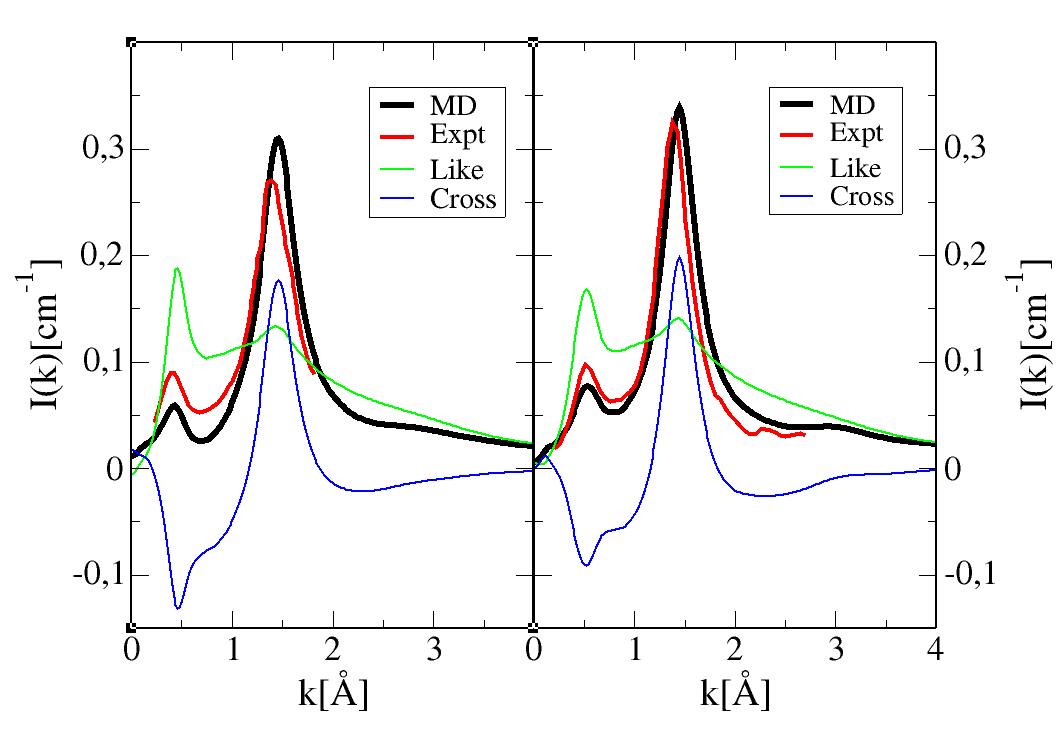
The agreement between the calculated and experimental spectra have been discussed in our previous work [22, 23]. It is mostly qualitative, particularly for the pre-peak part which is very sensitive to local atomic labile positionings and force field details. This is less sensitive for the main peak, which is mostly controled by the Lennard-Jones interactions between sites, hence the the part of the interaction which is not responsible for labile self-assembly.
5 Conclusion
In this study, we have analyzed the local structure of hydrogen bonded monohydroxy alcohols, both with non-branched and branched alkyl chains, through the analysis of the pair correlation functions and associated structure factors, in order to apprehend the interplay between self-assembly of the hydroxyl groups in the midst of the alkyl chains. We have shown that the atom-atom pair correlation functions are the ideal observables of the molecular micro-structure inside liquids, and that this micro-structure is chiefly ruled by charge order, including non-charged sites. We have shown that the pre-peaks and anti-peaks in the structure factors are a consequence of special highly inhomogeneous local molecular dispositions induced by charge ordering between the different charged or uncharged atomic groups. What remains unclear at present is relationship between the peak/antipeak position, heights and width, in relation to the supra structure of the self-assembly. Perhaps this is not so well defined for the small self-assembly such as in these mono-ols, and it becomes more relevant to discuss these issues with higher forms of self-assembly, such as with spherical and cylindrical micelles, vesicles, lamella and others. This poses the problem of the interest of studying in detail precursor self-assembling systems. Our answer is that such systems are similar to pre-transitional fluctuations in spinodal and near critical points of lines. While one can focus solely on well defined self-assembled shapes, such micelles, and underestimate the influence of atom-level arrangements and correlations, systems such as those we have studied herein allow to explore precursor self-assembling systems, and pay attention to molecular details down to atom level.
References
- [1] Hansen, J.P. and McDonald, I. Theory of Simple Liquids. Academic Press, Elsevier, Amsterdam, 3rd edition, 2006.
- [2] Berne, B.J. and Pecora, R. Dynamic Light Scattering: With Applications to Chemistry, Biology, and Physics. John Wiley and Sons, Inc., 2000.
- [3] Rowlinson, J. and Swinton, F. Liquids and Liquid Mixtures. Butterworth and Co (Publishers) Ltd, 3rd edition, 1982.
- [4] Glatter, O. Scattering Methods and their Application in Colloid and Interface Science. Elsevier, 2018.
- [5] Debye, P. Zerstreuung von röntgenstrahlen. Annalen der Physik, 1915. 351, 809.
- [6] Debye, P. Scattering of x-rays. In The collected papers of Peter J.W. Debye. Interscience Publishers, 1954.
- [7] D’Arrigo, G.; Giordano, R. and Teixeira, J. Small-angle neutron scattering studies of aqueous solutions of short-chain amphiphiles. The European Physical Journal E, 2003. 10, 135.
- [8] D’Arrigo, G.; Giordano, R. and Teixeira, J. Temperature and concentration dependence of sans spectra of aqueous solutions of short-chain amphiphiles. The European Physical Journal E, 2009. 29(1), 37.
- [9] Lee, M. and van der Vegt, N. A new force field for atomistic simulations of aqueous tertiary butanol solutions. The Journal of Chemical Physics, 2005. 122(11), 114509.
- [10] Gupta, R. and Patey, G.N. Aggregation in dilute aqueous tert-butyl alcohol solutions: Insights from large-scale simulations. The Journal of Chemical Physics, 2012. 137(3), 034509.
- [11] Banerjee, S.; Furtado, J. and Bagchi, B. Fluctuating micro-heterogeneity in water-tert-butyl alcohol mixtures and lambda-type divergence of the mean cluster size with phase transition-like multiple anomalies. The Journal of Chemical Physics, 2014. 140(19), 194502.
- [12] Overduin, S.D. and Patey, G.N. Comparison of simulation and experimental results for a model aqueous tert-butanol solution. The Journal of Chemical Physics, 2017. 147(2). 024503.
- [13] Overduin, S.D.; Perera, A. and Patey, G.N. Structural behavior of aqueous t-butanol solutions from large-scale molecular dynamics simulations. The Journal of Chemical Physics, 2019. 150(18). 184504.
- [14] Pierce, W. and MacMillan, D. X-ray studies on liquids: the inner peak for alcohols and acids. Journal of the American Chemical Society, 1938. 60, 779.
- [15] Warren, B. X-ray diffraction in long chain liquids. Phys. Rev., 1933. 44, 969.
- [16] Magini, M.; Paschina, G. and Piccaluga, G. On the structure of methyl alcohol at room temperature. The Journal of Chemical Physics, 1982. 77, 2051.
- [17] Narten, A. and Habenschuss, A. Hydrogen bonding in liquid methanol and ethanol determined by x-ray diffraction. The Journal of Chemical Physics, 1984. 80, 3387.
- [18] Vahvaselkä, K.S.; Serimaa, R. and Torkkeli, M. Determination of liquid structures of the primary alcohols methanol, ethanol, 1-propanol, 1-butanol and 1-octanol by x-ray scattering. Journal of Applied Crystallography, 1995. 28, 189.
- [19] Tomšič, M.; Jamnik, A.; Fritz-Popovski, G.; Glatter, O. and Vlček, L. Structural properties of pure simple alcohols from ethanol, propanol, butanol, pentanol, to hexanol: Comparing monte carlo simulations with experimental saxs data. The Journal of Physical Chemistry B, 2007. 111, 1738.
- [20] Cerar, J.; Lajovic, A.; Jamnik, A. and Tomšič, M. Performance of various models in structural characterization of n-butanol: Molecular dynamics and x-ray scattering studies. Journal of Molecular Liquids, 2017. 229, 346.
- [21] Nowok, A.; Dulski, M.; Grelska, J.; Szeremeta, A.Z.; Jurkiewicz, K.; Grzybowska, K.; Musiał, M. and Pawlus, S. Phenyl ring: A steric hindrance or a source of different hydrogen bonding patterns in self-organizing systems? The Journal of Physical Chemistry Letters, 2021. 12(8), 2142.
- [22] Požar, M.; Bolle, J.; Sternemann, C. and Perera, A. On the x-ray scattering pre-peak of linear mono-ols and the related microstructure from computer simulations. The Journal of Physical Chemistry B, 2020. 124(38), 8358.
- [23] Bolle, J.; Bierwirth, S.P.; Požar, M.; Perera, A.; Paulus, M.; Münzner, P.; Albers, C.; Dogan, S.; Elbers, M.; Sakrowski, R.; Surmeier, G.; Böhmer, R.; Tolan, M. and Sternemann, C. Isomeric effects in structure formation and dielectric dynamics of different octanols. Phys. Chem. Chem. Phys., 2021. 23, 24211.
- [24] Hansen, J.P. and McDonald, I.R. Self-diffusion and electrical conductance in a simple molten salt. Journal of Physics C: Solid State Physics, 1974. 7(21), L384.
- [25] Hansen, J.P. and McDonald, I.R. Statistical mechanics of dense ionized matter. iv. density and charge fluctuations in a simple molten salt. Phys. Rev. A, 1975. 11, 2111.
- [26] Triolo, A.; Russina, O.; Bleif, H.J. and Di Cola, E. Nanoscale segregation in room temperature ionic liquids. J. Phys. Chem. B, 2007. 111(18), 4641.
- [27] Annapureddy, H.; Kashyap, H.; De Biase, P. and Margulis, C. What is the origin of the prepeak in the x-ray scattering of imidazolium-based room-temperature ionic liquids? The Journal of Physical Chemistry B, 2010. 114(50), 16838.
- [28] Santos, C.; Annapureddy, H.R.; Murthy, N.; Kashyap, H.; Castner, E. and Margulis, C. Temperature-dependent structure of methyltributylammonium bis(trifluoromethylsulfonyl)amide: X ray scattering and simulations. The Journal of Chemical Physics, 2011. 134(6), 064501.
- [29] Siqueira, L. and Ribeiro, M. Charge ordering and intermediate range order in ammonium ionic liquids. The Journal of Chemical Physics, 2011. 135(20), 204506.
- [30] Macchiagodena, M.; Ramondo, F.; Triolo, A.; Gontrani, L. and Caminiti, R. Liquid structure of 1-ethyl-3-methylimidazolium alkyl sulfates by x-ray scattering and molecular dynamics. The Journal of Physical Chemistry B, 2012. 116(45), 13448.
- [31] Perera, A. and Mazighi, R. Simple and complex forms of disorder in ionic liquids. Journal of Molecular Liquids, 2015. 210, 243. Mesoscopic structure and dynamics in ionic liquids.
- [32] Sahoo, A.; Nath, P.; Bhagat, V.; Krishna, P. and Joarder, R. Effect of temperature on the molecular association in liquid d-methanol using neutron diffraction data. Physics and Chemistry of Liquids, 2010. 48, 546.
- [33] Karmakar, A.; Krishna, P. and Joarder, R. On the structure function of liquid alcohols at small wave numbers and signature of hydrogen-bonded clusters in the liquid state. Physics Letters A, 1999. 253, 207.
- [34] Karmakar, A.K.; Sarkar, S. and Joarder, R.N. Molecular clusters in liquid tert-butyl alcohol at room temperature. The Journal of Physical Chemistry, 1995. 99, 16501.
- [35] Yamaguchi, T.; Hidaka, K. and Soper, A. The structure of liquid methanol revisited: a neutron diffraction experiment at -80 ∘c and +25 ∘c. Molecular Physics, 1999. 96, 1159.
- [36] Sahoo, A.; Sarkar, S.; Bhagat, V. and Joarder, R.N. The probable molecular association in liquid d-1-propanol through neutron diffraction. The Journal of Physical Chemistry A, 2009. 113, 5160.
- [37] Sillrén, P.; Swenson, J.; Mattsson, J.; Bowron, D. and Matic, A. The temperature dependent structure of liquid 1-propanol as studied by neutron diffraction and epsr simulations. The Journal of Chemical Physics, 2013. 138, 214501.
- [38] Benmore, C. and Loh, Y. The structure of liquid ethanol: A neutron diffraction and molecular dynamics study. The Journal of Chemical Physics, 2000. 112, 5877.
- [39] Perera, A. Charge ordering and scattering pre-peaks in ionic liquids and alcohols. Physical Chemistry Chemical Physics, 2017. 19, 1062.
- [40] Lovrinčević, B.; Bella, A.; Le Tenoux-Rachidi, I.; Požar, M.; Sokolić, F. and Perera, A. Methanol-ethanol "ideal" mixtures as a test ground for the computation of kirkwood-buff integrals. Journal of Molecular Liquids, 2019. 293, 111447.
- [41] Pronk, S.; Páll, S.; Schulz, R.; Larsson, P.; Bjelkmar, P.; Apostolov, R.; Shirts, M.; Smith, J.; Kasson, P.; van der Spoel, D.; Hess, B. and Lindahl, E. Gromacs 4.5: a high-throughput and highly parallel open source molecular simulation toolkit. Bioinformatics, 2013. 29, 845.
- [42] Abraham, M.; Murtola, T.; Schulz, R.; Páll, S.; Smith, J.; Hess, B. and Lindahl, E. Gromacs: High performance molecular simulations through multi-level parallelism from laptops to supercomputers. SoftwareX, 2015. 1-2, 19.
- [43] Martínez, J. and Martínez, L. Packing optimization for automated generation of complex system’s initial configurations for molecular dynamics and docking. Journal of Computational Chemistry, 2003. 24, 819.
- [44] Nose, S. A molecular dynamics method for simulations in the canonical ensemble. Molecular Physics, 1984. 52, 255.
- [45] Hoover, W. Canonical dynamics: Equilibrium phase-space distributions. Physical Review A, 1985. 31, 1695.
- [46] Parrinello, M. and Rahman, A. Crystal structure and pair potentials: A molecular-dynamics study. Physical Review Letters, 1980. 45, 1196.
- [47] Parrinello, M. and Rahman, A. Polymorphic transitions in single crystals: A new molecular dynamics method. Journal of Applied Physics, 1981. 52, 7182.
- [48] Hockney, R. Methods in computational physics, vol. 9, volume 9, chapter The potential calculation and some applications, pages 135–221. Orlando Academic Press, 1970.
- [49] Darden, T.; York, D. and Pedersen, L. Particle mesh ewald: An n log(n) method for ewald sums in large systems. The Journal of Chemical Physics, 1993. 98, 10089.
- [50] Hess, B.; Bekker, H.; Berendsen, H. and Fraaije, J. Lincs: A linear constraint solver for molecular simulations. Journal of Computational Chemistry, 1997. 18, 1463.
- [51] Jorgensen, W. Optimized intermolecular potential functions for liquid alcohols. The Journal of Physical Chemistry, 1986. 90, 1276.
- [52] Perera, A. and Urbic, T. Charge ordering in two-dimensional ionic liquids. Physica A: Statistical Mechanics and its Applications, 2018. 495, 393.