A NICER view on the 2020 Magnetar-Like Outburst of PSR J18460258
Abstract
We report on our monitoring of the strong-field magnetar-like pulsar PSR J18460258 with the Neutron Star Interior Composition Explorer (NICER) and the timing and spectral evolution during its outburst in August 2020. Phase-coherent timing solutions were maintained from March 2017 through November 2021, including a coherent solution throughout the outburst. We detected a large spin-up glitch of magnitude at the start of the outburst and observed an increase in pulsed flux that reached a factor of more than 10 times the quiescent level, a behavior similar to that of the 2006 outburst. Our monitoring observations in June and July 2020 indicate that the flux was rising prior to the Swift announcement of the outburst on August 1, 2020. We also observed several sharp rises in the pulsed flux following the outburst and the flux reached quiescent level by November 2020. The pulse profile was observed to change shape during the outburst, returning to the pre-outburst shape by 2021. Spectral analysis of the pulsed emission of NICER data shows that the flux increases result entirely from a new black body component that gradually fades away while the power-law remains nearly constant at its quiescent level throughout the outburst. Joint spectral analysis of NICER and simultaneous NuSTAR data confirms this picture. We discuss the interpretation of the magnetar-like outburst and origin of the transient thermal component in the context of both a pulsar-like and a magnetar-like model.
1 Introduction
The dividing line between the two neutron star populations, rotation-powered pulsars (RPPs) and magnetars, has been blurring over the past ten years with the discovery of magnetar-like outbursts from the RPPs PSR J18460258 and J1119-6127. Both of these pulsars possess very strong surface dipole magnetic fields that are at the upper end of what is observed for RPPs, with G for J18460258 and G for J1119-6127. The first observed outburst from J18460258 occurred in 2006 (Kumar & Safi-Harb, 2008; Gavriil et al., 2008), during which the pulsed flux increased by a factor of five, decaying over several months, and a transient thermal component appeared in addition to the persistent non-thermal emission, whose flux rose by 35% (Kuiper & Hermsen, 2009). PSR J11196127 experienced a magnetar-like outburst in 2016 (Archibald et al., 2016), but in this case a transient non-thermal power law component appeared and the quiescent purely thermal pulsed flux increased by a factor of . In both outbursts, large spin-up glitches occurred, with for J11196127 and for J18460258 (Livingstone et al., 2010).
PSR J18460258 was discovered through 0.324 s X-ray pulsations by Gotthelf et al. (2000) and with its high spin-down rate of has a characteristic age of yr, making it the youngest known RPP. It is located in the Kes 75 supernova remnant and surrounded by a compact pulsar wind nebula (Helfand et al., 2003; Ng et al., 2008). Its pulsed emission is still only seen in the X-ray band from keV with RXTE INTEGRAL, (Kuiper & Hermsen, 2015), and recently also in soft -rays below 100 MeV with Fermi (Kuiper et al., 2018). Its spectral energy distribution (SED) is very similar to that of PSR B150958, another young, energetic RPP, with an SED peak around 1 - 10 MeV and a decline above 30 MeV (Kuiper et al., 2018). However, B150958 is a radio pulsar while J18460258 is radio quiet. These two pulsars are members of a class of so-called “MeV pulsars” whose SEDs peak at MeV energies, contrary to most other energetic RPPs peaking at GeV energies. The MeV pulsars are a group of 11 rotation-powered pulsars that exhibit strong, non-thermal hard X-ray emission, have broad single pulse profiles, and no detected gamma-ray pulsations above 1 GeV (Kuiper et al., 2018; Harding & Kalapotharakos, 2017). All except one are radio quiet.
In this paper, we will describe our long-term monitoring and timing of J18460258 using NICER (and Swift for the pre-2018 era) in Section 2. As a result of this program we have obtained phase-coherent timing solutions from April 2017 through November 2021. We will also report on the magnetar-like outburst of August 2020 and its aftermath, during which we obtained Target-of-Opportunity (ToO) observations following the Swift announcement (Krimm et al., 2020) of a magnetar-like s flare/burst. Near the start of the outburst we detected a large spin-up glitch (Kuiper et al., 2020) and maintained coherent timing over the entire outburst. Timing through the outburst and the evolution of the pulsed flux and pulse profile are described in Section 3.1. The spectral evolution before and during the outburst are discussed in Section 3.2. Finally in Section 4 we will discuss the implications of these results and how J18460258 fits in to the RPP-magnetar connection.
2 Observations and Data Reduction
2.1 NICER Monitoring
We have been timing J18460258 with NICER starting on May 23, 2018 (Observation id. 1033290101; MJD 58261) through a series of Guest Observer proposals, AO1 - AO4 GO. The last NICER observation used in this work was performed on November 13, 2021 (Observation id. 4607021501; MJD 59531), and so our NICER monitoring covered a year period subjected to months (approximately lasting from end November till end February) regular episodes in which no data can be taken due to visibility constraints resulting in (large) data gaps.
The NICER data were processed using HEASOFT version 6.27.2 and NICERDAS version 7a. We used the latest calibration files obtained from the standard CALDB release for NICER downloaded from NASA’s High Energy Astrophysics Science Archive Research Center (HEASARC). We start our data reduction from level 1 event files. We create good time intervals using standard filtering criteria as described in the NICER Data Analysis Guide. For spectral studies, we excluded module numbers 14 and 34 to avoid potential contamination by instrumental noise in the soft energy band.
For the timing analysis, requiring less restrictive selections as for the spectral analysis, we used predominantly the screened event files as stored at HEASARC. Next, we applied a time filter based on the observed count rate in the 12-15 keV band, and ignored events from periods with high rates in that band. Also events from high-rate modules are ignored. Finally, to search for the pulsed emission from J18460258 we used only events with energies in the 2.5–10 keV band, the optimum band. Sometimes the default screening criteria resulted in very small exposure times in which case we used the unfiltered level 1 event files, and followed the same screening steps as outlined before.
2.2 NuSTAR Observations
During the 2020-outburst NuSTAR observed J18460258 on 2020 August 5 (ObsID: 80602315002), 2020 August 20 (ObsID: 80602315004), 2020 September 17 (ObsID: 80602315006), and 2020 October 09 (ObsID: 80602315008). We also used NuSTAR data of J18460258 from a ks observation taken on 2017 September 17 (ObsID: 40301004002) with the source in quiescent state.
The NuSTAR data were reduced using the standard data reduction process with NuSTAR DAS v1.9.2 and CALDB 20191219. We extracted on-source spectra from circular regions of 1-radius centered at the source position in the 3–70 keV energy band from the NuSTAR observations. For the spectral fitting, we grouped source spectra using the grppha tool of HEASoft, such that each spectral bin would have a minimum of 25 counts.
2.3 Swift Monitoring
In this work we also analysed data from the XRT-telescope (Burrows et al., 2005) aboard the Neil Gehrels Swift observatory (Gehrels et al., 2004), operating in Windowed-Timing (WT) mode, providing a time resolution of 1.7675 ms. The Swift monitoring campaign of J18460258 started on July 25, 2011 and ended on November 19, 2018. Data from the early phase of the monitoring program up to and including September 4, 2016 has already been used and analysed in Kuiper et al. (2018). In order to characterize the spin-behavior of J18460258 during its quiescent state before the 2020-outburst we analysed the monitoring data collected between September 17, 2016 and November 19, 2018. More detailed information is given in Sect. 3.1.1.
3 The August 2020 Outburst
On August 1, 2020, the Swift telescope reported a short-duration ( s) flare in the BAT detector from J18460258 (Krimm et al., 2020). We started ToO observations on August 2 with NICER , obtaining densely sampled observations of the source until November 22, 2020. From our AO2 GO monitoring observations, that started on March 26, 2020, we saw that during the observation performed on June 26, 2020 (MJD 59026) the pulsed count rate in the 2.5-10 keV band had already increased by a factor of with respect to the (pre-outburst) quiescent level (Kuiper et al., 2020). The July 25, 2020 (MJD 59055) observation, performed about a week before the magnetar-like burst, showed an even larger, 10 times higher, 2.5-10 keV pulsed count rate than the pre-outburst value. Apparently, the source had already gone into outburst somewhere between May 27, 2020 (MJD 58996; the last AO2 GO observation of the quiescent period) and June 26, 2020.
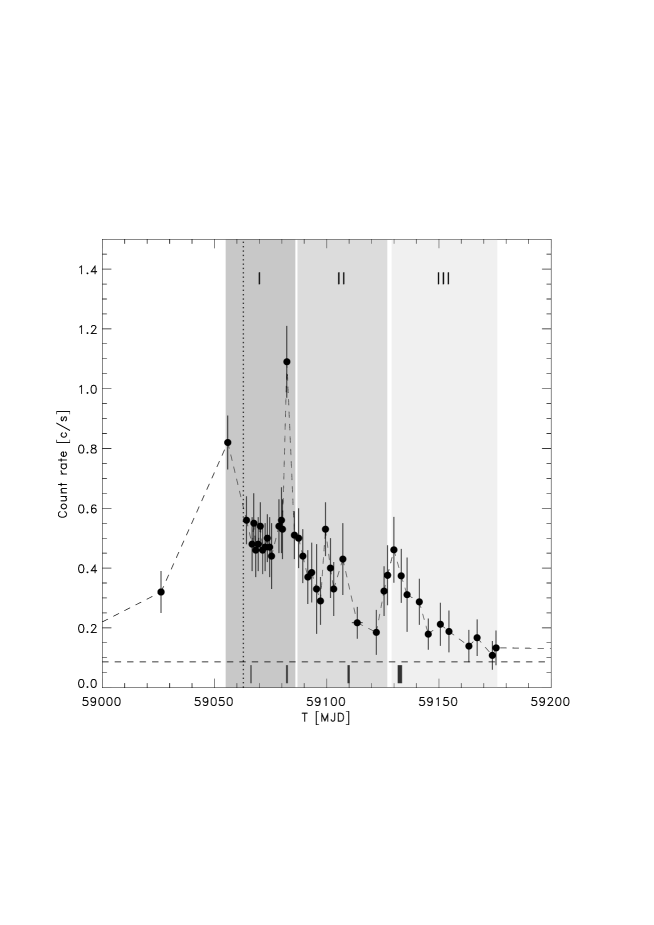
Figure 1 shows the 2.5 - 10 keV pulsed count rate starting from our AO2 observation on May 27, 2020 through the outburst until the count rate reached near quiescent level on November 22, 2020. The Swift-BAT burst announced on August 1, 2020 (Krimm et al., 2020) is marked by the vertical dotted line, which already occurred after the first recorded rate peaked on July 25, 2020. During the ToO observations, we recorded at least three more count rate peaks with the highest level reached on August 21, 2020. The very dense time sampling reveals that the outburst decay was very non-steady with possibly many unresolved variations in flux.
Blumer et al. (2021) presented radio observations with the Green Bank Telescope (GBT) and X-ray observations with Chandra of J18460258 and its pulsar wind nebula (PWN) following the 2020 outburst. Their GBT observations took place August 5 - 6, 2020, only a few days after the Swift announcement but actually about ten days after the initial outburst peak flux. They reported no detectable pulsed radio emission and place an upper limit of 55 mJy. They also presented results of Chandra ACIS-S observations taken on September 12, 2020, more than one month after the outburst. Fitting the total (=pulsed plus unpulsed/DC) X-ray spectrum with a power law plus blackbody, they reported a softer power law index of compared to the quiescent value of and the appearance of a thermal component with temperature keV. Their measured 0.5 - 10 keV flux was 2.4 times the quiescent flux level, consistent with our NICER count rate on that date (see Fig. 1). They detected no significant increase in X-ray flux or spectral index of the PWN. Livingstone et al. (2011) also found no change in X-ray flux or spectrum of the PWN following the 2006 outburst.
| Entry∗ | Start | End | t0, Epoch | RMS† | |||||
| # | [MJD] | [MJD] | [MJD,TDB] | [Hz] | [ Hz/s] | [ Hz/s2] | [ Hz/s3] | ||
| Pre-Outburst 2020 | |||||||||
| 1 | 57871 | 58061 | 57956.0 | 3.044 250 906(4) | -6.636 32(7) | 4.63(79) | 0.0 | 0.044 | 0.4167 |
| 2 | 58167 | 58422 | 58402.0 | 3.041 697 558(20) | -6.619 07(50) | 3.67(54) | 0.0 | 0.025 | 0.4258 |
| 3 | 58261 | 58671 | 58312.0 | 3.042 212 358(3) | -6.621 40(4) | 2.93(3) | 0.0 | 0.029 | 0.1074 |
| 4 | 58698 | 58996 | 58893.0 | 3.038 892 369(2) | -6.604 60(3) | 5.72(9) | 0.0 | 0.042 | 0.9539 |
| Outburst 2020 | |||||||||
| 5 | 59055 | 59086 | 59064.0 | 3.037 919 719(23) | -6.725 6(25) | -2659(45) | 0.0 | 0.038 | 0.8216 |
| 6 | 59087 | 59129 | 59099.0 | 3.037 707 087(50) | -7.018 0(52) | 1776(98) | -1.37(14) | 0.026 | 0.1456 |
| 7 | 59129 | 59175 | 59145.0 | 3.037 432 343(15) | -6.849 8(12) | 298(22) | 0.0 | 0.038 | 0.4163 |
| Post-Outburst 2020 | |||||||||
| 8 | 59281 | 59418 | 59318.0 | 3.036 433 103(8) | -6.709 6(2) | 5.6(1.0) | 0.0 | 0.022 | 0.0535 |
| 9 | 59434 | 59532 | 59523.0 | 3.035 250 253(16) | -6.667 2(4) | 0.0 | 0.0 | 0.018 | 0.7372 |
| ∗ Entries 1-2 are solely Swift-XRT ToA based covering April 28 – November 4, 2017 (entry-1) and February 18 – November 19, 2018 (entry-2), | |||||||||
| entry 3 is based on a combination of Swift-XRT and NICER ToA’s starting at the first NICER observation performed on | |||||||||
| May 23, 2018 (MJD 58261) and entries 4–9 are solely NICER TOA based. | |||||||||
| ∗ Solar System planetary ephemeris DE200 has been used in the barycentering process. | |||||||||
| † The RMS is the root-mean-square of the deviation from the best fit in phase units. | |||||||||
| ‡ is the phase offset to apply in the phase calculation to obtain consistent alignment (see e.g. Eq. 1 in Kuiper et al., 2018). | |||||||||
3.1 Timing analysis
In this work, constituting an extension of the timing analyses presented in earlier work by Kuiper & Hermsen (2009) and Kuiper et al. (2018), we performed timing analyses of the pre-outburst, outburst and post-outburst episodes of the 2020-outburst using data from NICER- and (for a part of the pre-outburst period, 2017-2018) Swift-monitoring observations to make comparisons between quiescent- and outburst states possible. Swift and NICER monitoring overlapped between May–November 2018 enabling cross-checking and verification of the timing characteristics.
These analyses yielded phase-coherent timing models (ephemerides) in terms of three, sometimes four, timing parameters specifying the frequency , frequency derivative , frequency second and third order derivatives evaluated at a certain epoch t0. These models accurately describe the rotation behavior of the pulsar as a function of time, and so tracking the spin-evolution of the source.
Pulse-phase folding timing data from any instrument using these ephemerides, adopting different energy selections, yielded energy-resolved pulse-phase distributions, often called pulse-profiles. From these the pulse shape as a function of energy can be determined for any emission state of the pulsar.
The models also enable us to separate at any epoch the pulsed emission component from the total emission which has contributions from the surrounding PWN and SNR, and the pulsar itself either pulsed or DC. So, we can study the pulsed flux (or count rate) as a function of time, probing the outburst.
3.1.1 Timing models (ephemerides)
The first step in the timing analysis is the conversion of spacecraft arrival times (usually evaluated in TT or TDT time system) to solar-system barycentered times (TDB time frame) using the instantaneous spacecraft ephemeris (specifying the position and velocity of the spacecraft), solar-system ephemeris (in this work JPL-DE200), a Chandra X-ray based accurate location of the pulsar (Helfand et al., 2003) and for Swift up-to-date clock-correction information. We performed this barycentering process for Swift - XRT (WT-mode) observations 00032031149 – 00032031216 executed between September 15, 2016 and November 19, 2018 (MJD 57646 – 58441). An equivalent (IDL-based) barycentering procedure was used for the NICER observations.
From the barycentered Swift and NICER event lists of each observation (or combination of observations if the exposure of a single observation was too low) we derived so-called pulse arrival times (ToA’s). For Swift-XRT (2.5–10 keV) on average we typically needed 15-20 ks net exposure time to detect the timing signal of J18460258 above in a extraction area centered on the source (see e.g. Sect. 3.1.2 of Kuiper et al., 2018). For NICER (2.5–10 keV) the required net exposure is typically 5–8 ks to reach a significant pulsed signal detection depending on the instantaneous background rate.
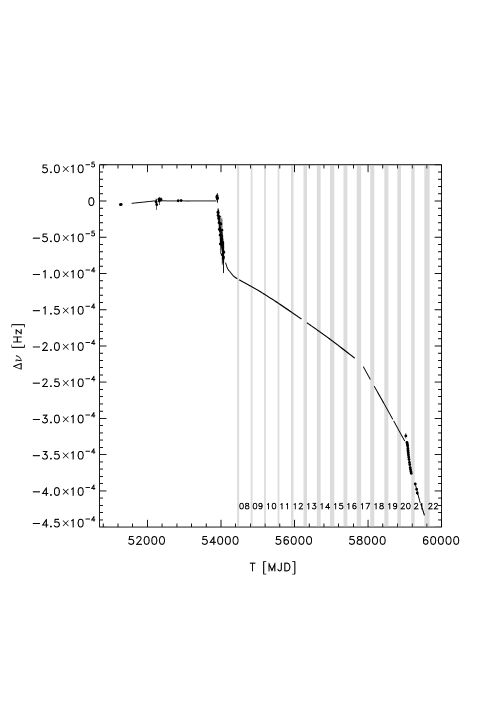
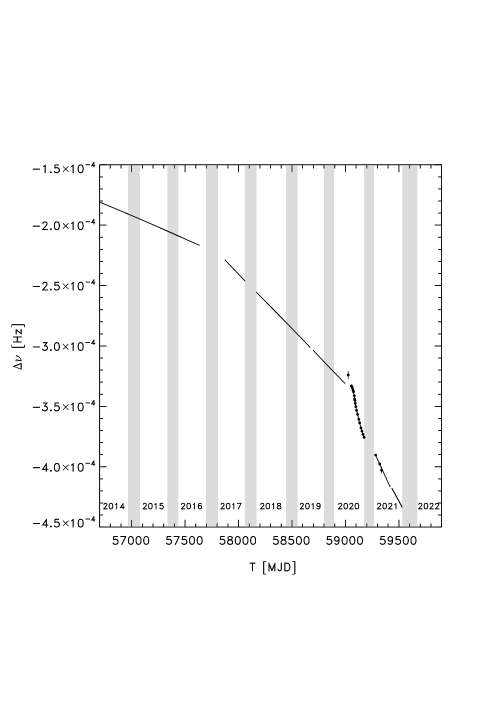
From these ToA’s we constructed phase-coherent timing models covering a year period from April 28, 2017 till November 14, 2021 according to the method outlined in Sect. 4 of Kuiper & Hermsen (2009). The results are listed in Table 1 and consist of eight separate models: four covering the pre-outburst episode (entries 1–4 of which 1–2 are solely based on Swift monitoring), three covering the (densely sampled) outburst period (entries 5–7), and finally two covering the post-outburst era (entries 8–9). The spin-evolution of J18460258 since its discovery in April 1999 with respect to the pre-2006 outburst ephemeris is shown in the left panel of Fig. 2, while the right panel zooms in on the time period analysed in this work. In the latter period from early September 2016 till mid November 2021 we discovered several timing discontinuities in both and which are summarized below:
-
(i)
MJD 57635–57871 (September 4, 2016 - April 28, 2017): A clear glitch in showing an acceleration in the spin-down rate occuring just before or in the 2016–2017 Swift monitoring data gap.
-
(ii)
MJD 58061–58167 (November 4, 2017 - February 18, 2018): Phase-coherence loss during the 2017–2018 Swift monitoring data gap.
-
(iii)
MJD 58671–58698 (July 7, 2019 - August 3, 2019): A small glitch of fractional size occurred during the NICER monitoring. In spite of its small amplitude, the glitch could be well characterized because of the densely sampled NICER ToO-observations in the post-glitch period. Changes in both and were also detected, with values and Hz/s2, all evaluated at an assumed glitch epoch of MJD 58685. This timing glitch could easily be distinguished from red noise.
-
(iv)
MJD 58996–59055 (May 27, 2020 - July 25, 2020): A strong glitch of fractional size , comparable in size to the 2006 outburst (see Sect.4.2 of Kuiper & Hermsen, 2009, for more details), heralded very likely the start of the 2020 outburst of J18460258 .
-
(v)
MJD 59175–59281 (November 11, 2020 - March 8, 2021): Phase-coherence loss during the NICER 2020–2021 data gap of month duration due to one or more glitches.
-
(vi)
MJD 59418–59434 (July 23, 2021 - August 8, 2021): A small glitch of fractional size occured during regular monthly NICER monitoring.
A linear fit to the spin-down rates in Table 1 gives an indication of the effective evolution of this quantity on time, with Hz/s2. This indicates a braking index before the outburst (Swift + NICER data) of . Interestingly, the braking index after the 2006 outburst was seen to decrease from to (Livingstone et al., 2011). Our preliminary measurement indicates that between 2006 and 2020 the rotation somehow went back to its original pre-2006-outburst evolution. There is still not enough data to measure the braking index after the 2020 outburst.

3.1.2 Pulse profile evolution
We applied the timing models listed in Table 1 in a pulse-phase folding procedure to obtain pulse-phase distributions for several different energy bands for the pre-outburst period (split into two parts related to Swift and NICER monitoring), for the outburst episode subdivided into three parts driven by ephemeris validity constraints, and finally for the post-outburst era. The resulting phase-distributions are shown in Figs. 3, 4 and 5 for the pre-outburst, outburst and post-outburst periods, respectively.

The pre-outburst period running from April 28, 2017 to May 27, 2020 was subdivided into two parts with Swift (Pre-II; MJD 57871–58442) and NICER (Pre-I; MJD 58261–58996) monitoring. Pulse phase folding 51 Swift observations, totaling 319.402 ks exposure time, resulted in the phase distributions shown in the upper-left two frames of Fig. 3 with significances of and for the 1–2.5 and 2.5–10 keV bands, respectively. During the Swift monitor period also NuSTAR observed J18460258 during September 17–20, 2017 for ks while the source was in quiescent state. The well-known pulse-shape (see e.g. Fig. 3 of Kuiper & Hermsen, 2009) is clearly visible up to keV in these NuSTAR data (see upper right three frames of Fig. 3). The second part of the pre-outburst period (Pre-I) referred to solely NICER monitoring observations comprising 166.67 ks of (screened) exposure time. The corresponding pulse-phase distributions are shown in the lower-left frames of Fig. 3 for the 1–2.5 ( significance of ) and 2.5–10 keV bands.
The post-outburst period from March 8 – November 13, 2021 (MJD 59281–59531) using merely NICER monitoring observations, totalling 103.55 ks of screened exposure time, shows pulse-phase distributions for the 1–2.5 ( significance of ) and 2.5–10 keV bands (see Fig. 5) equivalent in shape and strength to the corresponding NICER pre-outburst distributions.
It is clear from the pre- and post-outburst observations, representing the quiescent state, that the pulsed emission in the 1–2.5 keV band is weak, mainly coming from events with measured energies in the range 2–2.5 keV.
The situation changed dramatically during the outburst episode (July 25 – November 22, 2020; MJD 59055-59175) that was split into three smaller time segments, indicated by I, II and III (NICER screened exposures 86.014, 40.694 and 20.064 ks, respectively), driven by phase-coherency111During a regular NICER monitoring observation on June 26, 2020 (MJD 59026) the source was already in outburst, however, we could not phase-connect its timing data (see Table 1).
Figure 4 shows the evolution of the pulse morphology and strength for different energy bands during different stages of the outburst as observed by NICER and NuSTAR. The most left column showing the NICER 1–2.5 keV lightcurves demonstrates the emergence of a very strong (soft) pulsed emission component which gradually fades away towards its quiescent level. The pulsed significance in the 1–2.5 keV band evolves from to to for the three segments I, II and III, respectively.
Both the NICER 2.5–10 keV and NuSTAR 3–10 keV bands show a similar fading evolution, however, contrary to the quiescent pulse morphology a prominent ‘shoulder’ or bump appears during segment I observations near phase before primary maximum at phase 0.37. This feature also fades away in course of the outburst. It is also clear from the 1–2.5, 2.5–10 and 3–10 keV pulse-phase distributions that an underlying enhanced DC-component appeared that fades away across the outburst.
On the contrary, the pulsed emission above 10 keV as shown by NuSTAR in the two right most columns of Fig. 4 seems to not vary dramatically and is comparable to its quiescent state properties (c.f. Fig.3; Pre-II - right two panels).

3.1.3 Pulsed flux evolution during the 2020-outburst
From the pulse-phase distributions per observation (or combination of observations) pulsed excess counts can be determined for any energy band by estimating the excess counts above the DC or unpulsed level evaluated from the 0.8–1.05 phase window (off-pulse phase; see e.g. Fig. 3 of Kuiper & Hermsen, 2009). These pulsed excess counts are subsequently converted to rates using the (screened) exposure times of the involved observation(s). The 2.5–10 keV pulsed count-rate across the 2020-outburst episode as observed by NICER is shown in Fig. 1. The different segments - I, II and III - are hatched while solid vertical bars at the bottom of the plot indicate the performed NuSTAR observations. The horizontal dashed line represents the quiescent 2.5–10 keV level and the vertical dotted line indicates the Swift detection of the magnetar-like s burst (Krimm et al., 2020), triggering our NICER ToO program. It is clear from this plot that J18460258 was already in outburst before the occurrence of the magnetar-like burst. Several re-flarings are also visible in Fig. 1 in particular the one on August 21, 2020 (MJD 59082). Initially, we suspected that this was a statistical fluke, however, a deeper study reveals that this enhancement of about 1 hour duration was also clearly detectable in a contemporaneous NuSTAR observation (ObsID: 80602315004), and so demonstrates the validity of the event. The feature mimics a mini-outburst, for the first time introduced by Kuiper et al. (2012) (see their Sect. 3.1.1) in the study of the high-energy characteristics of the 2008 and 2009-outbursts of magnetar 1E1547.05408.
The quiescent state level is reached near MJD 59175 (November 22, 2020), the last NICER observation before the 2020–2021 data gap.
3.2 Spectral Evolution
We carried out spectral fits on the pulsed component only, meaning that the photons collected during off-pulse phases were treated as background and subtracted from the on-pulse spectra. To examine the broadband spectral behavior of the pulsed emission, we first jointly fit NICER and NuSTAR spectra at four different epochs. We used the tbabs model with corresponding interstellar medium abundance as described in Wilms et al. (2000) to determine the hydrogen column density () and linked this parameter across all data sets. The spectra were fit with a two-component model consisting of a hard power law and a soft blackbody. The parameters of these two components are linked between data sets obtained at the same epoch. An additional constant component was introduced to account for the cross-calibration between instruments and the flux difference between data sets.
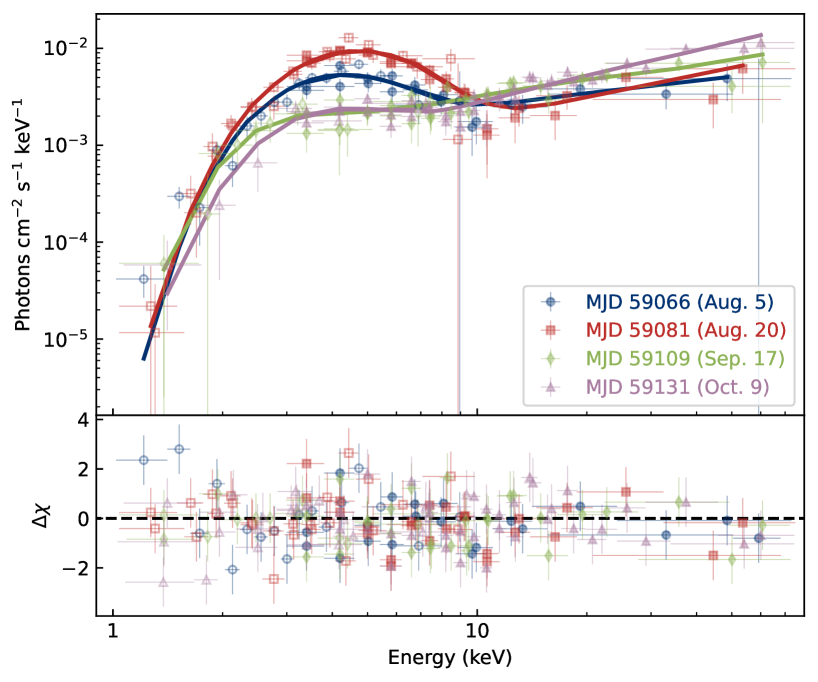
The first NuSTAR observation (ObsID 80602315002) was made together with NICER ObsID 3033290103 on MJD 59066, and we fit these two data sets by linking all the spectral parameters. The other three NuSTAR observations did not have corresponding NICER observations on the same dates, so we performed simultaneous fits with nearby NICER observations that bracketed the NuSTAR ones. For example, we jointly fit the NuSTAR observation on MJD 59081 (ObsID 80602315004) with NICER observations on MJD 59080 and 59082. Similar work was done for observations on MJD 59109 (ObsID 80602315006) and MJD 59131 (ObsID 80602315008). The results are shown in Table 2 and the unfolded spectra of these four data sets are shown in Figure 6. The was constrained to be cm-2. The photon indices of these four data sets varied slightly but remained consistent at around . On the other hand, the blackbody component varied significantly, indicating that the flux variability during the outburst is dominated by changes in the blackbody component. This can also be seen from the pulse profiles as a function of energy.
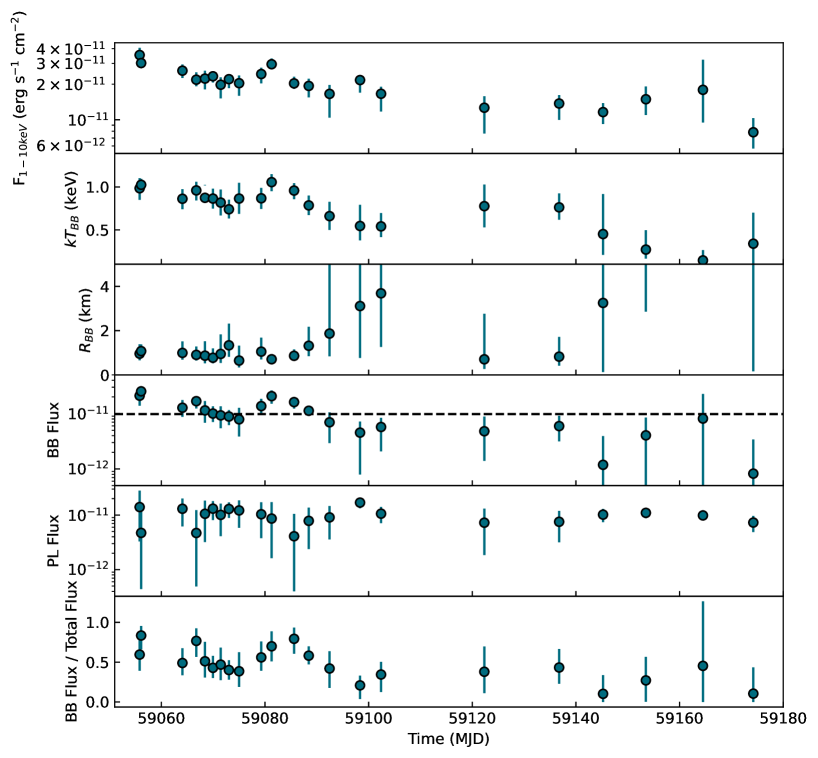
We then traced the spectral evolution in the soft X-ray band using all NICER data sets. We tried to fit individual data sets by freezing the at cm-2 and allowing all the blackbody and power law parameters to be free. However, the NICER energy range is not sensitive to the hard power law component, and the spectral parameters could not be well constrained. Therefore, we froze the at 1.2 and allowed the , , and power-law normalization to be free parameters in the following analysis. Additionally, the number of X-ray photons decreased as the flux decreased and the exposure time of each observation was different. Therefore, we jointly fit one to three data sets by linking the aforementioned three spectral parameters. The resulting unabsorbed fluxes in the 1-10 keV band, fluxes of individual components in the same energy band, and three spectral parameters are shown in Figure 7, and the parameters are shown in Table 3. The overall flux, , and blackbody flux decreased over time. A mini flare on MJD 59082 (August 21) is observed. During the flare, the and flux increased. On the other hand, the power law flux remained constant throughout the entire observation run, suggesting that the outburst is dominated by the increase of the surface emission. A few days after the flare, the blackbody component could not be well constrained and the power law dominated the spectrum in the soft X-ray band.
| Time (MJD) | NuSTAR ObsID | NICER ObsID | (keV) | (km) | |
|---|---|---|---|---|---|
| 59066 | 80602315002 | 3033290103 | |||
| 59081 | 80602315004 | 3033290115,116 | |||
| 59109 | 80602315006 | 3033290126,127 | |||
| 59131 | 80602315008 | 3033290132,135,136 |
| Time | NICER ObsID | Flux | BB Flux | ||
|---|---|---|---|---|---|
| (MJD) | (keV) | (km) | ( erg s-1 cm-2) | ( erg s-1 cm-2) | |
| 59056 | 3598010801 | ||||
| 59056 | 3598010802 | ||||
| 59064 | 3033290101,102 | ||||
| 59067 | 3033290103 | ||||
| 59068 | 3033290105 | ||||
| 59070 | 3033290106,107 | ||||
| 59072 | 3033290108 | ||||
| 59073 | 3033290109,110 | ||||
| 59075 | 3033290111,112 | ||||
| 59079 | 3033290113,114 | ||||
| 59081 | 3033290115,116 | ||||
| 59086 | 3598010901 | ||||
| 59088 | 3033290117,118 | ||||
| 59092 | 3033290119,120 | ||||
| 59098 | 3033290122,123 | ||||
| 59102 | 3033290124,125,126 | ||||
| 59122 | 3033290128,131,132 | ||||
| 59137 | 3033290135,136,137 | ||||
| 59145 | 3598011101 | ||||
| 59154 | 3033290139,141,143 | ||||
| 59165 | 3033290114,146,147 | ||||
| 59174 | 3033290150,3598011201,202 |
Note. — The fluxes are calculated in the energy range of 1–10 keV.
4 Discussion
The August 2020 X-ray outburst was the second magnetar-like outburst from PSR J18460258 since its discovery in 1999, after a 14 year hiatus since its first recorded outburst in 2006. Our NICER GO and ToO observations provided continuous monitoring and timing of the source starting about three and a half years before the 2020 outburst until more than a year following the outburst in November 2021. Our monitoring observations prior to the August 1, 2020 Swift announcement of the outburst showed that the flux was already increasing above quiescent level by late June. Due to our high cadence observations during and following the outburst, we were able to resolve rapid changes in the pulsed flux, which our measurements showed increased by more than a factor of ten above the quiescent level. While this flux increase is much higher than the five-times increase reported for the 2006 outburst (Kuiper & Hermsen, 2009), the flux during that outburst was less densely sampled and timing coherence was lost (Gavriil et al., 2008), so higher flux peaks may have been missed. Both outbursts were accompanied by spin-up glitches of very similar size and in both cases, transient thermal components appeared that were responsible for most of the flux increases. The thermal components and the flux also decayed over similar timescales of several months. However, we observed a change in the X-ray pulse profile during the 2020 outburst, while no change in profile was reported for the 2006 outburst. Overall, the characteristics of the two magnetar-like outbursts of J18460258 are very similar.
PSR J18460258 thus appears to be a unique and fascinating source with a dual nature, behaving most of the time like a RPP and occasionally like a magnetar. It is also an unusual young RPP, having no detected radio or GeV emission. So is it a RPP that is becoming a magnetar, or a magnetar masquerading as a RPP? As we discuss below, the quiescent behavior as well as the outbursts can be interpreted in either scenario but involve very different physical mechanisms for the emission.
First, we consider a pulsar-like model for PSR J18460258 . Harding & Kalapotharakos (2017) presented a model for MeV pulsars like J18460258 in which their lack of radio or GeV emission is due to geometry. In this model, MeV pulsars are the same as the rest of the young RPP population: they have global dipole magnetospheres that are nearly force-free, emit radio emission from above the magnetic poles and -ray and non-thermal X-ray emission from near the current sheet outside the light cylinder (Kalapotharakos et al., 2018; Harding et al., 2021). However, they have small magnetic inclination angles and we view them along lines-of-sight, away from the magnetic poles, that miss both the radio beams and the center of the current sheet where the highest energy acceleration occurs and where the GeV emission is produced. In this model then, the quiescent X-ray emission is synchrotron radiation (SR) from electron-positron pairs near the current sheet, where the shape of the SED derives from the smoothly falling spectrum of the pairs (Harding & Kalapotharakos, 2015; Harding et al., 2021). The magnetar-like outbursts of J18460258 are due to the appearance of or a change in a toroidal surface magnetic field component that provides a field twist, and more particle acceleration and pair production near the surface. The increased pair multiplicity increases the polar cap heating and opens up more field lines, increasing the size of the polar caps. If our line-of-sight then crosses nearer to the larger heated polar cap, we will temporarily see a thermal component, but we can still miss the radio emission since it is more tightly beamed than the thermal emission. However, in this case the thermal component will not be in phase with the non-thermal SR pulse which is a major drawback for this model. The measurements of a braking index in J18460258 (Livingstone et al., 2011) with values typical of RPPs may add support to the RPP model. However, it is unclear what we should expect for magnetar braking indices and why they have not been detected.
Next, we consider a magnetar-like model in which the quiescent X-ray emission from J18460258 is resonant inverse-Compton scattering emission (RICS) from particles accelerated by field twists and scattering thermal photons from the hot neutron star surface (Baring & Harding, 2007; Beloborodov, 2013). We do not see any GeV emission because photon splitting and pair production attenuate the RICS spectrum above about 1 MeV (Wadiasingh et al., 2019). The outbursts are then typical magnetar bursts where crustal motions cause increases in the magnetic field twists, particle acceleration and RICS emission. The increased particle acceleration and pair/splitting cascades produce visible heated spots due to particle surface bombardment (Beloborodov, 2013). Since this emission occurs on closed field lines near the equator, we could miss any transient radio emission along open field lines. There are several potential drawbacks in this model. If the quiescent emission is RICS, why don’t we see a quiescent thermal component as appears in magnetars? Supporting the non-observed thermal component, many/most young magnetars have X-ray luminosities (see eg. magnetar review by Kaspi & Beloborodov (2017)), which would translate to fluxes at 6.5 kpc, lower than the observed fluxes in Table 3. Perhaps this component is much weaker or non-existent for J18460258 because its magnetic activity is not persistent enough to produce heated spots from particle bombardment, and with the geometry for J18460258 proposed above, we would not see the heated polar caps in quiescence. In addition, there is no significant change in flux or spectrum of the power-law component during the outburst. Also, magnetar pulse profiles are typically more complex than that of J18460258 (Hu et al., 2019) but this could result from less persistent magnetic field activity as well. In addition, the X-ray luminosity of J18460258 is less than its spin down power, whereas for magnetars the X-ray luminosity exceeds the spin-down power by several orders of magnitude. Finally, one could argue that the SED of J18460258 is closer to the smooth SR-like spectrum of RPPs like the Crab and B150958 (Kuiper et al., 2018) that do not show the sharp cutoff predicted for magnetar SEDs (Wadiasingh et al., 2019). However, at the moment there are no detected spectral points in the SED of J18460258 between 200 keV and 30 MeV so a sharp attenuation cutoff could exist. In addition, both the quiescent and outburst X-ray spectra of J18460258 is very close to the spectrum of magnetar RXS J170840 (Kuiper & Hermsen, 2009). The true test then of a pulsar-like vs. a magnetar-like model for PSR J18460258 is a measurement of its SED between 200 keV and 30 MeV.
Regardless of whether the pulsar-like or magnetar-like model for J18460258 is more plausible, the existence and behavior of J18460258 and J11196127 suggest a continuum of neutron stars that lie between RPPs and magnetars. The enhanced quiescent thermal emission observed from them and several other high-B RPPs supports such a continuum (Kaspi & McLaughlin, 2005; Ng et al., 2012; Olausen et al., 2013; Hu et al., 2017). In fact, the characteristics of J18460258 are similar to those of transient Anomalous X-Ray Pulsars (Livingstone et al., 2010) and may indicate a link between RPPs and magnetars. An additional similarity between RPPs and magnetars is the discovery of a wind nebula around the canonical magnetar Swift J1834.90846 (Younes et al., 2016). What is less clear is their direction of evolution. Espinoza et al. (2011, 2022) showed that the high-B pulsar J1734333 is evolving towards the magnetars (based on its braking index). There is no evidence for magnetar X-ray behavior for this pulsar, but this result may indicate the direction of evolution. Since both J18460258 and J11196127 are very young, it is possible that a stronger interior magnetic field is in the process of emerging over a timescale yr (Bhattacharya & Soni, 2008). After the 2006 outburst of J18460258 , its braking index was observed to decrease by 18% (Livingstone et al., 2011), which could be caused by an increase in magnetic field strength (Blandford et al., 1983; Ho, 2015). Yet, such sources may have been born with stronger magnetic fields that are in the final stage of decaying (Pons et al., 2009; Viganò et al., 2013; Gourgouliatos et al., 2016). Continued X-ray monitoring of J18460258 as well as expanded spectral coverage will be crucial in understanding of its true nature and place in neutron star evolution.
References
- Archibald et al. (2016) Archibald, R. F., Kaspi, V. M., Tendulkar, S. P., & Scholz, P. 2016, ApJ, 829, L21, doi: 10.3847/2041-8205/829/1/L21
- Baring & Harding (2007) Baring, M. G., & Harding, A. K. 2007, Ap&SS, 308, 109, doi: 10.1007/s10509-007-9326-x
- Beloborodov (2013) Beloborodov, A. M. 2013, ApJ, 762, 13, doi: 10.1088/0004-637X/762/1/13
- Bhattacharya & Soni (2008) Bhattacharya, D., & Soni, V. 2008, in Bulletin of the Astronomical Society of India Proceedings, Vol. 25, Bulletin of the Astronomical Society of India Proceedings, 47
- Blandford et al. (1983) Blandford, R. D., Applegate, J. H., & Hernquist, L. 1983, MNRAS, 204, 1025, doi: 10.1093/mnras/204.4.1025
- Blumer et al. (2021) Blumer, H., Safi-Harb, S., McLaughlin, M. A., & Fiore, W. 2021, ApJ, 911, L6, doi: 10.3847/2041-8213/abf11d
- Burrows et al. (2005) Burrows, D. N., Hill, J. E., Nousek, J. A., et al. 2005, Space Sci. Rev., 120, 165, doi: 10.1007/s11214-005-5097-2
- Espinoza et al. (2011) Espinoza, C. M., Lyne, A. G., Kramer, M., Manchester, R. N., & Kaspi, V. M. 2011, ApJ, 741, L13, doi: 10.1088/2041-8205/741/1/L13
- Espinoza et al. (2022) Espinoza, C. M., Vidal-Navarro, M., Ho, W. C. G., Deller, A., & Chatterjee, S. 2022, A&A, 659, A41, doi: 10.1051/0004-6361/202142598
- Gavriil et al. (2008) Gavriil, F. P., Gonzalez, M. E., Gotthelf, E. V., et al. 2008, Science, 319, 1802, doi: 10.1126/science.1153465
- Gehrels et al. (2004) Gehrels, N., Chincarini, G., Giommi, P., et al. 2004, ApJ, 611, 1005, doi: 10.1086/422091
- Gotthelf et al. (2000) Gotthelf, E. V., Vasisht, G., Boylan-Kolchin, M., & Torii, K. 2000, ApJ, 542, L37, doi: 10.1086/312923
- Gourgouliatos et al. (2016) Gourgouliatos, K. N., Wood, T. S., & Hollerbach, R. 2016, Proceedings of the National Academy of Science, 113, 3944, doi: 10.1073/pnas.1522363113
- Harding & Kalapotharakos (2015) Harding, A. K., & Kalapotharakos, C. 2015, ApJ, 811, 63, doi: 10.1088/0004-637X/811/1/63
- Harding & Kalapotharakos (2017) Harding, A. K., & Kalapotharakos, C. 2017, in Proceedings of the 7th International Fermi Symposium, 6. https://arxiv.org/abs/1712.02406
- Harding et al. (2021) Harding, A. K., Venter, C., & Kalapotharakos, C. 2021, ApJ, 923, 194, doi: 10.3847/1538-4357/ac3084
- Helfand et al. (2003) Helfand, D. J., Agüeros, M. A., & Gotthelf, E. V. 2003, ApJ, 592, 941, doi: 10.1086/375838
- Ho (2015) Ho, W. C. G. 2015, MNRAS, 452, 845, doi: 10.1093/mnras/stv1339
- Hu et al. (2019) Hu, C.-P., Ng, C.-Y., & Ho, W. C. G. 2019, MNRAS, 485, 4274, doi: 10.1093/mnras/stz513
- Hu et al. (2017) Hu, C.-P., Ng, C. Y., Takata, J., Shannon, R. M., & Johnston, S. 2017, ApJ, 838, 156, doi: 10.3847/1538-4357/aa67e3
- Kalapotharakos et al. (2018) Kalapotharakos, C., Brambilla, G., Timokhin, A., Harding, A. K., & Kazanas, D. 2018, ApJ, 857, 44, doi: 10.3847/1538-4357/aab550
- Kaspi & Beloborodov (2017) Kaspi, V. M., & Beloborodov, A. M. 2017, ARA&A, 55, 261, doi: 10.1146/annurev-astro-081915-023329
- Kaspi & McLaughlin (2005) Kaspi, V. M., & McLaughlin, M. A. 2005, ApJ, 618, L41, doi: 10.1086/427628
- Krimm et al. (2020) Krimm, H. A., Lien, A. Y., Page, K. L., et al. 2020, GRB Coordinates Network, 28187, 1
- Kuiper et al. (2020) Kuiper, L., Harding, A. K., Enoto, T., et al. 2020, The Astronomer’s Telegram, 13985, 1
- Kuiper & Hermsen (2009) Kuiper, L., & Hermsen, W. 2009, A&A, 501, 1031, doi: 10.1051/0004-6361/200811580
- Kuiper & Hermsen (2015) —. 2015, MNRAS, 449, 3827, doi: 10.1093/mnras/stv426
- Kuiper et al. (2018) Kuiper, L., Hermsen, W., & Dekker, A. 2018, MNRAS, 475, 1238, doi: 10.1093/mnras/stx3128
- Kuiper et al. (2012) Kuiper, L., Hermsen, W., den Hartog, P. R., & Urama, J. O. 2012, ApJ, 748, 133, doi: 10.1088/0004-637X/748/2/133
- Kumar & Safi-Harb (2008) Kumar, H. S., & Safi-Harb, S. 2008, ApJ, 678, L43, doi: 10.1086/588284
- Livingstone et al. (2010) Livingstone, M. A., Kaspi, V. M., & Gavriil, F. P. 2010, ApJ, 710, 1710, doi: 10.1088/0004-637X/710/2/1710
- Livingstone et al. (2011) Livingstone, M. A., Ng, C. Y., Kaspi, V. M., Gavriil, F. P., & Gotthelf, E. V. 2011, ApJ, 730, 66, doi: 10.1088/0004-637X/730/2/66
- Ng et al. (2012) Ng, C. Y., Kaspi, V. M., Ho, W. C. G., et al. 2012, ApJ, 761, 65, doi: 10.1088/0004-637X/761/1/65
- Ng et al. (2008) Ng, C. Y., Slane, P. O., Gaensler, B. M., & Hughes, J. P. 2008, ApJ, 686, 508, doi: 10.1086/591146
- Olausen et al. (2013) Olausen, S. A., Zhu, W. W., Vogel, J. K., et al. 2013, ApJ, 764, 1, doi: 10.1088/0004-637X/764/1/1
- Pons et al. (2009) Pons, J. A., Miralles, J. A., & Geppert, U. 2009, A&A, 496, 207, doi: 10.1051/0004-6361:200811229
- Viganò et al. (2013) Viganò, D., Rea, N., Pons, J. A., et al. 2013, MNRAS, 434, 123, doi: 10.1093/mnras/stt1008
- Wadiasingh et al. (2019) Wadiasingh, Z., Younes, G., Baring, M. G., et al. 2019, BAAS, 51, 292. https://arxiv.org/abs/1903.05648
- Wilms et al. (2000) Wilms, J., Allen, A., & McCray, R. 2000, ApJ, 542, 914, doi: 10.1086/317016
- Younes et al. (2016) Younes, G., Kouveliotou, C., Kargaltsev, O., et al. 2016, ApJ, 824, 138, doi: 10.3847/0004-637X/824/2/138