Electron phonon coupling and superconductivity in -MoB2 as a function of pressure
Abstract
We have studied the lattice dynamics, electron-phonon coupling, and superconducting properties of -MoB2, as a function of applied pressure, within the framework of density functional perturbation theory using a mixed-basis pseudopotential method. We found that phonon modes located along the AH, HL, and LA high-symmetry paths exhibit large phonon linewidths and contribute significantly to the electron-phonon coupling constant. Although linewidths are particularly large for the highest-frequency optical phonon modes (dominated by B vibrations), their contribution to the electron-phonon coupling constant is marginal. The latter is largely controlled by the acoustic low-frequency modes of predominantly Mo character. It was observed that at a pressure of GPa, where -MoB2 forms, the phonon-mediated pairing falls into the strong-coupling regime, and the estimate for the superconducting critical temperature agrees well with experimental observations. When further increasing the applied pressure, a reduction of is predicted, which correlates with a hardening of the acoustic low-frequency phonon modes and a decrease of the electron-phonon coupling parameter.
oseaman@ifuap.buap.mx
Keywords: first-principles calculations, phonons, electron-phonon
coupling, superconductivity
1 Introduction
The discovery of superconductivity in MgB2 more than twenty 20 years ago [1], with a critical temperature of K, energized the search for new superconducting materials within the family of diborides. Such a quest was pursued almost immediately after its discovery both experimentally and computationally [2]. After several years of research, the conclusion was reached that MgB2 is already optimized by nature, in the sense that attempts to improve its superconducting properties by doping [3, 4, 5, 6] or pressure [7, 8] always resulted in a reduction of in comparison with MgB2, or even in a non-superconducting material, like the sibling system AlB2 [9].
Transition-metal diborides constitute an important sub-class in this context. A typical example studied was NbB2 with a wide range of measured from K to K [10, 11, 12]. MoB2 attracted attention as well. While it is not a superconductor in its pristine form, superconductivity can be induced by substitution of % Zr with a K [13]. It was not until 2022 that the discovery of superconductivity in MoB2 under applied pressure was reported [14]. At an applied pressure of approximately GPa, MoB2 becomes superconducting with a very low of less than K. At these pressures, MoB2 takes a rhombohedral crystal structure (space group ), known also as -MoB2. rapidly increases as a function of pressure, reaching K at a pressure of GPa, where it gradually transforms into the hexagonal -MoB2 structure (space group , no. [15]). With further increase of pressure, -MoB2 experiences a less dramatical increase, which culminates at GPa in a maximum of K [14].
Theoretical calculations have suggested that the mechanism for such a high value in -MoB2 is quite different from the one in MgB2. In particular, while for MgB2 the pairing is coming from the strong coupling between the -bands and the B-related phonon modes [16, 17, 18, 19], in MoB2 the pairing involves electronic states of the Mo- character and a combination of Mo-related low-frequency phonon modes with B-dominated ones [14, 20]. In fact, Quan et al[20] concluded that the source of the MoB2 is the so called electron-displaced atom scattering factor , which is closely related to the electron-phonon (e-ph) matrix elements of the Eliashberg theory [21] (see equation 3). However, a detailed analysis about how this factor and other ingredients involved in conventional superconductivity (like phonon frequencies, linewidths, or electron-phonon coupling parameter) are evolving as a function of pressure is lacking.
In this paper we present a thorough study of the lattice dynamics, electron-phonon coupling, and superconducting of -MoB2 as a function of applied pressure, from GPa to GPa, within the framework of density functional theory (DFT) [22] and density functional perturbation theory (DFPT) [23, 24, 25, 26] using a mixed-basis pseudopotential method [27]. Superconducting properties are analyzed in the framework of the Eliashberg theory [21]. We give a detailed description of the phonon linewidths and electron-phonon coupling as a function of applied pressure. In particular, we analyze the contributions of different phonon modes to these quantities, and determine its specific role for inducing the high value of -MoB2. For comparison, we also present a similar analysis for the sibling system NbB2, which is a low- superconductor with intermediate coupling. The paper is organized as follows. In section 2 we describe the computational details of our calculations. The results for the evolution of lattice dynamics, e-ph coupling and as a function of pressure are presented in section 3. Finally, in section 4 the main findings are summarized.
2 Computational details
The present density-functional calculations [22] were performed with the mixed-basis pseudopotential method (MBPP) [27]. Norm-conserving pseudopotentials for Mo, Nb, and B were generated according to the Vanderbilt description [28] and include partial-core correction. For Mo and Nb, semicore and states were taken into the valence space. The current method applies a mixed-basis scheme, which uses a combination of local functions and plane waves for the representation of the valence states. We used , , and -type functions for Mo and Nb, while for B only and -type, supplemented by plane waves up to a kinetic energy of Ry. Present calculations were performed with the PBE [29] form of the GGA exchange-correlation functional. The Monkhorst-Pack special -point sets technique, with a Gaussian smearing of eV and a grid of , was used for the the Brillouin-zone integration. Phonon properties are calculated via density functional perturbation theory (DFPT) [23, 24] as implemented in the MBPP code [25, 26]. The phonon dispersions are obtained by a Fourier interpolation of dynamical matrices calculated on a -point mesh. For the calculation of e-ph coupling matrix elements, a denser -point mesh was necessary.
Through the knowledge of the phonon dispersion and e-ph matrix elements the Eliashberg function is accessible,
| (1) |
with as the electronic density of states at the Fermi level, per atom and spin; as the frequency of the phonon mode at the -vector and branch , and the phonon linewidths given by
| (2) |
where is the one-electron band energy with momentum and band index . In the last equation, represents the coupling matrix element for scattering of an electron from a electronic state to another state, by a phonon , and is given by
| (3) |
with as the mass of the -th atom in the unit cell, and as the normalized eigenvector of the corresponding phonon mode . The quantity represents the first-order change of the total crystal potential, with respect to the displacement of the -th atom in the direction.
From we can obtain some useful integrated quantities, like the average Allen-Dynes characteristic phonon frequency
| (4) |
the square-average phonon frequency
| (5) |
the average e-ph coupling constant
| (6) |
as well as the frequency-dependent , given by:
| (7) |
3 Results and discussion
The -MoB2 has an AlB2-type structure, consisting of planar close packed layers of Mo (at , Wyckoff position) and B atoms (at , Wyckoff position) alternated along the -axis of the hexagonal unit cell [14, 31, 15]. Its structure was fully optimized by energy minimization, that is, for each fixed the parameter was optimized in order to get the and equations of state (see figure 1).
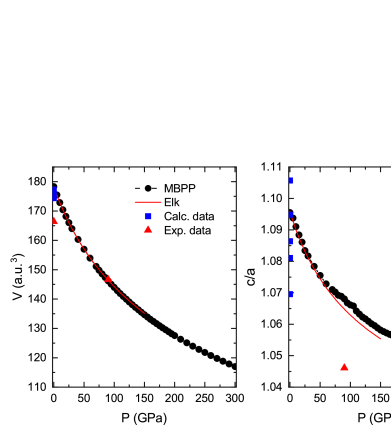
The current results are compared with available experimental data [14, 31], as well as reported calculated values [33, 34, 35, 36, 37]. Our results are in remarkable agreement with the data of Pei et al[14, 31] at GPa for both, the volume (a difference of around %) and also the ratio (difference of %). In addition, structure-optimization calculations were also performed with the full-potential Elk code [32], showing an excellent agreement with the MBPP-code calculations, which demonstrates the high accuracy of the constructed pseudopotentials.
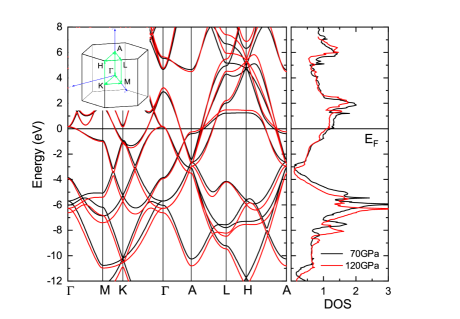
The comparison of the electronic band structure and density of states for two different pressure values, GPa and GPa, is presented in figure 2. As already pointed out previously [20], the bands around the Fermi level () are dominated by the Mo states, with a very minor participation of B states. This property is maintained across the whole pressure range, and results in very modest changes around the Fermi level. The main pressure effects are a band-width increase and a small reduction of the states at the Fermi level ().
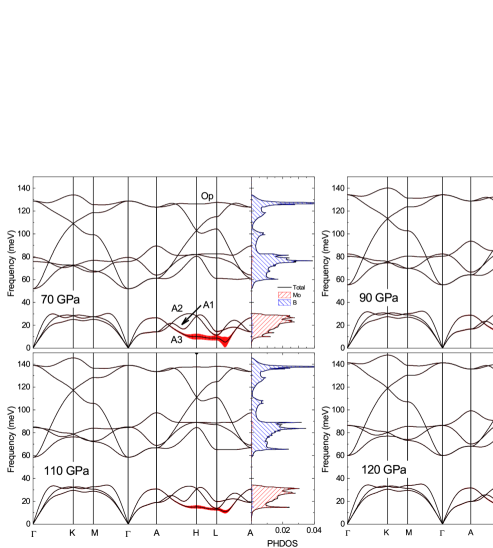
In figure 3 the phonon dispersion along high-symmetry directions as well as its corresponding phonon density of states (PHDOS), for specific applied pressure values, are presented. The chosen pressures span across the stability region of the -MoB2 structure [14]. The main characteristics of the phonon spectrum, as previously observed [14, 20], are found for the whole pressure range. On the one hand, the low-frequency region dominated by Mo vibrations; the high-frequency one ruled by B modes; and the frequency gap that separates them. On the other hand, the acoustic low-frequency modes along the L-A path, which exhibit a phonon anomaly close to L-point, as well as the soft acoustic branches along the A-H and H-L paths. Interestingly, the acoustic mode with lowest frequency (labeled as A) is the one with the largest e-ph coupling constant contribution, given by the red vertical lines in figure 3. In general, the main effect of the applied pressure on the phonon spectra is a generalized hardening of the phonon frequencies, which directly weakens the observed phonon anomaly at the L-A path, and reduces at the same time its strong e-ph contribution.
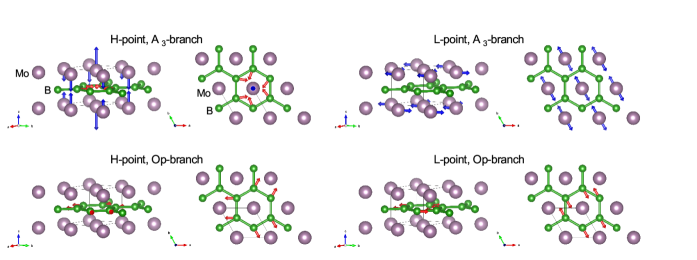
In addition, we also present the phonon modes corresponding to the acoustical A and optical Op branches at the H- and L-points of the IBZ (figure 4). The displacement patterns show that the A related modes are clearly dominated by Mo atoms, while the Op ones are ruled completely by the B atoms.
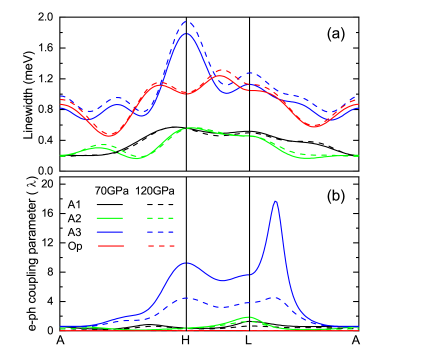
A closer inspection of the individual phonon linewidths and mode couplings revealed that important contributions are attributed to the acoustic phonon branches (A, A, and A) and the highest optic one (Op), in particular along at the AHLA paths (figure 3). In figure 5, linewidths and e-ph coupling constants of these modes are show along these high-symmetry directions for two pressures. The largest linewidths (figure 5a) are found for the A branch, with a particular strong peak located at the H-point, followed closely by the Op branch. These results indicate an important participation of phonon modes dominated by Mo (A) and also by B (Op) in the e-ph coupling (equation 2) reflected by the phonon linewidths (equation 3). However, for the e-ph coupling constants shown in figure 5b, the influence of B phonon-modes is faded away due to the factor entering its definition (equation 6). In contrast, the large e-ph coupling constants of the acoustic branch A is boosted by the low frequencies of these Mo phonon modes, especially around the phonon anomaly close to the L-point. With increasing pressure, while the linewidths increase a little bit, strongly reduces, correlating with the observed hardening of this acoustic branch.
In order to analyze the evolution of the superconducting properties as a function of pressure, the Eliashberg function , the e-ph coupling constant , the Allen-Dynes characteristic phonon frequency , and the square-average phonon frequency were calculated for each case.
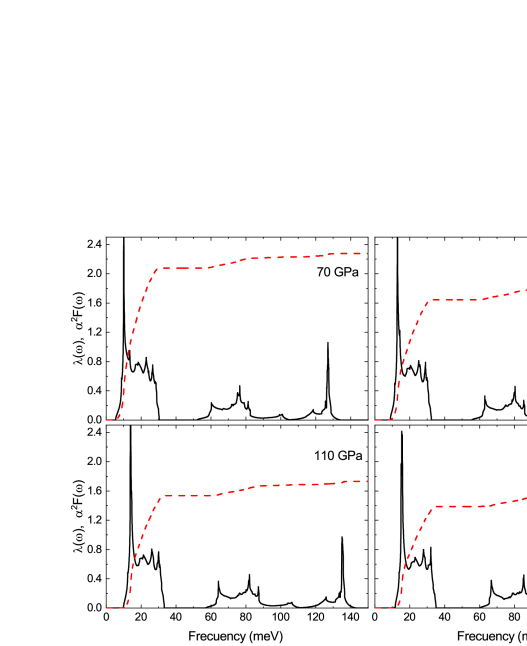
The Eliashberg functions for selected pressures are presented in figure 6, together with . In all cases, the largest contribution for and comes from the acoustic low-frequency region, dominated almost completely by Mo phonon modes along the A-H, H-L, and specially the L-A paths, where the phonon anomaly is located. As expected, the largest coupling corresponds to the pressure that is closest to the phase transition: GPa with . As pressure increases, the coupling reduces, at the same time that the observed phonon anomaly attenuates, which is a direct consequence of the general hardening of the phonon spectrum, as previously discussed.
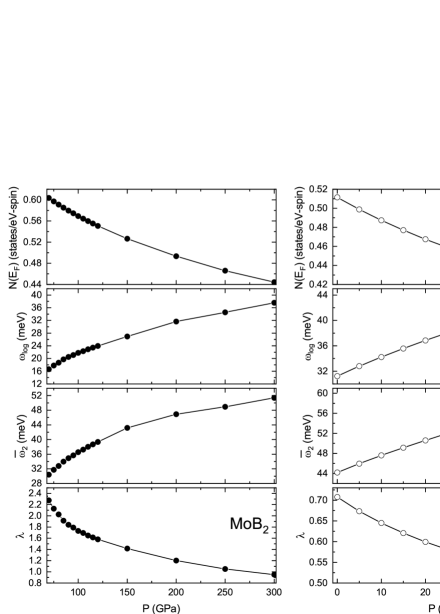
The evolution of the coupling related quantities, namely the density of states at the Fermi level (), , , and , as a function of pressure, are presented in figure 7. There is a nice agreement of these quantities with the reported values in literature at GPa [14, 20], although our calculated is slightly larger (between % and %). This can be due to the slight difference on the structural parameters (see figure 1) or pseudopotential construction. From the evolution of , it can be seen that the strong pressure dependence of the coupling is coming mainly from the low-frequency phonons (traced by and ), while does not exhibit dramatic changes as a function of pressure. -MoB2 remains in the strong-coupling regime until GPa, where , while meV, and meV.
For comparison, we also calculated the same e-ph parameters, as a function of applied pressure, for the sibling compound NbB2 (with the same crystal structure) at its own optimized structural parameters (see figure 7). NbB2 was studied more or less at the same time when superconductivity in MgB2 was discovered. This was done with the idea to find related materials with improved superconducting properties. It turned out, however, that NbB2 has an intermediate coupling () and a low value (approx. K) [40]. Although NbB2 has lower values than MoB2 (the highest calculated for NbB2 is at GPa), the trends as a function of pressure for the coupling-related quantities are basically the same: a reduction of , a phonon hardening, and a decrease.
In order to analyze the evolution of as a function of pressure, we applied three different schemes: , the standard Allen-Dynes equation [41],
| (8) |
, the corrected Allen-Dynes equation for strong-coupling systems (normally for ) [41],
| (9) |
where the correction factors to describe the strong-coupling regime are
| (10) | |||
| (11) |
and the parameters and given by
| (12) | |||
| (13) |
and finally , by solving the isotropic Eliashberg gap equations [21, 30] numerically, , using the calculated for each considered pressure.
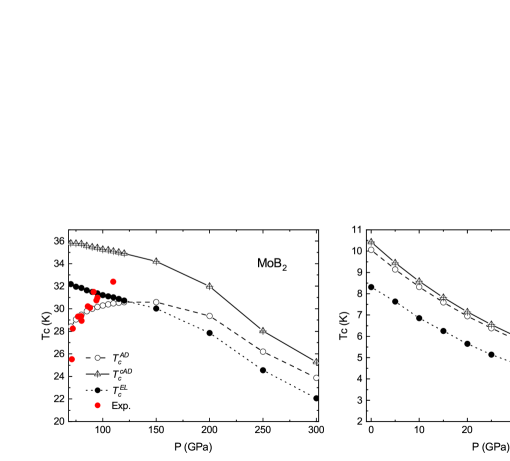
Results obtained for the three schemes, for both -MoB2 and NbB2, are presented in figure 8, using in all cases the same Coulomb pseudopotential parameter , in order to be as close as possible to the previously reported values for GPa [14, 20]. As expected, there are quantitative differences between the estimates, in particular for the low-pressure region, where -MoB2 is in the strong-coupling regime. While both strong-coupling schemes ( and ) predict a monotonous superconducting temperature reduction as a function of pressure, first increases slightly from GPa to approximately GPa, followed by a decrease. For GPa, and are getting closer, a clear indication of the transition to a more moderate coupling region. For NbB2, all three estimates reveal the same pressure dependence, while and agree almost quantitatively. This behavior is expected, since NbB2 has an e-ph coupling that goes from intermediate to low coupling strength, as applied pressure increases. From these results it is clear that the use of is not adequate for a strong-coupling system like -MoB2, showing misleading values and even wrong tendencies, as noted previously [20]. A possible reason of the apparent disagreement between our calculated with experimental data [14] is that, very likely, the measured MoB2 samples below GPa possess a different crystal structure, or consist of a mix of different phases, as mentioned by the authors of the experimental work. However, for pressures at (or above) GPa, our calculated (by solving the Eliashberg gap equations) are around K from the reported measurements and, interestingly, shows the best agreement with the reported experimental data at GPa. We note that, within the framework of the Eliashberg theory, solving the (isotropic) gap equations with as input is the most direct way to calculate the superconducting temperature, and is superior to the other two approaches, which only provide approximations to its solution. Such a reduction as a function of applied pressure, as obtained from our calculations for -MoB2 and NbB2, is also observed experimentally for Nb-substituted MoB2 (Nb0.25Mo0.75B2) [42]. There, a steady reduction is reported from K at GPa to K at GPa, followed by a gradual rise to K at GPa that is accompanied by a significant broadening of the superconducting transition width [42].
4 Conclusions
To summarize, we have performed a first-principles linear-response study of the lattice dynamical properties, electron-phonon coupling, and superconductivity of -MoB2 as a function of applied pressure (from GPa to GPa). We found that the electron-phonon interaction induces large phonon linewidths for modes located specifically along the AH, HL, and LA high-symmetry paths, where a phonon anomaly is present. The largest linewidths are displayed by the highest-frequency optical phonon mode (ruled by B vibrations) and the acoustic low-frequency phonon modes (involving mainly Mo atoms). However, the contribution of the optical phonon mode to the electron-phonon coupling constant is diminished because of its high-frequency value, while the dominating one is coming from the lowest-frequency acoustic phonon mode. As pressure increases, the phonon spectrum hardens, in particular the acoustic low-frequency phonon modes, and the electron-phonon coupling constant decreases, while the density of states at the Fermi level barely changes. Estimates for , obtained either way by the corrected Allen-Dynes equation or by solving the Eliashberg gap equations, show a decrease as a function of applied pressure, which correlates with the phonon hardening and the reduction of . We found a good agreement between the experimental values and the calculated ones for GPa and GPa. However, data for larger applied pressure values are needed to allow a more complete assessment of the predicted tendencies of for -MoB2.
References
References
- [1] Nagamatsu J, Nakagawa N, Muranaka T, Zenitani Y and Akimitsu J 2001 Nature 410 63
- [2] Buzea C and Yamashita T 2001 Supercond. Sci. Technol. 14 R–115
- [3] Kazakov S M, Karpinski J, Jun J, Geiser P, Zhigadlo N D, Puzniak R and Mironov A V 2004 Physica C 408-410 123
- [4] Karpinski J, Zhigadlo N D, Schuck G, Kazakov S M, Batlogg B, Rogacki K, Puzniak R, Jun J, Müller E, Wägli P, Gonelli R S, Daghero D, Ummarino G A and Stepanov V A 2005 Phys. Rev. B 71 174506
- [5] Daghero D, Delaude D, Calzolari A, Tortello M, Umarino G U, Gonnelli R S, Stepanov V A, Zhigadlo N D, Katrych S and Karpinski J 2008 J. Phys.: Condens. Matter 20 085225
- [6] la Peña Seaman O D, de Coss R, Heid R and Bohnen K P 2010 Phys. Rev. B 82 224508
- [7] Monteverde M, nez Regueiro M N, Rogado N, Regan K A, Hayward M A, He T, Loureiro S M and Cava R J 2001 Science 292 75
- [8] Wang Y, Lv J, Ma Y, Cui T and Zou G 2009 Phys. Rev. B 80 092505
- [9] Renker B, Bohnen K P, Heid R, Ernst D, Shober H, Koza M, Adelmann P, Schweiss P and Wolf T 2002 Phys. Rev. Lett. 88 067001
- [10] Leyarovska L and Leyarovski E 1979 J. Less-Common Met. 67 249
- [11] Kotegawa H, Ishida K, Kitaoka Y, Muranaka T, Nakagawa N, Takagiwa H and Akimitsu J 2002 Physica C 378-381 25
- [12] Takeya H, Togano K, Sung Y S, Mochiku T and Hirata K 2004 Physica C 408-410 144
- [13] Muzzy L E, Avdeev M, Lawes G, Haas M K, Zandbergen H W, Ramirez A P, Jorgensen J D and Cava R J 2002 Physica C 382 153
- [14] Pei C, Zhang J, Wang Q, Zhao Y, Gao L, Goung C, Tian S, Luo R, Li M, Yang W, Lu Z Y, Lei H, Liu K and Qi Y 2023 Natl. Sci Rev. nwad034
- [15] Jones M and Marsh R 1954 J. Am. Chem. Soc. 76 1434
- [16] Kortus J, Mazin I I, Belashchenko K D, Antropov V P and Boyer L L 2001 Phys. Rev. Lett. 86 4656
- [17] Floris A, Sanna A, Lüders M, Profeta G, LAthiotakis N N, Marques M A L, Franchini C, Gross E K U, Continenza A and Massidda S 2007 Physica C 456 45
- [18] Bohnen K P, Heid R and Renker B 2001 Phys. Rev. Lett. 86 5771
- [19] Geerk J, Schneider R, Linker G, Zaitsev A G, Heid R, Bohnen K P and v Löhneysen H 2005 Phys. Rev. Lett. 94 227005
- [20] Quan Y, Lee K W and Pickett W E 2021 Phys. Rev. B 104 224504
- [21] Eliashberg G M 1960 Sov. Phys. JETP 11 696
- [22] Kohn J W and Sham L J 1965 Phys. Rev. 140 A1133
- [23] Louie S G, Ho K M and Cohen M L 1979 Phys. Rev. B 19 1774
- [24] Baroni S, de Gironcoli S and Corso A D 2001 Rev. Mod. Phys. 73 515
- [25] Heid R, Bohnen K P and Ho K M 1998 Phys. Rev. B 57 7407
- [26] Heid R and Bohnen K P 1999 Phys. Rev. B 60 R3709
- [27] Meyer B, Elssser C, Lechermann F and Fhnle M FORTRAN90 Program for Mixed-Basis Pseudopotential Calculations for Crystals, Max-Planck-Institut fr Metallforschung, Sttutgart (unplublished)
- [28] Vanderbilt D 1985 Phys. Rev. B 32 8412
- [29] Perdew J P, Burke K and Ernzerhof M 1996 Phys. Rev. Lett. 77 3865
- [30] Marsiglio F and Carbotte J 2003 I. Conventional and High- Superconductors pp 231
- [31] Tao Q, Zhao X, Chen Y, Li J, Li Q, Ma Y, Li J, Cui T, Zhu P and Wang X 2013 RSC Advances 3 18317
- [32] The Elk Code http://elk.sourceforge.net/
- [33] Qi C, Jiang Y, Liu Y and Zhou R 2014 Ceram. Int. 40 5843
- [34] Ding L P, Shao P, Zhang F H, Lu C, Ding L, Ning S Y and Huang X F 2016 Inorg. Chem. 55 7033
- [35] Xu X, Fu K, Yu M, Lu Z, Zhang X, Liu G and Tang C 2014 J. Alloy Compd. 607 198
- [36] Shein I R and Ivanovskii L 2006 Phys. Rev. B 73 144108
- [37] Deligoz E, Colakoglu K and Ciftci Y O 2010 Phys. Rev. B 150 405
- [38] Kokalj A 1999 J. Mol. Graphics Modelling 17 176
- [39] Momma K and Izumi F 2011 J. Appl. Crystallogr. 44 1272
- [40] Heid R, Renker B, Shober H, Adelmann P, Ernst D and Bohnen K P 2003 Phys. Rev. B 67 180510(R)
- [41] Allen P B and Dynes R C 1975 Phys. Rev. B 12 905
- [42] Lim J, Sinha S, Hire A C, Kim J S, Dee P M, Kumar R S, Popov D, Hemley R J, Hennig R G, Hirschfeld P J, Stewart G R and Hamlin J J 2023