Post-outburst evolution of bonafide FUor V2493 Cyg: A Spectro-photometric monitoring.
Abstract
We present here the results of eight years of our near-simultaneous optical/near-infrared spectro-photometric monitoring of bonafide FUor candidate ‘V2493 Cyg’ starting from 2013 September to 2021 June. During our optical monitoring period (between October 16, 2015 and December 30, 2019), the V2493 Cyg is slowly dimming with an average dimming rate of 26.6 5.6 mmag/yr in V band. Our optical photometric colors show a significant reddening of the source post the second outburst pointing towards a gradual expansion of the emitting region post the second outburst. The mid infra-red colors, on the contrary, exhibits a blueing trend which can be attributed to the brightening of the disc due to the outburst. Our spectroscopic monitoring shows a dramatic variation of the H line as it transitioned from absorption feature to the emission feature and back. Such transition can possibly be explained by the variation in the wind structure in combination with accretion. Combining our time evolution spectra of the Ca II infra-red triplet lines with the previously published spectra of V2493 Cyg, we find that the accretion region has stabilised compared to the early days of the outburst. The evolution of the O I 7773 Å line also points towards the stabilization of the circumstellar disc post the second outburst.
, ,
1 Introduction
Enhanced episodic accretion (or outburst) is an important phenomenon in the evolution of a low-mass star (mostly 1 M⊙, and in some systems 2-3 M⊙, Hartmann et al. 2016)spanning from the embedded protostars to the main-sequence (MS) stages (Audard et al., 2014). The timescale of these outbursts (months to decades) is very short if we compare it to the millions of years spent on the formation stages or billions of years spent on the MS stages of the low-mass stars. This makes these events extremely rare. However, according to Scholz et al. (2013), each low-mass star is expected to experience statistically 50 short duration outbursts anytime during their early pre-main-sequence (PMS) stages, i.e., Class 0 and Class ii stages (see also, Safron et al., 2015). Although, these outbursts are small in temporal scales, but are capable of delivering significant fraction of mass from the circumstellar disc onto the central PMS star (Vorobyov & Basu, 2006). The episodically accreting young stars are broadly classified into two groups, i.e, FUors and EXors, which usually show a brightening of 4-5 mags (lasting for several decades) and 2-3 mags (spanning for few months to few years), respectively, in optical wavelengths. The FUors show only absorption lines in their spectra, whereas the EXors show mostly emission lines (Hartmann & Kenyon, 1996; Hartmann, 1998). Because of the rarity of the outburst events, the physical origin behind the enhanced accretion rates in the low-mass PMS stars is not fully understood. In recent times, various models have been proposed to explain this, e.g., thermal instability, magneto-rotational instability, combination of magneto-rotational instability and gravitational instability, disc fragmentation, external perturbations, etc. (see for details, Audard et al., 2014). Thus, a continuous spectroscopic and photometric monitoring of the evolution of the outburst sources can provide important insights on these models on enhanced accretion in the life of low-mass PMS stars.
V2493 Cyg (V2493 Cygnus; =20h58m16s.90, =+43∘53′42′′.8; =85.113248∘, =-1.200676∘) is one such source, categorized as a bonafide FUor Miller et al. (2011), located in the dark cloud known as the “Gulf of Mexico” in the Cygnus star-forming arm of our Galaxy. The name V2493 Cyg was designated by General catalog of variable stars (Kazarovets et al., 2011). It is also referred to as HBC 722 (Herbig & Bell, 1988), LkHA 188-G4 (Cohen & Kuhi, 1979) and PTF10qpf based on the identification of the source by Palomar Transient Factory (Miller et al., 2011). Henceforth, we will use the name V2493 Cyg throughout this paper to designate this source. The distance of this source was previously estimated as 520 50 pc (Laugalys et al., 2006; Green et al., 2013). However, from the precise parallax measurements of Gaia data release (DR) 3 (Bailer-Jones et al., 2021), this source is found to be located at a distance of 760 8 pc. Henceforth, we will adopt the distance obtained using Gaia DR3. From the shape of the spectral energy distribution (SED), Kóspál et al. (2011a) and Miller et al. (2011) have shown that the V2493 Cyg was a Class ii young stellar object (YSO) before it transitioned to its first outburst stage. V2493 Cyg experienced its first outburst during the summer of 2010. It reached its maximum brightness in September 2010 with V4.7 mag (Semkov et al., 2010). It then started to fade, reaching an intermediate quiescent stage in October 2011 (V1.45 mag from the initial outburst peak). Subsequently, it again started to brighten, reaching a maximum brightness in 2012 April with V3.3 mag (Semkov et al., 2012). Post the second outburst, Green et al. (2013) and Baek et al. (2015) investigated for periodicity in V2493 Cyg. They have found periods of 6 and 10 days. They attributed these periodicities to the rotating clumps in the disc. Lee et al. (2015) studied the evolution of V2493 Cyg using its high resolution spectra taken between 2010 December and 2014 November. They have found evidence of the wind driven by the accretion in V2493 Cyg. Their monitoring also revealed an anti-correlation between the spectroscopic features originating from the disc and from the wind. They have attributed this to the possible re-building of the inner disc. The extent of the disc at optical and near-infrared (NIR) wavelengths was found to be 39 R⊙ and 76 R⊙ respectively using the optical and NIR spectra. Kóspál et al. (2016) performed a detailed modeling of the 2010 and 2011 outburst of V2493 Cyg based on their detailed optical, NIR and millimeter monitoring and spectroscopic observations. Their investigation revealed that the initial outburst of 2010 was powered by the rapid infall of piled-up material from the innermost part of the disc onto the star. The 2011 outburst was believed to be due to a slower ionization front that started to expand outward. The study also demonstrated that episodic accretion can be observed in young stellar objects with very low mass discs.
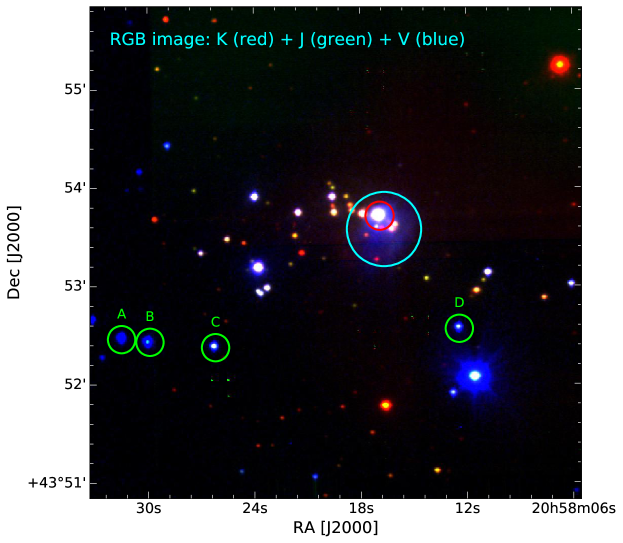
Since the year 2013, no detailed investigation on V2493 Cyg has been carried out, which is still in the second outburst stage. Thus, a long-term monitoring of V2493 Cyg can help us characterize the complex physical processes going on in this current evolutionary stage. We have monitored V2493 Cyg from 2013 September to 2021 June, both photometrically and spectroscopically in optical to NIR wavelengths, using different telescopes. Figure 1 shows the color composite image of V2493 Cyg generated from our observations during our monitoring period. A reflection nebula appeared after the first outburst which obscured V2493 Cyg at optical wavelengths. The source is visible at NIR Ks band whereas the extent of the reflection nebula is traced out by the optical V band as shown in Figure 1. We have combined our results with the previously published results. This helps us to provide further insights on the nature of these types of sources. In Section 2, we describe the details of the observations and the techniques employed in the data reduction. In Section 3, we describe the photometric and spectrometric evolution of V2493 Cyg during our monitoring period. In Section 4, we explain the evolution of V2493 Cyg based on various physical models and conclude our study at the end.
2 Observation and Data reduction
| Telescope/Instrument | Date | JD | Filters/Grisms | Exposure(s) = int. time (s) no. of frames (f) / |
|---|---|---|---|---|
| int. time (s) no. of frames (f) no. of dither positions (d)† | ||||
| 2.0m HCT TIRSPEC | 2013 Sep 27 | 2,456,563 | 20 s 3 f 5 d, 15 s 3 f 5 d, 20 s 3 f 5 d | |
| 2013 Nov 14 | 2,456,611 | 15 s 3 f 5 d, 20 s 3 f 5 d | ||
| ” | 2013 Nov 30 | 2,456,627 | 20 s 3 f 5 d, 15 s 3 f 5 d, 20 s 3 f 5 d | |
| ” | 2013 Dec 20 | 2,456,647 | 20 s 3 f 5 d | |
| ” | 2014 Mar 07 | 2,456,725 | H,K | 100 s 6 f, 100 s 6 f |
| ” | 2014 Mar 25 | 2,456,742 | 20 s 3 f 5 d, 15 s 3 f 5 d, 20 s 3 f 5 d | |
| ” | 2014 May 04 | 2,456,782 | 20 s 3 f 5 d, 15 s 3 f 5 d, 20 s 3 f 5 d | |
| ” | 2014 May 29 | 2,456,807 | 15 s 3 f 5 d, 20 s 3 f 5 d | |
| ” | 2014 Jun 04 | 2,456,813 | K | 100 s 6 f |
| ” | 2014 Jun 05 | 2,456,814 | 20 s 3 f 5 d, 15 s 3 f 5 d, 20 s 3 f 5 d | |
| ” | 2014 Jul 02 | 2,456,841 | J,H,K, | 100 s 6 f, 100 s 6 f, 100 s 6 f, 20 s 3 f 5 d, 15 s 3 f 5 d, 20 s 3 f 5 d |
| ” | 2014 Jul 03 | 2,456,842 | 20 s 3 f 5 d, 15 s 3 f 5 d, 20 s 3 f 5 d | |
| ” | 2014 Aug 24 | 2,456,894 | H,K, | 100 s 6 f, 100 s 6 f, 20 s 3 f 5 d |
| ” | 2014 Aug 25 | 2,456,895 | Y,J, | 100 s 6 f, 100 s 6 f, 20 s 3 f 5 d, 15 s 3 f 5 d, 20 s 3 f 5 d |
| ” | 2014 Sep 25 | 2,456,926 | K, | 100 s 6 f, 20 s 3 f 5 d, 15 s 3 f 5 d, 20 s 3 f 5 d |
| ” | 2014 Sep 26 | 2,456,927 | Y,J,H,K | 100 s 6 f, 100 s 6 f, 100 s 6 f, 100 s 3 f 2 d |
| ” | 2014 Oct 26 | 2,456,957 | 20 s 3 f 5 d, 15 s 3 f 5 d, 20 s 3 f 5 d | |
| ” | 2014 Nov 21 | 2,456,983 | Y,J, | 100 s 6 f, 100 s 6 f, 20 s 3 f 5 d, 15 s 3 f 5 d, 20 s 3 f 5 d |
| ” | 2014 Nov 22 | 2,456,984 | Y,J,H,K | 100 s 6 f, 100 s 6 f, 100 s 6 f, 100 s 6 f |
| ” | 2014 Nov 28 | 2,456,990 | 20 s 3 f 5 d, 15 s 3 f 5 d, 20 s 3 f 5 d | |
| ” | 2014 Dec 25 | 2,457,017 | 20 s 3 f 5 d | |
| ” | 2015 Feb 12 | 2,457,066 | 20 s 3 f 5 d, 15 s 3 f 5 d, 20 s 3 f 5 d | |
| ” | 2015 Apr 14 | 2,457,127 | 20 s 3 f 5 d | |
| ” | 2015 Apr 27 | 2,457,141 | Y,J,H,K | 100 s 6 f, 100 s 6 f, 100 s 6 f, 100 6 f |
| TIRSPEC+HFOSC | 2015 May 16 | 2,457,159 | 60 s 3 f, 30 s 3 f, 20 s 3 f 5 d, 15 s 3 f 5 d, 20 s 3 f 5 d | |
| ” | 2015 May 26 | 2,457,170 | Y,J,H,K | 100 s 6 f, 100 s 6 f, 100 s 6 f, 100 s 6 f |
| HFOSC | 2015 Jun 10 | 2,457,184 | 60 s 3 f, 30 s 3 f, 30 s 3 f | |
| TIRSPEC | 2015 Jun 23 | 2,457,197 | J,H,K | 100 s 6 f, 100 s 6 f, 100 s 6 f |
| ” | 2015 Jul 27 | 2,457,231 | J,H,K | 100 s 6 f, 100 s 6 f, 100 s 6 f, 20 s 3 f 5 d, 15 s 3 f 5 d, 20 s 3 f 5 d |
| ” | 2015 Aug 17 | 2,457,252 | Y,J,H,K, | 100 s 6 f , 100 s 6 f, 100 s 6 f, 100 s 6 f, 20 s 3 f 5 d, 15 s 3 f 5 d, 20 s 3 f 5 d |
| ” | 2015 Oct 13 | 2,457,309 | Y,J, | 100 s 6 f , 100 s 6 f, 20 s 3 f 5 d, 15 s 3 f 5 d, 20 s 3 f 5 d |
| HFOSC | 2015 May 17 | 2,457,160 | 1800 s , 1800 s | |
| ” | 2015 May 26 | 2,457,169 | 1200 s | |
| ” | 2015 Jun 10 | 2,457,184 | 1200 s , 1200 s | |
| ” | 2015 Aug 18 | 2,457,253 | 60 s 3 f, 30 s 3 f, 1200 s, 1200 s | |
| ” | 2015 Sep 27 | 2,457,293 | 60 s 3 f, 30 s 3 f, 1200 s, 1200 s | |
| ” | 2015 Oct 12 | 2,457,308 | 60 s 3 f, 30 s 3 f, 1200 s, 1200 s | |
| 1.3m DFOT ANDOR | 2015 Oct 16 | 2,457,312 | 60 s 3 f, 30 s 3 f, 30 s 3 f | |
| ” | 2015 Nov 02 | 2,457,329 | 30 s 3 f, 30 s 3 f | |
| HFOSC | 2015 Nov 10 | 2,457,337 | 60 s 3 f, 30 s 3 f, 1200 s | |
| ANDOR | 2015 Nov 18 | 2,457,345 | 60 s 3f, 30 s 3f, 30 s 3 f | |
| ” | 2016 Jan 01 | 2,457,390 | 60 s 3f, 30 s 3f, 30 s 3 f | |
| HFOSC | 2016 Jan 20 | 2,457,409 | 1200 s,1200 s | |
| ” | 2016 Mar 03 | 2,457,451 | 60 s 3 f, 30 s 3 f | |
| ” | 2016 Mar 15 | 2,457,463 | 60 s 3 f, 30 s 3 f, 900 s, 900 s | |
| ” | 2016 Jun 17 | 2,457,557 | 60 s 3 f, 30 s 3 f, 1200 s,1200 s | |
| ” | 2016 Jul 24 | 2,457,594 | 60 s 3 f, 30 s 3 f, 1800 s,1200 s | |
| ” | 2016 Sep 26 | 2,457,658 | 60 s 3 f, 30 s 3 f, 1800 s,1800 s | |
| ” | 2016 Oct 05 | 2,457,667 | 60 s 3 f, 30 s 3 f, 700 s | |
| ANDOR | 2016 Oct 08 | 2,457,670 | 60 s 3 f, 30 s 3 f, 30 s 3 f | |
| HFOSC | 2016 Oct 13 | 2,457,675 | 60 s 3 f, 30 s 3 f, 30 s 3 f, 1800 s, 1200 s | |
| ANDOR | 2016 Nov 15 | 2,457,708 | 60 s 3 f, 30 s 3 f, 30 s 3 f | |
| HFOSC | 2016 Nov 17 | 2,457,710 | 60 s 3 f, 30 s 3 f, 30 s 3 f, 1200 s, 1200 s | |
| ” | 2016 Dec 04 | 2,457,727 | 60 s 3 f, 30 s 3 f, 30 s 3 f, 1200 s, 1200 s | |
| ” | 2016 Dec 08 | 2,457,731 | H,K, | 100 s 6 f, 100 s 6 f, 1800 s, 1800 s |
| ” | 2017 Apr 25 | 2,457,869 | 1800 s , 1800 s | |
| ” | 2017 Apr 28 | 2,457,872 | 1800 s | |
| TIRSPEC | 2017 Jul 02 | 2,457,937 | Y,J,H,K | 100 s 6 f , 100 s 6 f, 100 s 6 f, 100 3 f |
| HFOSC | 2017 Jul 03 | 2,457,938 | 1800 s | |
| TIRSPEC | 2017 Aug 20 | 2,457,983 | 20 s 3 f 5 d, 15 s 3 f 5 d, 20 s 3 f 5 d | |
| HFOSC | 2017 Aug 22 | 2,457,985 | 1800 s | |
| TIRSPEC | 2017 Sep 14 | 2,458,011 | Y,J,H,K, | 100 s 6 f, 100 s 6 f, 100 s 6 f, 100 s 6 f, 20 s 3 f 5 d, 15 s 3 f 5 d, 20 s 3 f 5 d |
| HFOSC | 2017 Sep 17 | 2,458,014 | 1800 s, 1800 s | |
| ANDOR | 2017 Oct 08 | 2,458,035 | 60 s 3 f, 30 s 3 f, 30 s 3 f | |
| 1.3m DFOT ANDOR | 2017 Oct 13 | 2,458,040 | 60 s 3 f, 30 s 3 f, 30 s 3 f | |
| ” | 2017 Nov 11 | 2,458,069 | 60 s 3 f, 30 s 3 f, 30 s 3 f | |
| ” | 2017 Dec 10 | 2,458,098 | 60 s 3 f, 30 s 3 f, 30 s 3 f | |
| HFOSC | 2018 Aug 13 | 2,458,344 | 60 s 3 f, 30 s 3 f, 30 s 3 f, 1800 s, 2700 s | |
| ANDOR | 2018 Oct 06 | 2,458,398 | 60 s 3 f, 30 s 3 f, 30 s 3 f | |
| ” | 2018 Oct 18 | 2,458,410 | 60 s 3 f, 30 s 3 f, 30 s 3 f | |
| HFOSC | 2018 Nov 06 | 2,458,429 | 1200 s, 1200 s | |
| TIRSPEC | 2018 Nov 07 | 2,458,429 | Y,J,H,K | 100 s 6 f, 100 s 6 f, 100 s 6 f, 100 s 6 f |
| HFOSC | 2018 Nov 21 | 2,458,444 | 1800 s, 1200 s | |
| ANDOR | 2018 Nov 25 | 2,458,448 | 60 s 3 f, 30 3 f, 30 3f | |
| ANDOR | 2018 Nov 26 | 2,458,449 | 60 s 3 f, 30 3 f, 30 3f | |
| † For the NIR photometric observations |
| Telescope/Instrument | Date | JD | Filters/Grisms | Exposure(s) = int. time (s) no. of frames (f) / |
| int. time (s) no. of frames (f) no. of dither positions (d)† | ||||
| ANDOR | 2018 Dec 03 | 2,458,456 | 60 s 3 f, 30 3 f, 30 3f | |
| HFOSC | 2018 Dec 12 | 2,458,465 | 1500 s, 900 s | |
| ANDOR | 2018 Dec 20 | 2,458,473 | 60 s 3 f, 30 s 3 f, 30 f | |
| TIRSPEC | 2018 Dec 24 | 2,458,477 | 20 s 3 f 5 d, 15 s 3 f 5 d, 20 s 3 f 5 d | |
| HFOSC | 2018 Dec 25 | 2,458,478 | 1500 s, 900 s | |
| 2.4m TNT MRES | 2019 Apr 28 | 2,458,602 | Echelle Spectra | 3600 s |
| ANDOR | 2019 May 20 | 2,458,624 | ||
| TIRSPEC | 2019 Jun 14 | 2,458,649 | 20 s 3 f 5 d, 15 s 3 f 5 d, 20 s 3 f 5 d | |
| ” | 2019 Oct 12 | 2,458,769 | 20 s 3 f 5 d, 15 s 3 f 5 d, 20 s 3 f 5 d | |
| HFOSC | 2019 Oct 28 | 2,458,785 | 1800 s | |
| ANDOR | 2019 Nov 04 | 2,458,792 | 60 s3 f, 30 s 3 f, 30 s3 f | |
| ” | 2019 Nov 05 | 2,458,793 | 30 s 3 f, 30 s 3 f | |
| ” | 2019 Nov 06 | 2,458,794 | 60 s 3 f, 30 s 3 f, 30 s 3 f | |
| ” | 2019 Nov 25 | 2,458,813 | 60 s 3 f, 30 s 3 f, 30 s 3 f | |
| ” | 2019 Nov 29 | 2,458,817 | 60 s 3 f, 30 s 3 f, 30 s 3 f | |
| ” | 2019 Dec 08 | 2,458,826 | 60 s 3 f, 30 s 3 f, 30 s 3 f | |
| ” | 2019 Dec 16 | 2,458,834 | 60 s 3 f, 30 s 3 f, 30 s 3 f | |
| ” | 2019 Dec 30 | 2,458,848 | 60 s 3 f, 30 s 3 f, 30 s 3 f | |
| 3.6m DOT TANSPEC | 2020 Oct 25 | 2,459,148 | Cross-dispersed spectra | 120 s 5 f |
| ” | 2020 Nov 10 | 2,459,164 | Cross-dispersed spectra | 120 s 5 f |
| HFOSC | 2021 Jun 14 | 2,459,380 | , | 1800 s, 1800 s |
| † For the NIR photometric observations |
2.1 Photometric data
2.1.1 Present data
We have observed V2493 Cyg in optical broadband , , and Johnson-Cousins filters using the ANDOR and ANDOR CCD cameras on the 1.3m Devasthal Fast Optical Telescope (DFOT) of Aryabhatta Research Institute of Observational Sciences (ARIES)111https://www.aries.res.in/~1.3m/imager.html and the Hanle Faint Object Spectrograph Camera (HFOSC) of 2m Himalayan Chandra Telescope (HCT)222https://www.iiap.res.in/iao/hfosc.html at Hanle, India. In the NIR wavelengths, we have observed V2493 Cyg in and bands using the TIFR Near Infrared Spectrometer and Imager (TIRSPEC) mounted on HCT (Ninan et al., 2014). Table 1 provides the complete log of observations. We have photometrically observed V2493 Cyg at 70 different epochs between 2013 and 2019 with 26 epochs using the 1.3m DFOT (optical bands), 16 epochs using HFOSC (optical bands) and 28 epochs using the TIRSPEC on 2m HCT (NIR bands).
For the image processing, we have used the standard procedures as outlined in Sharma et al. (2020). As V2493 Cyg is surrounded by a reflection nebula, Point Spread Function (PSF) photometry does not fully remove the inter-night nebular contamination. Therefore, we have followed the approach of Ninan et al. (2013) by which they did photometry of another similar FUor/EXor source ‘V1647 Ori’ which is also surrounded by a nebula. In the case of V1647 Ori, it was found out that there is a strong correlation between fluctuation in magnitude with that of atmospheric seeing. This resulted from the contamination of the nebular flux into the aperture of V1647 Ori which is a function of atmospheric seeing. Briefly, we have generated a set of images for each night by convolving each frame with a two-dimensional Gaussian kernel of different standard deviations to simulate different atmospheric seeing conditions. Magnitudes of V2493 Cyg were then calculated by performing differential photometry on the set of images for each night interpolated to a seeing of 1.5 arcsec (median seeing during our observations).
Previously, Semkov et al. (2010) have listed 7 stars as local standards near V2493 Cyg. Out of them, we have selected 4 stars (2 stars in the NIR wavelengths) for our analysis, that are located in the common field of view (FOV) of the detectors used. We have also observed the Landolt standard field (Landolt, 1992) SA 98 (: 06h52m14s, : -001859) on the night of 2019 November 4. This is done to calculate the present , , and magnitudes of the selected local standards. We have also checked the long term behaviour of the selected local standards in ASAS-SN333https://www.astronomy.ohio-state.edu/asassn/index.shtml survey to verify the stability of magnitudes of our selected local standards. The calibration equations derived from the Landolt standard stars by the least-squares linear regression are as follows:
| (1) |
| (2) |
.
| (3) |
where, , and are the instrumental magnitudes and , and are the standard magnitudes. X is the airmass term in the corresponding filters. In the NIR wavelengths, we have calibrated the local standard stars using the color transformation equations provided by Ninan et al. (2014). The rest of the procedures to calibrate V2493 Cyg is similar to that has been described in Ghosh et al. (2022a). Table 2 lists the coordinates and V, RC, IC, J, H and KS magnitudes of the local standard stars used in the present study. Table 3 provides the calibrated , , , J, H and KS magnitudes of V2493 Cyg at 54 epochs starting from 2013 September upto 2019 December.
| Names | 2000 | 2000 | V | R | IC | J | H | KS |
|---|---|---|---|---|---|---|---|---|
| (degrees) | (degrees) | (mag) | (mag) | (mag) | (mag) | (mag) | (mag) | |
| 2MASS J20583004+4352257 | 314.625108 | +43.874258 | 15.020.01 | 14.100.01 | 13.200.01 | |||
| 2MASS J20583004+4352257 | 314.631458 | +43.874539 | 15.450.01 | 14.790.01 | 14.150.01 | 13.470.01 | 12.970.01 | 12.870.01 |
| USNO-B1.0 1338-00391522 | 314.610204 | +43.873175 | 15.870.01 | 14.900.01 | 13.920.01 | 12.990.01 | 12.400.01 | 12.130.01 |
| 2MASS J20581249+4352347 | 314.552492 | +43.876633 | 15.920.01 | 15.120.01 | 14.480.01 | 13.700.01 | 13.100.01 | 12.960.01 |
2.2 Archival data
We have obtained , , and photometric data provided by Semkov et al. (2010) in their study. Photometric data in the above bands are also downloaded from the archive of American Association for the Variable Star Observers (AAVSO)444https://www.aavso.org/.
We have also acquired the photometric data provided by the Palomar Transient Factory (PTF) in their and bands555https://www.ptf.caltech.edu/. The details of PTF survey are provided in Law et al. (2009).
Multi-epoch photometric data of V2493 Cyg is also available in the Zwicky Transient Factory (ZTF) archive. We have downloaded the ZTF DR6 and band data from the NASA/IPAC Infrared Science Archive666https://irsa.ipac.caltech.edu/Missions/ztf.html. The details of the ZTF is available in Bellm et al. (2018).
Archival mid-infrared (MIR) data in W1 (3.4 m) and W2 (4.6 m) channels from the Near-Earth Object Wide-field Infrared Survey Explorer (NEOWISE) survey is obtained from the NASA/IPAC Infrared Science archive777https://irsa.ipac.caltech.edu/Missions/wise.html. The details of the NEOWISE survey are available at Mainzer et al. (2014)
| Julian Day | V | R | IC | J | H | KS |
|---|---|---|---|---|---|---|
| (mag) | (mag) | (mag) | (mag) | (mag) | (mag) | |
| 2456563 | 9.350.01 | 8.370.01 | 8.040.01 | |||
| 2456611 | 8.520.01 | 7.970.01 | ||||
| 2456627 | 9.260.01 | 8.450.01 | 7.940.01 | |||
| 2456647 | 7.940.01 | |||||
| 2456742 | 9.340.01 | 8.500.01 | 8.030.01 | |||
| 2456782 | 9.360.01 | 8.570.01 | 7.960.01 | |||
| 2456807 | 9.330.01 | 8.490.01 | ||||
| 2456814 | 9.360.01 | 8.520.01 | 8.130.02 | |||
| 2456841 | 9.360.01 | 8.490.01 | 7.960.01 | |||
| 2456842 | 9.320.01 | 8.450.01 | 7.960.01 | |||
| 2456894 | 9.300.01 | |||||
| 2456895 | 9.310.01 | 8.480.01 | 7.940.01 | |||
| 2456926 | 9.240.01 | 8.430.01 | 7.860.01 | |||
| 2456957 | 9.240.01 | 8.300.01 | 7.800.01 | |||
| 2456983 | 9.220.01 | 8.450.01 | 7.890.01 | |||
| 2456990 | 9.310.01 | 8.480.01 | 7.920.01 | |||
| 2457017 | 9.340.01 | |||||
| 2457066 | 9.230.01 | 7.890.02 | ||||
| 2457127 | 7.890.02 | |||||
| 2457159 | 13.430.01 | 12.250.01 | 9.290.01 | 8.420.01 | 7.750.01 | |
| 2457184 | 13.410.01 | 12.290.01 | 11.100.01 | |||
| 2457231 | 9.390.01 | 8.350.01 | 7.810.01 | |||
| 2457252 | 9.330.01 | 8.400.01 | 7.870.01 | |||
| 2457253 | 13.290.03 | 12.160.01 | ||||
| 2457293 | 13.390.01 | 12.340.01 | ||||
| 2457308 | 13.420.02 | |||||
| 2457309 | 9.250.01 | 8.480.01 | 7.860.01 | |||
| 2457312 | 13.500.01 | 12.450.01 | 11.440.02 | |||
| 2457329 | 12.290.01 | 11.170.01 | ||||
| 2457337 | 13.360.02 | 12.220.02 | ||||
| 2457345 | 13.530.01 | 12.340.01 | 11.130.01 | |||
| 2457390 | 13.570.01 | 12.390.01 | 11.120.01 | |||
| 2457451 | 13.340.01 | 12.220.03 | ||||
| 2457463 | 13.400.01 | 12.340.01 | 11.150.01 | |||
| 2457557 | 13.250.01 | 12.240.01 | ||||
| 2457594 | 13.420.01 | 12.270.01 | ||||
| 2457658 | 13.310.01 | 12.250.01 | ||||
| 2457667 | 13.430.01 | 12.230.01 | ||||
| 2457660 | 13.660.01 | 12.510.01 | 11.270.01 | |||
| 2457670 | 13.610.01 | 12.450.01 | 11.240.01 | |||
| 2457675 | 13.550.01 | 12.370.01 | 11.150.01 | |||
| 2457708 | 13.620.01 | 12.490.01 | 11.250.01 | |||
| 2457710 | 13.630.01 | 12.370.01 | 11.180.01 | |||
| 2457727 | 13.410.01 | 12.270.01 | 11.120.01 | |||
| 2457976 | 13.650.02 | 12.400.01 | 11.160.01 | |||
| 2457986 | 9.240.01 | 8.420.01 | 7.740.01 | |||
| 2458011 | 9.220.01 | 8.460.01 | 7.800.01 | |||
| 2458344 | 13.730.01 | 12.770.01 | 11.140.01 | |||
| 2458448 | 13.570.01 | 12.260.01 | 11.100.01 | |||
| 2458473 | 13.380.02 | 12.280.01 | 11.150.01 | |||
| 2458477 | 9.160.01 | 8.420.004 | 7.760.01 | |||
| 2458624 | 13.730.01 | 12.490.01 | 11.230.01 | |||
| 2458649 | 9.260.01 | 8.370.01 | 7.630.02 | |||
| 2458040 | 13.620.01 | 12.460.01 | 11.190.01 | |||
| 2458069 | 13.580.01 | 12.430.01 | 11.180.01 | |||
| 2458098 | 13.540.01 | 12.360.01 | 11.120.01 | |||
| 2458398 | 13.480.01 | 12.350.01 | 11.090.01 | |||
| 2458410 | 13.490.01 | 12.380.01 | 11.090.01 | |||
| 2458449 | 13.540.01 | 12.390.01 | 11.120.01 | |||
| 2458456 | 13.480.01 | 12.340.01 | 11.080.01 | |||
| 2458769 | 9.370.01 | 8.580.01 | 7.950.02 | |||
| 2458792 | 13.760.01 | 12.560.01 | 11.230.01 | |||
| 2458793 | 12.560.01 | 11.220.01 | ||||
| 2458794 | 13.810.01 | 12.610.01 | 11.270.01 | |||
| 2458813 | 13.810.01 | 12.590.01 | 11.270.01 | |||
| 2458817 | 13.700.01 | 12.480.01 | 11.170.01 | |||
| 2458826 | 13.710.01 | 12.500.01 | 11.180.01 | |||
| 2458834 | 13.920.01 | 12.760.01 | 11.430.01 | |||
| 2458848 | 13.740.01 | 12.530.01 | 11.210.01 |
2.3 Spectroscopic data
2.3.1 Medium Resolution single order Optical Spectroscopy
V2493 Cyg is monitored spectroscopically starting from 2015 May 17 to 2021 June 14 at 28 different epochs using the HFOSC. HFOSC provides a medium resolution spectra with R2000 with 1 arcsec slit from 4000Å to 9000Å using grisms Gr 7 and Gr 8.
Standard IRAF888IRAF is distributed by National Optical Astronomy Observatories, USA which is operated by the Association of Universities for Research in Astronomy, Inc., under cooperative agreement with National Science Foundation for performing image processing. tasks are used for the spectroscopic data reduction. The task apall is used to extract the spectrum in one dimensional format. The extracted spectrum is then wavelength calibrated using the task identify with the help of calibration lamps (FeAr and FeNe) taken immediately after the source spectrum. We have followed this with the task continuum to continuum normalize our spectra. We have used this normalized spectra to measure the equivalent widths (Wλ) of important spectral lines by using the splot package of IRAF. Three independent measurements of Wλ per line is made and the median value of those measurements is taken as the final Wλ of that particular line.
2.3.2 Medium Resolution Echelle Spectroscopy
We have obtained medium resolution echelle spectrum of V2493 Cyg on 2019 April 28 by using the Medium Resolution Echelle Spectrograph (MRES), that is mounted on the 2.4m Thai National Telescope (TNT) located at Thai national observatory. MRES has wavelength coverage from 3900Å to 8800Å and it provides a spectral resolution of R16,000-19,000. Details about the MRES instrument can be found in Yadav et al. (2022). The lunar illumination during our observation date was 33% and the sky was hazy due to forest fires resulting in low signal to noise (SNR). We can only use the spectrum covering the wavelength range of 3900Å to 6600Å for our present analysis. Wavelength beyond this range is dominated by multiple telluric lines and bands and hence is not used for the analysis.
We have used the standard calibration frames, e.g., bias, flat and Th-Ar lamp, for image cleaning and wavelength calibration. The spectrum is extracted using the echelle module of the IRAF package. The procedure to calibrate the wavelength and normalize the spectrum is similar to that has been described in Section 2.3.1.
2.3.3 NIR Spectroscopy
We have spectroscopically monitored V2493 Cyg in the NIR wavelengths starting from 2014 March 07 till 2020 November 11 using the TIRSPEC mounted on 2m HCT and TIFR-ARIES Near Infrared Spectrograph (TANSPEC) (Ojha et al., 2018; Sharma et al., 2022) mounted on 3.6m Devasthal Optical Telescope (DOT). TIRSPEC provides a wavelength coverage from 1 m to 2.5 m at a spectral resolution of 1200. The details about the instrument is provided in Ninan et al. (2014). The TIRSPEC spectroscopic data is processed using the TIRSPEC pipeline999http://indiajoe.github.io/TIRSPEC/Pipeline/. The sky conditions were poor on the nights of 2017 September 14 and 2018 November 7 leading to poor SNR in the extracted spectra. The output extracted spectrum obtained is continuum normalised using the continuum task of IRAF.
We have also obtained the NIR spectra of V2493 Cyg using the TANSPEC with its 1 slit providing a R1500 on the nights of 2020 October 25 and 2020 November 11. The spectra are obtained following the technique that is described in detail in Ghosh et al. (2022a). The obtained spectra are then wavelength calibrated by using the recently developed TANSPEC data reduction pipeline101010https://github.com/astrosupriyo/pyTANSPEC (Ghosh et al., 2022b). The telluric correction to the spectra is done in a similar manner as described in Ghosh et al. (2022a). The resulting spectra are then continuum normalised using the Python specutils module111111https://specutils.readthedocs.io/en/stable/ (Earl et al., 2021).
In summary, we have monitored V2493 Cyg spectroscopically at 50 epochs with HFOSC (28), MRES (1), TIRSPEC (19) and TANSPEC (2) starting from 2014 July till 2021 June. Table 1 contains the complete log of spectroscopic observations.
3 Results and Analysis
3.1 Light Curve
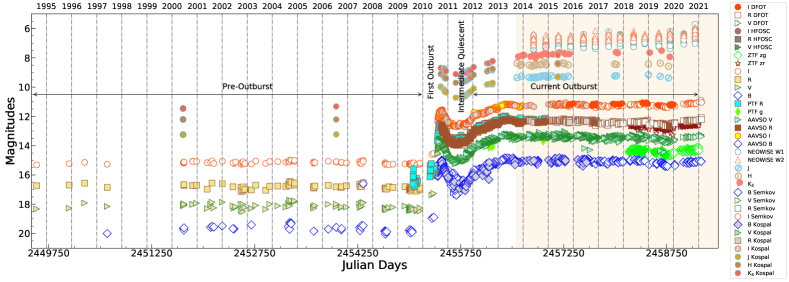
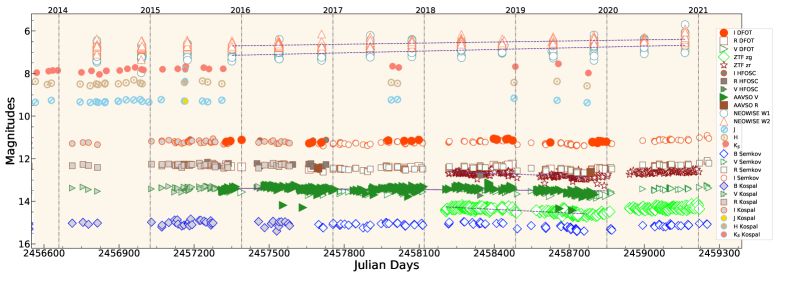
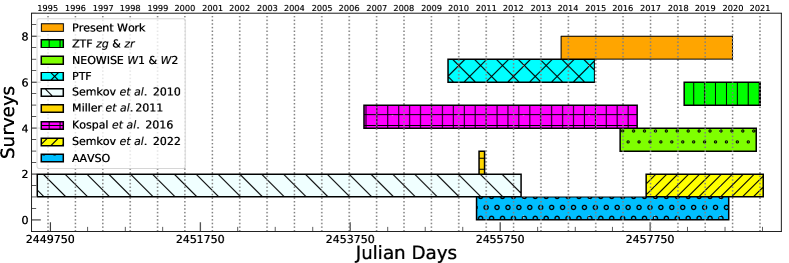
Top panel of Figure 2 shows the light curve (LC) of V2493 Cyg in optical , , and , PTF and , ZTF and , NIR , and and NEOWISE MIR W1 and W2 bands. Data in the , and bands have the longest coverage. We have combined our , , , , and band data121212Optical photometric data obtained with the 1.3m DFOT telescope and NIR photometric data from 2m HCT telescope. with that of the archival data from and the previously published data taken from Semkov et al. (2010, 2021); Miller et al. (2011); Kóspál et al. (2016). The photometric monitoring timescales of the different surveys both in optical and NIR bands of V2493 Cyg begins with the 2MASS observations on 2000 June 10 (JD=2451706). V2493 Cyg was then observed in NIR bands during its 2010 outburst by Miller et al. (2011) and Leoni et al. (2010) are shown in Figure 3. Our monitoring period is denoted by the orange horizontal bars. We have monitored V2493 Cyg photometrically both in optical and NIR wavebands.
Baek et al. (2015) have studied the photometric evolution of V2493 Cyg from 2010 September to 2013 May. During this period, V2493 Cyg transitioned to its first outburst state to an intermediate quiescent stage and finally to its second outburst state. They have subsequently divided this period into 5 phases based on the LC evolution. We call our optical photometric monitoring period which is carried out between 2015 October 16 and 2021 December 4 to be phase 6 which is actually a period after the peak of second outburst. Middle panel of Figure 2 shows the LC of V2493 Cyg during our monitoring period. During phase 6, in the period between October 16, 2015 and December 30, 2019131313This time period coincides with our monitoring of V2493 Cyg with 1.3m DFOT the V-band brightness of V2493 Cyg dimmed at an average rate of 2.3 mmag/month with a drop by 0.6 mag from its peak outburst V-band magnitude in August 2010. Since the dimming rate is too small, we can call phase 6 to be ‘Long Plateau’ phase also. Such a long plateau phase, which is also observed in other bonafide FUor sources like FU Ori, etc., is attributed to the time required to deplete the inner disc completely after an (cf., Audard et al., 2014). We note that the individual WISE measurements for a given JD showed considerable scatter. We have therefore used the median WISE magnitudes for a given JD in our MIR analysis. We have taken the standard deviation of the magnitude variations within a day as a conservative limit of measurement error. In the same duration, the source seems to brighten-up by 0.7 mag and 0.4 mag in MIR and bands, respectively with an average rise rate of 94 18 mmag/yr and 627 mmag/yr.
| Days | N | Days | N | ||
|---|---|---|---|---|---|
| (JD) | (mag) | (JD) | (mag) | ||
| 2457312 | 0.15 | 2458098 | 0.03 | 8.0 | |
| 2457345 | 0.06 | 6.1 | 2458398 | 0.03 | 8.6 |
| 2457390 | 0.02 | 8.1 | 2458410 | 10.1 | |
| 2457660 | 0.07 | 5.9 | 2458449 | 0.05 | 7.3 |
| 2457670 | 0.09 | 4.1 | 2458456 | 0.04 | 8.2 |
| 2457708 | 0.04 | 8.1 | 2458792 | 0.01 | 10.3 |
| 2457976 | 0.11 | 1.7 | 2458794 | 0.01 | 10.4 |
| 2458448 | 0.07 | 5.8 | 2458813 | 0.05 | 7.2 |
| 2458473 | 0.11 | 1.6 | 2458817 | 0.05 | 6.9 |
| 2458624 | 0.11 | 2.8 | 2458826 | 0.01 | 10.1 |
| 2458040 | 0.01 | 9.7 | 2458834 | 0.01 | 8.7 |
| 2458069 | 0.02 | 8.6 | 2458848 | 0.04 | 8.1 |
3.2 Color Evolution
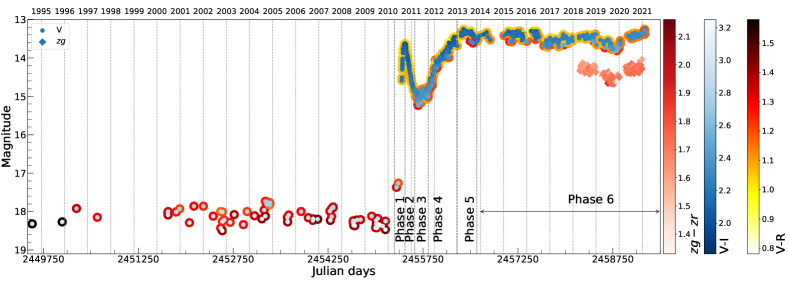
The bottom panel of Figure 2 shows the complete evolution of () and () colors coded onto the -band magnitude of V2493 Cyg from 2015 October 16 to 2019 December 30, which is within phase 6 defined earlier.
Both the () and () colors have consistently become redder in the phase 6, implying the presence of a cooler flux than that was present during the previous phases.
During phase 5, V2493 Cyg showed a weak bluer trend with small scale fluctuations in its color (Baek et al., 2015).
Therefore, the present evolution possibly points towards a different physical process occurring in the V2493 Cyg as compared to the previous phases. The VRC and VIC colors have
become redder by 0.14 and 0.32 mag, respectively during phase 6. The color evolution of V2493 Cyg is similar to that of V899 Mon, in a sense that its transition fluxes are redder compared to the outburst stages, therefore implying that the outburst flux possibly has emerged from the circumstellar disc (Ninan et al., 2015).
Semkov et al. (2021), have also noted this color evolution in their monitoring during the Phase 6 period. The reddening of the optical colors can be a result of
gradual decline in accretion rate in V2493 Cyg such that the central PMS star is exiting the maximum phase of the FUor outburst (Semkov et al., 2021). Alternatively, the reddening of the
optical colors can also be
possibly explained due to the expansion of the emitting region around the star. This expansion of the emitting area is possibly a result of an ionization front expanding outwards
(Kóspál et al., 2016). The color evolution of V2493 Cyg can be further analysed based on the theoretical model developed by Liu et al. (2022).
According to their model, the PMS stars accreting in the “FU Ori” regime occupy a certain locus in the CMD plane as compared to the stars still accreting via magnetospheric regime.
They introduced a parameter which is the ratio of total H- and K- band viscous disc flux to that of the PMS photosphere. For a given stellar mass (M∗) the
accretion rate was varied and the values of parameter was computed for which the PMS photosphere dominates over the viscous accretion disc and vice versa.
Based on the values of parameter the CMD plane can be divided into regions of magnetospheric accretion regime and boundary layer accretion regime for a given M∗.
For = 0, the model developed by Liu et al. (2022), degenerates into classical T Tauri star magnetospheric accretion regime.
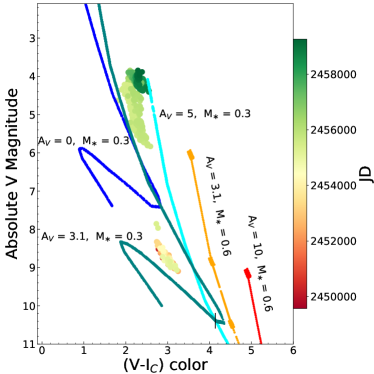
Comparing our absolute V vs (V-IC) CMD141414We have obtained the values of isomass curves of Liu et al. (2022) using the online available plot digitizer tool ( https://apps.automeris.io/wpd/). The obtained values are in the Gaia photometric system. The obtained photometric magnitudes and colors were then transformed to the Johnson Cousins photometric system using the transformation equations between the Gaia photometric system and the Johnson Cousins photometric system (https://gea.esac.esa.int/archive/documentation/GDR2/Data_processing/chap_cu5pho/sec_cu5pho_calibr/ssec_cu5pho_PhotTransf.html ), (Figure 4) with Figure 15 of Liu et al. (2022), we find after its first outburst V2493 Cyg has mostly resided over 5 region in the CMD plane. The 5 region signifies the region in the optical CMD plane where the circumstellar disc outshines the central PMS star and all the observed spectral
features originate from the disc itself. It is to be noted that in 5 region, the magnetospheric accretion ceases and the central PMS star accretes via the boundary layer
accretion Liu et al. (2022). Therefore, the reddening of the optical colors likely points towards the expansion of the emitting region around V2493 Cyg rather than the
PMS star exiting the “FUor stage”.
The color change observed in the present study can be further investigated using the reddening invariant colors following the recipe of McGehee et al. (2004). The reddening invariant colors take the generic form = (xy) E(xy)/E(yz) (yz), where x, y and z are the observed magnitudes in respective filters. A color change ‘ ’ that is statistically distinct from 0 indicates changes in the SED that cannot be explained by changes in the extinction alone, rather an intrinsic change (changes in temperature of the system) might have occurred in the SED. We have tabulated the values of reddening invariant colors for RV = 3.1 in Table 4. We see that there is a 5 change in the colors throughout the phase 6 period indicating an intrinsic change in the SED of V2493 Cyg.
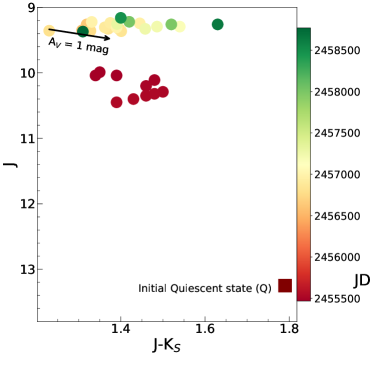
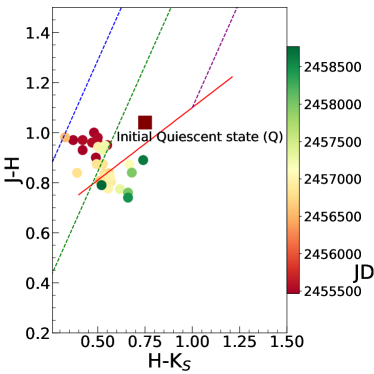
The color change in the NIR wavelengths is less pronounced as compared to the optical bands. Left panel of Figure 5 shows the evolution of V2493 Cyg in the NIR color magnitude diagram (CMD). The square box represents the pre-outburst quiescent phase locus of V2493 Cyg. The red dots represent the loci of V2493 Cyg during the 2010 outburst stage and its transition towards the intermediate quiescent phase as obtained from Leoni et al. (2010) and Miller et al. (2011). The green dots represent the evolution of V2493 Cyg during our monitoring period. In the J/JKS CMD, we see that there is a gradual slow transition towards redder color with very little change in J magnitude. Right panel of Figure 5 shows the evolution of V2493 Cyg in the NIR color-color (CC) plane of JH/HKS. Position of V2493 Cyg in the NIR CC plane shows no significant extinction towards the source. We note that V2493 Cyg moved along the reddening vector in the Phase 1 and 2 periods. During our monitoring period, which corresponds to Phase 5 and Phase 6, we note that the locus of V2493 Cyg is near to the Classical T Tauri (CTT) locus. From the NIR CC plane, we also note that there is no significant variation in the extinction of V2493 Cyg during the Phase 5 and Phase 6. Thus, the NIR color evolution also reinforces our assumptions based on our reddening invariant color analysis in the optical regime.
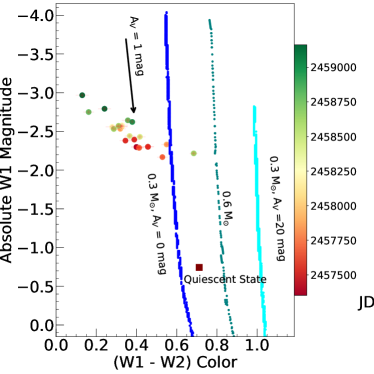
We have also investigated the color evolution in MIR and bands as obtained from the NEOWISE archive and is shown as a MIR CMD in the left panel of Figure 6. Interestingly, the MIR colors of V2493 Cyg has become bluer during our monitoring period. The blueing of the MIR colors can be possibly explained by the model developed by Liu et al. (2022). According to their model, at the outburst stage, the viscous disc temperatures are higher, therefore heating up the disc which results in the blueing of the MIR colors. The gradual blueing might possibly hint at gradual increase of the warm continuum emission (Liu et al., 2022).
3.3 The Evolution of Photometric Spectral Energy Distribution
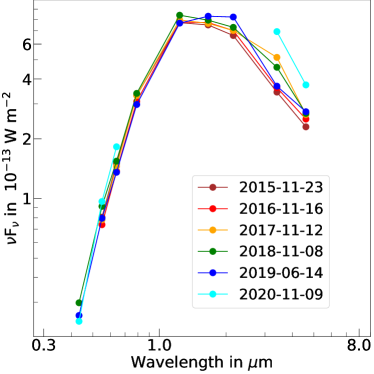
The right-panel of Figure 6 shows the multi-epoch SEDs of V2493 Cyg during our monitoring period, i.e, Phase 6. We have constructed the SEDs using the multi-wavelength data (optical to MIR wavelengths, i.e., 0.44 (), 0.48 (), 0.55 (), 0.64 (), 0.65 (), 0.80 (), 3.4 () and 4.6 (), taken from our observations and from the data archives of ZTF and NEOWISE). The details of the ZTF filter system are available in Bellm et al. (2018). Currently, we do not have any magnitude conversion system from the ZTF filter system to the Johnson-Cousins system. However, the ZTF system is calibrated using the Panoramic Survey Telescope and Rapid Response System (Pan-STARRS; PS1) data. We have therefore used the Tonry et al. (2012) relations to transform ZTF photometric data to the Johnson-Cousins photometric system. The magnitudes are then converted to the corresponding flux values using the online tool provided by the Gemini Observatory151515https://www.gemini.edu/observing/resources/magnitudes-and-fluxes/conversions-between-magnitudes-and-flux. We hereby note that the data points used for the SED generation are not simultaneous but from nearby epochs.
During Phase 6, the optical colors of the V2493 Cyg has become consistently redder (cf., Section 3.2). This implies a decrease in the strength of the physical process that triggered the second outburst. The multi-epoch SEDs exhibit a change in the shape particularly in the MIR regime which is in accordance with the blueing of the MIR colors due to the brightening of the disc by viscous heating.
3.4 Spectral Features
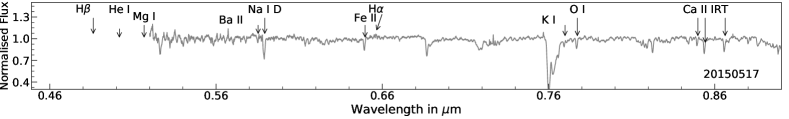
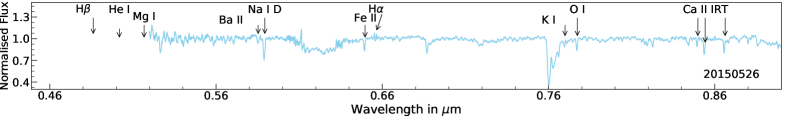
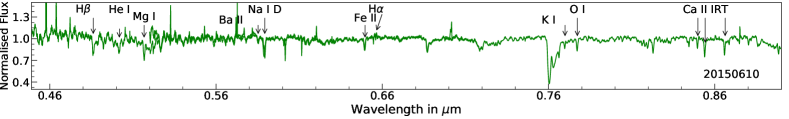
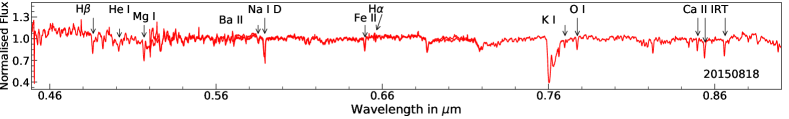
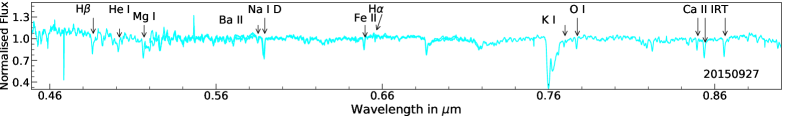
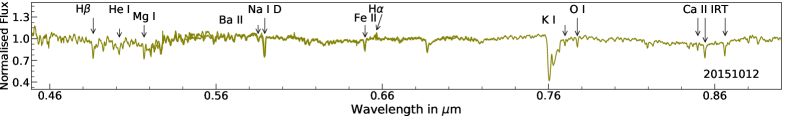
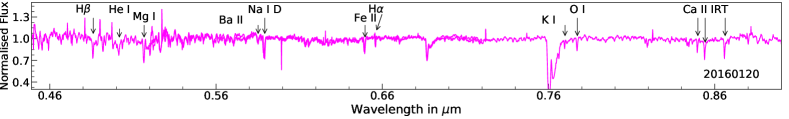
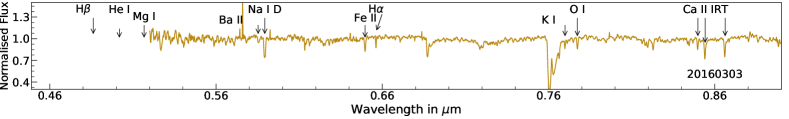
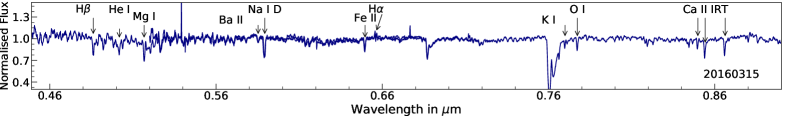
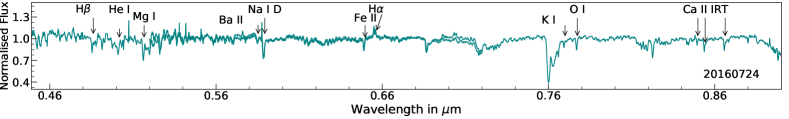
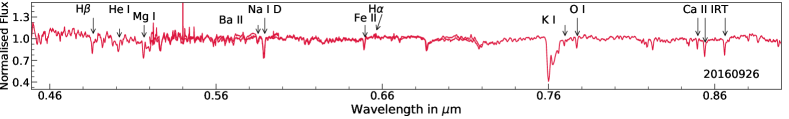
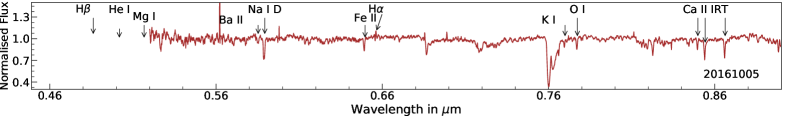
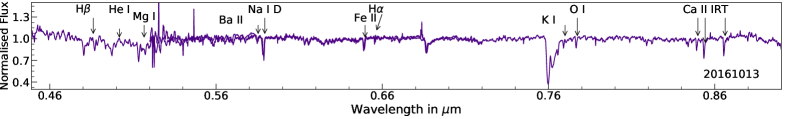
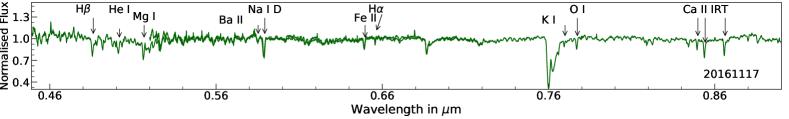
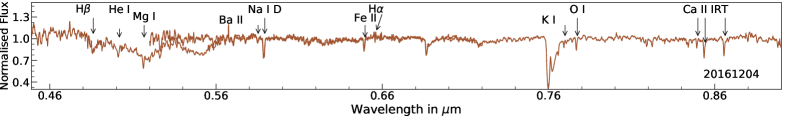
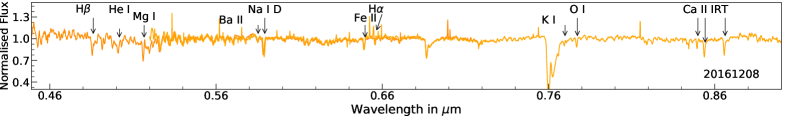
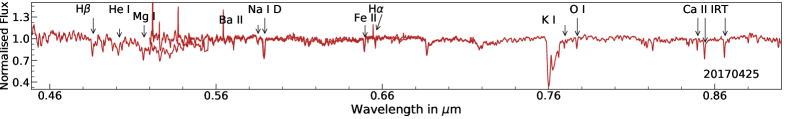
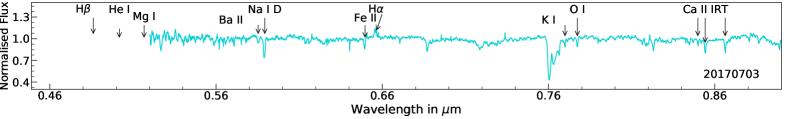
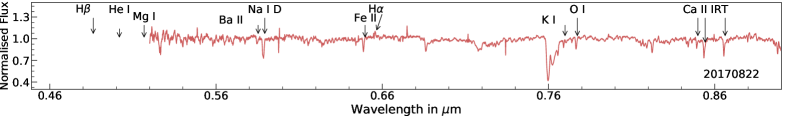
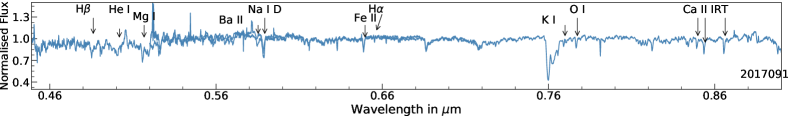
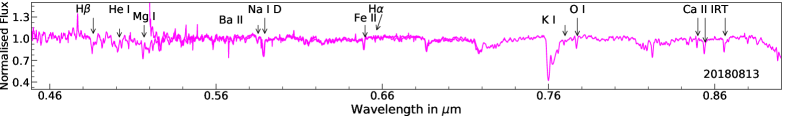
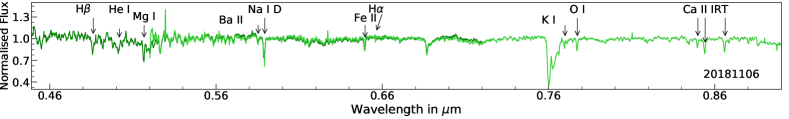
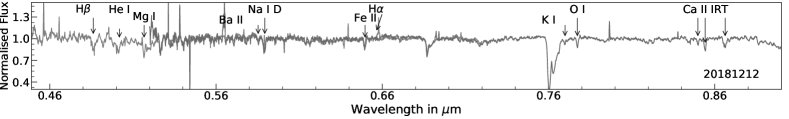
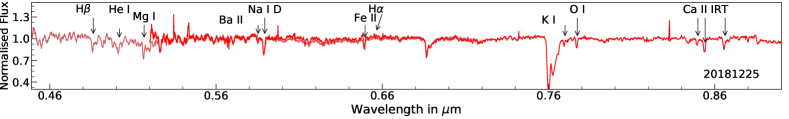
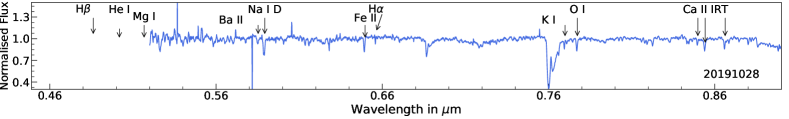
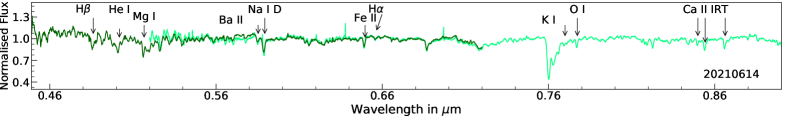
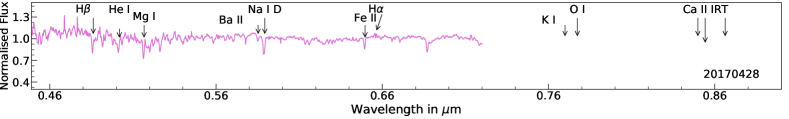
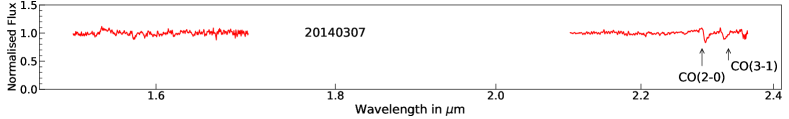
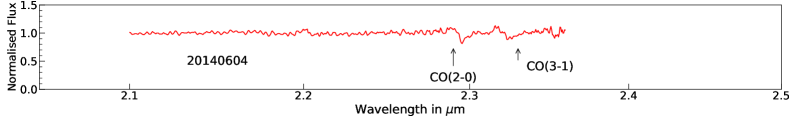
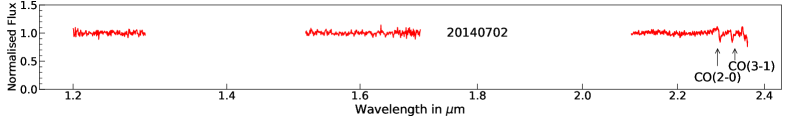
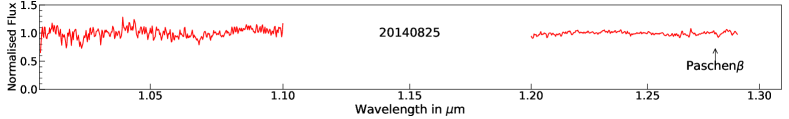
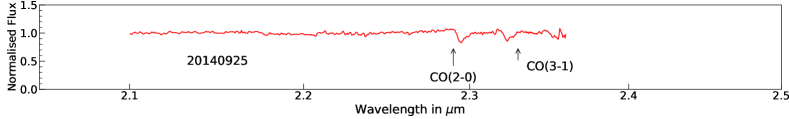
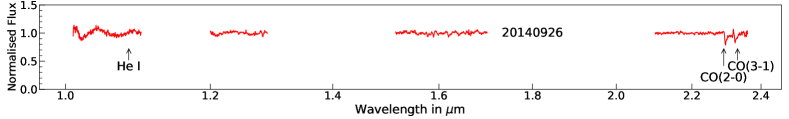
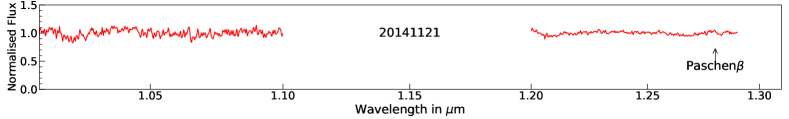
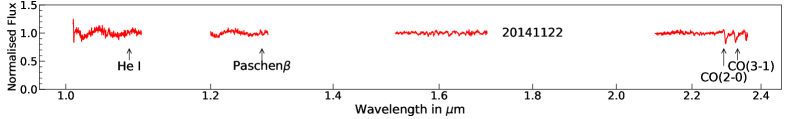
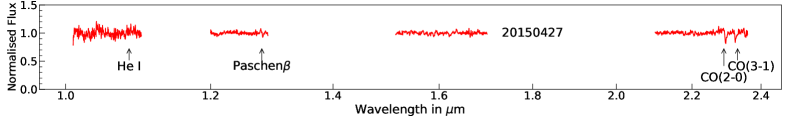
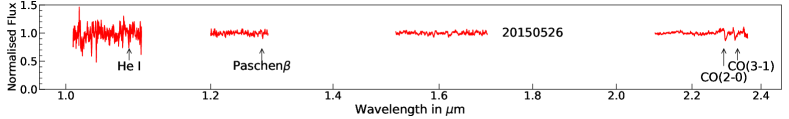
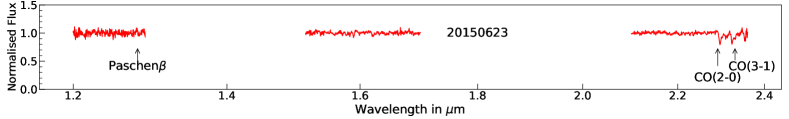
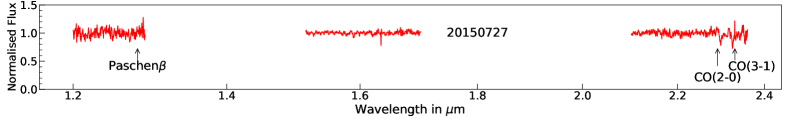
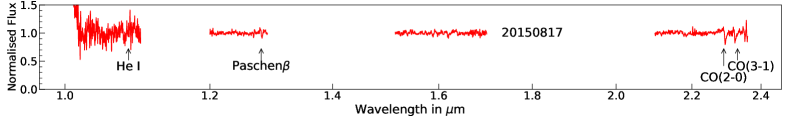
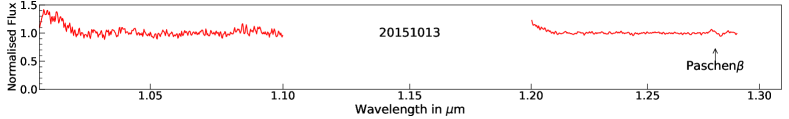
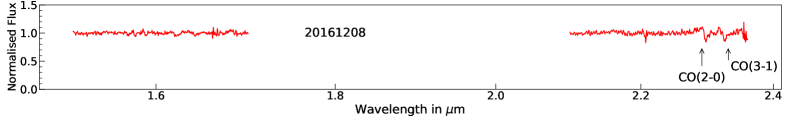
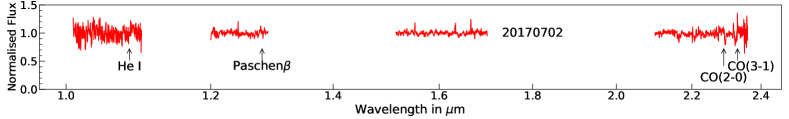
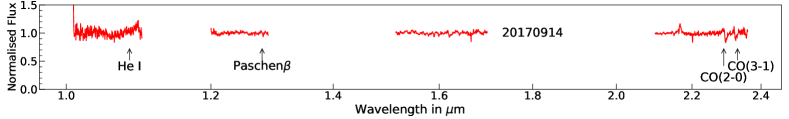
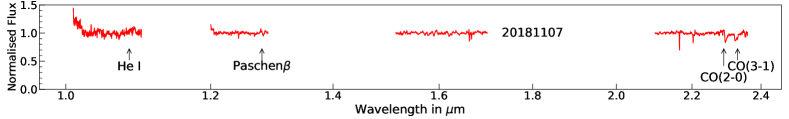
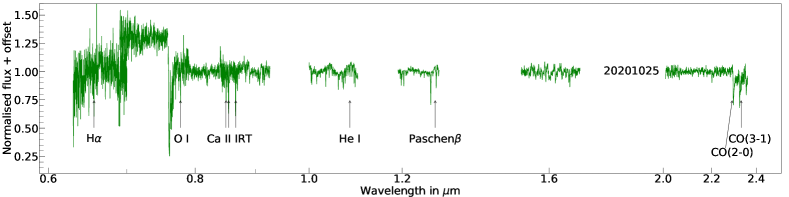
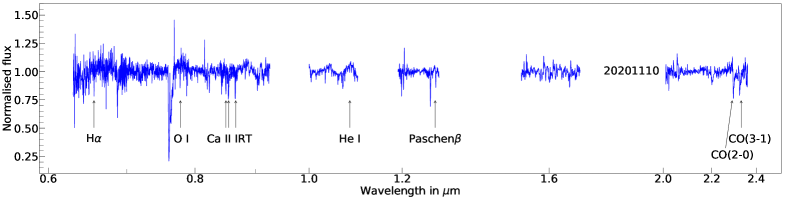
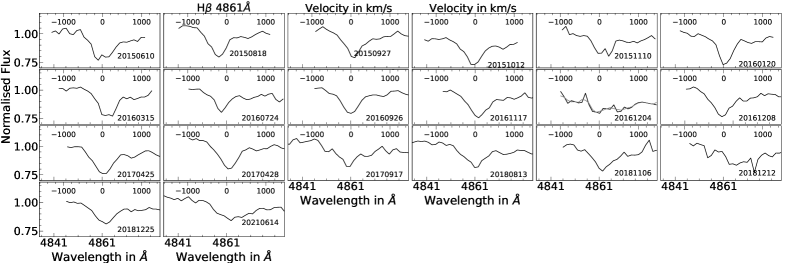
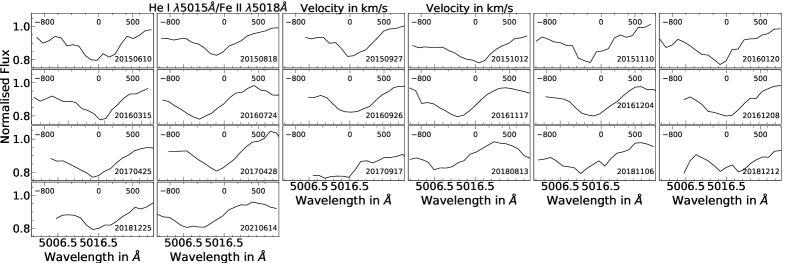
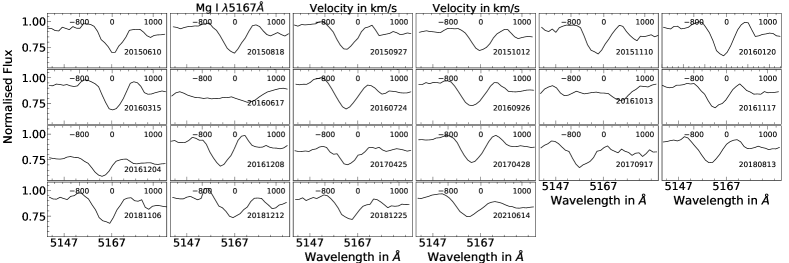
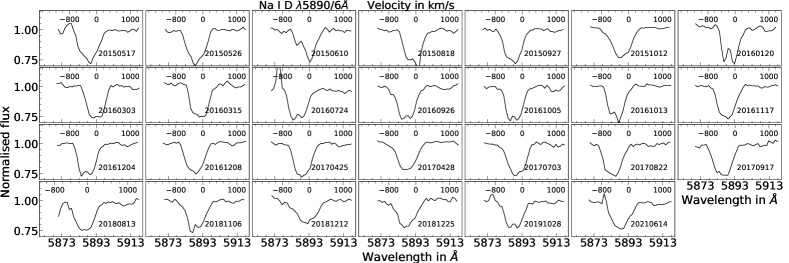
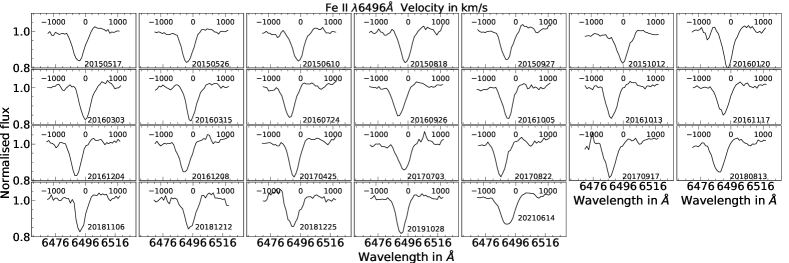
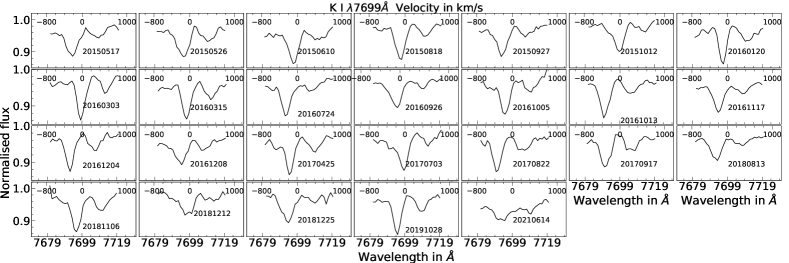
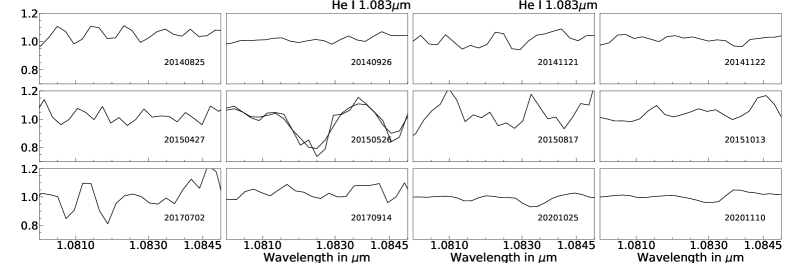
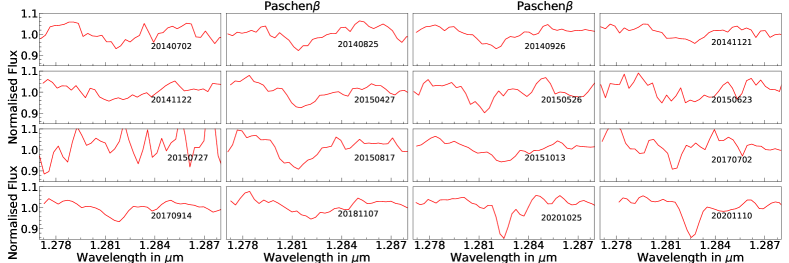
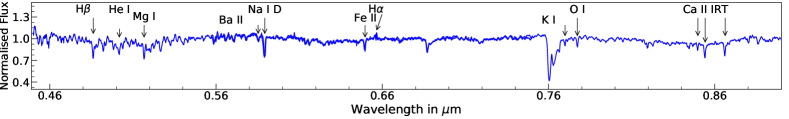
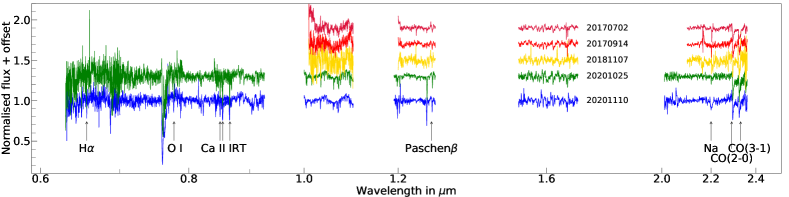
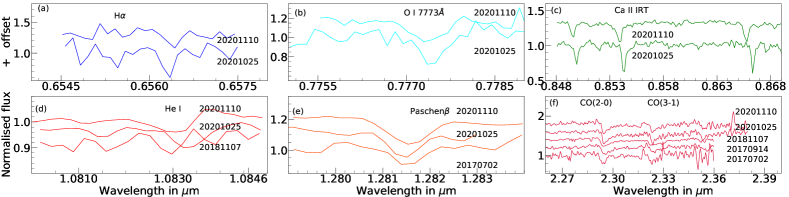
Figure 7 shows our continuum normalised optical-NIR medium resolution (0.4-2.4 m) spectra of V2493 Cyg during our monitoring period. We can easily identify the absorption features, i.e., H 4861Å , HeI 5015Å / Fe II 5018Å , Mg I at 5167Å / Fe II at 5169Å , Ba II 5853Å , Na I D resonance lines 5890/6 Å , Fe II 6496Å , H 6563Å , K I 7699Å , O I 7773Å , and Ca II infrared triplet (IRT) 8498, 8542 and 8662 Å in the optical part of the spectrum. These absorption features are mostly blue-shifted which indicate that the powerful winds are coming out from V2493 Cyg (The wind velocities are discussed in detail in Section 3.7 ). One of the important spectral feature that is not detected in our HFOSC spectrum is the Li I 6707 Å line. In FUors, this feature is observed in absorption. The presence of Li I confirms the PMS stage of FUors as lithium gets destroyed in the main sequence stage (Hartmann, 1998). The absorption feature in Li I is also indicative of the shell like features as observed in other bona-fide FUors (Szabó et al., 2021). The absence of Li I 6707 Å is likely because the spectral feature is too weak to be detected in our HFOSC spectrum. In the NIR wavelengths, we can identify several distinct absorption features, e.g., the CO (CO(20) and CO(31)) bandheads, Paschen (5-3) 1.28 m line and He I 1.083 m line. With the TANSPEC spectra, we can additionally identify few more lines in absorption, like the Br (11-4) 1.68 m line, Paschen (6-3) 1.09 m, the Ca II IRT, O I 7773Å and H. We have computed the equivalent widths ‘Wλ’ of the important spectral lines and are listed in the Table 5. The evolutions of the profiles of the above lines during our spectroscopic monitoring period, i.e., 2014 March 7 to 2021 June 14, are shown in the Figure 8. Few of the optical lines, i.e., H, Ca II IRT and O I lines, and NIR lines, i.e., CO bandheads, Paschen lines, He I 1.083 m which are important diagnostic tools for the accretion and outflow mechanisms, are discussed below.
3.4.1 Evolution of the H line
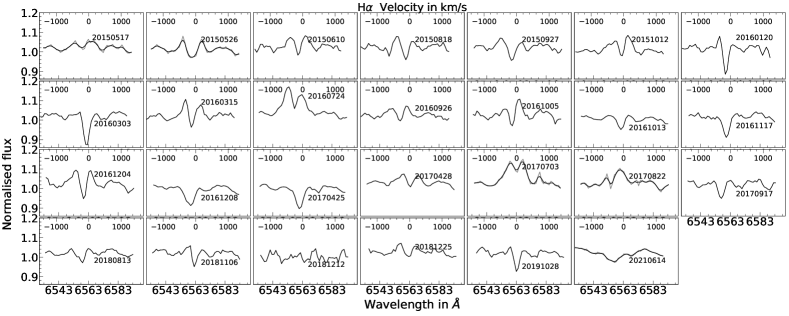
The H line observed in YSOs originates from a variety of processes like accretion, outflowing winds, etc. Therefore, the time series analyses of the H line profile can help us to constrain the physical processes responsible for their origin and variations (Hartmann et al., 1990). During our monitoring period, the line that showed the most riveting evolution is the H line. Previously, Miller et al. (2011) have found the H line to be in emission in their low resolution optical spectra taken on 2010 September 16 and 2010 November 2. However, during their monitoring period of 40 days, the H emission flux decreased by almost a factor of 0.5 from 2.81030 erg s-1 to 1.51030 erg s-1. The high resolution spectra of V2493 Cyg taken between 2010 to 2014 revealed the P Cygni profile of H line (Miller et al., 2011; Lee et al., 2015). The time evolution of H line from these spectra also showed a decrease in the emission peak of the P Cygni profile, particularly from 2013 onwards (cf., Figure 1 of Lee et al. (2015) ). This evolution of the H profile likely points towards the changing of the physical conditions responsible for the outflowing winds from regions close to the accretion (Hartmann et al., 1990; Kurosawa et al., 2006). We have started our spectroscopic monitoring of V2493 Cyg from 2015 May 17. The H line was present on 2015 May 17 with a primary peak at 6563Å along with a secondary blue-shifted peak which was about half of the primary peak’s strength. This profile remained till 2015 June 10. The H line profile changed in the spectrum obtained on 2015 August 18 where the primary peak became half of the secondary blue-shifted emission peak. The spectrum obtained on 2015 September 27 displayed a blue-shifted absorption trough which then changed to a self absorption profile as observed in the spectrum obtained on 2015 October 12. Spectra obtained on following epochs on 2016 January 20 and 2016 March 03 shows that the P Cygni profile changed to a absorption trough. Our spectra obtained on 2016 March 15 onwards till 2016 July 24 showed a H profile that is similar to the profile observed on 2015 August 18. The spectrum obtained on 2016 September 26 displayed a weak P Cygni profile which became prominent in the spectrum taken on 2016 October 5. Subsequently, P Cygni profile disappeared and an absorption trough appeared on 2016 October 13 and it remained till 2017 April 25. The absorption trough changed to a line profile displaying emission feature in the spectrum obtained on 2017 April 28. The observed emission profile is similar to the profiles previously observed on 2015 August 18 and 2016 March 15. The line profile of H as observed on the next two dates of observation, i.e, 2017 July 3 and 2017 August 22, is similar to the profile as observed on 2015 May 17. We then note the reappearance of the absorption feature starting from 2017 September 17 and remained in absorption till the end of our spectroscopic monitoring period, i.e, upto 2021 June 14 with one exception on 2018 December 12 where the H line was absent.
The variation in the line profile of H during our monitoring period indicates towards changes in the structure and/or speed of the outflowing winds originating from V2493 Cyg. Several of the H line profiles that we have observed during our monitoring period match with the atlas of H profiles as published by Reipurth et al. (1996). The variation of the H profile in T Tauri stars for a variety of scenarios has been previously studied in detail by Hartmann et al. (1990) and Kurosawa et al. (2006). Emission profile in H as seen in the spectrum of Miller et al. (2011) corresponds to the Type I line profiles of the Reipurth et al. (1996) atlas. This type of line profile is reproduced in a accretion dominated regime with accretion rates in excess of 10-8 M⊙/yr with relatively weak disc winds and the system is viewed in a high inclination (Kurosawa et al., 2006). It is worthwhile to mention here that Kóspál et al. (2011a) calculated the inclination of the V2493 Cyg to be 73 deg which is regarded as a high inclination angle. The line profile observed on 2015 June 10 and similar profiles observed in other dates during our monitoring period are categorized as Type II-B in the H atlas. This type of profile is produced by the disc wind magnetosphere hybrid model of Kurosawa et al. (2006). The main feature of this line profile is high wind accelerations. The line profile observed on 2016 March 15 and similar line profiles on the other dates of our monitoring period are classified as Type II-R (Type II-R line profile is defined as a line profile that consists of a secondary red peak whose strength is in excess of half the strength of the primary peak), according to the classification scheme of Reipurth et al. (1996). This type of line profile is also reproduced by the hybrid model of Kurosawa et al. (2006). According to this hybrid model, Type II-R is characterized by the decrease in wind acceleration. With the help of these hybrid models, we can also put a constrain on the temperature of the V2493 Cyg system to be 7500 K. We have also observed the P Cygni profile in H which is attributed to outflowing winds from regions close to accretion. The evolution of H profile into a P Cygni feature from a self absorption feature can be possibly explained by the variations in the collimation of the outflowing winds as shown by the models of Kurosawa et al. (2006). We have also observed H to be in absorption on multiple dates during our monitoring period. The absorption features in H also help us to put a constrain on the temperature of the system. The temperature of the region producing absorption features in H is below 5000 K as evident from Model 4 in Table 1 of Hartmann et al. (1990). The change in line profile from emission to absorption therefore indicates a change in temperature of the outflowing winds producing H (Hartmann et al., 1990; Kurosawa et al., 2006). This change in the outflowing wind structure can be possibly attributed to the small scale photometric variations in the LC of V2493 Cyg even though there is no significant change in the accretion rate as evident from the SEDs (c.f. Section 3.3).
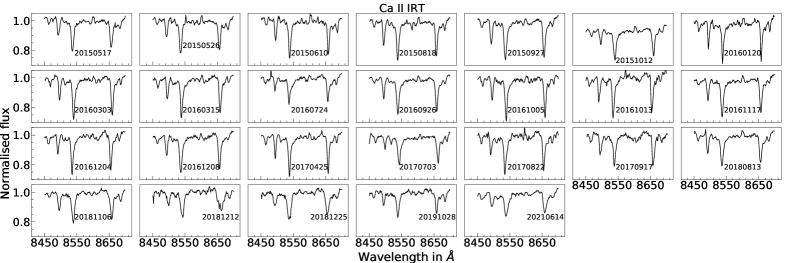
3.4.2 Ca II IR Triplet lines
The Ca II IRT lines are found to be in absorption throughout our monitoring period. Previously, Ca II 8498Å line displayed a P Cygni profile from 2010 to 2012 before transitioning to the absorption feature on 2013 April 21 (cf., bottom panel of Figure 1 of Lee et al. (2015)). Combining our spectroscopic monitoring with that of Lee et al. (2015), we see that there is a gradual transition of Ca II 8498Å line from the P Cygni profile to the absorption feature. This points towards the heavy outflow during our monitoring period.
The profile of the Ca II IRT line 8542Å is very similar to the isothermal wind models (Model 2 to 4) developed by Hartmann et al. (1990). The models take into account a variety of system temperatures ranging from 20000 K to 5000 K. The H line profile variations as discussed in Section 3.4.1 are produced by systems having temperature in the range 5000 - 7500 K. Therefore, the models named as Model 3(I) and Model 4(I) are the likely models that can explain the observed profiles. This also helps us to constrain the density of the region to be around 1012 cm-3.
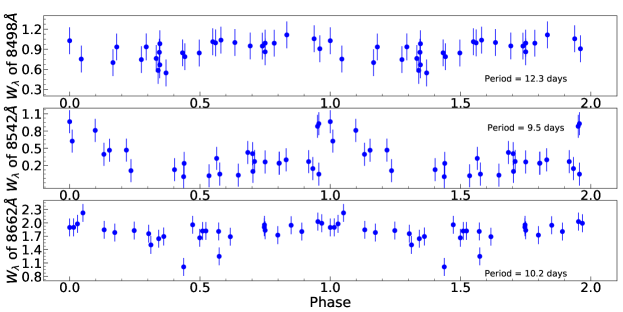
The mean values of Wλ for the Ca II IRT lines are estimated as 0.80.1, 2.20.3 and 1.80.2 Å . The low scatter values indicate that the density of the absorbing regions remained almost constant during our monitoring period. The ratio of the Wλ between 8542 Å and 8662 Å during our monitoring period is 2.2:1.8 = 1.2:1. This value is lower than the intensity of the atomic transition strengths of these lines which is 1.8 :1, even after incorporating the error bars. Hence, the regions producing the absorption features of Ca II are not optically thin. This observed feature of Ca II spectral lines can be likely due to the high mass-loss winds from V2493 Cyg. The observed blue-shifted absorption features in Na I D lines in the spectrum lend further credence to this scenario. This is because the Na I atom is easily ionised and is observed only in densest or high mass-loss rate wind models (Hartmann et al., 1990). We also searched for periodicities in the Wλ of the Ca II IRT lines. The periodicity search was done using the Period161616 http://www.starlink.ac.uk/docs/sun167.htx/sun167.html software (Currie et al., 2014), which works upon the principle of LombScargle (LS) periodogram (Lomb, 1976; Scargle, 1982), to determine the period in the Wλ of the triplet. The advantage of the LS method is that it is effective even in case of the data set being nonuniformly sampled. We have also used the NASA Exoplanet Archive Periodogram171717https://exoplanetarchive.ipac.caltech.edu/docs/tools.html service for cross verification. The periods determined using both the softwares matched well. The periods obtained for the IRT lines are 12.3 days, 9.5 days and 10.2 days, respectively. Figure 9 shows the phase folded data of the IRT lines covering our entire monitoring period. However, we note that the periodicities are calculated with a 2 level of confidence, hence we refrain from interpreting about its possible implications.
| Date | Julian date | H | Fe II | Mg I/FeII | Ba II | Na I D | Fe II | K I | O I | Ca II IRT | ||
|---|---|---|---|---|---|---|---|---|---|---|---|---|
| 5018Å | 5167Å /5169Å | 5853Å | 6496Å | 7699Å | 7773Å | |||||||
| 2015-05-17 | 2457160 | 0.8 | 3.7 | 1.4 | 0.6 | 1.3 | 0.9 | 2.2 | 1.5 | |||
| 2015-05-26 | 2457169 | 1.4 | 3.1 | 1.4 | 0.6 | 1.6 | 1.1 | 2.5 | 1.8 | |||
| 2015-06-10 | 2457184 | 3.3 | 2.7 | 2.5 | 1.3 | 3.2 | 1.6 | 0.6 | 1.7 | 0.9 | 2.2 | 1.8 |
| 2015-06-10 | 2457184 | 3.3 | ||||||||||
| 2015-08-18 | 2457253 | 2.9 | 2.5 | 2.6 | 1.0 | 3.5 | 1.5 | 0.6 | 1.6 | 1.4 | 3.4 | 1.9 |
| 2015-09-27 | 2457293 | 4.7 | 2.1 | 2.6 | 1.3 | 3.2 | 2.1 | 0.6 | 1.6 | 1.5 | 2.7 | 2.4 |
| 2015-10-12 | 2457308 | 3.1 | 2.3 | 2.2 | 1.2 | 3.1 | 1.4 | 0.6 | 1.3 | 0.9 | 2.0 | 1.9 |
| 2015-11-10 | 2457337 | 3.3 | 3.2 | 2.4 | 0.6 | 3.2 | 1.4 | |||||
| 2016-01-20 | 2457408 | 2.3 | 3.0 | 2.5 | 1.4 | 3.5 | 1.7 | 0.5 | 1.3 | 1.0 | 1.9 | 1.7 |
| 2016-03-03 | 2457450 | 0.8 | 3.1 | 1.5 | 0.6 | 1.3 | 0.9 | 2.6 | 2.3 | |||
| 2016-03-15 | 2457463 | 3.4 | 2.8 | 2.4 | 0.9 | 3.2 | 1.4 | 0.5 | 1.3 | 1.0 | 2.0 | 2.2 |
| 2016-06-17 | 2457557 | 1.4 | 3.3 | 1.5 | 0.6 | 1.3 | 1.1 | 2.5 | 2.2 | |||
| 2016-07-24 | 2457594 | 3.2 | 2.6 | 3.2 | 1.7 | 3.7 | 1.4 | 0.6 | 1.4 | 0.6 | 1.6 | 1.3 |
| 2016-09-26 | 2457658 | 3.1 | 2.4 | 2.5 | 0.9 | 3.6 | 1.3 | 0.7 | 1.3 | 1.1 | 2.3 | 2.3 |
| 2016-10-05 | 2457667 | 0.8 | 3.3 | 1.4 | 0.6 | 1.6 | 1.1 | 2.5 | 2.1 | |||
| 2016-10-13 | 2457675 | 0.8 | 3.3 | 1.4 | 0.6 | 1.1 | 1.2 | 2.2 | 1.9 | |||
| 2016-11-17 | 2457710 | 4.2 | 2.5 | 2.6 | 0.9 | 3.3 | 1.3 | 0.5 | 1.4 | 1.2 | 2.5 | 2.1 |
| 2016-12-04 | 2457727 | 3.0 | 2.3 | 0.8 | 3.2 | 1.3 | 0.5 | 1.3 | 0.7 | 2.2 | 1.8 | |
| 2016-12-08 | 2457731 | 3.6 | 2.8 | 2.3 | 0.7 | 3.0 | 1.6 | 0.7 | 1.4 | 0.9 | 2.4 | 2.0 |
| 2017-04-28 | 2457872 | 3.1 | 1.0 | 2.2 | 1.1 | 3.3 | 1.3 | |||||
| 2017-07-03 | 2457938 | 1.9 | 1.6 | 2.1 | 1.1 | 3.4 | 1.2 | 0.7 | 1.0 | 0.5 | 1.8 | 1.7 |
| 2017-08-22 | 2457985 | 0.8 | 3.2 | 1.3 | 1.2 | 0.8 | 2.3 | 2.1 | ||||
| 2018-08-13 | 2458344 | 3.4 | 2.2 | 0.9 | 3.2 | 1.3 | 0.4 | 1.4 | 0.9 | 2.3 | 1.7 | |
| 2018-11-06 | 2458429 | 3.8 | 1.9 | 2.4 | 1.6 | 3.3 | 1.5 | 0.6 | 1.6 | 1.0 | 1.9 | 1.7 |
| 2018-11-21 | 2458444 | |||||||||||
| 2018-12-12 | 2458465 | 4.4 | 2.9 | 2.1 | 0.6 | 3.7 | 1.6 | 0.5 | 1.5 | 0.9 | 2.0 | 2.6 |
| 2018-12-25 | 2458478 | 3.9 | 3.3 | 2.3 | 0.7 | 3.2 | 1.5 | 0.6 | 1.7 | 0.9 | 2.3 | 1.8 |
| 2019-10-28 | 2458785 | 0.8 | 2.7 | 1.4 | 0.6 | 1.5 | 0.5 | 1.4 | 1.5 | |||
| 2021-06-14 | 2459380 | 4.9 | 2.1 | 2.1 | 0.7 | 3.3 | 1.5 | 1.1 | 0.5 | 1.6 | 1.6 | |
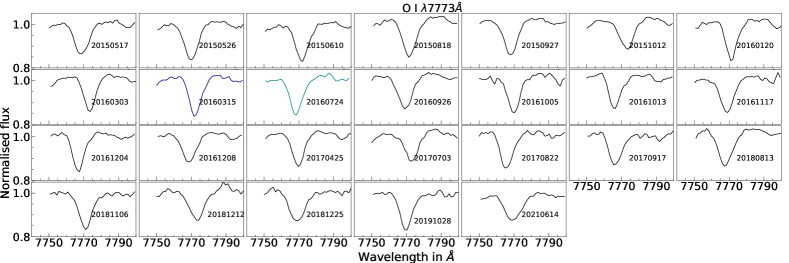
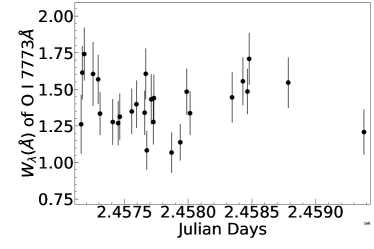
3.4.3 O I line
O I line at 7773Å is formed in the broad component regions (BCR) which corresponds to the warm gas in the envelope or the hot photospheres above the disc in the T Tauri stars. This is because the high energy state of O I 7773Å (9 eV) prevents its formation in the photospheres of cool stars (Hamann & Persson, 1992). Thus, O I 7773Å is an indicator of disc turbulence. In the previous studies on V1647 Ori and V899 Mon, Ninan et al. (2013, 2015) have shown that the Wλ of O I 7773Å varies significantly as the sources transitioned from the quiescent stages to the outburst stages. Therefore, continuous monitoring of O I line provides clues about the surrounding environment of the central source. The mean value of Wλ of O I at 7773Å during our monitoring period is estimated as 1.40.2 Å . The scatter in the Wλ values is of the order of error in the estimation of Wλ, thereby, indicating that after the second outburst, the inner glowing hot part of the disc has remained stable.
3.4.4 NIR spectral features
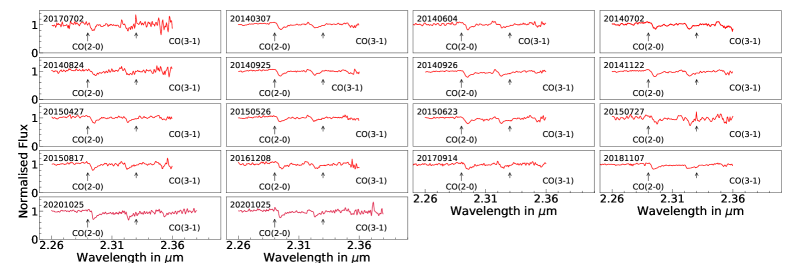
CO bandheads: The CO (20) and (31) bandhead spectral absorption features starting at 2.29 m are one of the defining characteristics of FUors (Hartmann, 1998).
These overtone features are generally observed in many YSOs (either in emission or in absorption) and in giants.
In the FUor/EXor family of sources, these bandhead CO features are believed to originate in the inner part of the heated disc where the temperature ranges between 2000 K T 5000
K and
density nH is 1010 cm-3 (Calvet et al., 1991; Kóspál et al., 2011b).
As previously reported by
Leoni et al. (2010) and Miller et al. (2011), the CO bandhead features in V2493 Cyg are in absorption. During our monitoring period also, we have found that the CO bandhead
features to be in absorption. The strength of the bandheads in absorption remained almost the same during our monitoring period. The absorption feature in CO bandheads therefore implies that the
surface temperature of the inner part of the disc remained hotter than the middle layer of the
disc (c.f. Figure 7 of Calvet et al. 1991).
Metallic lines: The metallic line of Na 2.208 m is not detected during our spectral monitoring. The Na 2.208 m if present, follows the profile of
CO bandheads in K owing to their similar ionisation potentials (Lorenzetti et al., 2009).
Paschen lines: We have also identified several Paschen lines in our NIR spectra. All the Paschen lines are found to be in absorption. The Paschen line is most prominent in the Paschen family and is observable in both the TIRSPEC and TANSPEC spectra. The absorption features present in Paschen is one of the defining characteristics of FUors (Connelley & Reipurth, 2018). We could detect the Paschen (6-3) spectral feature in our TANSPEC spectra. The Paschen lines are in absorption
therefore indicating their origin from the inner disc due to accretion/wind physics (Miller et al., 2011).
Brackett lines: The hydrogen Brackett (11-4) line is detected in absorption. Previously, Leoni et al. (2010), have reported the observed absorption feature in the Brackett 11 line.
During our monitoring period, we have observed a weak Brackett 11 absorption feature only once with TANSPEC in the spectrum obtained on 2020 October 25. This feature is also blue-shifted, possibly indicative of similar origin like that of Paschen lines.
1.083 m He I: During our monitoring period, we have also observed the absorption feature in He I 1.083 m. This absorption
feature is produced due to the resonant scattering of the 1.083 m photons by the metastable triplet state of Helium. This metastable
state of Helium is produced by the EUV to X-ray radiations due to accretion. The absorption feature of He I 1.083 m is attributed to outflows generated due to accretion.
3.5 Correlation between equivalent width ‘Wλ’ of spectral lines
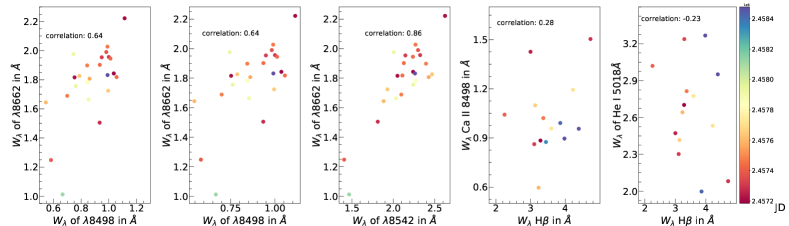
Correlation between the Wλ of different spectral lines provides an important diagnostic tool to probe the physical association between different regions of a PMS star undergoing outburst (Hamann & Persson, 1992; Ninan et al., 2013). This in turn help us in constraining/refining the various physical models that are used to describe these episodically accreting systems. Here, we have also tried to see the correlation (Pearson correlation coefficient) between the Wλ of various lines and few of them are shown in Figure 10.
The emission lines of the Ca II IRT originate from/or near the accretion funnels in a magnetospheric accretion in low mass YSOs (Muzerolle et al., 1998). Therefore, these emission lines are found to be tightly correlated as seen in the case of the V1647 Ori (r=0.88, Ninan et al., 2013). In case of V2493 Cyg, the Ca II IRT lines are in absorption. Correlation between the absorption features of the Ca II IRT to our knowledge has not been studied before. We have calculated the correlation between the absorption features of the Ca II IRT (between Wλ of 8498Å with 8542Å or with 8662Å) and found that the coefficients are moderately correlated (r0.6). This moderate correlation is likely due to the additional physical process of the strong outflowing winds occurring with the magnetospheric accretion. The correlation coefficient between the Wλ of 8542Å line and 8662Å line is bit tighter with r=0.86.
We have found very weak correlations between the 8498Å line of the Ca II IRT and H line (r0.2) and H and He I 5015Å /Fe II 5018Å lines (r=0.28). This implies weak physical connection between these absorbing regions.
The Ca II IRT lines act as tracers of the accretion rate, while the O I 7773Å is used as a proxy to monitor the disc turbulence. As both the lines originate in the BCR regions of the T Tauri stars (Hamann & Persson, 1992), we investigated the correlation between these lines and did not find any. This could be due to no connection between the absorbing regions. We also did not find any correlation between the Na I D lines and the Fe II 6496Å which implies that the regions from which they originate are independent of each other.
3.6 Medium Resolution Echelle Spectra
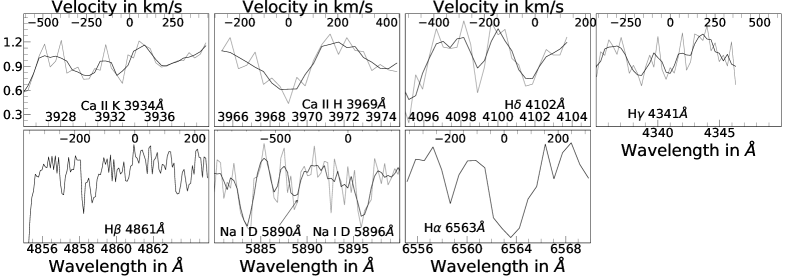
The medium resolution echelle spectra obtained from MRES displayed blue-shifted absorption features that trace the outflowing disc winds. We can identify the Ca II H and K lines (3934Å and 3969Å ), H 4102Å , H 4341Å , H, Na I D, and H lines, etc. The Ca II H and the Ca II K line is tracing a wind velocity of around 75 km/s. The outflowing wind velocity as traced by the hydrogen Balmer series lines, H, H is 150 km/s and 350 km/s, respectively. The wind velocity traced by H is 250 km/s. H line is found to be in absorption. The absorption feature in H observed using MRES is consistent with the absorption feature that we observed in our HFOSC spectra from 2019 October 28 onwards. Both the Na I D lines at 5890 and 5896 are blue-shifted and trace wind velocities of km/s and km/s respectively. Figure 11 shows the plot of the outflowing wind features obtained from the MRES spectrum.
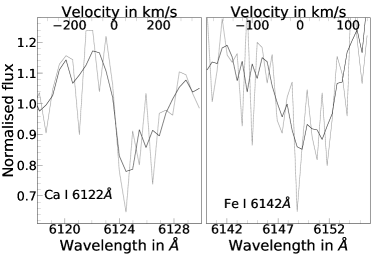
We also identify two neutral metallic lines Ca I 6122Å and Fe I 6142Å in our MRES spectrum (cf. top panel of Figure 12). Previously, Lee et al. (2015) had identified these two lines during their high resolution spectroscopic monitoring using HET-HRS and attributed the presence of these lines as evidence for disc rotation. They further concluded from their spectroscopic monitoring about the steady rebuilding of the inner disc post outburst. Our detection of these two neutral metallic lines also points towards similar conclusion. Bottom panel of Figure 12 shows the evolution of the O I 7773Å during our monitoring period. The variation of Wλ of the O I 7773Å is within the error bars, which therefore possibly implies towards the stabilisation of the disc post the second outburst. The Wλ of O I 7773Å is believed to be an indicator of disc turbulence (Hamann & Persson, 1992).
3.7 Outflow wind velocities
Strongly blue-shifted absorption lines are one of the defining characteristics of bona-fide FUors. The wind features observed in V2493 Cyg varied with time during our monitoring period. We have calculated the outflow wind velocities of V2493 Cyg from several absorption lines, i.e., H, He I 5015Å /Fe II 5018Å , Mg I 5167Å /Fe II 5169Å , Ba II 5853Å , Na I D, Fe II 6496Å , K I 7699Å and the Ca II IRT lines (Hartmann, 1998), and these are listed in the Table 6. We have found variation in the shape of the H line profile during our monitoring period.During our monitoring period, the H line was not detected on 2016 June 17 but it re-appeared on 2016 July 24. H was undetected again on 2016 October 13 before re-appearing again on 2016 November 17. The absorption profile of H almost disappeared in 2016 December 04 while it re-appeared prominently again on 2016 December 08. Similar behaviour in the H line evolution is again observed on 2018 December 12. The variation in the line profile of H coincided with the line profile variations of H, therefore likely pointing towards a common origin. The shape of the line profile of He I 5015Å /Fe II 5018Å also varied during our monitoring period. The He I 5015Å /Fe II 5018Å displayed absorption profile till 2017 April 28. The absorption profile disappeared from our spectra on 2017 September 17 till the end of our monitoring period upto 2021 June 14. We interpret this disappearance with caution. The disappearance maybe due to the spectral feature becoming too faint to be detectable in our spectrum.
During our monitoring period, the mean velocities of the Ca II IRT lines are 7735, 8735 and 8837 km/s respectively. The mean velocities of H, He I 5015Å /Fe II 5018Å, Mg I 5167Å /Fe II 5169Å , Ba II 5853Å , Na I D, Fe II 6496Å and K I 7699Å lines come out to be 8646, 11551, 5049, 6238, 6738, 10366 and 9155 km/s respectively. The typical error in estimation of the velocities is 25 km/s (c.f Ghosh et al. 2022a), hence the large scatters in the velocities imply intrinsic variations of the wind velocity as traced by the different lines. This observation is also supported by the H line profile variations as described in Section 3.4.1.
| Date | Julian Date | H | He I/Fe II | Mg I/Fe II | Ba II | Na I D | Fe II | K I | Ca II IRT | ||
|---|---|---|---|---|---|---|---|---|---|---|---|
| 4861 | 5015/5018 | 5167/5169 | 5853 | 5890/6 | 6496 | 7699 | 8498 | 8542 | 8662 | ||
| 2015-05-17 | 2457160.267523 | 20 | 72 | 68 | 117 | 82 | 91 | 89 | |||
| 2015-05-26 | 2457169.346111 | 21 | 66 | 51 | 46 | 98 | 111 | 114 | |||
| 2015-06-10 | 2457184.332384 | 66 | 71 | 29 | 14 | 70 | 84 | 94 | 101 | 112 | |
| 2015-08-18 | 2457253.342766 | 137 | 110 | 103 | 54 | 65 | 94 | 97 | 129 | 142 | |
| 2015-09-27 | 2457293.279664 | 84 | 40 | 14 | 82 | 78 | 12 | 86 | 61 | 65 | 72 |
| 2015-10-12 | 2457308.150961 | 53 | 79 | 40 | 34 | 20 | 30 | 50 | 65 | 77 | |
| 2015-11-10 | 2457337.234954 | 165 | 193 | 45 | 70 | 84 | 12 | ||||
| 2016-01-20 | 2457408.048056 | 106 | 154 | 33 | 75 | 82 | 99 | 106 | 107 | 124 | |
| 2016-03-03 | 2457450.448137 | 13 | 17 | 47 | 53 | 72 | |||||
| 2016-03-15 | 2457463.448137 | 15 | 75 | 18 | 13 | 79 | 51 | 67 | 88 | 95 | 94 |
| 2016-06-17 | 2457557.416366 | 28 | 78 | 188 | 199 | 155 | 169 | 175 | |||
| 2016-07-24 | 2457594.171053 | 106 | 162 | 16 | 29 | 86 | 121 | 91 | 25 | 10 | |
| 2016-09-26 | 2457658.136389 | 48 | 37 | 22 | 18 | 113 | 40 | 36 | |||
| 2016-10-05 | 2457667.278981 | 46 | 56 | 93 | 31 | ||||||
| 2016-10-13 | 2457675.187049 | 103 | 134 | 169 | 184 | 105 | 104 | 100 | |||
| 2016-11-17 | 2457710.142685 | 135 | 231 | 12 | 158 | 156 | 50 | 49 | 25 | 32 | 30 |
| 2016-12-04 | 2457727.101065 | 161 | 83 | 57 | 56 | 48 | 115 | 84 | 73 | 91 | |
| 2016-12-08 | 2457731.166157 | 71 | 105 | 64 | 96 | 52 | 85 | 53 | 58 | 51 | 57 |
| 2018-08-13 | 2458344.283194 | 85 | 148 | 59 | 130 | 22 | 130 | 124 | 78 | 72 | 81 |
| 2018-11-06 | 2458429.140617 | 101 | 140 | 15 | 61 | 56 | 32 | 51 | 11 | 36 | 68 |
| 2018-12-12 | 2458465.125059 | 24 | 68 | 67 | 97 | 56 | 37 | 19 | 23 | 17 | |
| 2018-12-25 | 2458478.104021 | 40 | 73 | 10 | 114 | 57 | 16 | 27 | 56 | ||
| 2019-10-28 | 2458785.225682 | 85 | 31 | 209 | 172 | 115 | 111 | 116 | |||
| 2017-04-25 | 2457869.32894 | 68 | 89 | 62 | 51 | 67 | 194 | 160 | 131 | 134 | 139 |
| 2017-04-28 | 2457872.27083 | 90 | 110 | 44 | 57 | 27 | 128 | ||||
| 2017-07-03 | 2457938.32894 | 29 | 31 | 17 | 126 | 36 | |||||
| 2017-08-22 | 2457988.32894 | 47 | 174 | 256 | 175 | 73 | 81 | 100 | |||
| 2017-09-17 | 2458014.32894 | 198 | 245 | 95 | 57 | 221 | 179 | 78 | 118 | 99 | |
| 2021-06-14 | 2459379.53727 | 55 | 142 | 61 | 28 | 48 | 118 | 108 | 102 | 107 | 87 |
4 Discussion and Conclusion
V2493 Cyg is a bonafide FUor which underwent its first outburst in the summer of 2010 and then transitioned to a short intermediate quiescent stage before re-brightening to maximum brightness in 2012 April. We have carried out our near simultaneous spectro-photometric monitoring from 2013 September 27 till 2021 June 14. During our monitoring period, particularly in the time period spanning between 2015 and 2019, V2493 Cyg dimmed by 0.6 mag in V-band from its peak V-band magnitude on 2010 August at an average rate of 27.6 5.6 mmag/yr. The average value of the decay rate for V2493 Cyg is of the same order as that of FU Ori and BBW 76 at 14mmag/yr and 23 mmag/yr, respectively (Audard et al., 2014). The similar timescales of the decay rates therefore possibly point towards the occurrence of similar relaxing phenomenon in V2493 Cyg as that in FU Ori and BBW 76. This is typical behaviour of FU Ori type objects post outburst. As the inner disc of FU Ori type stars depletes, and it takes around 100 years for the inner part of the disc to be completely depleted (Audard et al., 2014). Our simultaneous optical , and band photometry revealed significant color changes in the Phase 6 compared to the previous phases with VRC color and VIC color becoming redder by 0.14 and 0.32 mag, respectively. This feature is also evident in the multi-epoch SEDs where the slope at the optical regime has become steeper indicating reddening of the optical colors. The physical origins of the optical color evolution of V2493 Cyg was further studied using the recently developed theoretical models based on the optical CMD parameter space by (Liu et al., 2022). The isomass curves divides the regions of the optical CMD plane into regions based on the nature of accretion. The evolution of optical colors during our monitoring reveals that V2493 is still accreting via the boundary layer accretion, the so called “FUor regime”. Therefore, the reddening of the optical colors is likely due to the expansion of the emitting region around V2493 Cyg. Similar conclusion has been derived by Semkov et al. (2021) in their study. The NIR color evolution also follows the trend of the optical colors which possibly hints towards a similar conclusion as that of the optical colors.
The most interesting photometric evolution of V2493 Cyg is its MIR color evolution. While the optical colors became redder in Phase 6, we have found that the MIR colors , obtained from the NEOWISE survey, became bluer. The blueing of the MIR colors as observed in the case of V2493 Cyg can be possibly attributed to the brightening of the disc due to the boundary layer accretion (Liu et al., 2022).
Combining our spectroscopic data with the previously published data by Lee et al. (2015), we see that there is a gradual transition from the P-Cygni profile to absorption feature in the Ca II 8498 Å line. The remaining two lines of the Ca II IRT are also found to be in absorption during our monitoring period. Such transition to the absorption features points towards the heavy outflow regime during our monitoring period. Combining the results of the evolution of H line during our monitoring period with that of Miller et al. (2011), we find that the emission feature evolved into Type II-B, Type-II R, P-Cygni profile and absorption features as categorised by the H atlas of Reipurth et al. (1996). Theoretical modelling of these variety of line profiles by Hartmann et al. (1990); Kurosawa et al. (2006) reveals that the observed profiles is a result of the outflowing winds modulated by variable wind acceleration. The temperature of the systems also varies in between 5000 K to 7500 K in the aforementioned different models. These variations can also be observed in the R-band LC of V2493 Cyg. We have also studied the evolution of the O I 7773 Å line and found that the scatter in its Wλ is of the order of the error in estimation of Wλ. This implies at possible stabilization of the disc after second outburst. Previous studies on V1647 Ori and V899 Mon by Ninan et al. (2013, 2015) and Gaia 20eae by Ghosh et al. (2022a) have revealed that this line acts as tracer of disc turbulence. Any sudden variations of the Wλ of O I 7773Å line point towards the possible transition between active and quiescent states. This view is also enhanced by the presence of the neutral metallic lines of calcium and iron at 6122 and 6142Å respectively as observed in the MRES spectrum. These lines have attributed as signatures of disc rotation by Lee et al. (2015) which they stated as evidence for the steady re-building of the inner disc post the second outburst. The NIR spectra of V2493 Cyg consist of the blue-shifted absorption features indicative of the outflowing winds from the source. The most notable spectral features that were not detected in the spectrum of V2493 Cyg is the Br 2.16 m. Br is an important tracer of the accretion rate and is typically observed in highly accreting T Tauri stars, though it is absent in many FUors (Ninan et al., 2015). In the NIR spectrum, we have detected the He I 1.083 m feature. The He I 1.083 m acts a proxy indicator for the outflowing winds generated due to the enhanced accretion rate (Ghosh et al., 2022a). Non-detection of the Br line in emission further reinforces the notion that V2493 Cyg is likely accreting via boundary layer accretion which is in conformity with the evolution of V2493 Cyg in the optical CMD plane. The NIR spectroscopic features of CO bandheads display almost no variations during our monitoring. Therefore, it can be empirically stated that there has been no appreciable change in accretion rate post second outburst as the strength of the bandheads is directly related to the accretion rate (Calvet et al., 1991).
References
- Astropy Collaboration et al. (2013) Astropy Collaboration, Robitaille, T. P., Tollerud, E. J., et al. 2013, A&A, 558, A33, doi: 10.1051/0004-6361/201322068
- Audard et al. (2014) Audard, M., Ábrahám, P., Dunham, M. M., et al. 2014, in Protostars and Planets VI, ed. H. Beuther, R. S. Klessen, C. P. Dullemond, & T. Henning, 387, doi: 10.2458/azu_uapress_9780816531240-ch017
- Baek et al. (2015) Baek, G., Pak, S., Green, J. D., et al. 2015, AJ, 149, 73, doi: 10.1088/0004-6256/149/2/73
- Bailer-Jones et al. (2021) Bailer-Jones, C. A. L., Rybizki, J., Fouesneau, M., Demleitner, M., & Andrae, R. 2021, AJ, 161, 147, doi: 10.3847/1538-3881/abd806
- Bellm et al. (2018) Bellm, E. C., Kulkarni, S. R., Graham, M. J., et al. 2018, Publications of the Astronomical Society of the Pacific, 131, 018002, doi: 10.1088/1538-3873/aaecbe
- Calvet et al. (1991) Calvet, N., Patino, A., Magris, G. C., & D’Alessio, P. 1991, ApJ, 380, 617, doi: 10.1086/170618
- Cayrel (1988) Cayrel, R. 1988, in The Impact of Very High S/N Spectroscopy on Stellar Physics, ed. G. Cayrel de Strobel & M. Spite, Vol. 132, 345
- Cohen & Kuhi (1979) Cohen, M., & Kuhi, L. V. 1979, ApJS, 41, 743, doi: 10.1086/190641
- Connelley & Reipurth (2018) Connelley, M. S., & Reipurth, B. 2018, ApJ, 861, 145, doi: 10.3847/1538-4357/aaba7b
- Currie et al. (2014) Currie, M. J., Berry, D. S., Jenness, T., et al. 2014, in Astronomical Society of the Pacific Conference Series, Vol. 485, Astronomical Data Analysis Software and Systems XXIII, ed. N. Manset & P. Forshay, 391
- Earl et al. (2021) Earl, N., Tollerud, E., Jones, C., et al. 2021, astropy/specutils: v1.2, v1.2, Zenodo, Zenodo, doi: 10.5281/zenodo.4603801
- Ghosh et al. (2022a) Ghosh, A., Sharma, S., Ninan, J. P., et al. 2022a, ApJ, 926, 68, doi: 10.3847/1538-4357/ac41c2
- Ghosh et al. (2022b) Ghosh, S., Ninan, J. P., Ojha, D. K., & Sharma, S. 2022b, pyTANSPEC: Python tool for extracting 1D TANSPEC spectra from 2D images, Astrophysics Source Code Library, record ascl:2212.014. http://ascl.net/2212.014
- Green et al. (2013) Green, J. D., Robertson, P., Baek, G., et al. 2013, ApJ, 764, 22, doi: 10.1088/0004-637X/764/1/22
- Hamann & Persson (1992) Hamann, F., & Persson, S. E. 1992, ApJS, 82, 247, doi: 10.1086/191715
- Hartmann (1998) Hartmann, L. 1998, Accretion Processes in Star Formation
- Hartmann et al. (1990) Hartmann, L., Calvet, N., Avrett, E. H., & Loeser, R. 1990, ApJ, 349, 168, doi: 10.1086/168304
- Hartmann et al. (2016) Hartmann, L., Herczeg, G., & Calvet, N. 2016, ARA&A, 54, 135, doi: 10.1146/annurev-astro-081915-023347
- Hartmann & Kenyon (1996) Hartmann, L., & Kenyon, S. J. 1996, ARA&A, 34, 207, doi: 10.1146/annurev.astro.34.1.207
- Herbig & Bell (1988) Herbig, G. H., & Bell, K. R. 1988, Third Catalog of Emission-Line Stars of the Orion Population : 3 : 1988
- Kazarovets et al. (2011) Kazarovets, E. V., Reipurth, B., & Samus, N. N. 2011, Peremennye Zvezdy, 31, 2
- Kóspál et al. (2011a) Kóspál, Á., Ábrahám, P., Acosta-Pulido, J. A., et al. 2011a, A&A, 527, A133, doi: 10.1051/0004-6361/201016160
- Kóspál et al. (2011b) Kóspál, Á., Ábrahám, P., Goto, M., et al. 2011b, ApJ, 736, 72, doi: 10.1088/0004-637X/736/1/72
- Kóspál et al. (2016) Kóspál, Á., Ábrahám, P., Acosta-Pulido, J. A., et al. 2016, A&A, 596, A52, doi: 10.1051/0004-6361/201528061
- Kurosawa et al. (2006) Kurosawa, R., Harries, T. J., & Symington, N. H. 2006, MNRAS, 370, 580, doi: 10.1111/j.1365-2966.2006.10527.x
- Landolt (1992) Landolt, A. U. 1992, AJ, 104, 340, doi: 10.1086/116242
- Laugalys et al. (2006) Laugalys, V., Straižys, V., Vrba, F. J., et al. 2006, Baltic Astronomy, 15, 483
- Law et al. (2009) Law, N. M., Kulkarni, S. R., Dekany, R. G., et al. 2009, PASP, 121, 1395, doi: 10.1086/648598
- Lee et al. (2015) Lee, J.-E., Park, S., Green, J. D., et al. 2015, ApJ, 807, 84, doi: 10.1088/0004-637X/807/1/84
- Leoni et al. (2010) Leoni, R., Larionov, V. M., Centrone, M., Giannini, T., & Lorenzetti, D. 2010, The Astronomer’s Telegram, 2854, 1
- Liu et al. (2022) Liu, H., Herczeg, G. J., Johnstone, D., et al. 2022, ApJ, 936, 152, doi: 10.3847/1538-4357/ac84d2
- Lomb (1976) Lomb, N. R. 1976, Ap&SS, 39, 447, doi: 10.1007/BF00648343
- Lorenzetti et al. (2009) Lorenzetti, D., Larionov, V. M., Giannini, T., et al. 2009, ApJ, 693, 1056, doi: 10.1088/0004-637X/693/2/1056
- Mainzer et al. (2014) Mainzer, A., Bauer, J., Cutri, R. M., et al. 2014, ApJ, 792, 30, doi: 10.1088/0004-637X/792/1/30
- McGehee et al. (2004) McGehee, P. M., Smith, J. A., Henden, A. A., et al. 2004, ApJ, 616, 1058, doi: 10.1086/425069
- Meyer et al. (1997) Meyer, M. R., Calvet, N., & Hillenbrand, L. A. 1997, AJ, 114, 288, doi: 10.1086/118474
- Miller et al. (2011) Miller, A. A., Hillenbrand, L. A., Covey, K. R., et al. 2011, ApJ, 730, 80, doi: 10.1088/0004-637X/730/2/80
- Muzerolle et al. (1998) Muzerolle, J., Hartmann, L., & Calvet, N. 1998, AJ, 116, 455, doi: 10.1086/300428
- Ninan et al. (2013) Ninan, J. P., Ojha, D. K., Bhatt, B. C., et al. 2013, ApJ, 778, 116, doi: 10.1088/0004-637X/778/2/116
- Ninan et al. (2014) Ninan, J. P., Ojha, D. K., Ghosh, S. K., et al. 2014, Journal of Astronomical Instrumentation, 3, 1450006, doi: 10.1142/S2251171714500068
- Ninan et al. (2015) Ninan, J. P., Ojha, D. K., Baug, T., et al. 2015, ApJ, 815, 4, doi: 10.1088/0004-637X/815/1/4
- Ojha et al. (2018) Ojha, D., Ghosh, S. K., Sharma, S., et al. 2018, Bulletin de la Societe Royale des Sciences de Liege, 87, 58
- Reipurth et al. (1996) Reipurth, B., Pedrosa, A., & Lago, M. T. V. T. 1996, A&AS, 120, 229
- Rieke & Lebofsky (1985) Rieke, G. H., & Lebofsky, M. J. 1985, ApJ, 288, 618, doi: 10.1086/162827
- Safron et al. (2015) Safron, E. J., Fischer, W. J., Megeath, S. T., et al. 2015, ApJ, 800, L5, doi: 10.1088/2041-8205/800/1/L5
- Scargle (1982) Scargle, J. D. 1982, ApJ, 263, 835, doi: 10.1086/160554
- Scholz et al. (2013) Scholz, A., Froebrich, D., & Wood, K. 2013, MNRAS, 430, 2910, doi: 10.1093/mnras/stt091
- Semkov et al. (2021) Semkov, E., Ibryamov, S., & Peneva, S. 2021, Symmetry, 13, 2433, doi: 10.3390/sym13122433
- Semkov et al. (2010) Semkov, E. H., Peneva, S. P., Munari, U., Milani, A., & Valisa, P. 2010, A&A, 523, L3, doi: 10.1051/0004-6361/201015902
- Semkov et al. (2012) Semkov, E. H., Peneva, S. P., Munari, U., et al. 2012, A&A, 542, A43, doi: 10.1051/0004-6361/201219140
- Sharma et al. (2020) Sharma, S., Ghosh, A., Ojha, D. K., et al. 2020, MNRAS, 498, 2309, doi: 10.1093/mnras/staa2412
- Sharma et al. (2022) Sharma, S., Ojha, D. K., Ghosh, A., et al. 2022, PASP, 134, 085002, doi: 10.1088/1538-3873/ac81eb
- Stetson (1987) Stetson, P. B. 1987, PASP, 99, 191, doi: 10.1086/131977
- Szabó et al. (2021) Szabó, Z. M., Kóspál, Á., Ábrahám, P., et al. 2021, ApJ, 917, 80, doi: 10.3847/1538-4357/ac04b3
- Tody (1986) Tody, D. 1986, Society of Photo-Optical Instrumentation Engineers (SPIE) Conference Series, Vol. 627, The IRAF Data Reduction and Analysis System, ed. D. L. Crawford, 733, doi: 10.1117/12.968154
- Tody (1993) —. 1993, Astronomical Society of the Pacific Conference Series, Vol. 52, IRAF in the Nineties, ed. R. J. Hanisch, R. J. V. Brissenden, & J. Barnes, 173
- Tonry et al. (2012) Tonry, J. L., Stubbs, C. W., Lykke, K. R., et al. 2012, ApJ, 750, 99, doi: 10.1088/0004-637X/750/2/99
- Vorobyov & Basu (2006) Vorobyov, E. I., & Basu, S. 2006, ApJ, 650, 956, doi: 10.1086/507320
- Yadav et al. (2022) Yadav, R. K., Samal, M. R., Semenko, E., et al. 2022, ApJ, 926, 16, doi: 10.3847/1538-4357/ac3a78
Appendix A FIGURES 5 and 6, to be kept in ONLINE form.