TriSig: Assessing the statistical significance of triclusters
Abstract
Tensor data analysis allows researchers to uncover novel patterns and relationships that cannot be obtained from matrix data alone. The information inferred from the patterns provides valuable insights into disease progression, bioproduction processes, weather fluctuations, and group dynamics. However, spurious and redundant patterns hamper this process. This work aims at proposing a statistical frame to assess the probability of patterns in tensor data to deviate from null expectations, extending well-established principles for assessing the statistical significance of patterns in matrix data. A comprehensive discussion on binomial testing for false positive discoveries is entailed at the light of: variable dependencies, temporal dependencies and misalignments, and p-value corrections under the Benjamini-Hochberg procedure. Results gathered from the application of state-of-the-art triclustering algorithms over distinct real-world case studies in biochemical and biotechnological domains confer validity to the proposed statistical frame while revealing vulnerabilities of some triclustering searches. The proposed assessment can be incorporated into existing triclustering algorithms to mitigate false positive/spurious discoveries and further prune the search space, reducing their computational complexity.
Availability: The code is freely available at https://github.com/JupitersMight/ TriSig under the MIT license.
keywords:
Triclustering , Tensor data , Pattern discovery , Statistical significance , Temporal pattern mining , Multivariate time series data[inst1]organization=INESC-ID, Lisboa, Portugal,addressline=R. Alves Redol 9, 1000-029, Lisboa, country=Portugal \affiliation[inst2]organization=Instituto Superior Técnico, University of Lisbon, Lisbon,country=Portugal \affiliation[inst3]organization=LAQV-REQUIMTE, Department of Chemistry, NOVA School of Science and Technology, Universidade NOVA de Lisboa,addressline=Campus Caparica, 2829-516, Caparica, country=Portugal
1 Introduction
In recent years, the increased capacity for comprehensively monitoring systems’ behavior led to the emergence of tensor data structures such as three-dimensional data, also known as cubic or three-way data (Henriques and Madeira, 2018b). The nature of tensor data allows for a more comprehensive understanding of the underlying processes and relationships, proving to be a valuable source for making informed decisions and predictions. Some real-world examples in the biological domain include omic data to study how treatments affect a given tissue (Kanno et al., 2006; Cardoso-Moreira et al., 2019; Strober et al., 2019; White et al., 2020), improve the effectiveness of plantations against drought (Groen et al., 2020), understand development patterns (Liu et al., 2020), amongst other ends (Yalçin et al., 2020; Kim et al., 2019; Mandal et al., 2022; Gan et al., 2018). In social studies, user behavior has been monitored to better understand group dynamics such as user preferences (Gnatyshak et al., 2012; Gnatyshak, 2014; Ignatov et al., 2015) and interactions (Joo et al., 2019; Song et al., 2019; Ahn et al., 2022; Alessandroni et al., 2020). Geophysical data has been considered to better understand weather patterns (Wu et al., 2020; Kazemi et al., 2021), seismic activity (Amaro-Mellado et al., 2021), or the fluctuation of the population’s needs (Melgar-García et al., 2022; Guigourès et al., 2018; Kremser et al., 2021). Finally, in the biomedical field, pattern discovery from health records has been considered for personalized medicine (Alexandre et al., 2021), understanding diseases (Soares et al., 2020), and neuroscience advances (Rahaman et al., 2022).
Although many pattern discovery approaches are available for actionable knowledge acquisition (Oberski, 2016; Nagin, 2010; Wu et al., 2013; Jung and Wickrama, 2008), we focus on triclustering (Henriques and Madeira, 2018b), a well-established unsupervised task for extracting patterns within tensor data. Triclustering belongs to the same branch of unsupervised tasks as clustering and biclustering. But contrary to clustering, where clusters represent groups of observations meaningfully correlated along the overall feature space, and biclustering, only prepared to handle matricial data, triclustering can make full use of the tensor data properties. Patterns extracted by triclustering algorithms, referred to as triclusters, are defined by a set of observations meaningfully correlated on a subset of variables along a subset of contexts. Triclusters can represent a coherent temporal progression of specific features for a group of observations, meaning that features can vary throughout time as long as the desirable form of correlation is preserved. Triclusters should also meet rigorous dissimilarity and statistical significance criteria (Henriques and Madeira, 2018b). Dissimilarity criteria prevent redundant triclusters from forming, while statistical significance ensures that the probability of the tricluster occurring against null expectations is unexpectedly low. It should be noted that pursuing a stronger correlation between elements of a tricluster is not sufficient to guarantee its statistical significance. Triclusters with a small number of elements can yield high correlation levels that still occur by chance. Similarly, domain relevance (e.g., functional enrichment against knowledge bases (Ashburner et al., 2000)) is, alone, insufficient to ensure statistical significance.
Henriques and Madeira (2018b) provide an entry point to the state-of-the-art research of tensor data using triclustering, covering former studies considering statistical significance assessments (Moise and Sander, 2008; Sim et al., 2010). Moise and Sander (2008) placed a uniform null assumption to assess whether the volume of a given tricluster deviates from expectations under a Binomial test. Applicability is constrained to identically distributed variables. Sim et al. (2010) proposed a correlation metric based on mutual information, termed CI, to identify statistically significant triclusters. A statistically significant tricluster yields an unexpectedly high CI (rarely co-occurring values), with the CI distribution being modeled under a gamma or Weibull distribution. Whilst not many, some works have proposed and discussed the statistical significance of triclusters after the survey was published. Užupytė and Wit (2020) test the statistical significance by using Hotelling’s T-squared test, a multivariate generalization of the -student test where they test if the means for a group equals a hypothetical vector of means, under an exponential assumption. Biswal et al. (2020) proposed a novel triclustering algorithm, where extracted triclusters are assessed by three distinct metrics: a triclustering quality index based square residue (MSR) (Bhar et al., 2013); a statistical difference from the background (SDB) that ensures that the triclusters yields differential values against background regularities; and a functional enrichment -value (probability of intersection) returned by the GO Term findertool (Ashburner et al., 2000). Please note that domain relevance (under, for instance, a functional enrichment analysis) and statistical significance are distinct stances on a tricluster’s interestingness that may be contradictory (Henriques and Madeira, 2018a). Williams et al. (2022) use Structural equation modeling (SEM), a statistical technique to model complex relationships between variables, to assess how well the observed data fit a learnt SEM-based model at two levels: the statistical significance of latent factors (described by a set of variables) under a t-statistic, and the statistical significance of the model under a test.
Despite their relevance, to the best of our knowledge, current state-of-the-art triclustering approaches fail to provide a generalized assessment of a pattern’s statistical significance (i.e., whether a pattern occurs by chance or not against a null data model) that takes into consideration the unique regularities within tensor data (e.g., variable domains and dependencies). In light of this, we propose an extended frame, expanding well-established principles for assessing the statistical significance of biclustering solutions. Our solution is able to accommodate different homogeneity criteria, data types, variable dependencies, temporal properties (e.g., contiguity and misalignments), and, consistently with Sim et al. (2010), p-value corrections.
In this context, this study presents the first comprehensive statistical frame to mitigate false positive discoveries from tensor data with varying properties. The proposed methodology is tested using four case studies and synthetic tensor data. The application of state-of-the-art triclustering algorithms unravel behavioral vulnerabilities and further show how statistical significance varies depending on the pattern type and size, background data, dependency assumptions, and applicable corrections. The proposed methodology is able to approximate multivariate boundaries that can be used to separate spurious discoveries from statistically significant ones.
The rest of this paper is organized as follows: the remainder of this section provides the essential background (for more detailed formulations, the reader can check Henriques and Madeira (2018b)). Section 2 introduces the proposed methodology. Section 3 discusses the gathered results from real-world and synthetic data. Concluding remarks and implications are finally drawn.
1.1 Background
Let a two-dimensional dataset (matrix data), A, be defined by observations () and variables (), with elements . Clustering and biclustering tasks aim to extract clusters or biclusters , each given by a subset of observations, , correlated on a subset of variables, . Homogeneity criteria, commonly guaranteed through the use of a merit function, guides the formation of (bi)clusters (Madeira and Oliveira, 2004). Given a bicluster, its values can be described by value expectations , adjustments , and noise , then the bicluster pattern is the ordered set of values in the absence of adjustments and noise, . In addition to homogeneity criteria, statistical significance criteria (Henriques and Madeira, 2018a) guarantee that the probability of a bicluster’s occurrence (against a null model) deviates from expectations. Furthermore, dissimilarity criteria (Henriques et al., 2017) can be placed to further guarantee the absence of redundant biclusters.
A three-dimensional dataset (three-way tensor data), A, is defined by observations , variables , and contexts . Elements relate observation , attribute , and context . Identical to two-dimensional data, three-dimensional data can be real-valued , symbolic (, where is a set of nominal or ordinal symbols), integer (), or non-identically distributed (, where is the domain of ’s variable), and contain missing elements, . When the context dimension corresponds to a set of time points (), we are in the presence of a temporal three-dimensional dataset, also referred as -order multivariate time series data.
Given three-way tensor data A with observations, variables, and contexts/time points, a tricluster is a subspace of the original space, where , , and are subsets of observations, variables, and contexts/time points, respectively (Henriques and Madeira, 2018b). The triclustering task task aims to find a set of triclusters such that each tricluster satisfies specific criteria of homogeneity, dissimilarity, and statistical significance. Let each element of a tricluster, , be described by a base value , observation adjustment and noise . The tricluster pattern, , is an ordered set of value expectations along the subset of variables and context dimensions in the absence of adjustments and noise: .
Homogeneity criteria determine the structure, coherence, and quality of a triclustering solution (Henriques and Madeira, 2018b), where: 1) the structure is described by the number, size, shape, and position of triclusters, 2) the coherence of a tricluster is defined by the observed correlation of values (coherence assumption) and the allowed deviation from expectations (coherence strength), and 3) the quality of a tricluster is defined by the type and amount of tolerated noise. A tricluster has constant coherence when the subspace exhibits constant (for symbolic data) or approximately constant (real-valued data) values. Dissimilarity criteria guarantee that any tricluster similar to another tricluster with higher priority is removed from and (possibly) used to refine similar triclusters in . A tricluster is maximal if and only if there is no other tricluster such that satisfying the given criteria. Finally, and foremost, Statistical significance criteria guarantee that the probability of each retrieved tricluster occurring against a null data model is unexpectedly low.
2 Methodology
The proposed methodology offers a statistical frame to assess the probability of observing a given tricluster in the given tensor data, accommodating principles to handle both tensor data and multivariate time series data with varying regularities. The methodology expands upon two state-of-the-art stances on the statistical significance of biclustering solutions: 1) BSig algorithm, proposed by (Henriques and Madeira, 2018a), where binomial testing is applied flexibly considering the underlying data regularities (e.g., either empirical or theoretical stances for real-valued and categorical data) and corrected for multiple hypotheses; and 2) CCC-Biclustering algorithm, proposed by Madeira et al. (2008) for time series data, where patterns have a well-established duration and their probability is modeled under a first-order Markov chain, followed by a binomial significance test and correction for temporal misalignments (Gonçalves and Madeira, 2010).
To correctly calculate the probability of , we must make assumptions regarding variable and context dependency (mutually dependent (MD), mutually independent (MI), identically distributed, non-identically distributed, or temporally contiguous (TC)). To this end, it is important to understand the type of data at hand. Table LABEL:data_examples comprises data of multiple domains, providing a view on which of the aforementioned assumptions can be placed to adequately create a null data model. For example, dependency between genes in omic data domains should be considered as diverse gene sets are strongly co-expressed in various pathways, affecting probability calculus Chetty and Chetty (2009). This type of analysis is crucial to correctly assess null statistical expectations as they determine the final significance estimates.
| data | Variables MD Context MD | Variables MD Context MI Variables MI Context MD | Variables MD Context TC | Variables MI Context TC | Variables MI Context MI |
| station-day cluster-month | |||||
| movie-keywords-celeb | |||||
| gene-marker-tumor | |||||
| subject-clustered pairs-time windows (fMRI) | |||||
| job-jobseekers-seekerskills | |||||
| individual-signal-signal | |||||
| position-position-image/variable | |||||
| movie-genre-tags | |||||
| user-behavior-environment | |||||
| stations/provider-variables-time | |||||
| sample-gene-time | |||||
| patient/provider-variable-time | |||||
| vertex-vertex-time | |||||
| users-bookmarks-tags (topics) |
2.1 Tricluster pattern’s probability
Given a tricluster with pattern , if we assume that variables are mutually independent and that contexts are also mutually independent, then the probability of the tricluster’s pattern occurring is given by
| (1) |
where comprises the contexts in the tricluster, is the set of variables in the tricluster, is an estimate of the probability of value occurrence, in the absence of adjustments and noise. As both variables and contexts are mutually independent, the probability of the value is approximated by the available observations measured by variable in context .
If we consider variables to be mutually dependent and contexts to be mutually independent, then a tricluster pattern’s probability is given by
| (2) |
When contexts are mutually dependent, the probability of value is approximated by the set of observations measured at across all contexts, . Additionally, as we need to account for the pattern to occur in any context of , then
| (3) |
when variables are mutually independent and
| (4) |
when variables are mutually dependent. To further clarify the calculus, an example of the above formulas, using dummy data, is given in Figure 1.

In the presence of temporal data, where represents the set of time points and is a contiguous subset of , then the null probability of a tricluster’s pattern, , can be modeled by a first-order Markov chain. Instead of accounting for the possibility of the pattern occurring in any context of , we need to accommodate the possibility for temporal misalignments (Gonçalves and Madeira, 2010). To this end, is given by
| (5) |
where is given by if variables are assumed to be mutually independent or if we assume mutual dependence, and represents the probability of the pattern transitioning from context to context . The probability of transitioning depends on whether we assume variables to be mutually dependent or independent. If we assume variables to be mutually independent, then
| (6) |
and, when assuming mutually dependent variables, then
| (7) |
Figure 1 (d) presents an example of the aforesaid calculus when in the presence of mutually independent variables.
The introduced probabilistic stances can be considered for categorical and real-valued variables. Empirical and theoretical distributions can be considered. The similarity between variable distributions can be assessed using goodness-of-fit test for categorical/ordinal data and Kolmogorov–Smirnov goodness-of-fit for real-valued data. For details on how to circumvent point estimate problems in real-valued data, we redirect the reader to Henriques and Madeira (2018a).
2.2 Tricluster’s statistical significance
Given , binomial tails can be used to robustly compute the probability of a tricluster with pattern to occur for or more observations (Henriques and Madeira, 2018a). Accordingly,
| (8) |
where is the null binomial distribution, the event probability, the sample size, and the number of successes.
When variables are identically distributed, the p-value can be further corrected when considering that the observed pattern can span alternative variables (Henriques and Madeira, 2018a), i.e.,
| (9) |
Irrespectively of the above relaxation, further corrections should be placed for multiple hypotheses (patterns). To this end, the Benjamini-Hochberg procedure (Benjamini and Hochberg, 1995) is suggested to decrease the false discovery rate. This correction tackles the problems faced by more conservative corrections, such as Bonferroni, in the presence of a high number of hypotheses.
Instantiating the introduced methodology, Table 2.2 shows the minimum number of observations required for a tricluster’s pattern to be statistically significant (). In particular, given a three-way data with uniformly distributed variables, this analysis shows how the minimum number of observations varies for: i) patterns with varying number of variables and contexts , ii) variables with varying cardinality (), iii) data with varying dependency assumptions, and iv) the presence of multi-hypotheses corrections. We confirm that “Variables MI, Contexts MD” assumption is more conservative than “Variables MI, Contexts TC”, generally requiring fewer tricluster’s observations to guarantee statistical significance. The pattern size ( and ) heavily influence significance, with being particularly relevant under the latter assumption.
| (variables with Uniform distribution) | |||||||||
| Variables MI, Contexts MD | Variables MI, Contexts TC | ||||||||
| 2 | 2 | 2 | 2 | 2 | 2 | 2 | 2 | ||
| 2 | 3 | 4 | 5 | 2 | 3 | 4 | 5 | ||
| =3 | - | - | - | - | 641 | 85 | 14 | 3 | |
| (corrected) | - | - | - | - | 671 | 102 | 21 | 7 | |
| P() | 15.12 | 26.88 | 35.10 | 35.88 | 0.60 | 0.07 | |||
| =5 | - | - | 626 | 248 | 99 | 8 | 1 | 1 | |
| (corrected) | - | - | 656 | 275 | 117 | 13 | 3 | 2 | |
| P() | 1.96 | 1.25 | 0.59 | 0.22 | 0.08 | ||||
| 3 | 3 | 3 | 3 | 3 | 3 | 3 | 3 | ||
| 2 | 3 | 4 | 5 | 2 | 3 | 4 | 5 | ||
| =3 | - | - | 470 | 174 | 86 | 7 | 1 | 1 | |
| (corrected) | - | - | 510 | 205 | 109 | 13 | 4 | 2 | |
| P() | 1.68 | 0.99 | 0.43 | 0.14 | 0.07 | ||||
| =5 | 99 | 18 | 4 | 1 | 8 | 1 | 1 | 1 | |
| (corrected) | 123 | 29 | 9 | 4 | 15 | 3 | 1 | 1 | |
| P() | 0.08 | 0.01 | |||||||
| 4 | 4 | 4 | 4 | 4 | 4 | 4 | 4 | ||
| 2 | 3 | 4 | 5 | 2 | 3 | 4 | 5 | ||
| =3 | 216 | 51 | 11 | 3 | 14 | 1 | 1 | 1 | |
| (corrected) | 255 | 73 | 22 | 8 | 26 | 5 | 2 | 1 | |
| P() | 0.18 | 0.04 | |||||||
| =5 | 8 | 1 | 1 | 1 | 1 | 1 | 1 | 1 | |
| (corrected) | 16 | 4 | 1 | 1 | 5 | 1 | 1 | 1 | |
| P() | |||||||||
| 5 | 5 | 5 | 5 | 5 | 5 | 5 | 5 | ||
| 2 | 3 | 4 | 5 | 2 | 3 | 4 | 5 | ||
| =3 | 32 | 5 | 1 | 1 | 4 | 1 | 1 | 1 | |
| (corrected) | 51 | 12 | 5 | 2 | 10 | 3 | 1 | 1 | |
| P() | 0.20 | ||||||||
| =5 | 1 | 1 | 1 | 1 | 1 | 1 | 1 | 1 | |
| (corrected) | 6 | 2 | 1 | 1 | 3 | 1 | 1 | 1 | |
| P() | |||||||||
3 Computational and Experimental setup
Triclustering Algorithms
Triclustering algorithms can be categorized according to specific characteristics, including the underlying search procedure, targeted homogeneity, allowed data types (e.g., real-valued, ordinal, binary tensor data), amongst others (Henriques and Madeira, 2018b). To fully explore the proposed solution, we selected three triclustering algorithms representative of three major search criteria – heuristic-based (greedy), exhaustive based on formal concept analysis, and quasi-exhaustive based on biclustering-based consensus. Accordingly, the selected algorithms are 1) -Trimax (Bhar et al., 2015), a greedy iterative search algorithm that handles real-valued tensor; 2) TRIAS algorithm (Jaschke et al., 2006), an exhaustive algorithm that only handles binary data; and 3) modified version of Zaki TriCluster algorithm (Soares et al., 2021), a consensus-based algorithm with a modification that restricts the patterns to be contiguous along the context axis.
Datasets
To validate the proposed methodology, three publically available case studies are selected: glycine data (Irwin et al., 2016), gene expression profile (Kanno et al., 2006), and penicillin batch fermentation (Goldrick et al., 2015, 2019). Table 3 provides a brief description of each dataset and the applied preprocessing.
| Datasets | Description | Preprocessing |
| glycine (subjects x units x time) (23 x 467 x 6) | A metabolomics dataset from urinary samples analyzed by nuclear magnetic resonance spectroscopy giving a total of 467 integrated units per NMR spectrum for each observation. In this study, they used commercial benzoic acid containing flavored water as a vehicle for designed interventions. | – =5 (ordinal categories) |
|
gene expression
(samples x genes x time) (15 x 500 x 4) |
Liver tissue transcriptomics (45101 genes) from male mice in response to the application of tetrachlorodibenzodioxin (TCDD) administered orally at doses of 0, 1, 3, 10 and 30. The liver was sampled 2, 4, 8 and 24 h after administration. |
– selection of top 500
genes with highest variability on ; – = 3 |
|
penicillin batch fermentation
(batches x variables x time) (100 x 16 x 25) |
An advanced mathematical model of a 100,000 litre penicillin fermentation system (bioprocess data). It contains 100 batches, where batches 1-30 are controlled by recipe-driven approach, 31-60 are controlled by operators, 61-90 are controlled by an Advanced Process Control (APC) solution using the Raman spectroscopy, and 91-100 contain faults resulting in process deviations. Each batch is a multivariate time series where all available processes, model inputs, and Raman spectroscopy measurements are available. There isn’t a fixed number of time points per batch. |
– Removed Raman
spectroscopy; – Removed uninfor- mative variables; – Piecewise Aggregate Approximation (PAA); (25 time points) – |
To complement the analysis, we generated synthetic data using G-Tric, a synthetic data generator proposed by Lobo et al. (2021), able to generate tensors with planted triclusters. The authors provide a set of dataset sizes based on the type of data such as gene expression, financial, fMRI, social, and georeferenced time-series. With this in mind, the datasets created contained 1000 observations, 50 variables, 50 contexts, and two types of background distribution – uniform and Gaussian () –, and 5 triclusters planted per dataset. The artificial variables are ordinal with cardinality . The planted triclusters had the following properties: 1) the number of observations between 50 and 500, 2) the number of variables between 2 and 4, 3) the number of contexts between 2 and 4, and 4) patterns could be contiguous or non-contiguous across contexts.
Pattern Evaluation
In the synthetic data generated, variables hold no particular type of information, there is no prior knowledge about their dependency, and all of the variables are sampled from either a gaussian or uniform distribution. To this end, for the purpose of testing the proposed statistical frame, we assume variables to be identically distributed and the following cases regarding variable dependency: 1) variables to be mutually independent, and 2) variables to be mutually dependent. Regarding context dependency, we assume the following cases: 1) contexts to be mutually independent, 2) contexts to be mutually dependent, and 3) contexts to represent a set of time points.
Regarding the selected case studies, all of them contain one temporal dimension. This means that patterns that exhibit contiguity across this dimension can be evaluated assuming a first-order Markov chain. Out of the three algorithms, only the modified Zaki algorithm (Soares et al., 2021) extracts patterns contiguous across time. As such, the patterns extracted using the modified Zaki algorithm will be analyzed assuming a first-order Markov chain ,whilst the patterns extracted using TRIAS and -Trimax will be analyzed assuming contexts to be mutually dependent. The variables dimension in the penicillin batch fermentation and glycine cases will be analyzed assuming variable independence, while the gene expression case will be analyzed assuming variable mutual dependency.
4 Results and Discussion
In order to assess the validity and implication of the proposed statistical frame, we tested the concepts of the proposed methodology in two major subsections: 1) case studies, and 2) synthetic data. The results acquired per case study provide an in-depth examination of statistically significant patterns. Synthetic data results allow us to assess expectations on what makes a tricluster to yield statistical significance for different data characteristics, as well as the impact of the placed corrections.
Real-world case studies
I. Glycine dataset
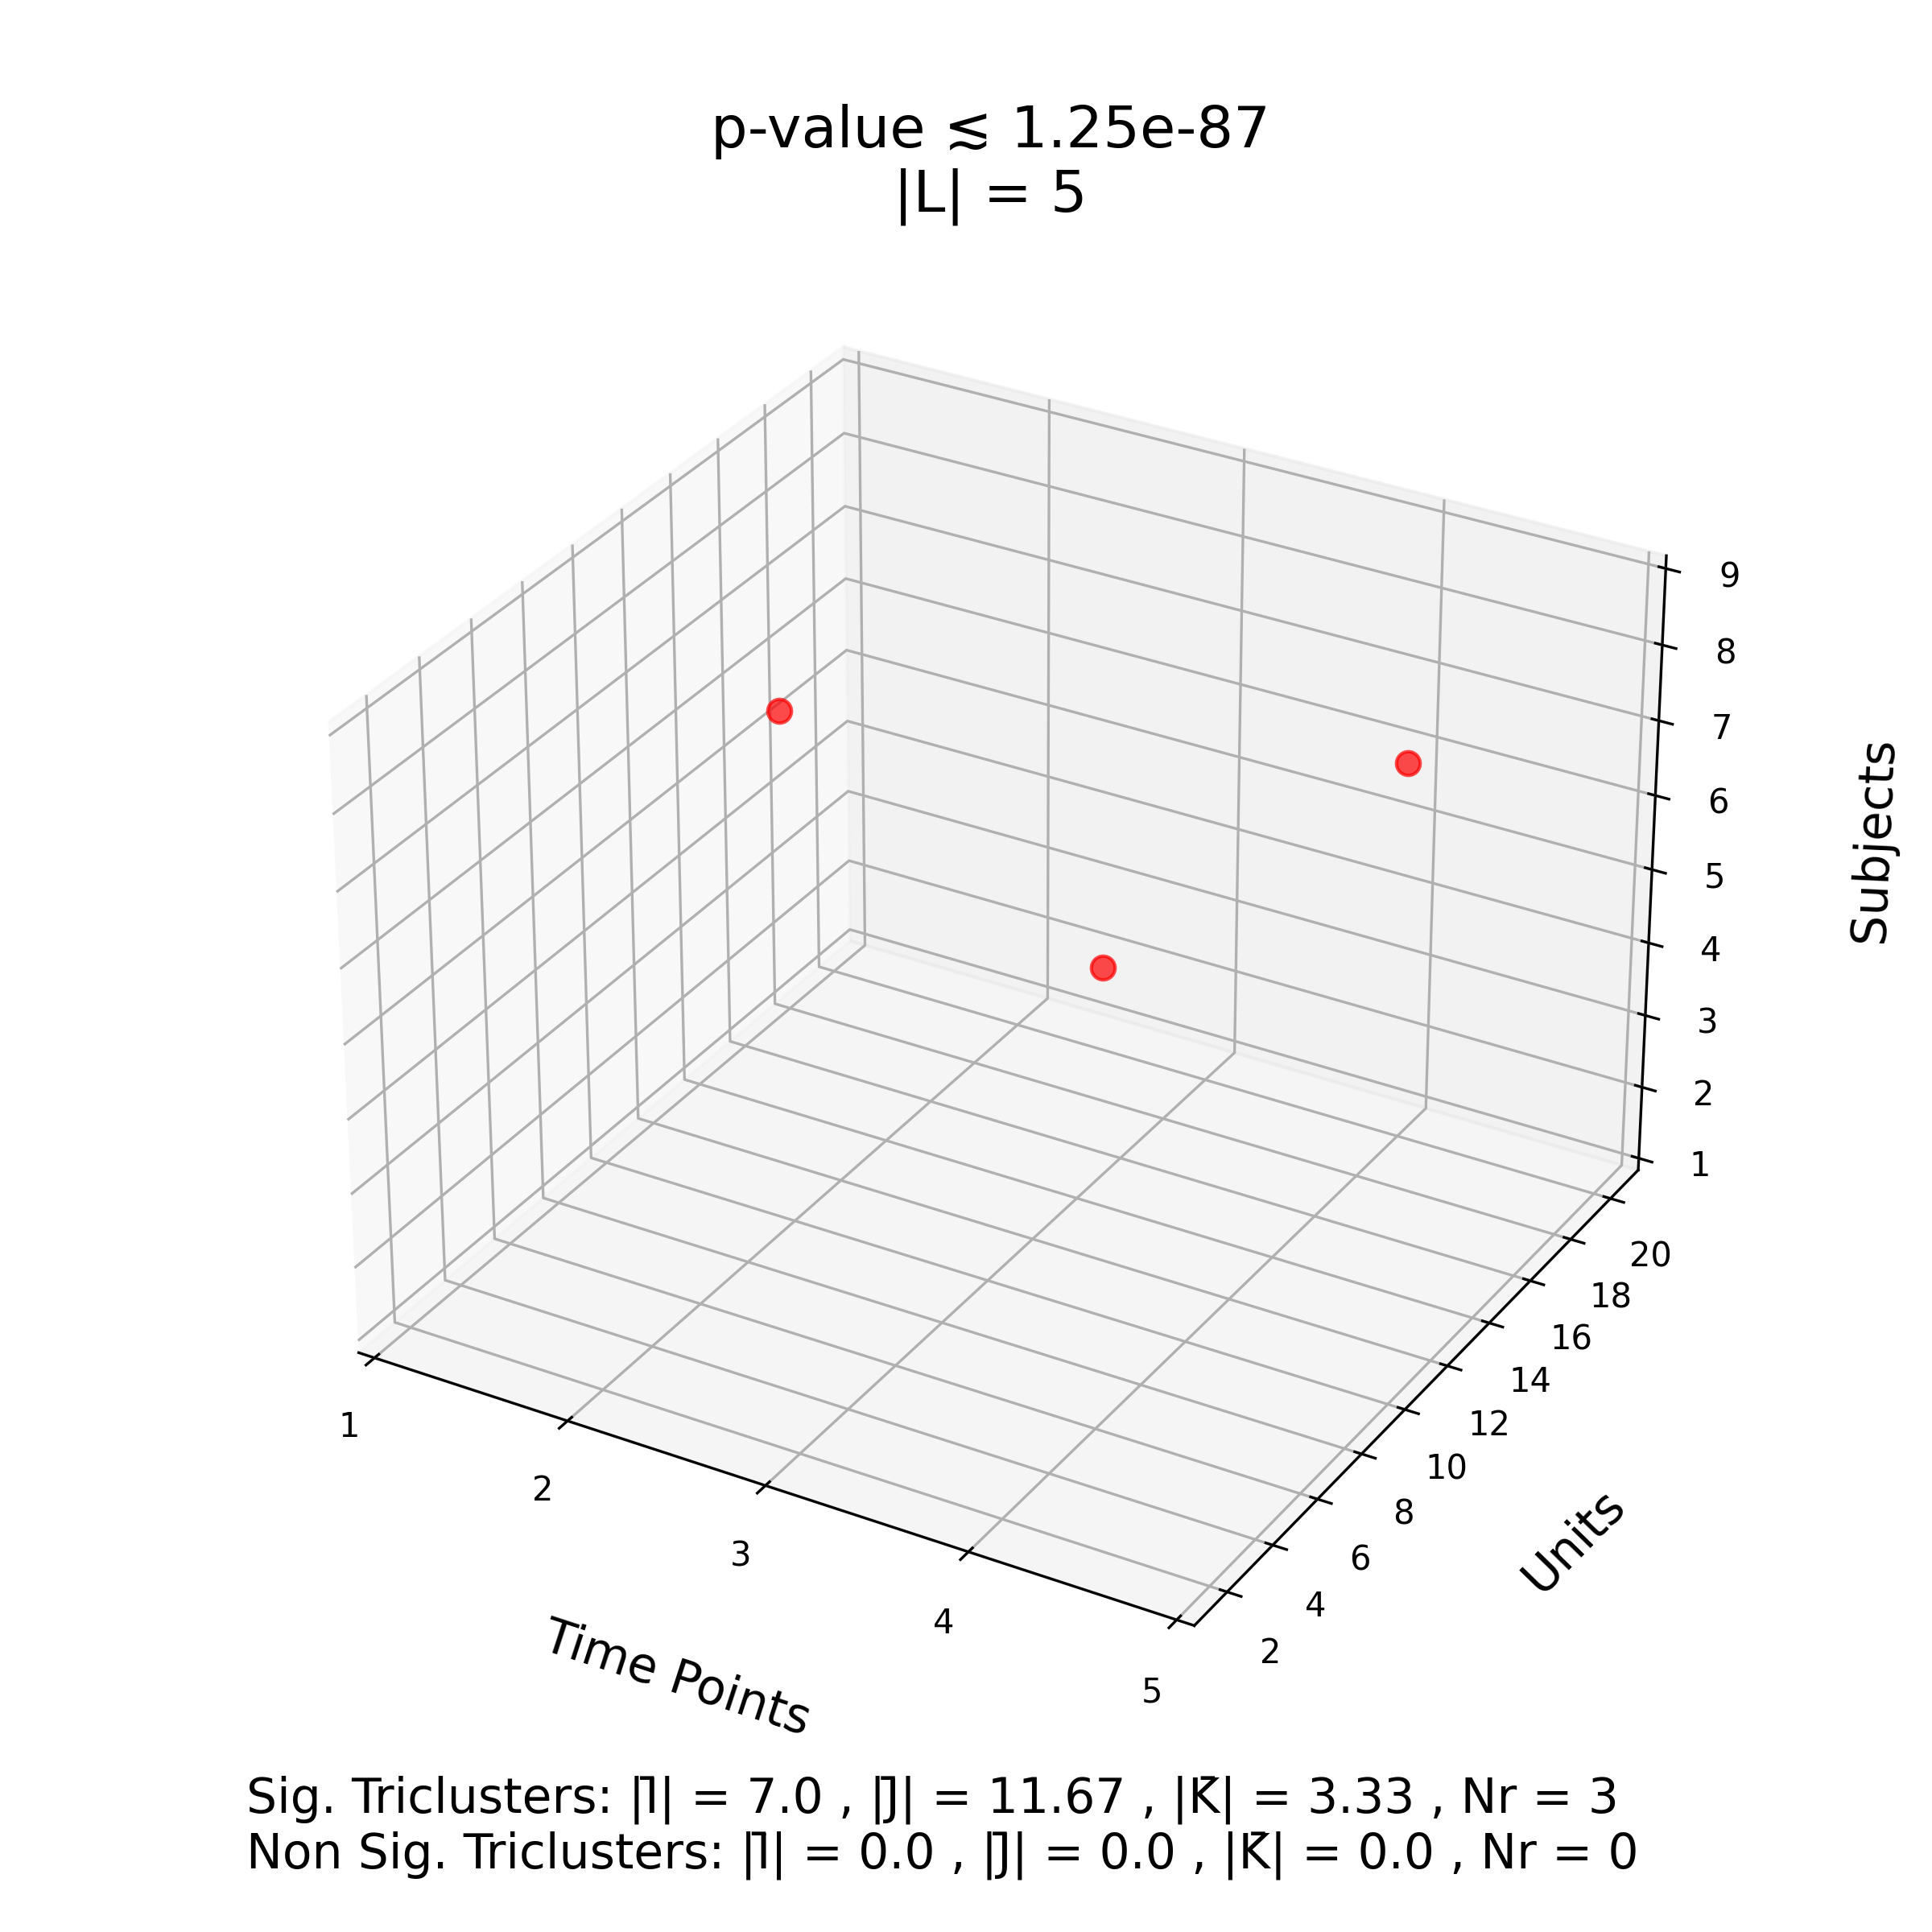
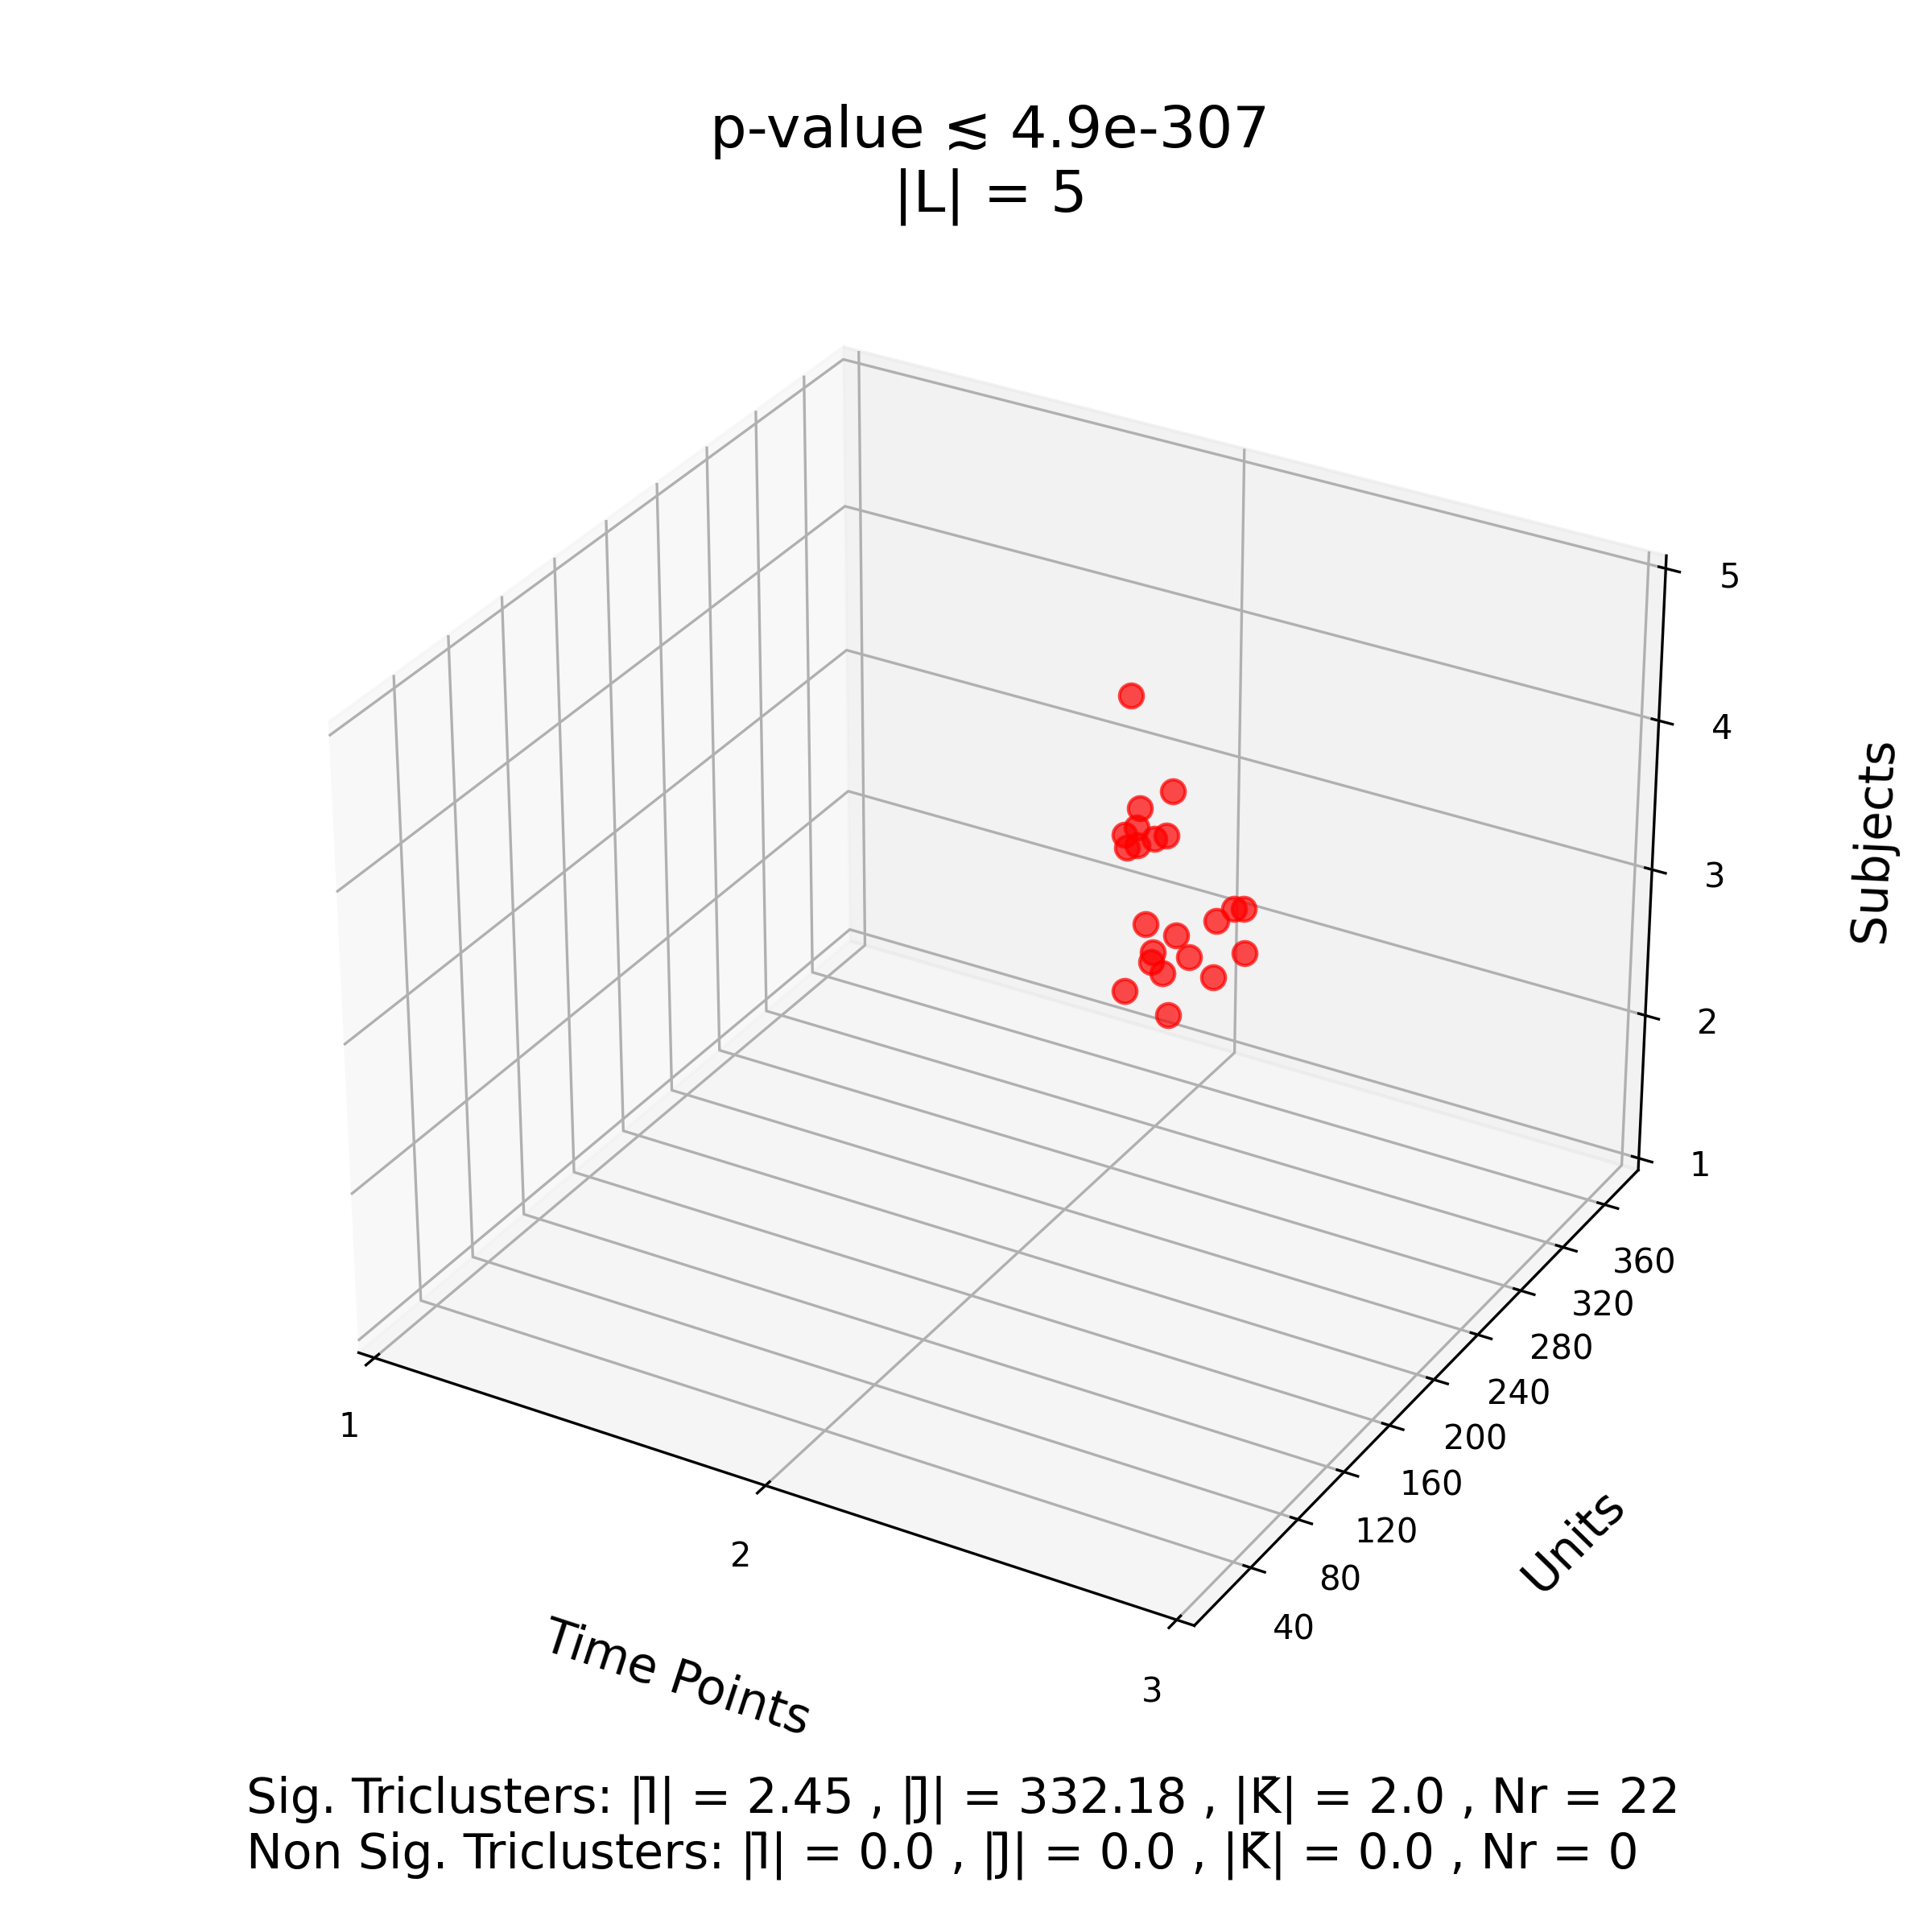
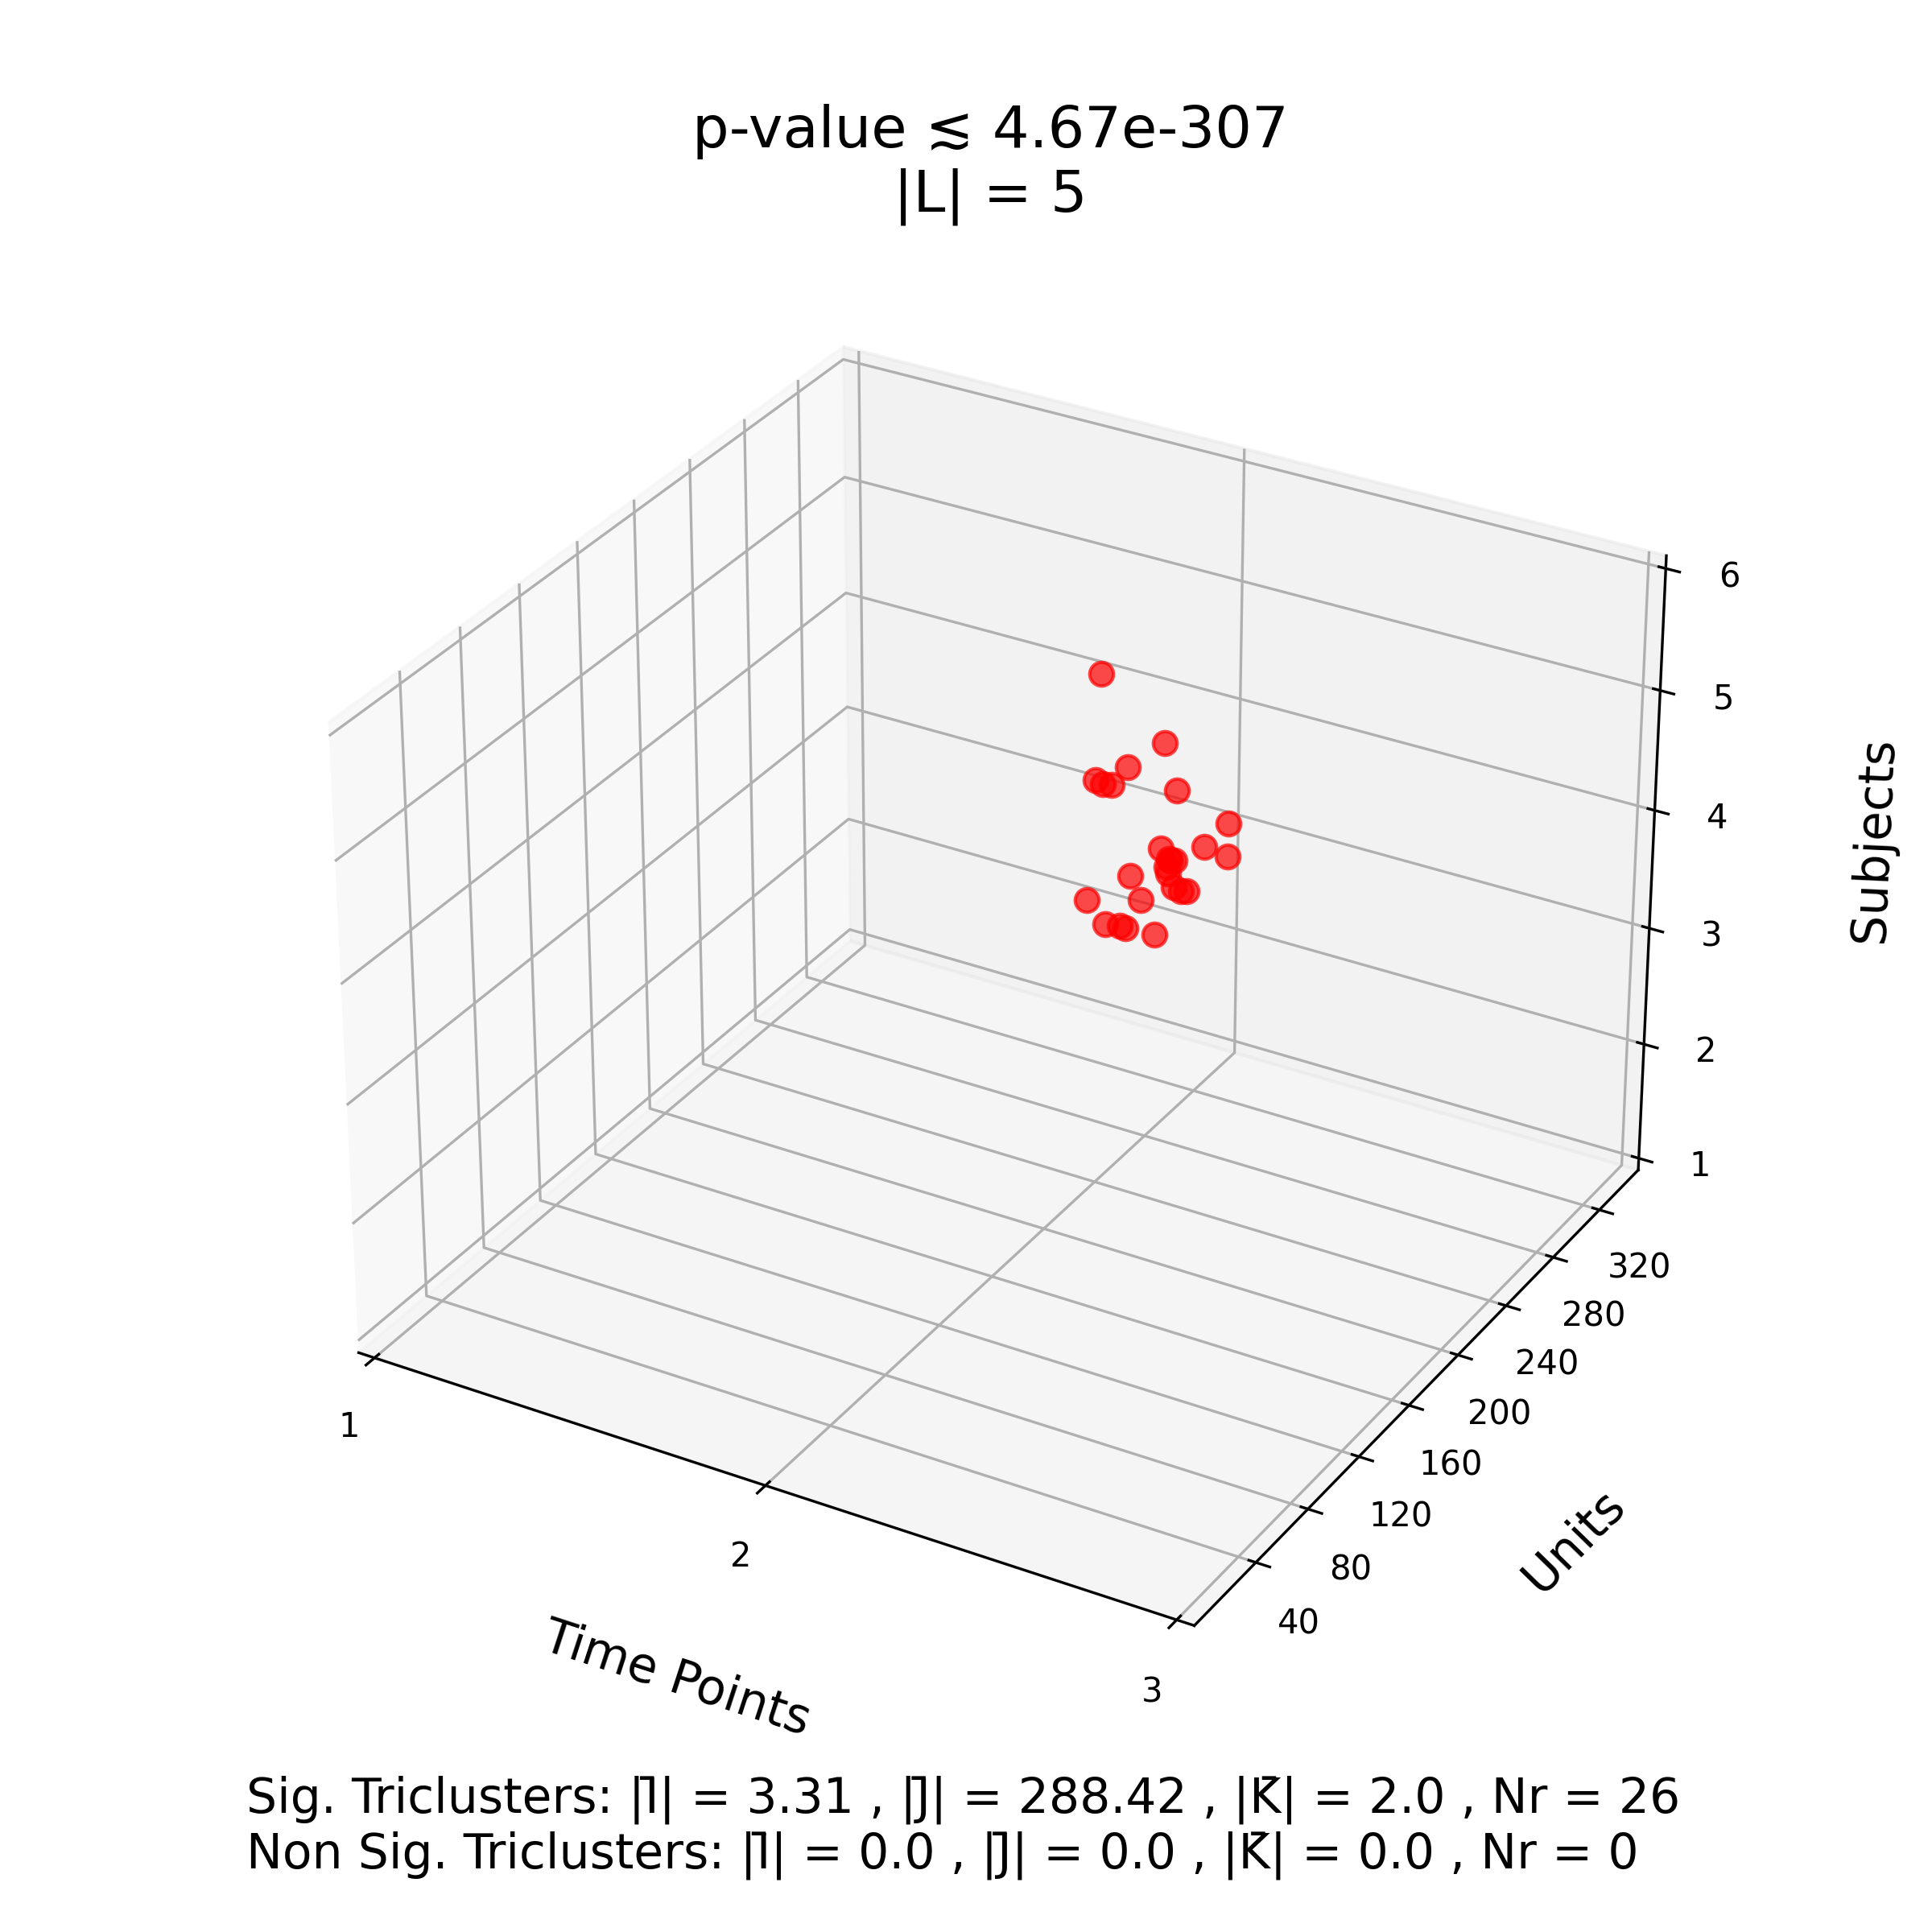
a) -Trimax b) TriCluster c) TRIAS
II. Gene expression dataset
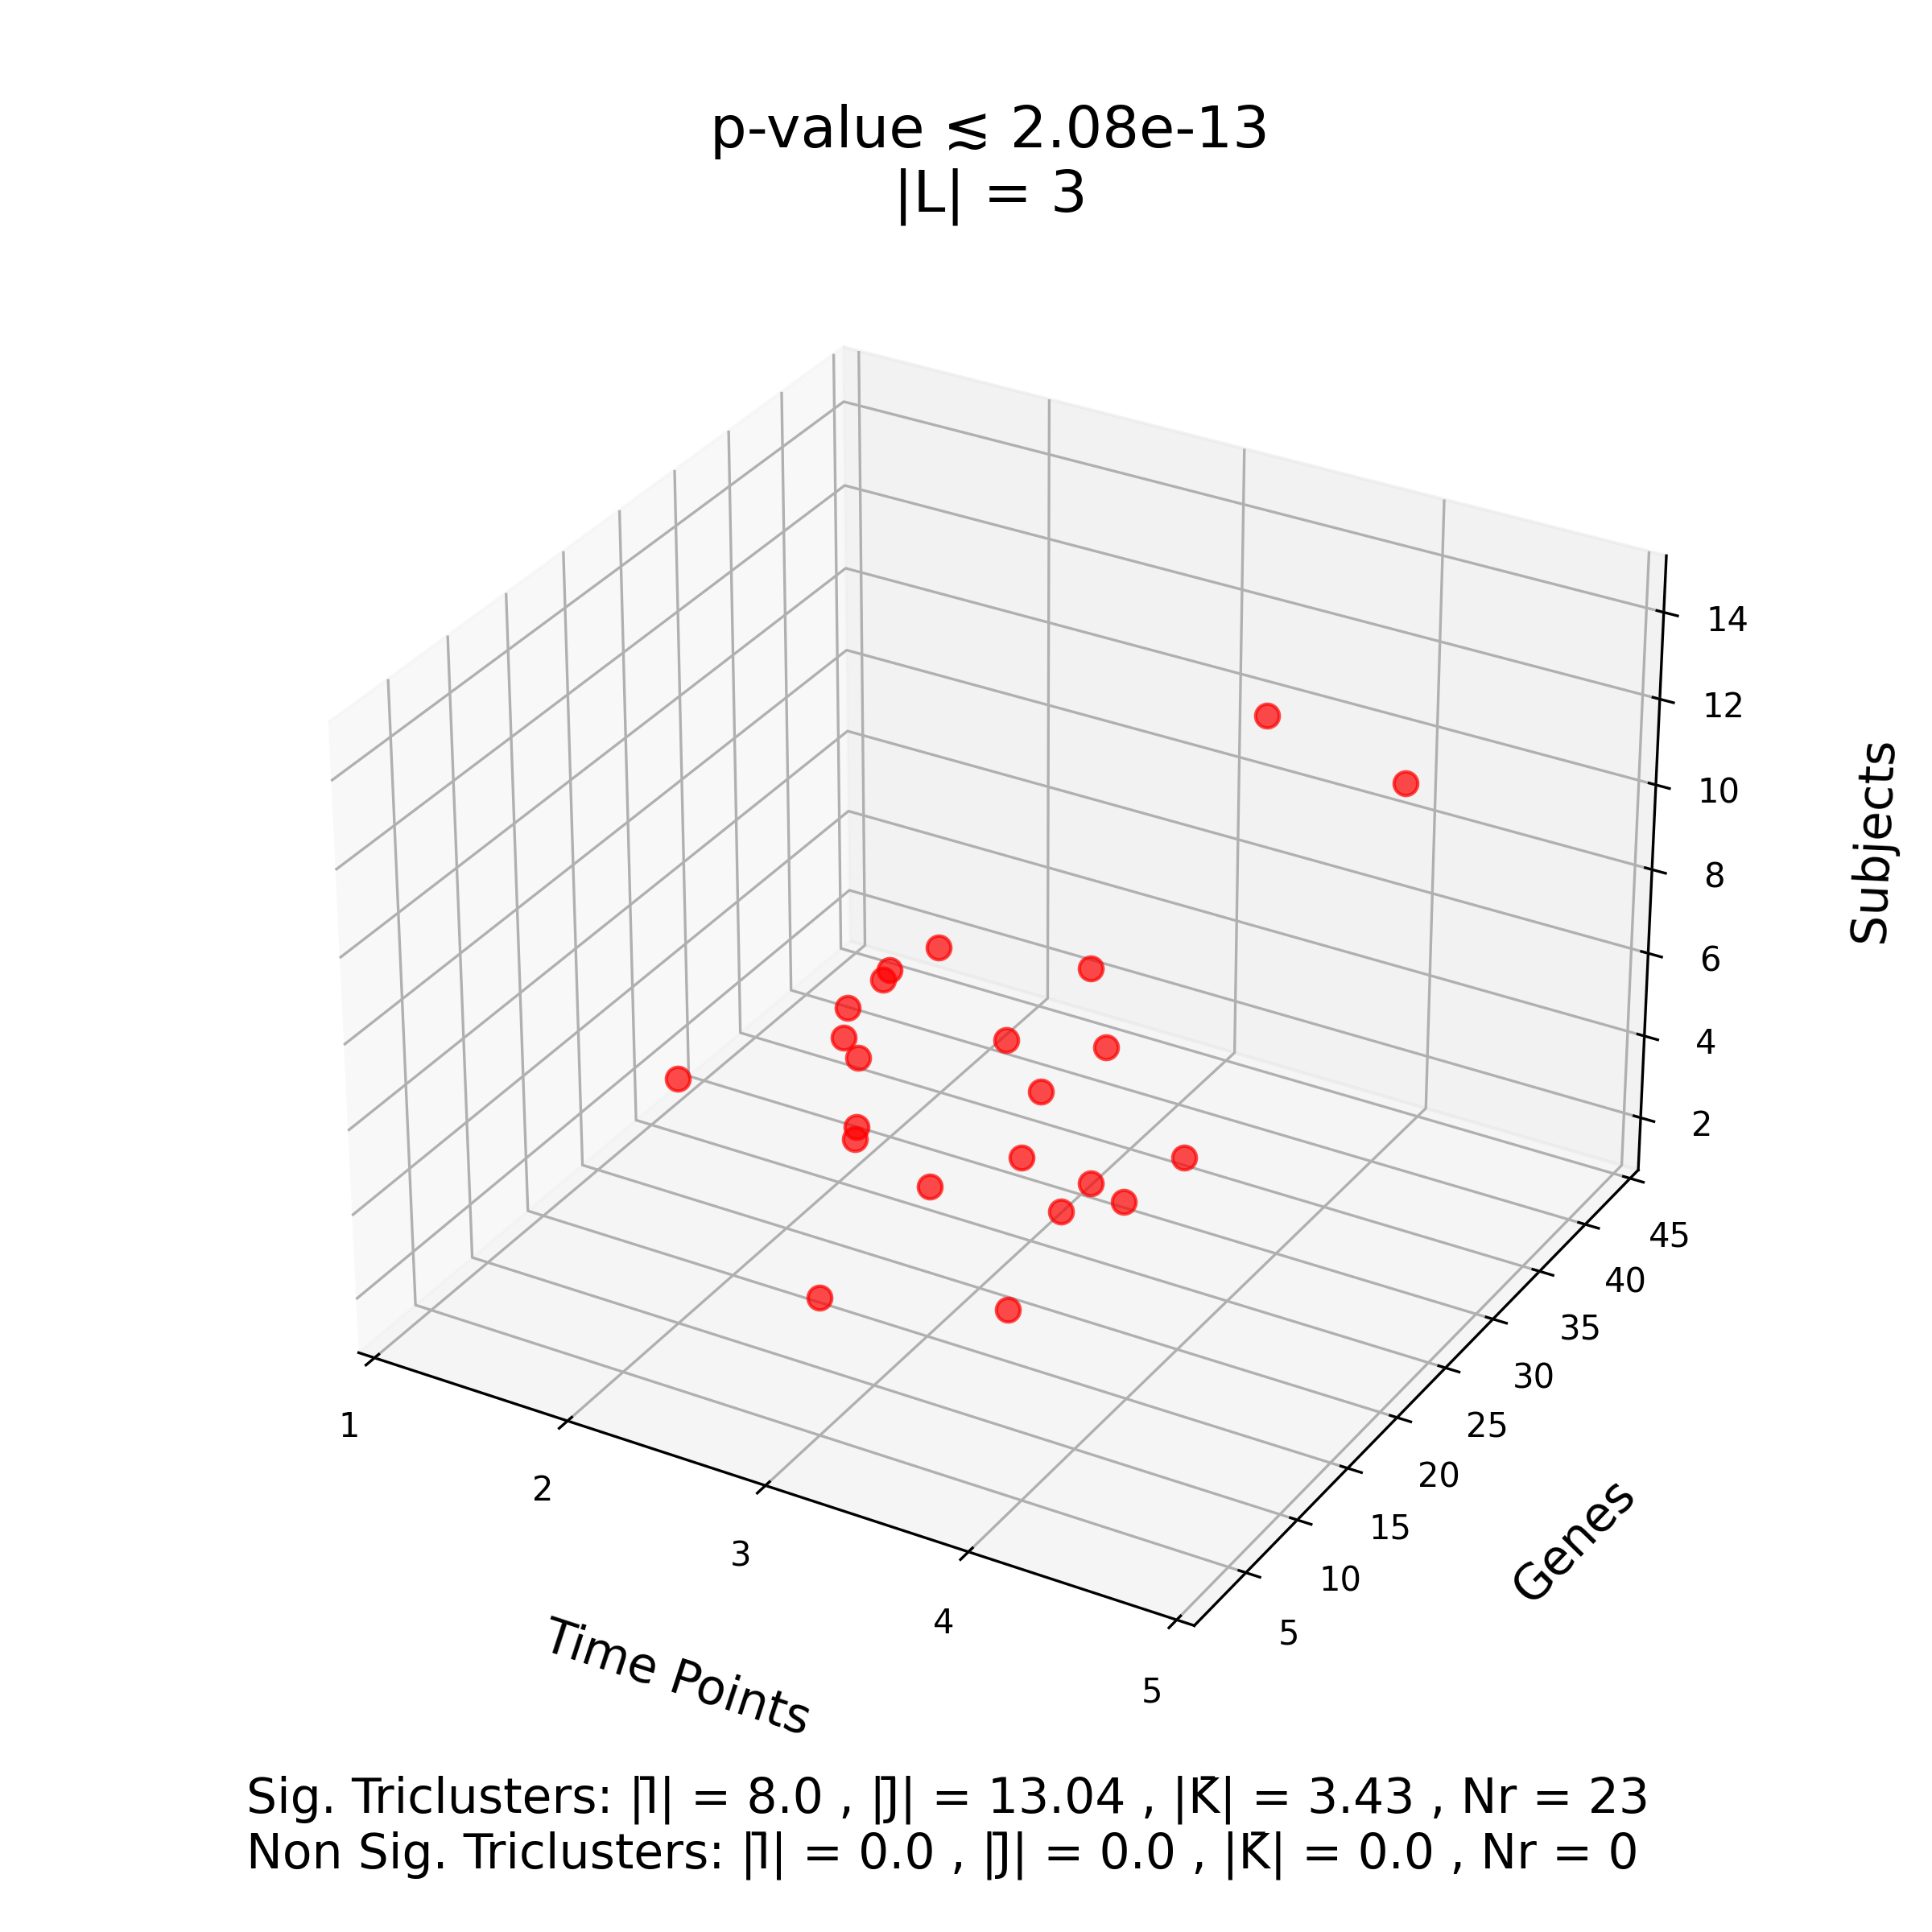
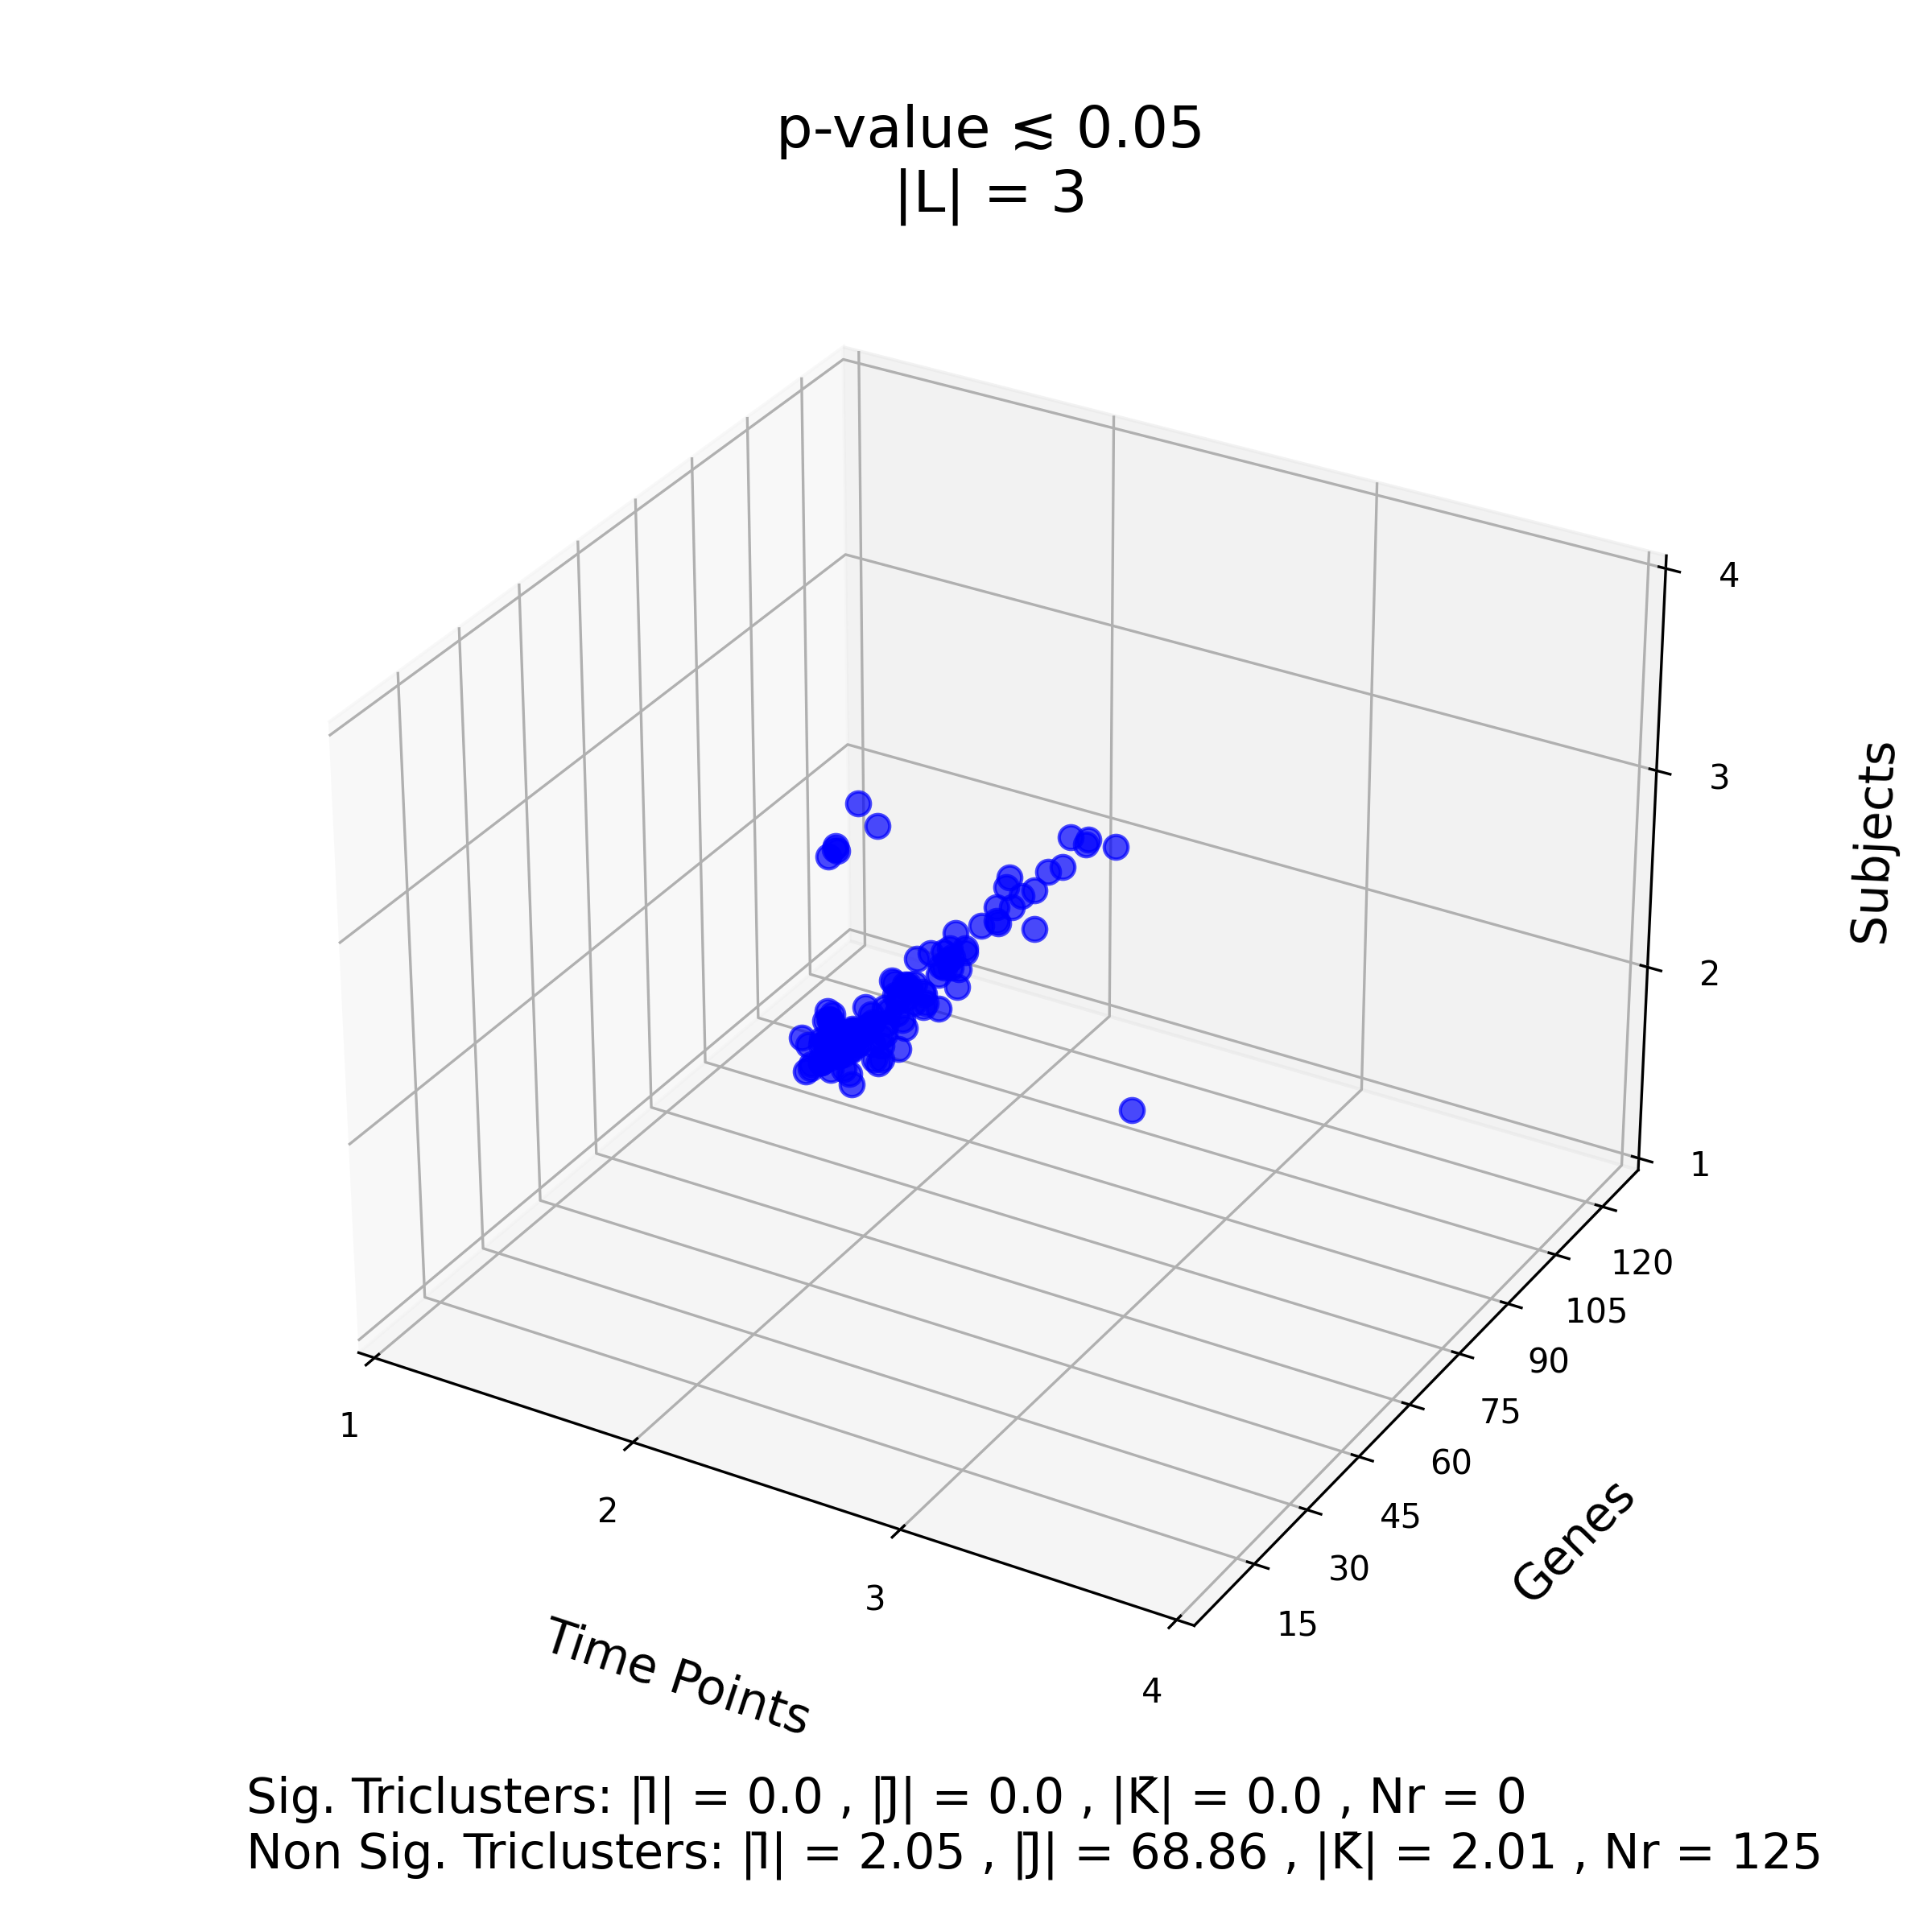
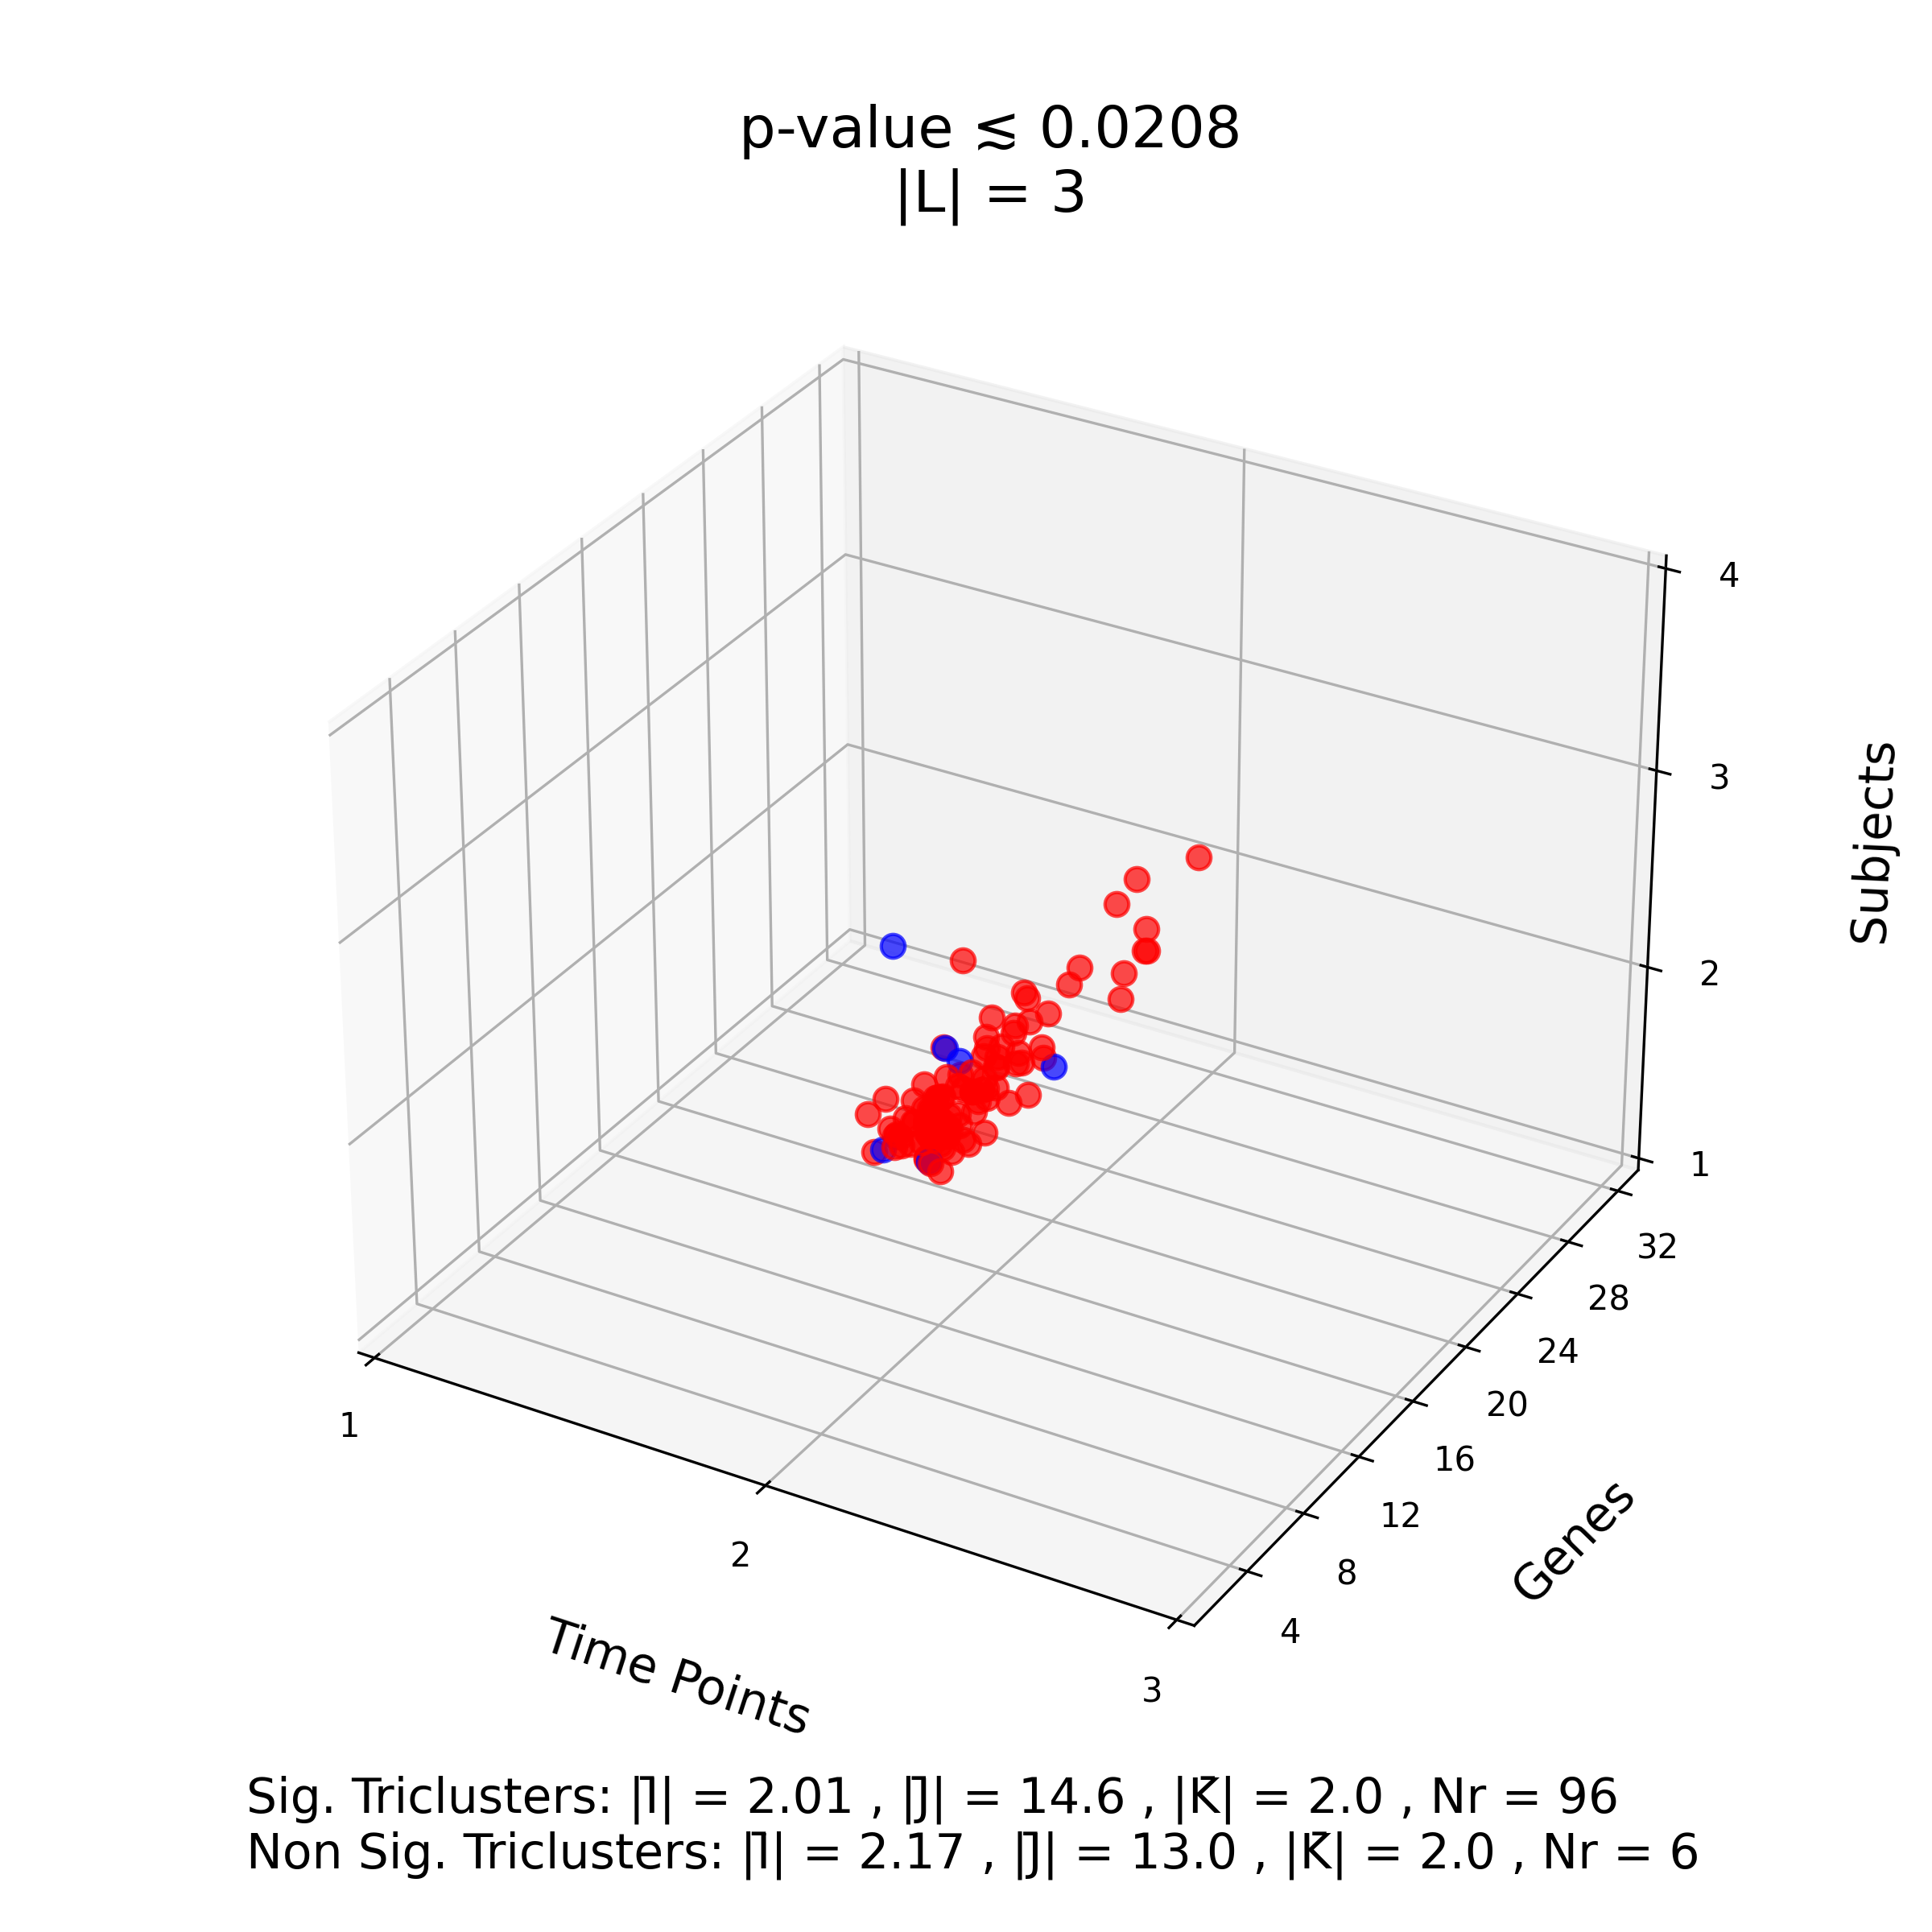
a) -Trimax b) TriCluster c) TRIAS
III. Penicillin batch fermentation dataset
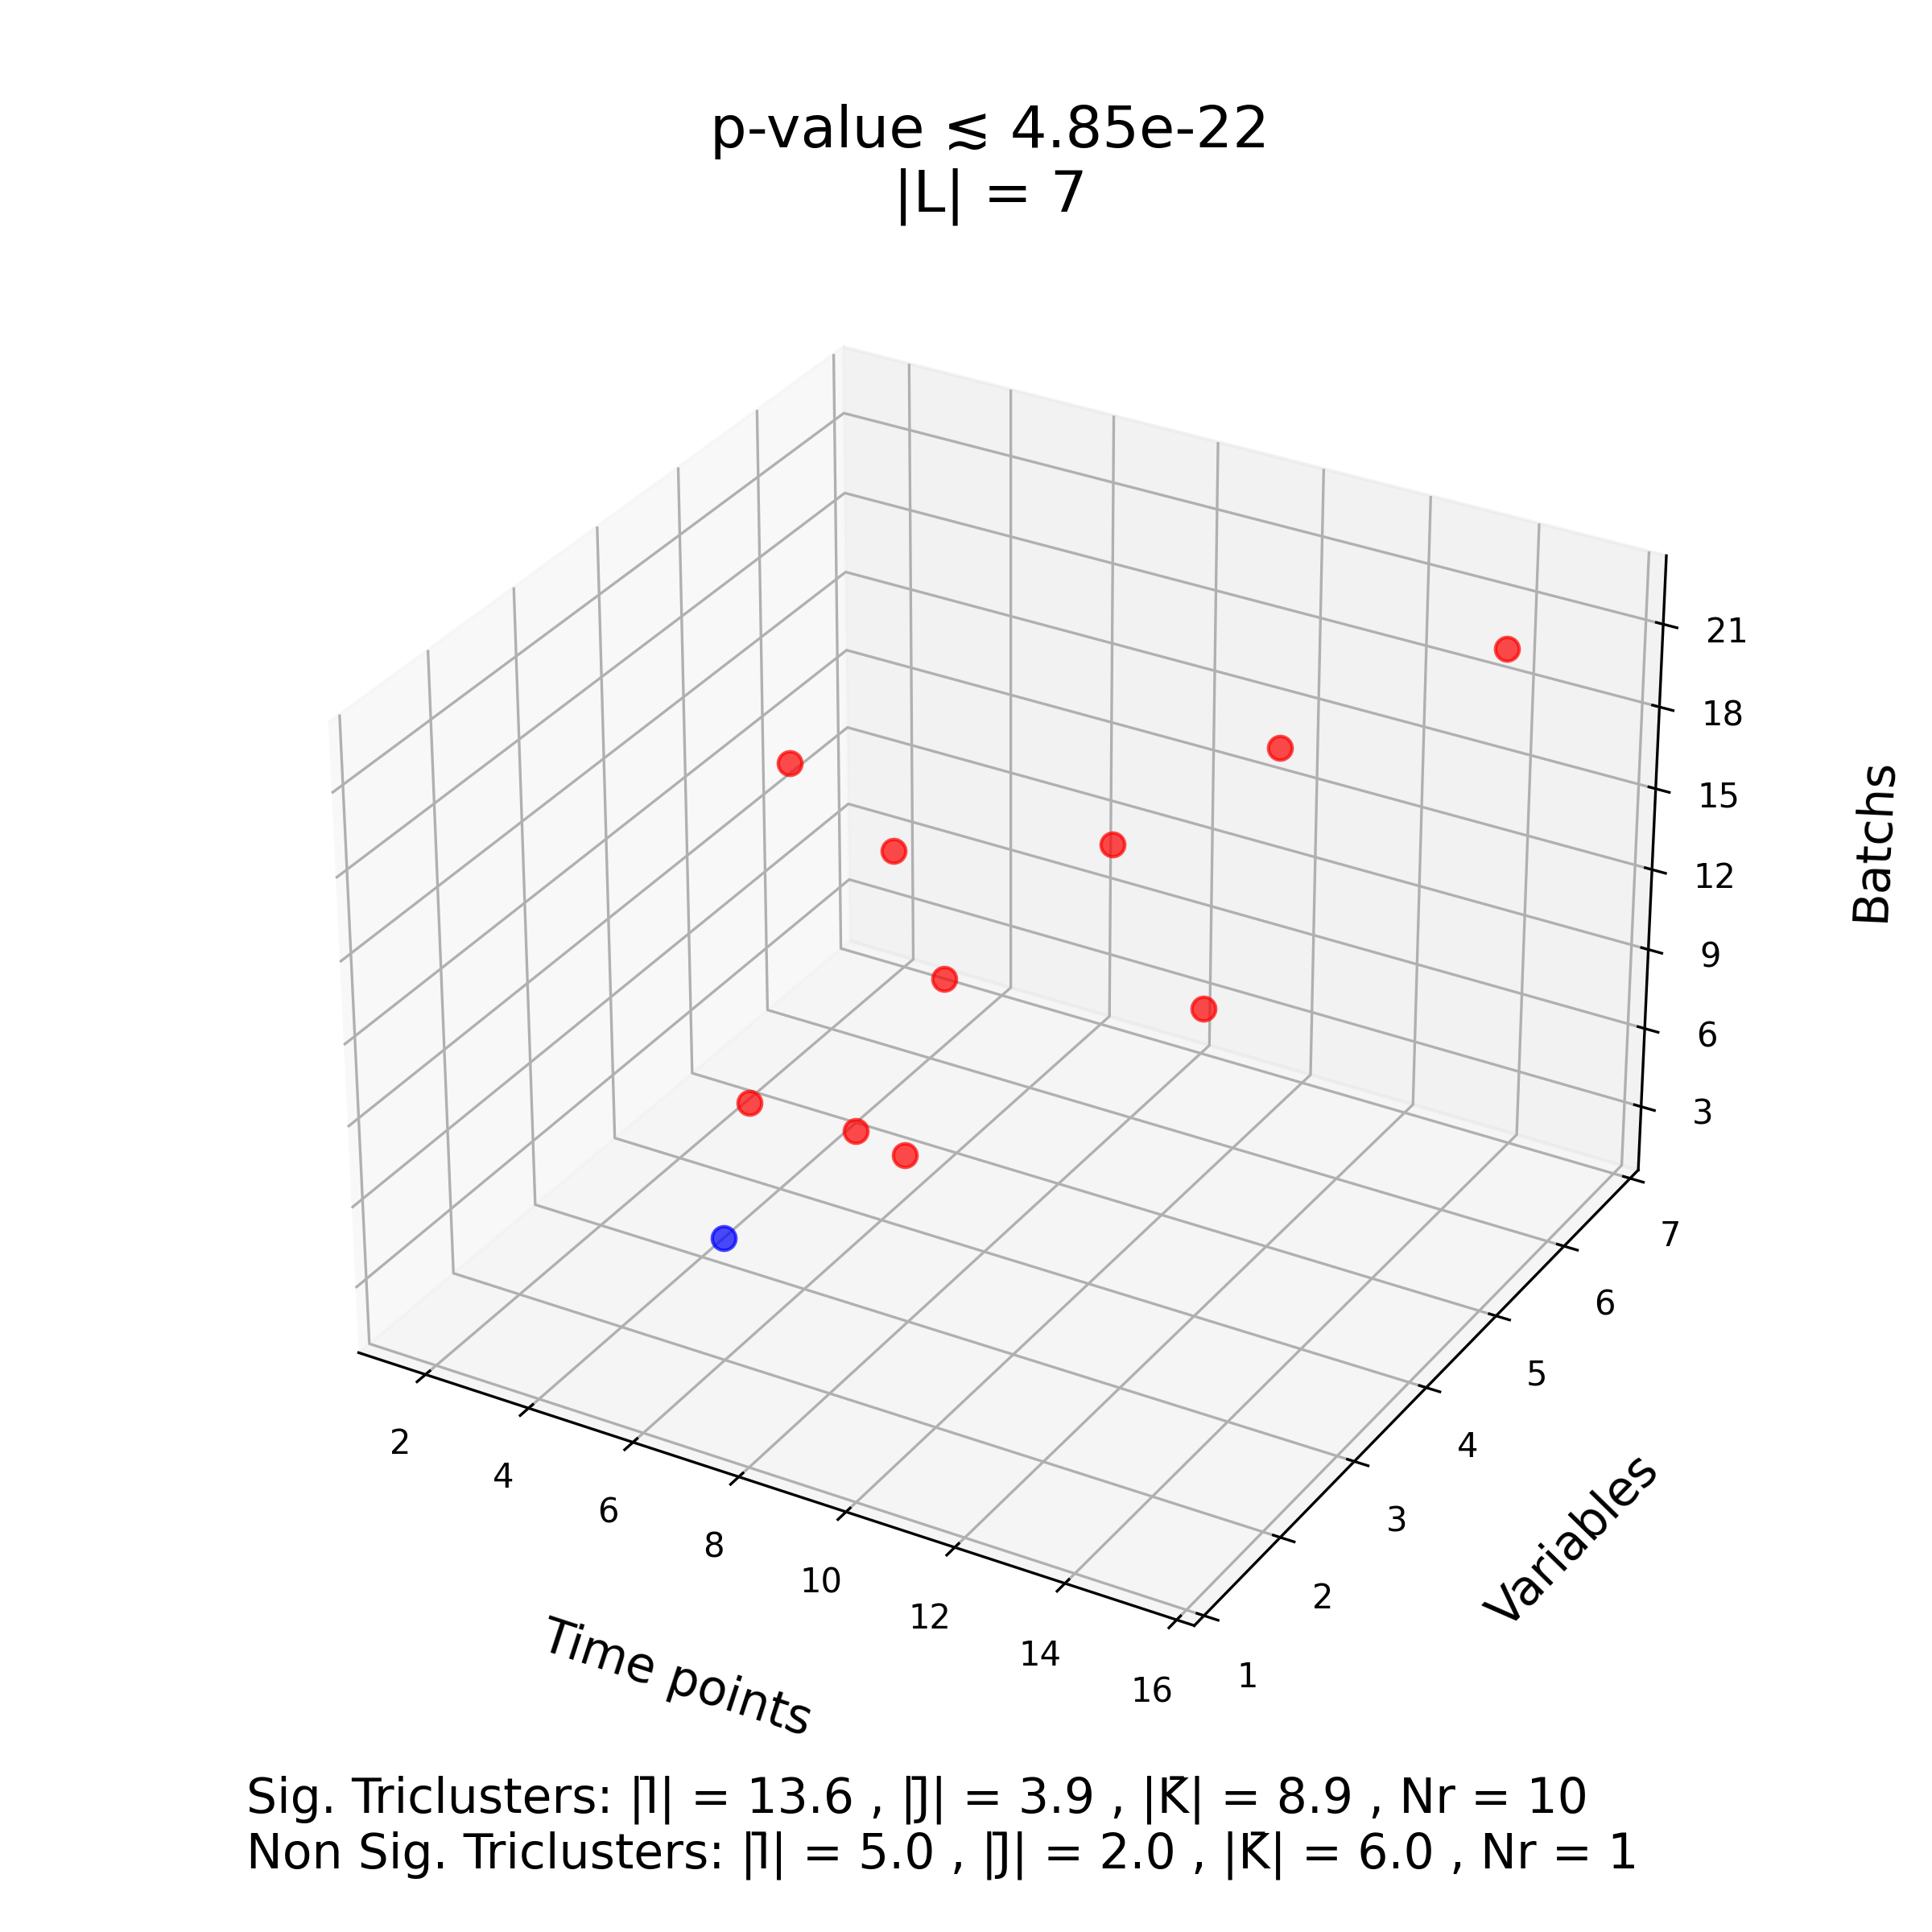
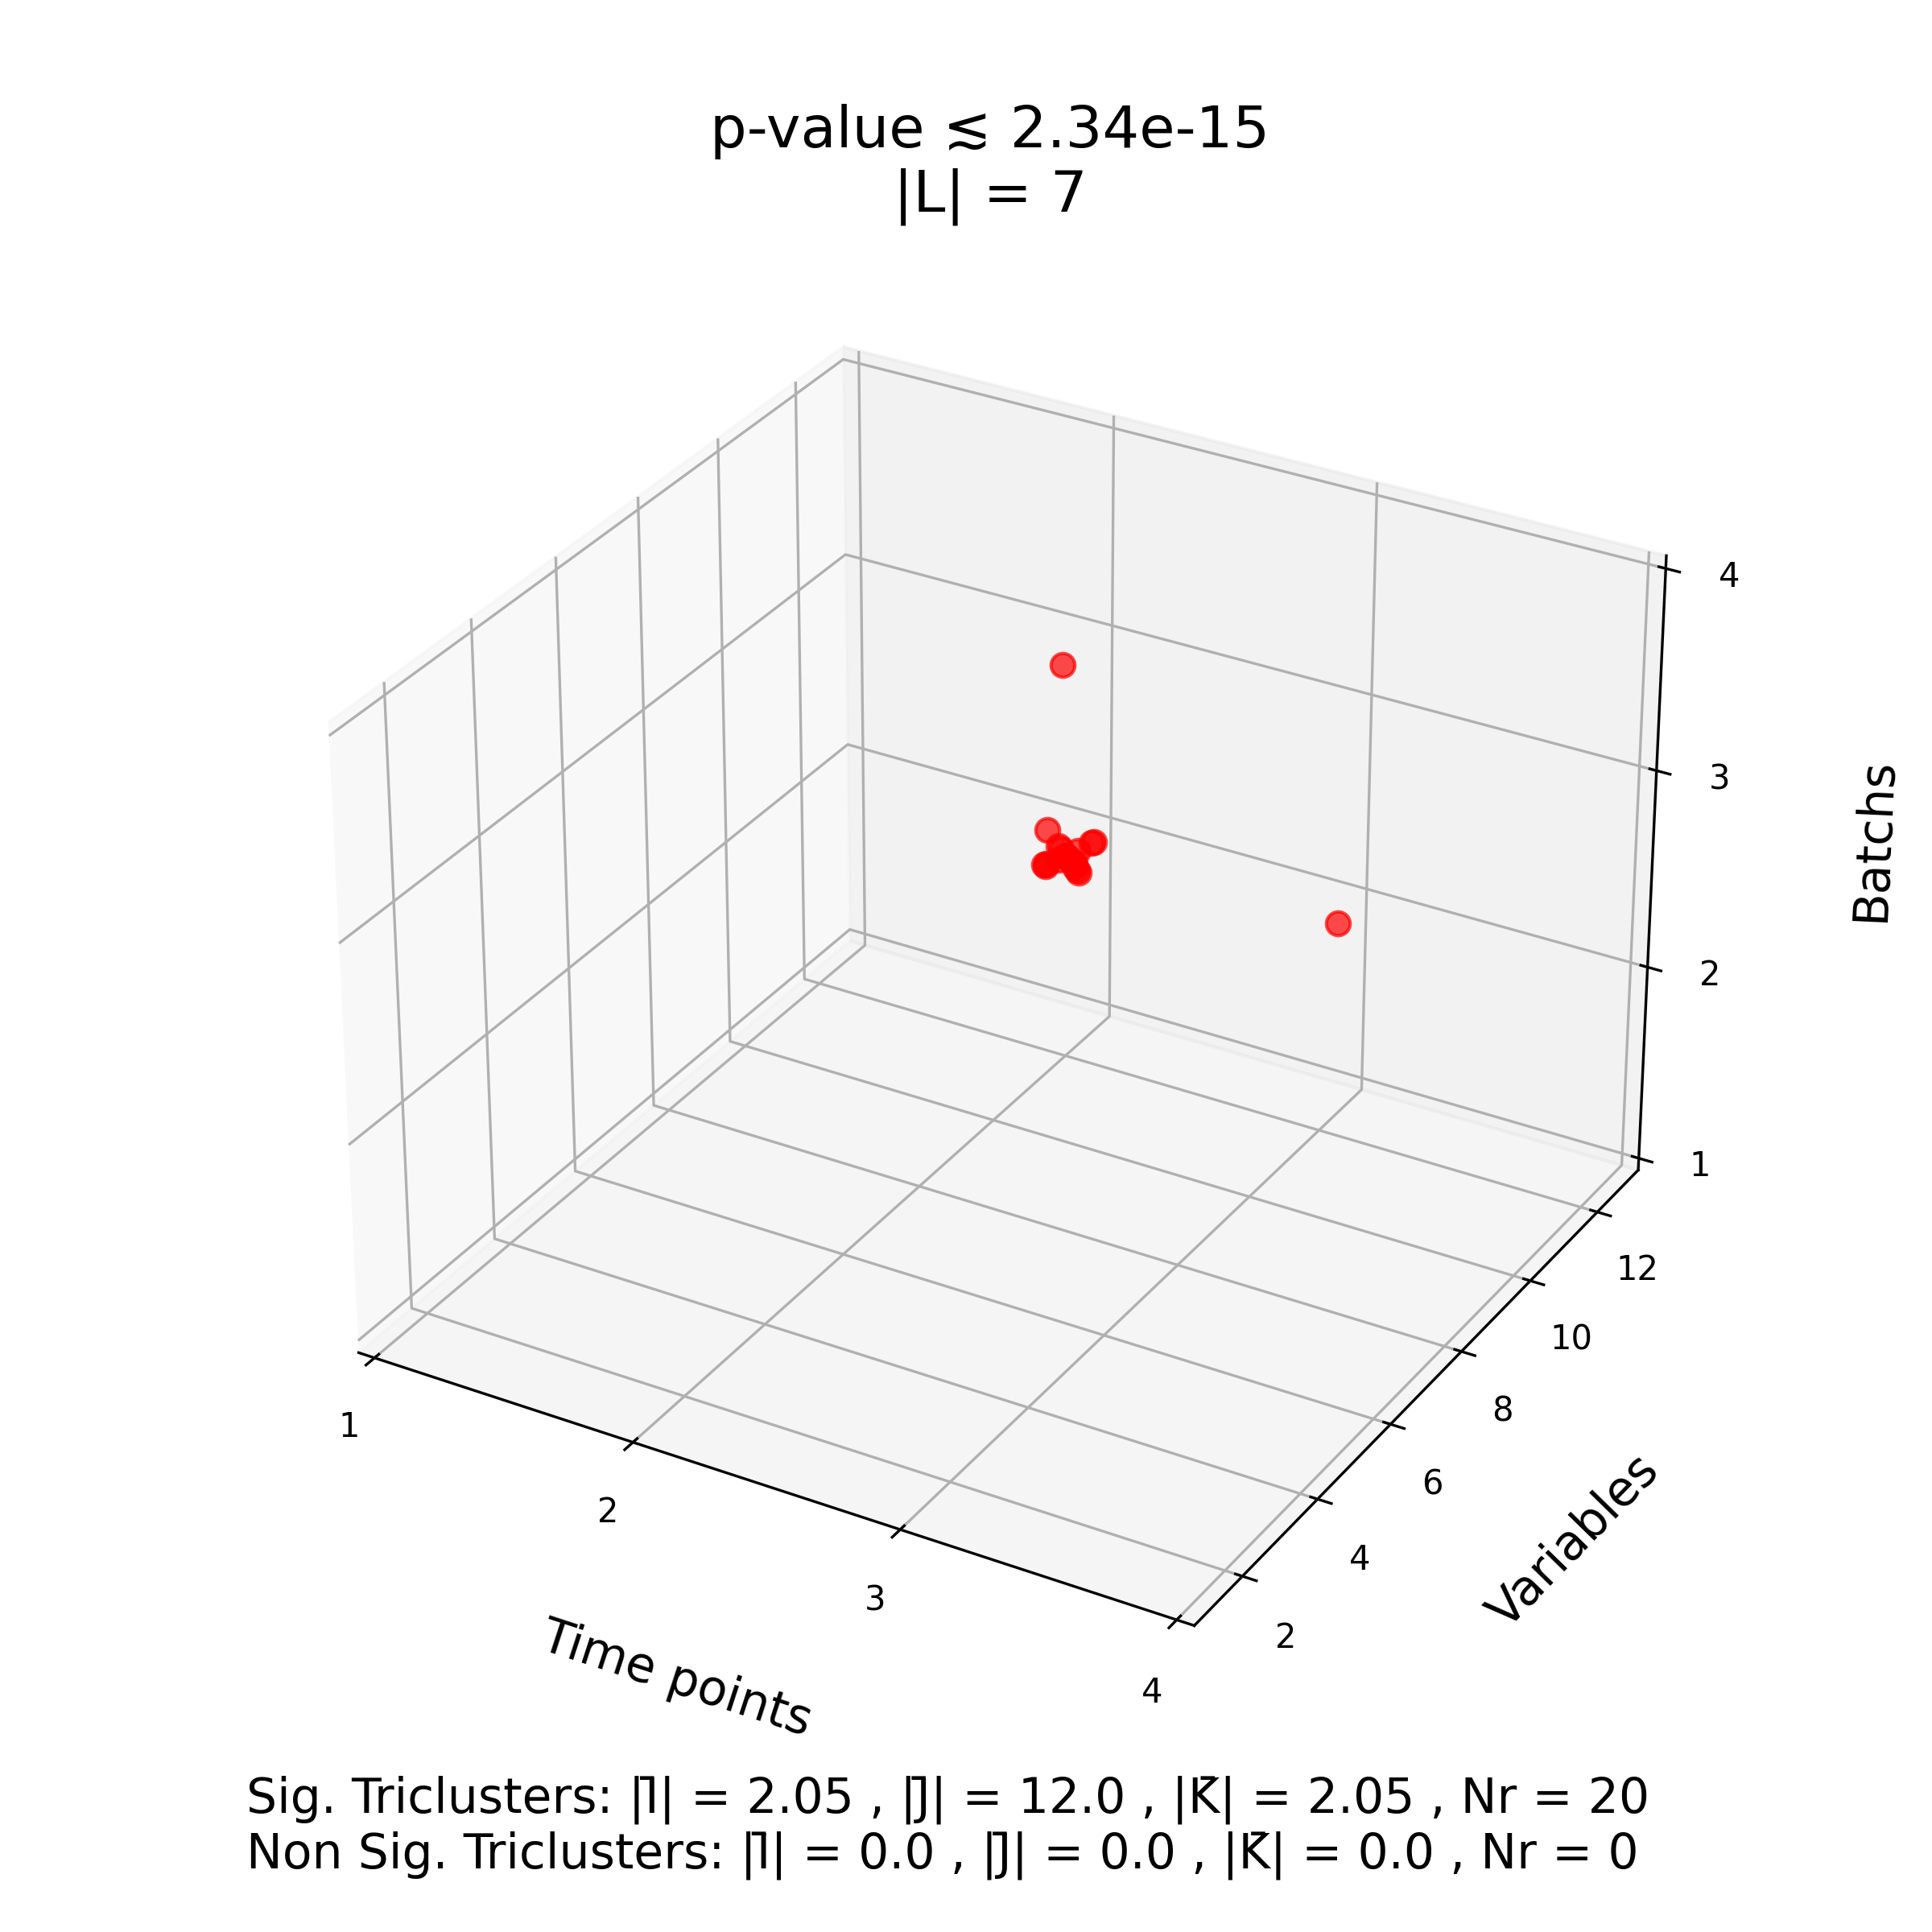
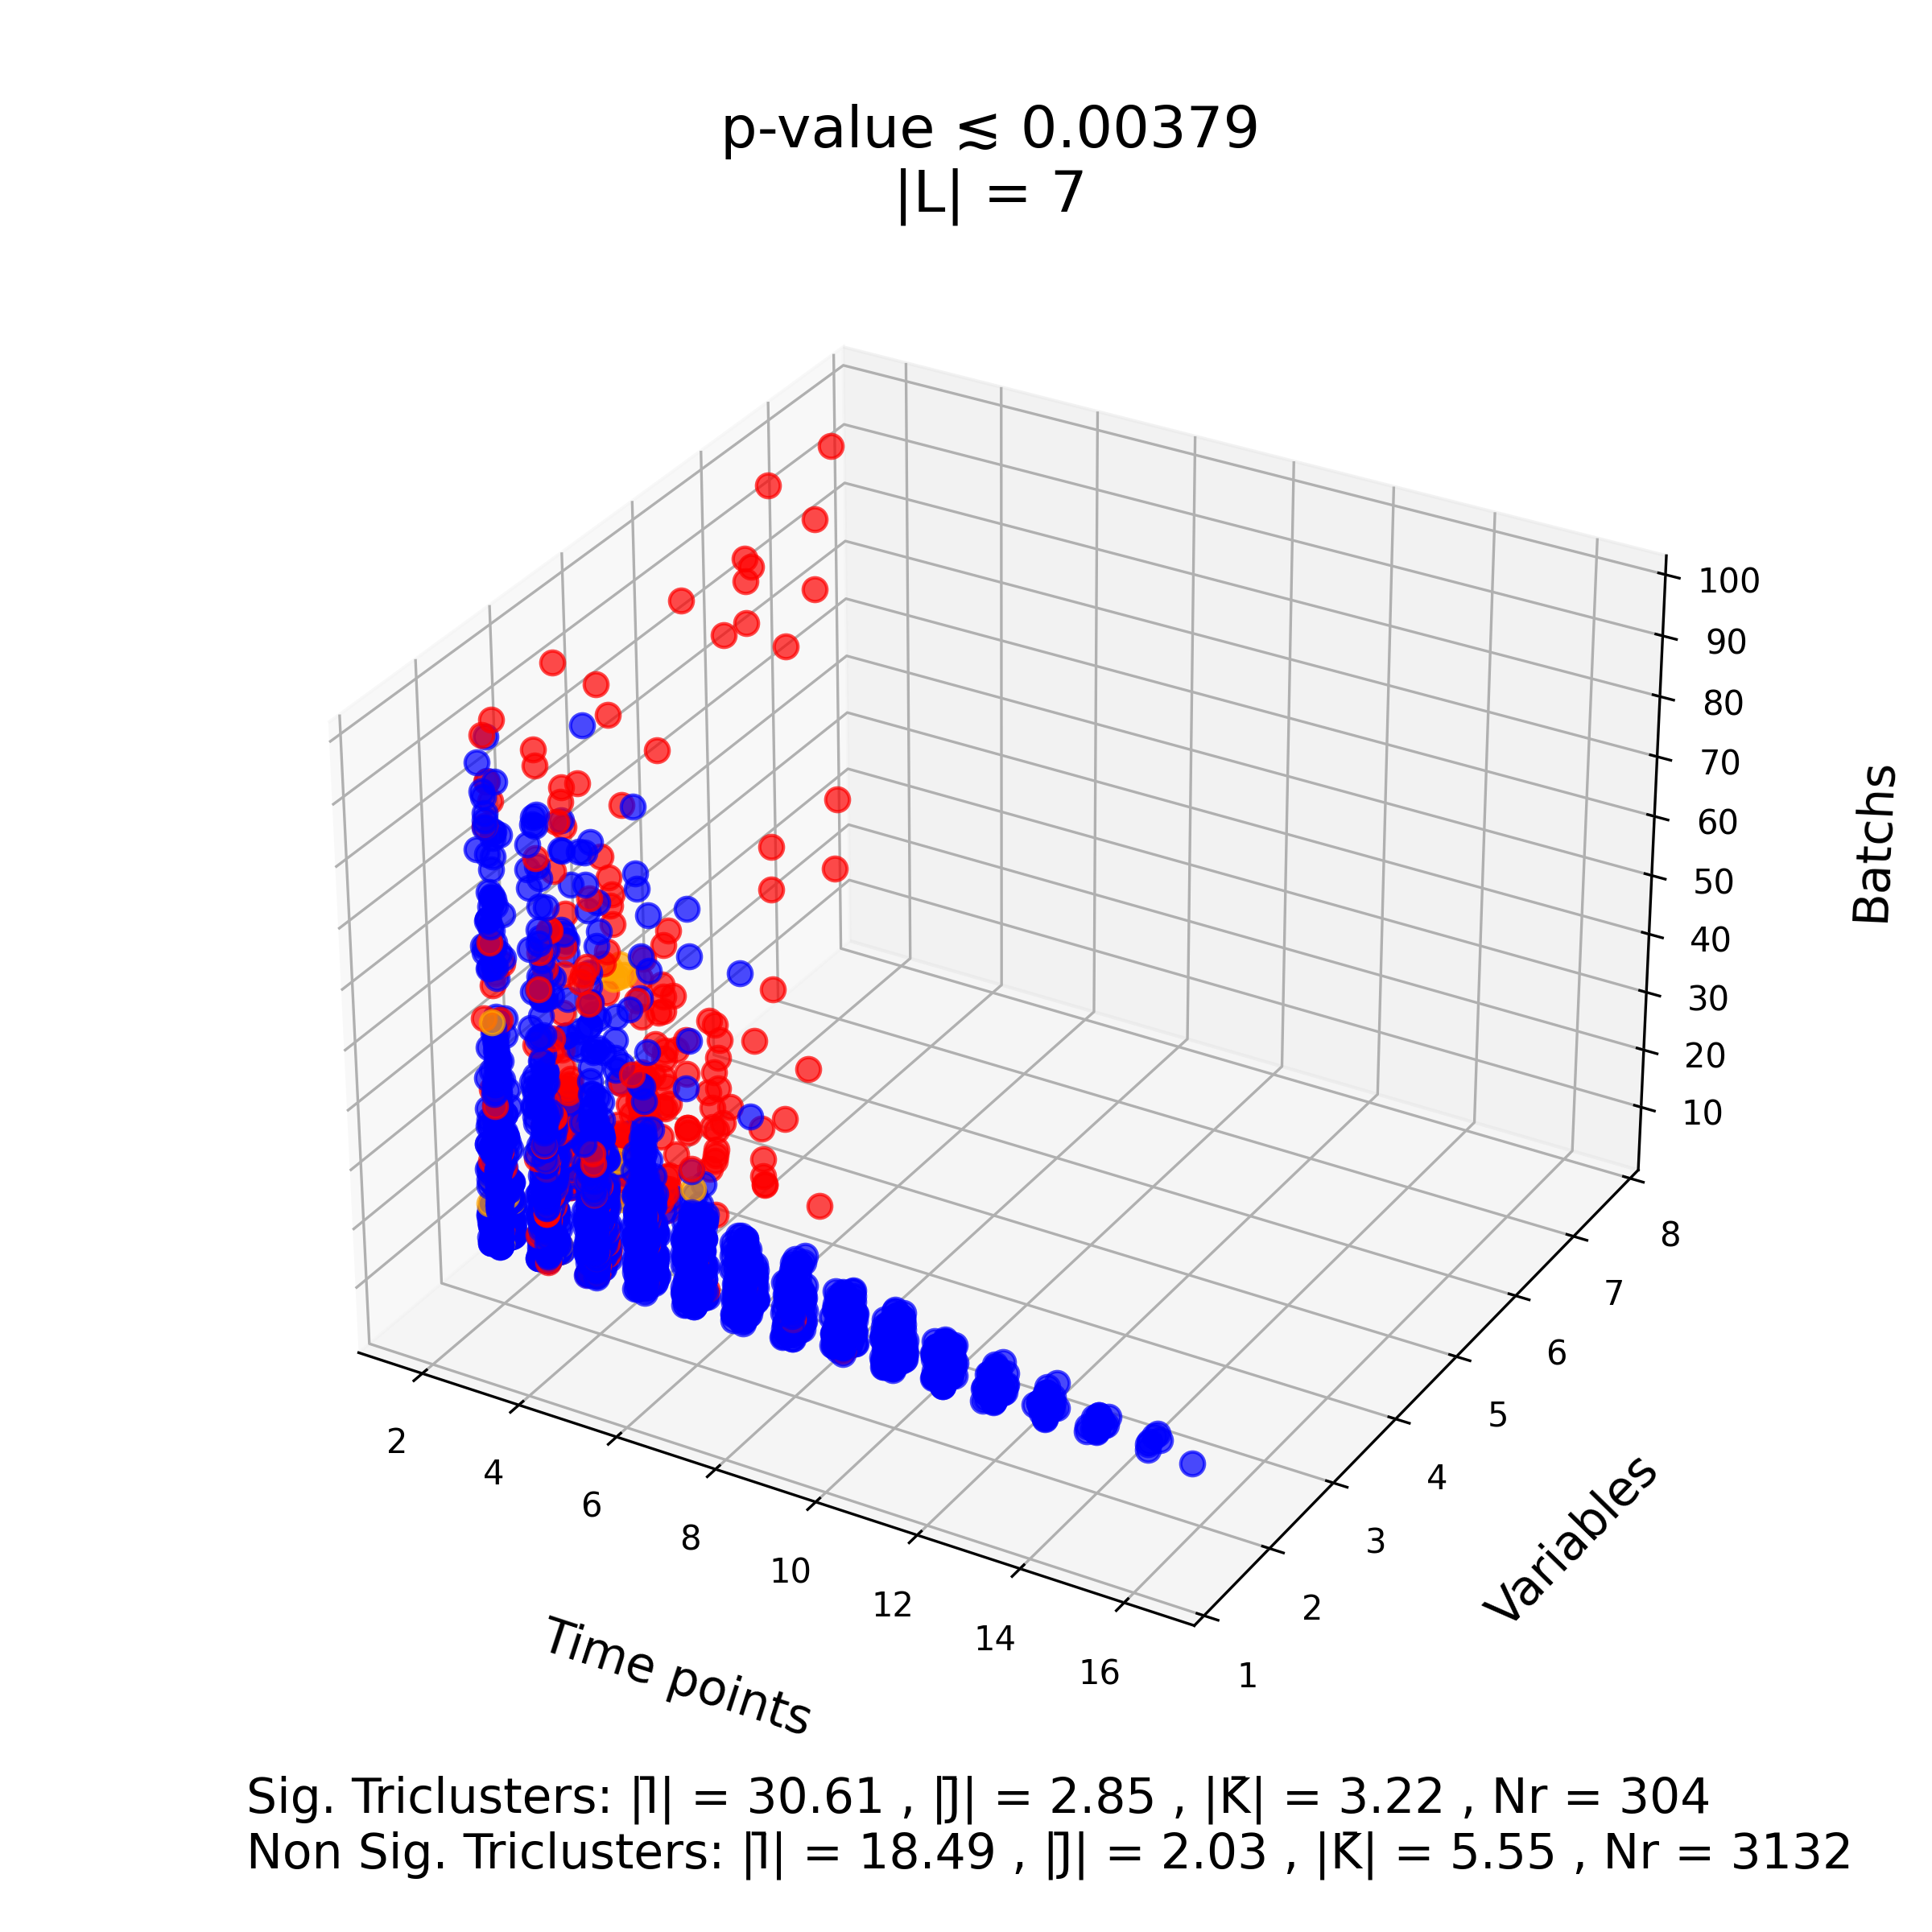
a) -Trimax b) TriCluster c) TRIAS
Consider the glycine dataset, with results presented in Figure 2-I. All algorithms extracted a small number of patterns, up to 26 patterns. The -Trimax extracted a total of 3 patterns, with an average number of subjects of around 3 (30%), an average number of 11 units (2%), and an average of 3 time points (50%). TriCluster and TRIAS extracted slightly more patterns, 22 and 26 accordingly, but with a lower average of subjects, between 2 and 5 subjects (5%-20%), and a lower average of time points, only 2 time points in all of the patterns (33%). Despite different assumptions considered, the patterns extracted by all of the algorithms generally yield statistical significance (low -values). The Benjamini-Hochberg procedure sets the statistical significance threshold between and decimals. This can be explained by the imposed assumption in the dimension of the units, associated with extremely low co-occurrence probabilities.
Consider the results of drug response gene expression presented in Figure 2-II. In this case, -Trimax extracted a total of 23 patterns, while TriCluster and TRIAS extracted a total of 125 and 102 patterns respectively. Patterns extracted by -Trimax have an average number of 8 subjects (67%), 13 genes (3%), and 3 time points (75%). TriCluster and TRIAS have a lower number of subjects (16%), 68 genes (13%) in TriCluster and 14 genes (3%) in TRIAS, and 2 time points (50%). Contrary to the glycine case study, due to a more conservative null model assumption, all patterns extracted by TriCluster have a p-value above the imposed significance threshold. Similarly, some patterns extracted by TRIAS also fail to meet the imposed significance threshold.
Results of the industrial batches’ study are presented in Figure 2-III. Both -Trimax and the TriCluster extracted a small number of patterns (11 and 20), whilst TRIAS retrieved over 3400 patterns. For the TriCluster algorithm, all patterns yield statistical significance. The patterns extracted by TriCluster occur on average in 2 batches (2%), on average in 12 variables (75%), and on average in 2 time points (8%), meaning these patterns despite occurring on a very low number of batches have enough variables and time points to be marked as statistically significant. In the patterns extracted by -Trimax we observe a threshold between significant and non-significant patterns, between 2 and 3 variables. Patterns with statistical significance contain on average 14 batches (13%), 4 variables (25%) and 9 time points (36%). Contrary to previous case studies, TRIAS extracted 9% of patterns with statistical significance and 3132 non-significant patterns (91%). As depicted in Figure 2-III, most non-significant patterns occur in patterns with a lower number of variables between 2 and 3 when compared against statistically significant patterns. In this case, we can observe that the number of time points does not condition the pattern’s statistical significance even though some patterns occur up to 16 time points without statistical significance.
Synthetic data
What makes a tricluster statistically significant? To answer this research question, synthetic data with planted triclustering solutions are used to statistically assess triclusters with varying properties.
Synthetic data with Uniform distribution


Without p-value correction: With p-value correction:
Variables Mutually dependent Variables Mutually dependent
Contexts Mutually dependent Contexts Mutually dependent
Synthetic data with Gaussian distribution


Without p-value correction: With p-value correction:
Variables Mutually dependent Variables Mutually dependent
Time-based Contexts Time-based Contexts
| Triclusters (, , ) | Synthetic data ( = 1000, = 50, = 50) – Uniform distribution | ||
| p-value | p-value (with correction) | ||
| (55, 3, 2) | |||
| (484, 2, 2) | |||
| (249, 3, 2) | |||
| (327, 3, 2) | |||
| (85, 2, 3) | |||
| Triclusters (, , ) | Synthetic data ( = 1000, = 50, = 50) – Gaussian distribution | ||
| p-value | p-value (with correction) | ||
| (368, 3, 3) | , , | ||
| (498, 2, 3) | , , | ||
| (334, 3, 3) | , , | ||
| (275, 3, 3) | , , | ||
| (229, 3, 2) | , | ||
Consider the results for the synthetic data presented in Figure 3. Assuming variables and contexts to be mutually dependent, we selected two cases: 1) planted triclusters are not contiguous in the context dimension, and variables follow a uniform distribution, and 2) triclusters are contiguous in the context dimension, and variables follow a Gaussian distribution. The pattern characteristics, intermediate statistics, and p-values are presented in Table 4. By observing the aforesaid figure and table, the randomly planted triclusters with statistical significance are not only conditioned by the number of observations, variables, and contexts they occur, but as well by the probability of the tricluster pattern, . In this case, with mutually dependent contexts and no context contiguity, the joint probability of all slice patterns, , contained in is balanced by . If patterns are not sufficiently improbable in their corresponding variables, meaning they don’t occur in a high number of contexts or are probable to occur, the pattern will not yield statistical significance. We observe this in triclusters and . Despite both tricluster patterns occurring in a low number of observations, the pattern is not rare enough to be considered statistically significant. Considering the Gaussian setting, where contexts are mutually dependent and triclusters contiguous across contexts, the joint probability between and transitions, and a more relaxed statistic , allow more probable patterns to have statistical significance. Tricluster patterns with a higher number of variables and contexts yield statistical significance. Finally, the changes observed under the p-value correction suggest the importance of this procedure to effectively mitigate possible false-positives.
5 Conclusion
This work proposed a novel methodology to rigorously assess the statistical significance of patterns extracted from tensor data. The methodology provides a robust set of statistical principles that accommodate different aspects of tensor data such as variable domains and dependencies, temporal dependencies and misalignments, and relevant p-value corrections. These principles can be easily extended to -way tensor data, bridging the current gap on how to assess the statistical significance of patterns in tensor data with more than two dimensions. Results gathered from real-world case studies provide notable validity and in-depth reasoning on how to apply the methodology in practice.
The implementation of the proposed statistical tests can be found at https:// github.com/JupitersMight/TriSig. These statistical tests can be integrated into the discovery process of patterns, aiding in pattern-centric descriptive and predictive tasks.
Funding
This work was supported by the FCT PhD grant to LA (2021.07759.BD), Associate Laboratory for Green Chemistry (LAQV) financed by national funds from FCT/MCTES (UIDB/50006/2020 and UIDP/50006/2020), INESC-ID plurianual (UIDB/50021/2020), and the contract CEECIND/01399/2017 to RSC. The authors also wish to acknowledge the European Union’s Horizon BioLaMer project under grant agreement number [101099487].
References
- Ahn et al. (2022) Ahn, S.J., Kim, J., Kim, J., 2022. The bifold triadic relationships framework: A theoretical primer for advertising research in the metaverse. Journal of Advertising 51, 592–607.
- Alessandroni et al. (2020) Alessandroni, N., Moreno-Núñez, A., Rodríguez, C., Del Olmo, M.J., 2020. Musical dynamics in early triadic interactions: A case study. Psychological Research 84, 1555–1571.
- Alexandre et al. (2021) Alexandre, L., Costa, R.S., Santos, L.L., Henriques, R., 2021. Mining pre-surgical patterns able to discriminate post-surgical outcomes in the oncological domain. IEEE Journal of Biomedical and Health Informatics 25, 2421–2434.
- Amaro-Mellado et al. (2021) Amaro-Mellado, J.L., Melgar-García, L., Rubio-Escudero, C., Gutiérrez-Avilés, D., 2021. Generating a seismogenic source zone model for the pyrenees: A gis-assisted triclustering approach. Computers & Geosciences 150, 104736.
- Ashburner et al. (2000) Ashburner, M., Ball, C.A., Blake, J.A., Botstein, D., Butler, H., Cherry, J.M., Davis, A.P., Dolinski, K., Dwight, S.S., Eppig, J.T., et al., 2000. Gene ontology: tool for the unification of biology. Nature genetics 25, 25–29.
- Benjamini and Hochberg (1995) Benjamini, Y., Hochberg, Y., 1995. Controlling the false discovery rate: a practical and powerful approach to multiple testing. Journal of the Royal statistical society: series B (Methodological) 57, 289–300.
- Bhar et al. (2013) Bhar, A., Haubrock, M., Mukhopadhyay, A., Maulik, U., Bandyopadhyay, S., Wingender, E., 2013. Coexpression and coregulation analysis of time-series gene expression data in estrogen-induced breast cancer cell. Algorithms for molecular biology 8, 1–11.
- Bhar et al. (2015) Bhar, A., Haubrock, M., Mukhopadhyay, A., Wingender, E., 2015. Multiobjective triclustering of time-series transcriptome data reveals key genes of biological processes. BMC bioinformatics 16, 1–19.
- Biswal et al. (2020) Biswal, B.S., Patra, S., Mohapatra, A., Vipsita, S., 2020. Trirnsc: triclustering of gene expression microarray data using restricted neighbourhood search. IET Systems Biology 14, 323–333.
- Cardoso-Moreira et al. (2019) Cardoso-Moreira, M., Halbert, J., Valloton, D., Velten, B., Chen, C., Shao, Y., Liechti, A., Ascenção, K., Rummel, C., Ovchinnikova, S., et al., 2019. Gene expression across mammalian organ development. Nature 571, 505–509.
- Chetty and Chetty (2009) Chetty, G., Chetty, M., 2009. Multiclass microarray gene expression analysis based on mutual dependency models, in: IAPR International Conference on Pattern Recognition in Bioinformatics, Springer. pp. 46–55.
- Gan et al. (2018) Gan, Y., Dong, Z., Zhang, X., Zou, G., 2018. Tri-clustering analysis for dissecting epigenetic patterns across multiple cancer types, in: International Conference on Intelligent Computing, Springer. pp. 330–336.
- Gnatyshak et al. (2012) Gnatyshak, D., Ignatov, D.I., Semenov, A., Poelmans, J., 2012. Gaining insight in social networks with biclustering and triclustering, in: International conference on business informatics research, Springer. pp. 162–171.
- Gnatyshak (2014) Gnatyshak, D.V., 2014. Greedy modifications of oac-triclustering algorithm. Procedia Computer Science 31, 1116–1123.
- Goldrick et al. (2019) Goldrick, S., Duran-Villalobos, C.A., Jankauskas, K., Lovett, D., Farid, S.S., Lennox, B., 2019. Modern day monitoring and control challenges outlined on an industrial-scale benchmark fermentation process. Computers & Chemical Engineering 130, 106471.
- Goldrick et al. (2015) Goldrick, S., Ştefan, A., Lovett, D., Montague, G., Lennox, B., 2015. The development of an industrial-scale fed-batch fermentation simulation. Journal of biotechnology 193, 70–82.
- Gonçalves and Madeira (2010) Gonçalves, J.P., Madeira, S.C., 2010. e-bimotif: Combining sequence alignment and biclustering to unravel structured motifs, in: Advances in Bioinformatics: 4th International Workshop on Practical Applications of Computational Biology and Bioinformatics 2010 (IWPACBB 2010), Springer. pp. 181–191.
- Groen et al. (2020) Groen, S.C., Ćalić, I., Joly-Lopez, Z., Platts, A.E., Choi, J.Y., Natividad, M., Dorph, K., Mauck, W.M., Bracken, B., Cabral, C.L.U., et al., 2020. The strength and pattern of natural selection on gene expression in rice. Nature 578, 572–576.
- Guigourès et al. (2018) Guigourès, R., Boullé, M., Rossi, F., 2018. Discovering patterns in time-varying graphs: a triclustering approach. Advances in Data Analysis and Classification 12, 509–536.
- Henriques et al. (2017) Henriques, R., Ferreira, F.L., Madeira, S.C., 2017. Bicpams: software for biological data analysis with pattern-based biclustering. BMC bioinformatics 18, 1–16.
- Henriques and Madeira (2018a) Henriques, R., Madeira, S.C., 2018a. Bsig: evaluating the statistical significance of biclustering solutions. Data Mining and Knowledge Discovery 32, 124–161.
- Henriques and Madeira (2018b) Henriques, R., Madeira, S.C., 2018b. Triclustering algorithms for three-dimensional data analysis: a comprehensive survey. ACM Computing Surveys (CSUR) 51, 1–43.
- Ignatov et al. (2015) Ignatov, D.I., Gnatyshak, D.V., Kuznetsov, S.O., Mirkin, B.G., 2015. Triadic formal concept analysis and triclustering: searching for optimal patterns. Machine Learning 101, 271–302.
- Irwin et al. (2016) Irwin, C., Van Reenen, M., Mason, S., Mienie, L.J., Westerhuis, J.A., Reinecke, C.J., 2016. Contribution towards a metabolite profile of the detoxification of benzoic acid through glycine conjugation: an intervention study. Plos one 11, e0167309.
- Jaschke et al. (2006) Jaschke, R., Hotho, A., Schmitz, C., Ganter, B., Stumme, G., 2006. Trias–an algorithm for mining iceberg tri-lattices, in: Sixth International Conference on Data Mining (ICDM’06), IEEE. pp. 907–911.
- Joo et al. (2019) Joo, H., Simon, T., Cikara, M., Sheikh, Y., 2019. Towards social artificial intelligence: Nonverbal social signal prediction in a triadic interaction, in: Proceedings of the IEEE/CVF Conference on Computer Vision and Pattern Recognition, pp. 10873–10883.
- Jung and Wickrama (2008) Jung, T., Wickrama, K.A., 2008. An introduction to latent class growth analysis and growth mixture modeling. Social and personality psychology compass 2, 302–317.
- Kanno et al. (2006) Kanno, J., Aisaki, K.i., Igarashi, K., Nakatsu, N., Ono, A., Kodama, Y., Nagao, T., 2006. ” per cell” normalization method for mrna measurement by quantitative pcr and microarrays. BMC genomics 7, 1–14.
- Kazemi et al. (2021) Kazemi, M.H., Majnooni-Heris, A., Kisi, O., Shiri, J., 2021. Generalized gene expression programming models for estimating reference evapotranspiration through cross-station assessment and exogenous data supply. Environmental Science and Pollution Research 28, 6520–6532.
- Kim et al. (2019) Kim, J.K., Chen, Y., Hirning, A.J., Alnahhas, R.N., Josić, K., Bennett, M.R., 2019. Long-range temporal coordination of gene expression in synthetic microbial consortia. Nature chemical biology 15, 1102–1109.
- Kremser et al. (2021) Kremser, S., Harvey, M., Kuma, P., Hartery, S., Saint-Macary, A., McGregor, J., Schuddeboom, A., Von Hobe, M., Lennartz, S.T., Geddes, A., et al., 2021. Southern ocean cloud and aerosol data: a compilation of measurements from the 2018 southern ocean ross sea marine ecosystems and environment voyage. Earth System Science Data 13, 3115–3153.
- Liu et al. (2020) Liu, J., Frochaux, M., Gardeux, V., Deplancke, B., Robinson-Rechavi, M., 2020. Inter-embryo gene expression variability recapitulates the hourglass pattern of evo-devo. BMC biology 18, 1–12.
- Lobo et al. (2021) Lobo, J., Henriques, R., Madeira, S.C., 2021. G-tric: generating three-way synthetic datasets with triclustering solutions. BMC bioinformatics 22, 1–28.
- Madeira and Oliveira (2004) Madeira, S.C., Oliveira, A.L., 2004. Biclustering algorithms for biological data analysis: a survey. IEEE/ACM transactions on computational biology and bioinformatics 1, 24–45.
- Madeira et al. (2008) Madeira, S.C., Teixeira, M.C., Sa-Correia, I., Oliveira, A.L., 2008. Identification of regulatory modules in time series gene expression data using a linear time biclustering algorithm. IEEE/ACM Transactions on Computational Biology and Bioinformatics 7, 153–165.
- Mandal et al. (2022) Mandal, K., Sarmah, R., Bhattacharyya, D.K., 2022. Poptric: Pathway-based order preserving triclustering for gene sample time data analysis. Expert Systems with Applications 192, 116336.
- Melgar-García et al. (2022) Melgar-García, L., Gutiérrez-Avilés, D., Godinho, M.T., Espada, R., Brito, I.S., Martínez-Álvarez, F., Troncoso, A., Rubio-Escudero, C., 2022. A new big data triclustering approach for extracting three-dimensional patterns in precision agriculture. Neurocomputing .
- Moise and Sander (2008) Moise, G., Sander, J., 2008. Finding non-redundant, statistically significant regions in high dimensional data: a novel approach to projected and subspace clustering, in: Proceedings of the 14th ACM SIGKDD international conference on Knowledge discovery and data mining, pp. 533–541.
- Nagin (2010) Nagin, D.S., 2010. Group-based trajectory modeling: an overview. Handbook of quantitative criminology , 53–67.
- Oberski (2016) Oberski, D., 2016. Mixture models: Latent profile and latent class analysis. Modern statistical methods for HCI , 275–287.
- Rahaman et al. (2022) Rahaman, M.A., Damaraju, E., Turner, J.A., van Erp, T.G., Mathalon, D., Vaidya, J., Muller, B., Pearlson, G., Calhoun, V.D., 2022. Tri-clustering dynamic functional network connectivity identifies significant schizophrenia effects across multiple states in distinct subgroups of individuals. Brain Connectivity 12, 61–73.
- Sim et al. (2010) Sim, K., Aung, Z., Gopalkrishnan, V., 2010. Discovering correlated subspace clusters in 3d continuous-valued data, in: 2010 IEEE International Conference on Data Mining, IEEE. pp. 471–480.
- Soares et al. (2021) Soares, D., Henriques, R., Gromicho, M., Pinto, S., de Carvalho, M., Madeira, S.C., 2021. Towards triclustering-based classification of three-way clinical data: A case study on predicting non-invasive ventilation in als, in: Practical Applications of Computational Biology & Bioinformatics, 14th International Conference (PACBB 2020) 14, Springer. pp. 112–122.
- Soares et al. (2020) Soares, D., Henriques, R., Gromicho, M., Pinto, S., Carvalho, M.d., Madeira, S.C., 2020. Towards triclustering-based classification of three-way clinical data: A case study on predicting non-invasive ventilation in als, in: International Conference on Practical Applications of Computational Biology & Bioinformatics, Springer. pp. 112–122.
- Song et al. (2019) Song, T., Tang, Q., Huang, J., 2019. Triadic closure, homophily, and reciprocation: an empirical investigation of social ties between content providers. Information Systems Research 30, 912–926.
- Strober et al. (2019) Strober, B., Elorbany, R., Rhodes, K., Krishnan, N., Tayeb, K., Battle, A., Gilad, Y., 2019. Dynamic genetic regulation of gene expression during cellular differentiation. Science 364, 1287–1290.
- Užupytė and Wit (2020) Užupytė, R., Wit, E.C., 2020. Test for triadic closure and triadic protection in temporal relational event data. Social Network Analysis and Mining 10, 1–12.
- White et al. (2020) White, J.M., Piron, M.J., Rangaraj, V.R., Hanlon, E.C., Cohen, R.N., Brady, M.J., 2020. Reference gene optimization for circadian gene expression analysis in human adipose tissue. Journal of biological rhythms 35, 84–97.
- Williams et al. (2022) Williams, C.A., Bailey, T., Hastings, R.P., 2022. Modelling triadic relationships in families of children with intellectual disability. Journal of Applied Research in Intellectual Disabilities 35, 843–855.
- Wu et al. (2013) Wu, W., Selig, J.P., Little, T.D., 2013. Longitudinal data analysis. Oxford handbook of quantitative methods 2, 387–410.
- Wu et al. (2020) Wu, X., Cheng, C., Zurita-Milla, R., Song, C., 2020. An overview of clustering methods for geo-referenced time series: From one-way clustering to co-and tri-clustering. International journal of geographical information science 34, 1822–1848.
- Yalçin et al. (2020) Yalçin, M., El-Athman, R., Ouk, K., Priller, J., Relógio, A., 2020. Analysis of the circadian regulation of cancer hallmarks by a cross-platform study of colorectal cancer time-series data reveals an association with genes involved in huntington’s disease. Cancers 12, 963.