Being Right for Whose Right Reasons?
Abstract
Explainability methods are used to benchmark the extent to which model predictions align with human rationales i.e., are ‘right for the right reasons’. Previous work has failed to acknowledge, however, that what counts as a rationale is sometimes subjective. This paper presents what we think is a first of its kind, a collection of human rationale annotations augmented with the annotators demographic information. We cover three datasets spanning sentiment analysis and common-sense reasoning, and six demographic groups (balanced across age and ethnicity). Such data enables us to ask both what demographics our predictions align with and whose reasoning patterns our models’ rationales align with. We find systematic inter-group annotator disagreement and show how 16 Transformer-based models align better with rationales provided by certain demographic groups: We find that models are biased towards aligning best with older and/or white annotators. We zoom in on the effects of model size and model distillation, finding – contrary to our expectations – negative correlations between model size and rationale agreement as well as no evidence that either model size or model distillation improves fairness.
1 Introduction
Transparency of NLP models is essential for enhancing protection of user rights and improving model performance. A common avenue for providing such insight into the workings of otherwise opaque models come from explainability methods Páez (2019); Zednik and Boelsen (2022); Baum et al. (2022); Beisbart and Räz (2022); Hacker and Passoth (2022). Explanations for model decisions, also called rationales, are extracted to detect when models rely on spurious correlations, i.e., are right for the wrong reasons McCoy et al. (2019), or to analyze if they exhibit human-like inferential semantics Piantadosi and Hill (2022); Ray Choudhury et al. (2022). Furthermore, model rationales are used to evaluate how well models’ behaviors align with humans, by comparing them to human-annotated rationales, constructed by having annotators mark evidence in support of an instance’s label DeYoung et al. (2019). Human rationales are, in turn, used in training to improve models by guiding them towards what features they should (or should not) rely on Mathew et al. (2021); Rajani et al. (2019).
While genuine disagreement in labels is by now a well-studied phenomenon Beigman Klebanov and Beigman (2009); Plank et al. (2014); Plank (2022), little attention has been paid to disagreement in rationales. Since there is evidence that human rationales in ordinary decision-making differ across demographics Stanovich and West (2000), we cannot, it seems, blindly assume that what counts as a rationale for one group of people, e.g,. young men, also counts as a rationale for another group of people, e.g., elderly women. This dimension has not been explored in fairness research either. Could it be that some models that exhibit performance parity, condition on factors that align with the rationales of some groups, but not others?
Contributions
We present a collection of three existing datasets with demographics-augmented annotations to enable profiling of models, i.e., quantifying their alignment111We use the terms ‘agreement’ and ‘alignment’ interchangeably. with rationales provided by different socio-demographic groups. Such profiling enables us to ask whose right reasons models are being right for. Our annotations span two NLP tasks, namely sentiment classification and common-sense reasoning, across three datasets and six demographic groups, defined by age {Young, Old} and ethnicity {Black/African American, White/Caucasian, Latino/Hispanic}. We investigate label and rationale agreement across groups and evaluate to what extent groups’ rationales align with 16 Transformer-based models’ rationales, which are computed through attention- and gradient-based methods. We observe that models generally align best with older and/or white annotators. While larger models have slightly better prediction performance, model size does not correlate positively with neither rationale alignment nor fairness. Our work constitutes multi-dimensional research in off-the-beaten-track regions of the NLP research manifold Ruder et al. (2022). We make the annotations publicly available. 222github.com/terne/Being_Right_for_Whose_Right_Reasons 333huggingface.co/datasets/coastalcph/fair-rationales
2 Fairness and Rationales
Fairness generally concerns the distribution of resources, often across society as a whole. In NLP, the main resource is system performance. Others include computational resources, processing speed and user friendliness, but performance is king. AI fairness is an attempt to regulate the distribution of performance across subgroups, where these are defined by the product of legally protected attributes Williamson and Menon (2019).
NLP researchers have uniformly adopted American philosopher John Rawls’ definition of fairness Larson (2017); Vig et al. (2020); Ethayarajh and Jurafsky (2020); Li et al. (2021); Chalkidis et al. (2022), defining fairness as performance parity, except where it worsens the conditions of the least advantaged. Several dozen metrics have been proposed, based on Rawls’ definition (Castelnovo et al., 2022), some of which are argued to be inconsistent or based on mutually exclusive normative values Friedler et al. (2021); Castelnovo et al. (2022). Verma and Rubin (2018) grouped these metrics into metrics based only on predicted outcome, e.g., statistical parity, and metrics based on both predicted and actual outcome, e.g., performance parity and accuracy equality. Corbett-Davies and Goel (2018) argue that metrics such as predictive parity and accuracy equality do not track fairness in case of infra-marginality, i.e., when the error distributions of two subgroups are different. For a better understanding of the consequences of infra-marginality we refer to Biswas et al. (2019) and Sharma et al. (2020). Generally, there is some consensus that fairness in NLP is often best evaluated in terms of performance parity using standard performance metrics Williamson and Menon (2019); Koh et al. (2020); Chalkidis et al. (2022); Ruder et al. (2022). We do the same and evaluate fairness in group-model rationale agreement quantifying performance differences (understanding performance as degree of rationale agreement) across end user demographics. In doing so, we are embodying group fairness values: that individuals should be treated equally regardless of their protected attributes, i.e., group belonging.
Fairness and explainability are often intertwined in the literature due to the assumption that transparency, through explainability methods, makes it possible to identify which models are right for the right reasons or, on the contrary, right by relying on spurious, potentially harmful, patterns Langer et al. (2021); Balkir et al. (2022). This study tightens the connection between fairness and explainability, investigating whether model rationales align better with those of some groups rather than others. If so, this would indicate that models can be more robust for some groups rather than others, even in the face of performance parity on dedicated evaluation data. That is: We ask whether models are equally right for the right reasons (with the promise of generalization) across demographic groups.
3 Data
We augment a subset of data from three publicly available datasets spanning two tasks: DynaSent Potts et al. (2020) and SST Socher et al. (2013)444We work with its binary version, SST-2., for sentiment classification and CoS-E Talmor et al. (2019); Rajani et al. (2019) for common-sense reasoning.555We use the simplified version of CoS-E released by DeYoung et al. (2019). For each dataset, we crowd-source annotations for a subset of the data. We instruct annotators to select a label and provide their rationale for their choice by highlighting supporting words in the given sentence or question. Table 1 shows statistics of the annotations collected. Annotation guidelines are explained in § 3.1 (and included in full in Appendix A) and recruitment procedures are explained in § 3.2.
| Annotators | Annotations | ||
| Group | Total | Total | |
| DynaSent | 48 | 288 | 2,880 |
| SST-2 | 26 | 156 | 1,578 |
| CoS-E | 50 | 300 | 3,000 |
| Total | 124 | 744 | 7,458 |
| Before excl.* | - | 929 | 9,310 |
3.1 Annotation Process
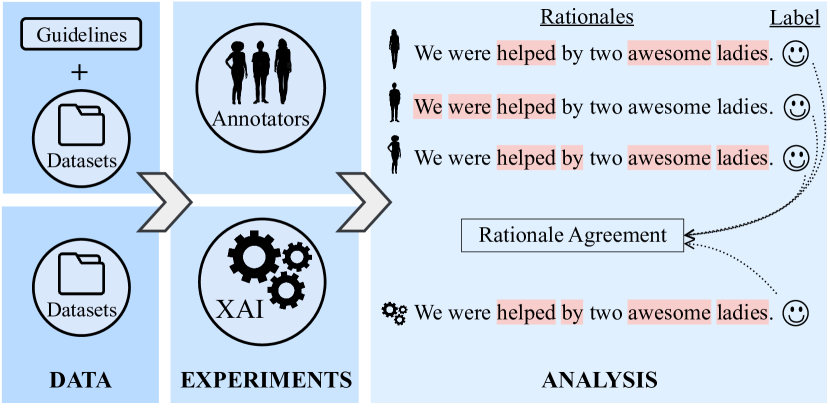
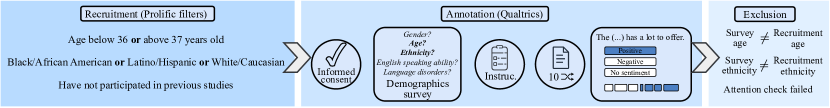
We summarize the process of collecting annotations in Figure 2, where we depict a three-step process: recruitment, annotation and exclusion. In this section, we start by describing the second step – annotation – and explain what is annotated and how it is annotated. We describe our recruitment and exclusion criteria in the following section, 3.2.
Annotators are directed to a Qualtrics666https://www.qualtrics.com survey and presented with i) a consent form, ii) a short survey on demographics, iii) instructions for their annotation task and lastly, iv) a randomly selected set of instances to annotate, out of a subset of size . As a result of this procedure, each group, for each dataset, is represented by approximately annotators. Data points are annotated for both classification labels and extractive rationales, i.e., input words that motivate the classification.
Existing rationale datasets are typically constructed by giving annotators ‘gold standard’ labels, and having them provide rationales for these labels. Instead, we let annotators provide rationales for labels they choose themselves. This lets them engage in the decision process, but it also acknowledges that annotators with different backgrounds may disagree on classification decisions. Explaining other people’s choices is error-prone Barasz and Kim (2022), and we do not want to bias the rationale annotations by providing labels that align better with the intuitions of some demographics than with those of others. For the sentiment analysis datasets, we discard neutral instances because rationale annotation for neutral instances is ill-defined. Yet, we still allow annotators to evaluate a sentence as neutral, since we do not want to force our annotators to provide rationales for positive and negative sentiment that they do not see.
DynaSent
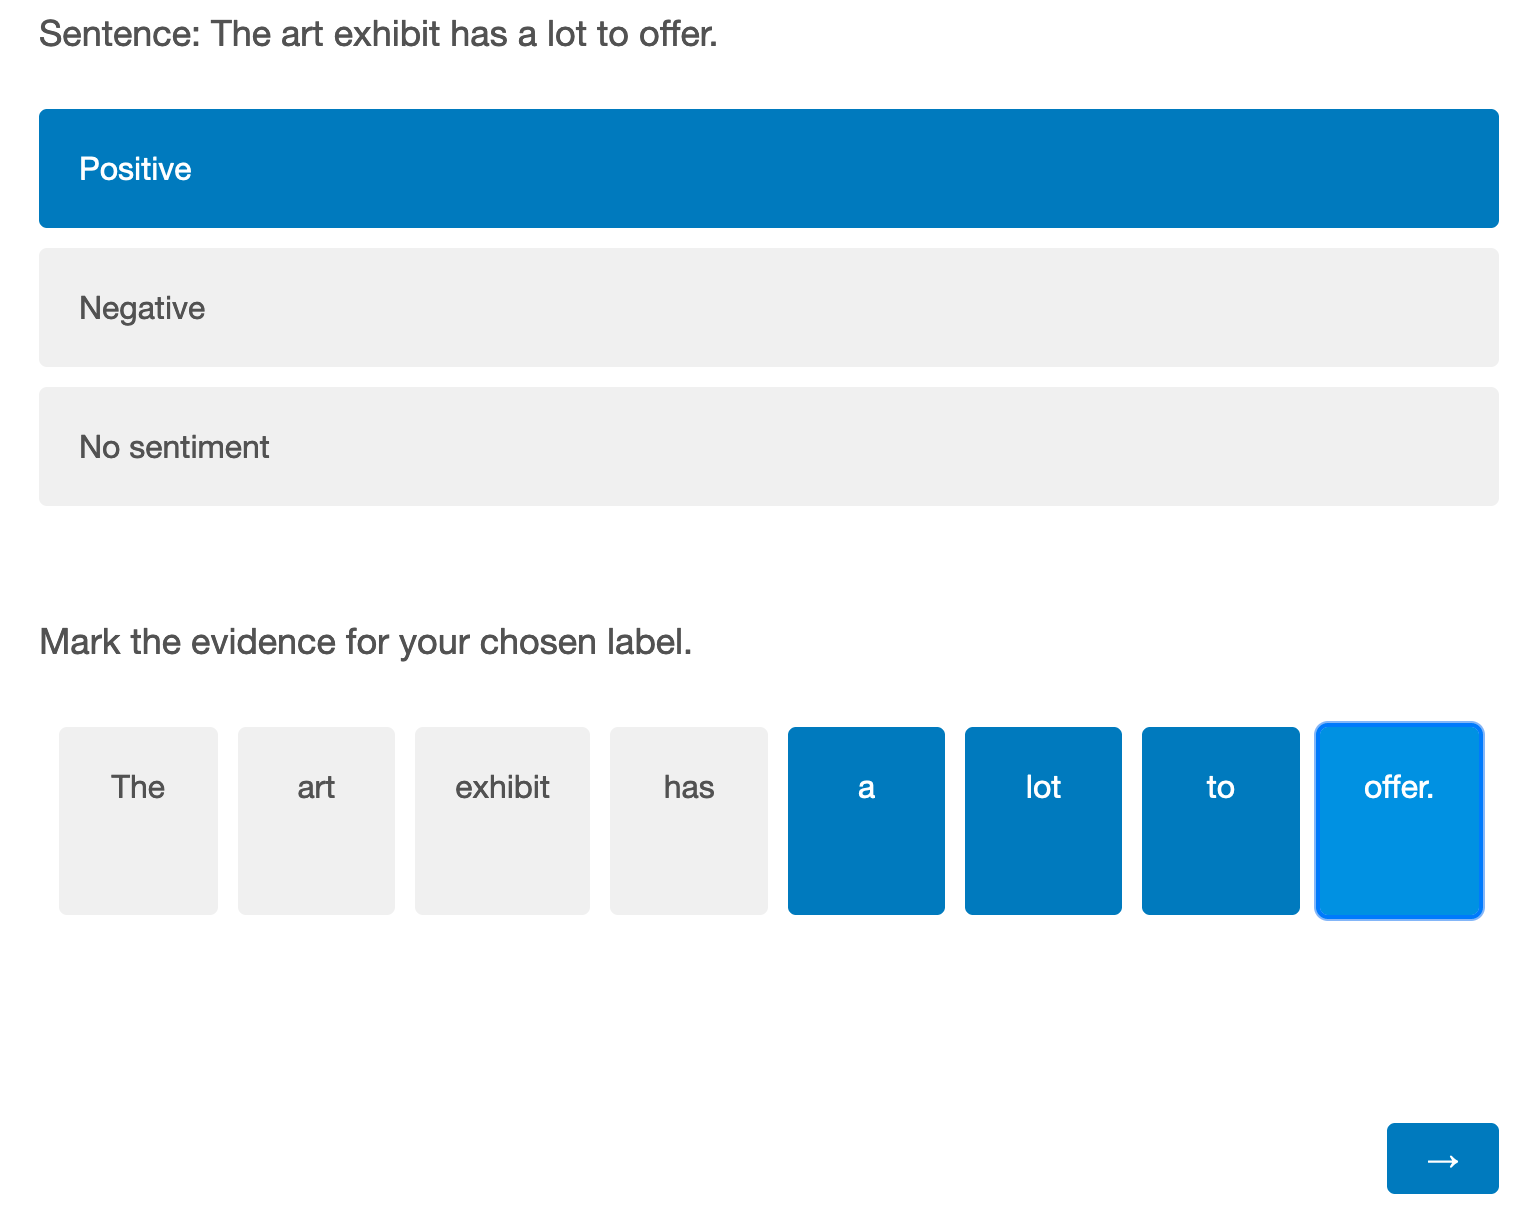
We re-annotate instances six times (for six demographic groups), comprising 240 instances labeled as positive, and 240 instances labeled as negative in the DynaSent Round 2 test set (see Potts et al. (2020)). This amounts to 2,880 annotations, in total. Our sentiment label annotation follows the instructions of Potts et al. (2020). To annotate rationales, we formulate the task as marking “supporting evidence” for the label, following how the task is defined by DeYoung et al. (2019). Specifically, we ask annotators to mark all the words, in the sentence, they think shows evidence for their chosen label.
SST-2
We re-annotate instances six times (for six demographic groups), which are all the positive and negative instances from the Zuco dataset of Hollenstein et al. (2018)777The Zuco data contains eye-tracking data for 400 instances from SST. By annotating some of these with rationales, we add an extra layer of information for future research. Note that there is a typo in Hollenstein et al. (2018). There is 263 positive and negative instances (not 277)., comprising a mixture of train, validation and test set instances from SST-2, which we remove from the original data before training the models. Instructions for sentiment annotations build on the instructions by Potts et al., combined with a few examples from Zaidan et al. (2007). The instructions for annotating rationales are the same as for DynaSent.
CoS-E
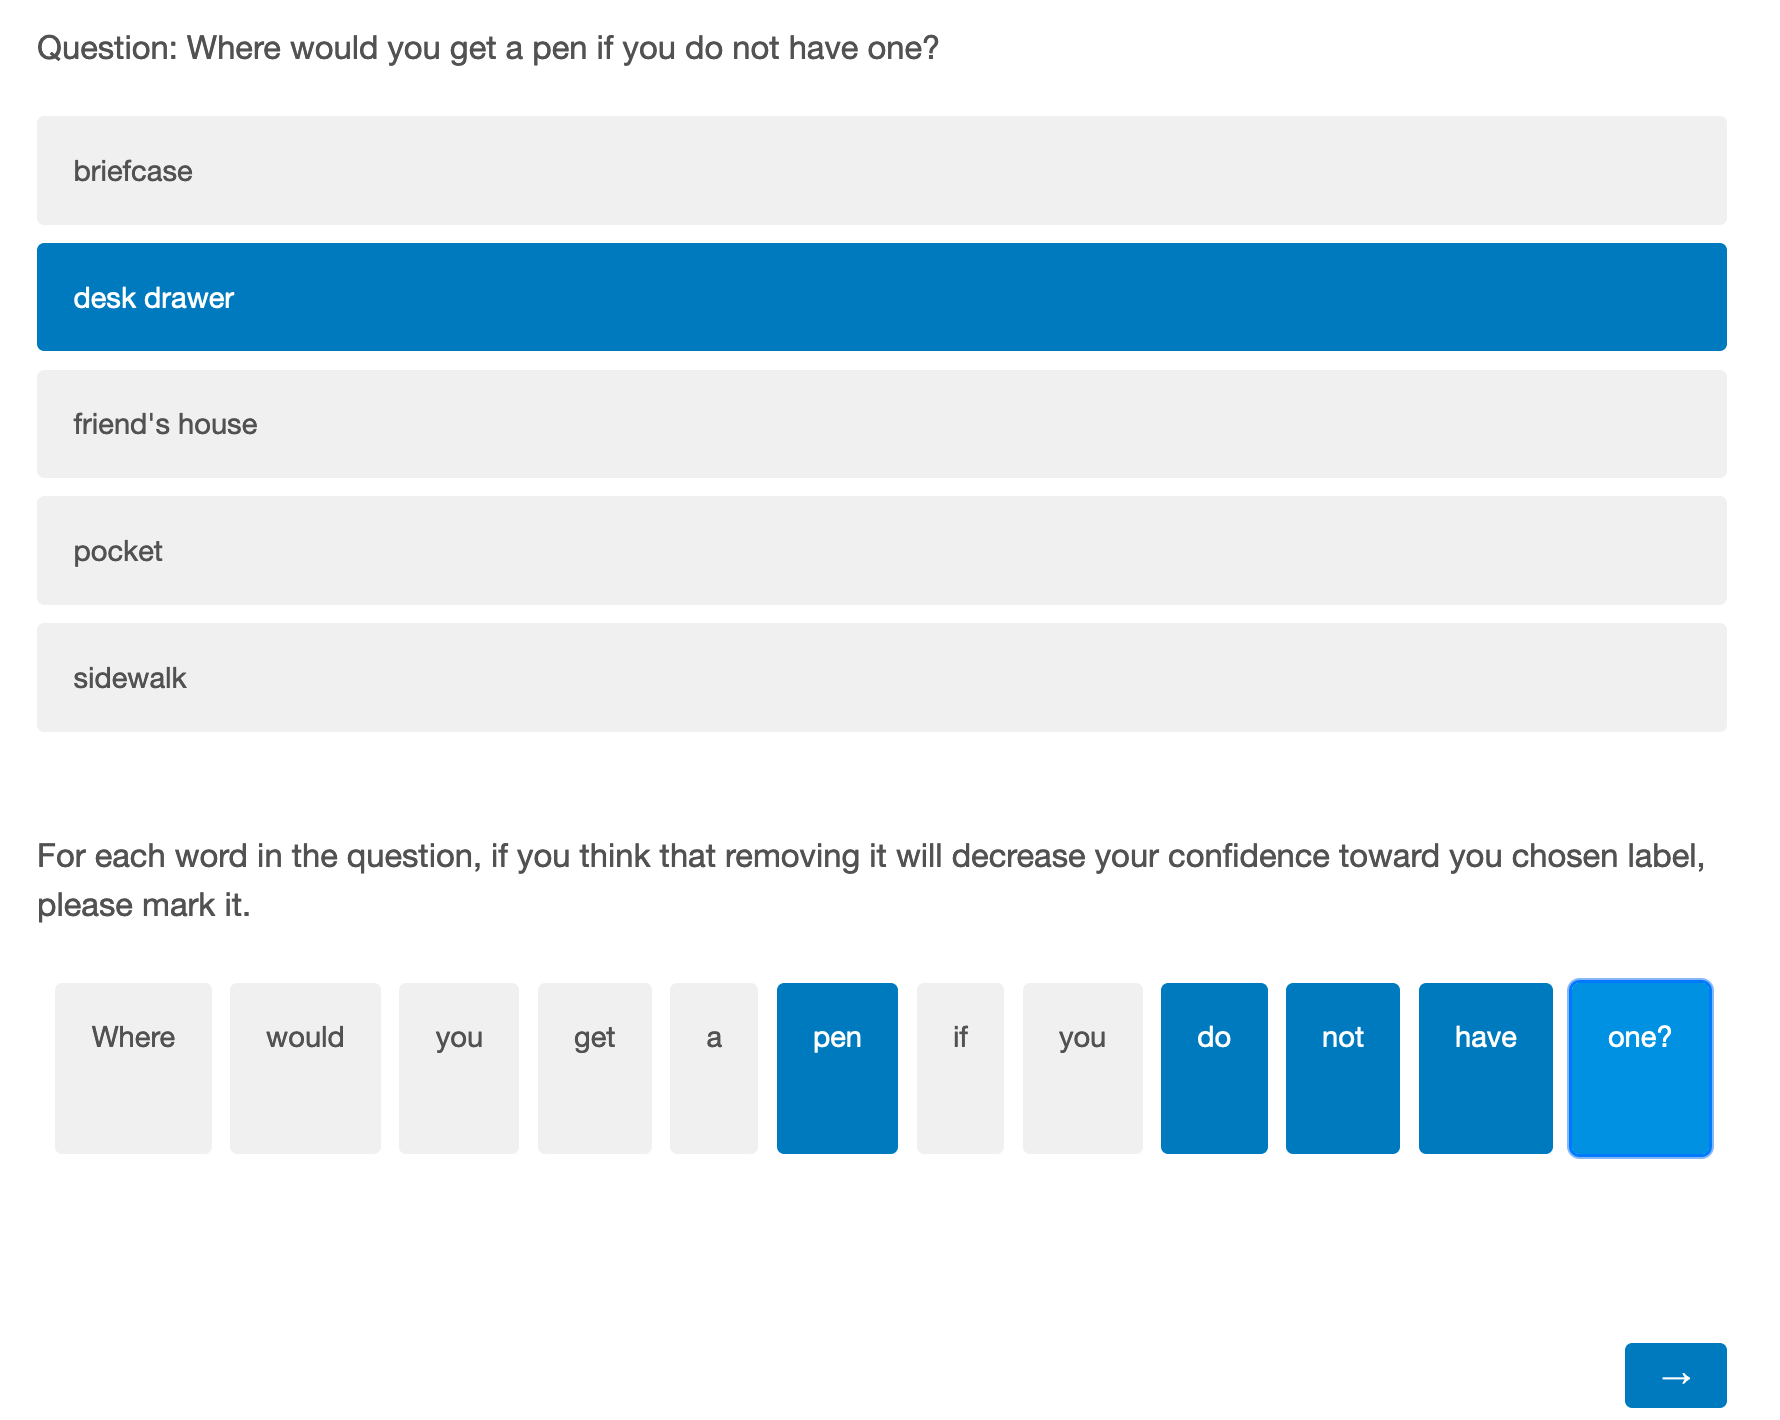
We re-annotate instances from the test set six times (for six demographic groups) and ask annotators to firstly select the answer to the question that they find most correct and sensible, and then mark words that justifies that answer. Following Chiang and Lee (2022), we specify the rationale task with a wording that should guide annotators to make short, precise rationale annotations:
‘For each word in the question, if you think that removing it will decrease your confidence toward your chosen label, please mark it.’
3.2 Annotator Population
We recruited annotators via Prolific based on two main criteria, age and ethnicity, previously identified as related to unfair performance differences of NLP systems Hovy and Søgaard (2015); Jørgensen et al. (2016); Sap et al. (2019); Zhang et al. (2021).
Recruitment
In our study, there is a trade-off between collecting annotations for a diverse set of data instances (number of tasks and sentences) and for a diverse set of annotators (balanced by demographic attributes), while keeping the study affordable and payment fair. Hence, when we want to study differences between individuals with different ethnic backgrounds, we can only study a subset of possible ethnic identities (of which there are many categories and diverging definitions). We balanced the number of annotators across three ethnic groups — Black/African American (B), Latino/Hispanic (L) and White/Caucasian (W) — and two age groups —below 36 (young, Y) and above 37 (old, O), excluding both — whose cross-product results in six sub-groups: {BO, BY, LO, LY, WO, WY}. We leave a two-year gap between the age groups in order to not compare individuals with very similar ages. Furthermore, the age thresholds are inspired by related studies of age differences in NLP-tasks and common practices in distinguishing groups with an age gap Johannsen et al. (2015); Hovy and Søgaard (2015) and around the middle ages Zhang et al. (2021). Our threshold also serves to guarantee sufficient proportions of available crowdworkers in each group. Our ethnicity definition follows that of Prolific, which features in a question workers have previously responded to and hence are recruited by, defining ethnicity as:
‘[a] feeling of belonging and attachment to a distinct group of a larger population that shares their ancestry, colour, language or religion’
While we do not require all annotators to be fluent in English, we instead ask about their English-speaking abilities in the demographics survey and find that 75% of the participants speak English “very well” and only 1% “not well”, and the remaining “well”.
Exclusions
Annotators who participated in annotating one task were excluded from participating in others. After annotation, we manually check whether a participant’s answers to our short demographics survey correspond to their recruitment criteria. We found many discrepancies between recruitment ethnicity and reported ethnicity, especially for Latino/Hispanic individuals, who often report to identify as White/Caucasian. This highlights the difficulty of studying ethnicities as distinct, separate groups, as it is common to identify with more than one ethnicity888General Social Survey as well as US Census allow respondents to report multiple ethnicities for this reason. See, e.g., a GSS 2001 report commenting on multi-ethnicity: shorturl.at/BCP49.. Hence, the mismatches are not necessarily errors. For our experiments, we decided to exclude participants with such mismatches and recruit new participants to replace their responses (see Appendix B for further details). A smaller amount of participants were excluded due to mismatch in reported age or due to failing a simple attention check. We release annotations both with and without the instances excluded from our analyses. The final data after pre-processing consist of one annotation per instance for each of the six groups, i.e., six annotations per instance in total. Annotators annotated (approximately) 10 instances each. All participants were paid equally.
4 Experiments
We first conduct an analysis of group-group label agreement (i.e., comparing human annotator groups with each other, measuring human agreement on the sentiment and answer labels) and rationale agreement (measuring human agreement on rationale annotations) to characterize inter-group differences. We then move to group-model agreement (comparing the labels and rationales of our annotator groups to model predictions and model rationales) and ask: Do models’ explanations align better with certain demographic groups compared to others? In our analysis, we further focus on how rationale agreement and fairness behave depending on model size and model distillation.
We probe 16 Transformer-based models999All pretrained models can be downloaded at huggingface.co/models.. To ease readability, we will use abbreviations following their original naming when depicting models’ performance101010{abv2: albert-base-v2, alv2: albert-large-v2, mlm-l6: MiniLM-L6-H384-uncased, mlm-l12: MiniLM-L12-H384-uncased, axlv2: albert-xlarge-v2, dbu: distilbert-base-uncased, dr: distilroberta-base, bbu: bert-base-uncased, rb: roberta-base, mrb: muppet-roberta-base, dv3b: deberta-v3-base, axxlv2: albert-xxlarge-v2, blu: bert-large-uncased, rl: roberta-large, mrl: muppet-roberta-large, dv3l: microsoft/deberta-v3-large}.
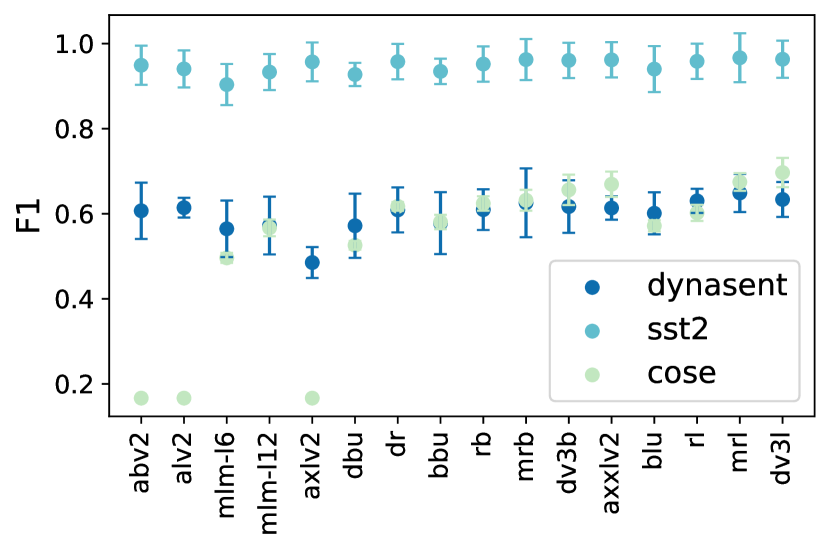
We fine-tune the models individually on each dataset (see Figure 3). SST-2 and CoS-E simplified111111CoS-E simplified represents each of the original questions into five question-answer pairs, one per potential answer, and label them as True (the right question-answer pair) or False. are modeled as binary classification tasks; DynaSent is modeled as a ternary (positive/negative/neutral) sentiment analysis task. We exclude all annotated instances from the training splits; for CoS-E, we downsample the negative examples to balance both classes in the training split. After fine-tuning for 3 epochs, we select the checkpoint with the highest validation accuracy to run on our test (annotated) splits and apply two explainability methods to obtain input-based explanations, i.e., rationales, for the predictions made.
We measure label agreement with appropriate variants of F1 (SST-2 binary-F1; DynaSent macro-F1; CoS-E mean of binary-F1 towards the negative and the positive class). CoS-E simplified represents a slightly different task (see footnote 11) from what the annotators were presented to solve (a multi-class question-answering task). To correctly measure label agreement, we evaluate whether a model predicts ‘True’ for the question-answer pair with the answer selected by the annotator. Therefore, to avoid misleading F1 scores if, for example, a model predominantly predict True, we report the mean of the F1 towards each class. We explain below how we measure rationale agreement.
Explainability methods
We analyze models’ predictions through two families of post-hoc, attribution-based121212The methods are applied at inference time and provide explanations locally, i.e., for each individual instance, indicating the relative importance of each input token through a score distribution. explainability methods: Attention Rollout (AR) Abnar and Zuidema (2020) and Layer-wise Relevance Propagation (LRP) Bach et al. (2015), a gradient-based method. Ali et al. (2022) compare these methods, showing how their predicted rationales are frequently uncorrelated. Both AR and LRP thus provide token level rationales for a given input, but while AR approximates the relative importance of input tokens by accumulating attention, LRP does so by backpropagating ‘relevance’ from the output layer to the input, leading to sparser attribution scores. We rely on the rules proposed in Ali et al. (2022), an extension of the original LRP method Bach et al. (2015); Arras et al. (2017) for Transformers, aiming to uphold the conservation property of LRP in Transformers as well. This extension relies on an “implementation trick”, whereby the magnitude of any output remains intact during backpropagation of the gradients of the model.
Comparing rationales
Attention-based and gradient-based methods do not provide categorical relevance of the input tokens, but a vector with continuous values for each input sentence . We translate into a binary vector following the procedure from Wang et al. (2022) for each group. We define the top- tokens as rationales, where is the product of the current sentence length (tokens) and the average rationale length ratio (RLR) of a group within a dataset . On average, RLR for SST-2 are shorter (29.6%) compared to DynaSent (31.9%) and CoS-E (33.0%) (see Appendix B for specific values). Models’ outputs are also preprocessed to normalize different tokenizations and to match the input format given to annotators.
After aligning explanations from models and annotators in the same space, we can compare them. We employ two metrics specifically designed to evaluate discrete rationales: token-level () (Equation 1) DeYoung et al. (2019); Wang et al. (2022), and Intersection-Over-Union () (Equation 3) as presented in DeYoung et al. (2019). These metrics are flexible enough to overcome the strictness of exact matching.131313Formally, (1) where and are the precision and recall for the instance, computed by considering the overlapped tokens between models’ and annotators’ rationales. To measure Intersection-Over-Union, we define the categorical vector given by the annotators for each sample as . Thereby, (2) and (3) These metrics account for plausibility DeYoung et al. (2019) of the models’ rationales, i.e., the degree to which they are agreeable to humans, as well as the extent to which models are ‘right for the right reasons’ McCoy et al. (2019). Since we are interested in comparing rationale alignment between groups and between groups and models, measuring plausability is our go-to. Other research Jacovi and Goldberg (2020); Setzu et al. (2021) focus on properties like faithfulness, which reflect a model’s true decision process, i.e., whether the provided rationale influenced the corresponding decision, generally measured through perturbation experiments.
5 Results and Discussion
Figure 3 shows group-model label agreement over our annotated data.141414See Figure 12 in Appendix C for a detailed representation of group-model label agreement. Error bars show the variability between best and worst performing groups. CoS-E exhibits the lowest variability, indicating less variability in label agreement between groups.
When annotators disagree on the label of an instance, it is to be expected that their rationales will subsequently be different. Therefore, to compare group-group (§ 5.1) and group-model (§ 5.2) rationales more fairly, we focus on the subset of instances where all groups are in agreement about the label, i.e., instances with full label agreement. This amounts to 209, 152 and 161 instances for DynaSent, SST-2 and CoS-E, respectively.
5.1 Analysis of Group-Group Agreement
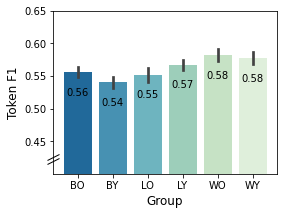
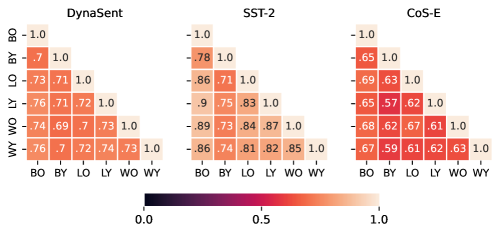
We first want to quantify how different the rationales of one group are to those of others, and more generally to a random population. We compare each groups’ set of rationales to a random paired set of rationales, where the rationale of each instance is randomly picked from one of the five other groups. Figure 4 shows the overall agreement score, average across datasets, and its standard deviation from 20 random seeds, i.e., 20 random combinations of paired rationales. We observe that rationales of White annotators (WO, WY) are on average more similar to others while the average difference with the rationales of minority groups like, for example, Black Young (BY), is greater.
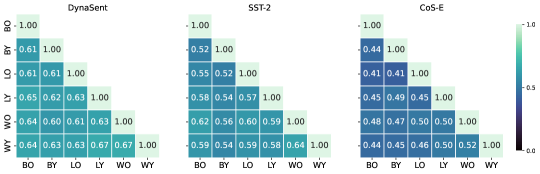
We then compute the level of rationale agreement () between all groups (heatmaps on Figure 4) and observe that, in general, differences in group-group rationale agreement are consistent across datasets (tasks): Black Youngs (BY) have lower alignment with others, especially in sentiment analysis tasks. While the definition of rationales for DynaSent seems to be easier (higher values of agreement), it seems to be harder (lower values of agreement) for CoS-E, even when the label is agreed upon. We hypothesize this is due to the complexity of the CoS-E task itself, which also leads to more lengthy rationales, as reflected by the average RLR reported on § 4, probably in the absence of a clear motivation for the selected answer.
The definition of what is common-sense varies across cultures and it is related to a person’s background Hershcovich et al. (2022), which makes CoS-E a highly subjective task151515This is specially notorious on the query type people.. Take for example the question ‘Where would you find people standing in a line outside?’ with these potential answers: ‘bus depot’, ‘end of line’, ‘opera’, ‘neighbor’s house’ and ‘meeting’. Even if there is agreement on the correct choice as ‘bus depot’, the rationale behind it could easily differ amongst people, i.e., it could be due to ‘people standing’, or the fact that they are standing in ‘a line outside’, or all together.
5.2 Analysis of Group-Model Agreement
Now that we have analyzed group-group agreement, we measure the alignment between groups’ rationales and models’ rationales. We analyze predictions from 16 Transformer-based models and employ AR and LRP to extract model rationales. Methods for comparing rationales and measuring group-model agreement are explained in Section 4.
Socio-demographic fairness
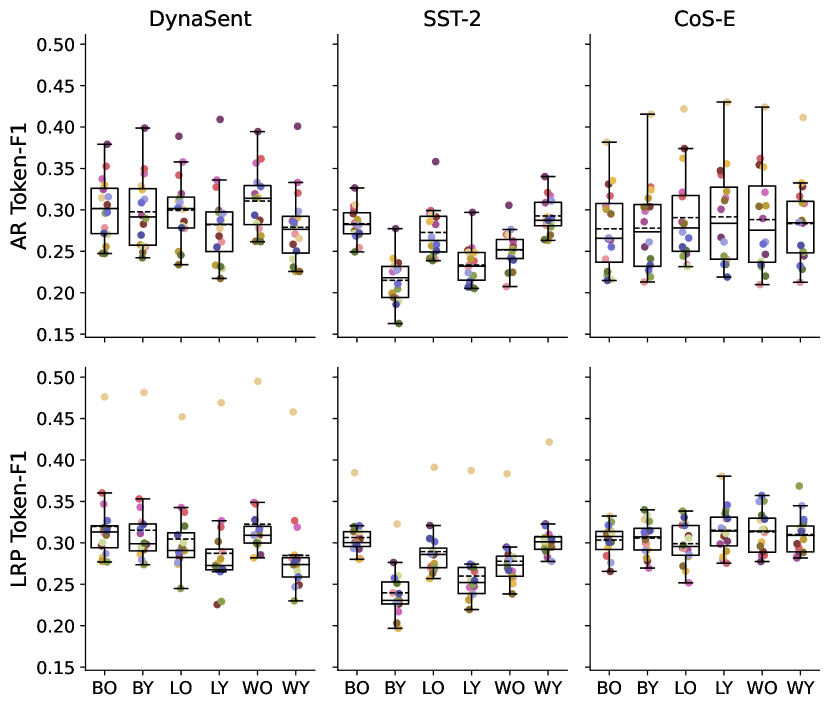
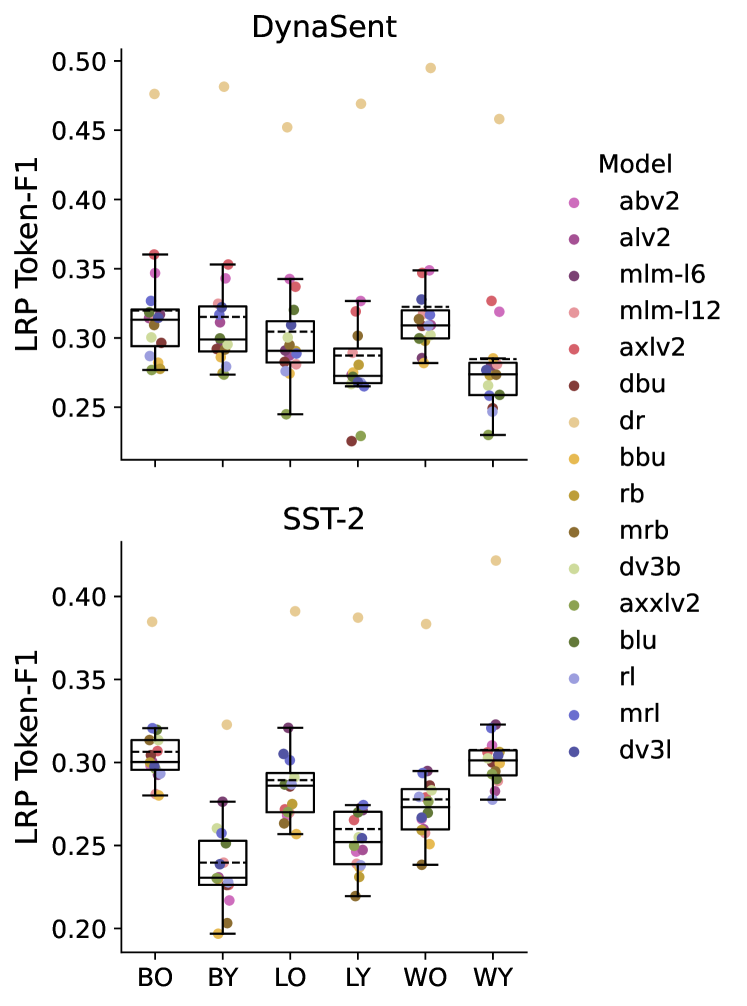
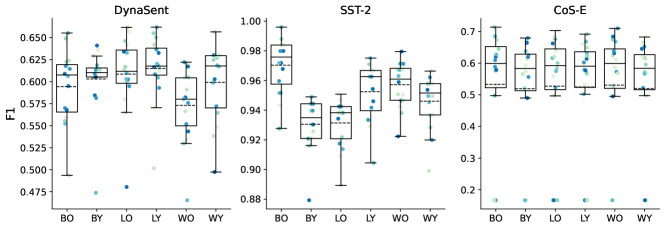
Figure 5 shows a systematic pattern of model rationales aligning better with the rationales of older annotators in each ethnic group (BO, LO, WO) on the sentiment datasets. The only exception is White Young (WY) annotators in SST-2, whose median is higher than their older counterpart. We argue this is due, in part, to the data source of the tasks themselves. While DynaSent constitutes an ensemble of diverse customer reviews, SST is based on movie review excerpts from Rotten Tomatoes with a more informal language, popular amongst younger users. Findings from Johannsen et al. (2015) and Hovy and Søgaard (2015) indicate that there exist grammatical differences between age groups. Johannsen et al. (2015) further showed several age and gender-specific syntactic patterns that hold even across languages. This would explain not only the noticeable group-group differences when marking supporting evidence (lexical structures) for their answers, but also the agreement disparity reflected by models fine-tuned on potentially age-biased data.
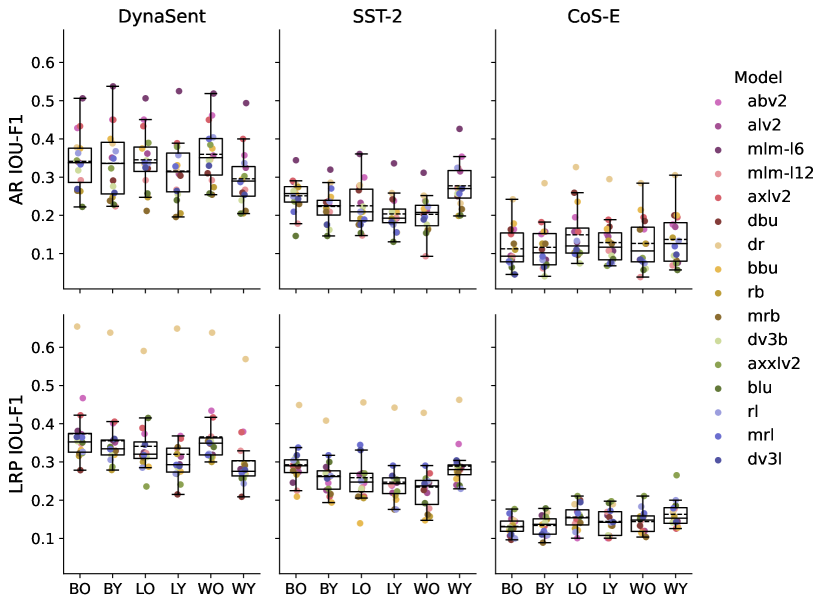
Results are consistent with previous findings of Zhang et al. (2021), who show a variety of language models aligning better with older, white annotators, and worse with minority groups, in word prediction tasks. We observe that group-model rationale agreement does not correlate with group-model class agreement, i.e., when a model performs well for a particular group, it does not necessarily entail that its rationales, or learned patterns, align. Group-model rationale agreement evaluated with Attention Rollout and CoS-E are shown in Figure 13 in Appendix C, along with results using the complementary metric (). The patterns derived from them are in line with those in Figure 5: AR shows similar behaviours as LRP, but leads to larger variation between models. However CoS-E, which, as explained, is a very different task, does not seem to exhibit big group differences. This is also noticeable in Figure 6, where error bars show the distance between groups with the highest and lowest level of agreement in every model.
The role of model size
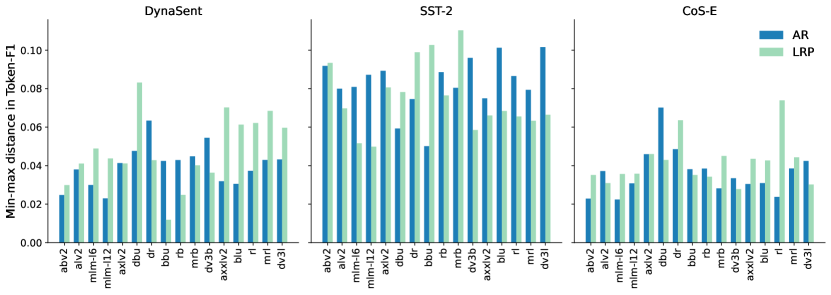
In general, larger language models seem to perform better on NLP tasks. In our setting, Figure 3 shows a positive trend with model size: larger models achieve, in general, higher performance. Could it be the case that larger language models also show higher rationale agreement? And, are they consequently more fair? We evaluate fairness in terms of performance parity: min-max difference between the group with the lowest and highest (per model). Relying on min-max difference captures the widely shared intuition that fairness is always in the service of the worst off group Rawls (1971).
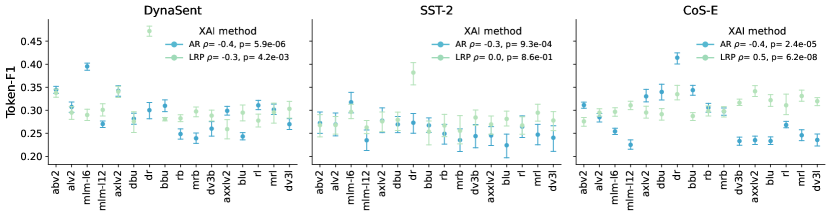
Contrary to our expectations, Figure 6 shows how scores actually decrease with model size – with CoS-E model rationales from LRP being the only exception to the trend. We report Spearman correlation values for each dataset and explainability method: The negative correlation between and model size is significant in all three datasets with AR, but only in DynaSent with LRP. The positive correlation in CoS-E with LRP rationales is also significant.
When we zoom in on the min-max gaps (error bars on Figure 6)161616See Figure 14 in Appendix C.2 for a plot of the gaps themselves., we find that performance gaps are uncorrelated with model size. Therefore, there is no evidence that larger models are more fair, i.e., rationale alignment does not become more equal for demographic groups. In the context of toxicity classification, work from Baldini et al. (2021) also hints that size is not well correlated with fairness of models.
Do distilled models align better?
Knowledge distillation has been proven to be effective in model compression while maintaining model performance Gou et al. (2021). But can it also be effective in improving NLP fairness? Xu and Hu (2022) find a consistent pattern of toxicity and bias reduction after model distillation. Chai et al. (2022) show promising results when approaching fairness without demographics through knowledge distillation. Tan et al. (2018) discuss the benefits of applying knowledge distillation to leverage model interpretability. Motivated by these findings, we take results from LRP to look closer into group-model rationale agreement for distilled models, which we show in Table 2. We find overall higher rationale agreement for distilled models. However, there is no evidence that distilled models are also more fair: Only minilm-l6-h384-uncased has a smaller performance gap between the best and worst-off group for both metrics compared to the average.
| () | () | min-max () | min-max () | |
| minilm-l6-h384-unc. | .31 | .28 | .045 | .068 |
| minilm-l12-h384-unc. | .27 | .21 | .045 | .083 |
| distilbert-base-unc. | .29 | .24 | .064 | .100 |
| distilroberta-base | .36 | .36 | .065 | .069 |
| Avg. (16 models) | .29 | .24 | .054 | .081 |
6 Conclusion
In this paper, we present a new collection of three existing datasets with demographics-augmented annotations, balanced across age and ethnicity. By having annotators choose the right label and marking supporting evidence for their choice, we find that what counts as a rationale differs depending on peoples’ socio-demographic backgrounds.
Through a series of experiments with 16 popular model architectures and two families of explainability methods, we show that model rationales align better with older individuals, especially on sentiment classification. We look closer at model size and the influence of distilled pretraining: despite the fact that larger models perform better in general NLP tasks, we find negative correlations between model size and rationale agreement. Furthermore, from the point of view of performance parity, we find no evidence that increasing model size improves fairness. Likewise, distilled models do not seem to be more fair in terms of rationale agreement, however they do present overall higher scores.
This work indicates the presence of undesired biases that do not necessarily surface in task performance. We believe this provides an important addendum to the fairness literature: Even if models are fair in terms of predictive performance, they may still exhibit biases that can only be revealed by considering model rationales. If models are equally right, but only right for the right reasons in the eyes of some groups rather than others, they will likely be less robust for the latter groups.
Limitations
Our analysis is limited to non-autoregressive Transformer-based models, fine-tuned with the same set of hyperparameters. Hyperparameter optimization would undoubtedly lead to better performance for some models, but we fine-tuned each model with standard hyperparameter values for solving sentiment analysis tasks DeYoung et al. (2019) to reduce resource consumption. This should not affect the conclusions drawn from our experiments.
Comparing human rationales and rationales extracted with interpretability methods such as Attention Rollout and LRP is not straightforward. Overall agreement scores depend on how model rationales are converted into categorical values (top-). See Jørgensen et al. (2022) for discussion.
Acknowledgments
Many thanks to Stephanie Brandl, David Dreyer Lassen, Frederik Hjort, Emily Pitler and David Jurgens for their insightful comments.
This work was supported by the Novo Nordisk Foundation.
Ethics Statement
Broader impact
Although explainability and fairness are broadly viewed as intertwined subjects, very little work has studied the two concepts together (Feng and Boyd-Graber, 2019; González et al., 2021; Ruder et al., 2022). This study is a first of its kind to examine fairness issues of explainability methods and to publish human rationales with diverse socio-demographic information. We hope this work will impact the NLP research community towards more data-aware and multi-dimensional investigations of models and methods, and towards further studies of biases in NLP.
Personal and sensitive data
This study deals with personal and sensitive information. The responses are anonymous and cannot be used to identify any individual.
Informed consent
The participants were informed of the study’s overall aim, the procedure and confidentiality of their responses. With this information, the participants consented to the use and sharing of their responses.
Potential risks
We do not anticipate any risks of participation in the study, yet we do note a recent awareness of poor working conditions among crowdworkers for AI data labeling in some countries (Williams et al., 2022). The recruitment platform Prolific, used in this study, is targeted towards research (rather than AI development) and has stricter rules on participant screening and minimum wages (Palan and Schitter, 2017), compared to other popular platforms, which we hope reduce the risk of such poor working conditions.
Remuneration
The participants were paid an average of £/hour ($/hour).
Intended use
The collected annotations and demographic information will be publicly available to be used for research purposes only.
References
- Abnar and Zuidema (2020) Samira Abnar and Willem Zuidema. 2020. Quantifying attention flow in transformers. In Proceedings of the 58th Annual Meeting of the Association for Computational Linguistics, pages 4190–4197, Online. Association for Computational Linguistics.
- Ali et al. (2022) Ameen Ali, Thomas Schnake, Oliver Eberle, Grégoire Montavon, Klaus-Robert Müller, and Lior Wolf. 2022. Xai for transformers: Better explanations through conservative propagation.
- Arras et al. (2017) Leila Arras, Grégoire Montavon, Klaus-Robert Müller, and Wojciech Samek. 2017. Explaining recurrent neural network predictions in sentiment analysis. In Proceedings of the 8th Workshop on Computational Approaches to Subjectivity, Sentiment and Social Media Analysis, pages 159–168, Copenhagen, Denmark. Association for Computational Linguistics.
- Bach et al. (2015) Sebastian Bach, Alexander Binder, Grégoire Montavon, Frederick Klauschen, Klaus-Robert Müller, and Wojciech Samek. 2015. On pixel-wise explanations for non-linear classifier decisions by layer-wise relevance propagation. PLOS ONE, 10(7):1–46.
- Baldini et al. (2021) Ioana Baldini, Dennis Wei, Karthikeyan Natesan Ramamurthy, Mikhail Yurochkin, and Moninder Singh. 2021. Your fairness may vary: Pretrained language model fairness in toxic text classification.
- Balkir et al. (2022) Esma Balkir, Svetlana Kiritchenko, Isar Nejadgholi, and Kathleen Fraser. 2022. Challenges in applying explainability methods to improve the fairness of NLP models. In Proceedings of the 2nd Workshop on Trustworthy Natural Language Processing (TrustNLP 2022), pages 80–92, Seattle, U.S.A. Association for Computational Linguistics.
- Barasz and Kim (2022) Kate Barasz and Tami Kim. 2022. Choice perception: Making sense (and nonsense) of others’ decisions. Current opinion in psychology, 43:176–181.
- Baum et al. (2022) Kevin Baum, Susanne Mantel, Timo Speith, and Eva Schmidt. 2022. From responsibility to reason-giving explainable artificial intelligence. Philosophy and Technology, 35(1):1–30.
- Beigman Klebanov and Beigman (2009) Beata Beigman Klebanov and Eyal Beigman. 2009. Squibs: From annotator agreement to noise models. Computational Linguistics, 35(4):495–503.
- Beisbart and Räz (2022) Claus Beisbart and Tim Räz. 2022. Philosophy of science at sea: Clarifying the interpretability of machine learning. Philosophy Compass, 17(6):e12830.
- Biswas et al. (2019) Arpita Biswas, Siddharth Barman, Amit Deshpande, and Amit Sharma. 2019. Quantifying infra-marginality and its trade-off with group fairness. CoRR, abs/1909.00982.
- Castelnovo et al. (2022) Alessandro Castelnovo, Riccardo Crupi, Greta Greco, Daniele Regoli, Ilaria Penco, and Andrea Cosentini. 2022. A clarification of the nuances in the fairness metrics landscape. Scientific Reports, 12.
- Chai et al. (2022) Junyi Chai, Taeuk Jang, and Xiaoqian Wang. 2022. Fairness without demographics through knowledge distillation. In Advances in Neural Information Processing Systems.
- Chalkidis et al. (2022) Ilias Chalkidis, Tommaso Pasini, Sheng Zhang, Letizia Tomada, Sebastian Schwemer, and Anders Søgaard. 2022. FairLex: A multilingual benchmark for evaluating fairness in legal text processing. In Proceedings of the 60th Annual Meeting of the Association for Computational Linguistics (Volume 1: Long Papers), pages 4389–4406, Dublin, Ireland. Association for Computational Linguistics.
- Chiang and Lee (2022) Cheng-Han Chiang and Hung-yi Lee. 2022. Re-examining human annotations for interpretable nlp.
- Corbett-Davies and Goel (2018) Sam Corbett-Davies and Sharad Goel. 2018. The measure and mismeasure of fairness: A critical review of fair machine learning. ArXiv, abs/1808.00023.
- DeYoung et al. (2019) Jay DeYoung, Sarthak Jain, Nazneen Fatema Rajani, Eric Lehman, Caiming Xiong, Richard Socher, and Byron C. Wallace. 2019. Eraser: A benchmark to evaluate rationalized nlp models.
- Ethayarajh and Jurafsky (2020) Kawin Ethayarajh and Dan Jurafsky. 2020. Utility is in the eye of the user: A critique of NLP leaderboards. In Proceedings of the 2020 Conference on Empirical Methods in Natural Language Processing (EMNLP), pages 4846–4853, Online. Association for Computational Linguistics.
- Feng and Boyd-Graber (2019) Shi Feng and Jordan Boyd-Graber. 2019. What can ai do for me? evaluating machine learning interpretations in cooperative play. In Proceedings of the 24th International Conference on Intelligent User Interfaces, IUI ’19, page 229–239, New York, NY, USA. Association for Computing Machinery.
- Friedler et al. (2021) Sorelle A. Friedler, Carlos Scheidegger, and Suresh Venkatasubramanian. 2021. The (im)possibility of fairness: Different value systems require different mechanisms for fair decision making. Commun. ACM, 64(4):136–143.
- González et al. (2021) Ana Valeria González, Anna Rogers, and Anders Søgaard. 2021. On the interaction of belief bias and explanations. In Findings of the Association for Computational Linguistics: ACL-IJCNLP 2021, pages 2930–2942, Online. Association for Computational Linguistics.
- Gou et al. (2021) Jianping Gou, Baosheng Yu, Stephen J. Maybank, and Dacheng Tao. 2021. Knowledge distillation: A survey. International Journal of Computer Vision, 129(6):1789–1819.
- Hacker and Passoth (2022) Philipp Hacker and Jan-Hendrik Passoth. 2022. Varieties of AI Explanations Under the Law. From the GDPR to the AIA, and Beyond, pages 343–373. Springer International Publishing, Cham.
- Hershcovich et al. (2022) Daniel Hershcovich, Stella Frank, Heather Lent, Miryam de Lhoneux, Mostafa Abdou, Stephanie Brandl, Emanuele Bugliarello, Laura Cabello Piqueras, Ilias Chalkidis, Ruixiang Cui, Constanza Fierro, Katerina Margatina, Phillip Rust, and Anders Søgaard. 2022. Challenges and strategies in cross-cultural NLP. In Proceedings of the 60th Annual Meeting of the Association for Computational Linguistics (Volume 1: Long Papers), pages 6997–7013, Dublin, Ireland. Association for Computational Linguistics.
- Hollenstein et al. (2018) Nora Hollenstein, Jonathan Rotsztejn, Marius Troendle, Andreas Pedroni, Ce Zhang, and Nicolas Langer. 2018. Zuco, a simultaneous eeg and eye-tracking resource for natural sentence reading. Scientific Data, 5.
- Hovy and Søgaard (2015) Dirk Hovy and Anders Søgaard. 2015. Tagging performance correlates with author age. In Proceedings of the 53rd Annual Meeting of the Association for Computational Linguistics and the 7th International Joint Conference on Natural Language Processing (Volume 2: Short Papers), pages 483–488, Beijing, China. Association for Computational Linguistics.
- Jacovi and Goldberg (2020) Alon Jacovi and Yoav Goldberg. 2020. Towards faithfully interpretable NLP systems: How should we define and evaluate faithfulness? In Proceedings of the 58th Annual Meeting of the Association for Computational Linguistics, pages 4198–4205, Online. Association for Computational Linguistics.
- Johannsen et al. (2015) Anders Johannsen, Dirk Hovy, and Anders Søgaard. 2015. Cross-lingual syntactic variation over age and gender. In Proceedings of the Nineteenth Conference on Computational Natural Language Learning, pages 103–112, Beijing, China. Association for Computational Linguistics.
- Jørgensen et al. (2016) Anna Jørgensen, Dirk Hovy, and Anders Søgaard. 2016. Learning a POS tagger for AAVE-like language. In Proceedings of the 2016 Conference of the North American Chapter of the Association for Computational Linguistics: Human Language Technologies, pages 1115–1120, San Diego, California. Association for Computational Linguistics.
- Jørgensen et al. (2022) Rasmus Kær Jørgensen, Fiammetta Caccavale, Christian Igel, and Anders Søgaard. 2022. Are multilingual sentiment models equally right for the right reasons? In EMNLP Workshop on Analyzing and Interpreting Neural Networks for NLP (BlackBoxNLP).
- Koh et al. (2020) Pang Wei Koh, Shiori Sagawa, Henrik Marklund, Sang Michael Xie, Marvin Zhang, Akshay Balsubramani, Weihua Hu, Michihiro Yasunaga, Richard Lanas Phillips, Sara Beery, Jure Leskovec, Anshul Kundaje, Emma Pierson, Sergey Levine, Chelsea Finn, and Percy Liang. 2020. Wilds: A benchmark of in-the-wild distribution shifts.
- Langer et al. (2021) Markus Langer, Daniel Oster, Timo Speith, Holger Hermanns, Lena Kästner, Eva Schmidt, Andreas Sesing, and Kevin Baum. 2021. What do we want from explainable artificial intelligence (xai)? - A stakeholder perspective on XAI and a conceptual model guiding interdisciplinary XAI research. Artif. Intell., 296:103473.
- Larson (2017) Brian Larson. 2017. Gender as a variable in natural-language processing: Ethical considerations. In Proceedings of the First ACL Workshop on Ethics in Natural Language Processing, pages 1–11, Valencia, Spain. Association for Computational Linguistics.
- Li et al. (2021) Mike Li, Hongseok Namkoong, and Shangzhou Xia. 2021. Evaluating model performance under worst-case subpopulations. In Advances in Neural Information Processing Systems, volume 34, pages 17325–17334, Vancouver, CA. Curran Associates, Inc.
- Mathew et al. (2021) Binny Mathew, Punyajoy Saha, Seid Muhie Yimam, Chris Biemann, Pawan Goyal, and Animesh Mukherjee. 2021. Hatexplain: A benchmark dataset for explainable hate speech detection. In Proceedings of the AAAI Conference on Artificial Intelligence 35(17), pages 14867–14875.
- McCoy et al. (2019) Tom McCoy, Ellie Pavlick, and Tal Linzen. 2019. Right for the wrong reasons: Diagnosing syntactic heuristics in natural language inference. In Proceedings of the 57th Annual Meeting of the Association for Computational Linguistics, pages 3428–3448, Florence, Italy. Association for Computational Linguistics.
- Páez (2019) Andrés Páez. 2019. The pragmatic turn in explainable artificial intelligence (xai). Minds and Machines, 29(3):441–459.
- Palan and Schitter (2017) Stefan Palan and Christian Schitter. 2017. Prolific.ac—a subject pool for online experiments. Journal of Behavioral and Experimental Finance, 17:22–27.
- Piantadosi and Hill (2022) Steven T. Piantadosi and Felix Hill. 2022. Meaning without reference in large language models.
- Plank (2022) Barbara Plank. 2022. The ’problem’ of human label variation: On ground truth in data, modeling and evaluation. ArXiv, abs/2211.02570.
- Plank et al. (2014) Barbara Plank, Dirk Hovy, and Anders Søgaard. 2014. Learning part-of-speech taggers with inter-annotator agreement loss. In Proceedings of the 14th Conference of the European Chapter of the Association for Computational Linguistics, pages 742–751, Gothenburg, Sweden. Association for Computational Linguistics.
- Potts et al. (2020) Christopher Potts, Zhengxuan Wu, Atticus Geiger, and Douwe Kiela. 2020. DynaSent: A dynamic benchmark for sentiment analysis. arXiv preprint arXiv:2012.15349.
- Rajani et al. (2019) Nazneen Fatema Rajani, Bryan McCann, Caiming Xiong, and Richard Socher. 2019. Explain yourself! leveraging language models for commonsense reasoning. In Proceedings of the 2019 Conference of the Association for Computational Linguistics (ACL2019).
- Rawls (1971) John Rawls. 1971. A Theory of Justice, 1 edition. Belknap Press of Harvard University Press, Cambridge, Massachussets.
- Ray Choudhury et al. (2022) Sagnik Ray Choudhury, Anna Rogers, and Isabelle Augenstein. 2022. Machine reading, fast and slow: When do models “understand” language? In Proceedings of the 29th International Conference on Computational Linguistics, pages 78–93, Gyeongju, Republic of Korea. International Committee on Computational Linguistics.
- Ruder et al. (2022) Sebastian Ruder, Ivan Vulić, and Anders Søgaard. 2022. Square one bias in NLP: Towards a multi-dimensional exploration of the research manifold. In Findings of the Association for Computational Linguistics: ACL 2022, pages 2340–2354, Dublin, Ireland. Association for Computational Linguistics.
- Sap et al. (2019) Maarten Sap, Dallas Card, Saadia Gabriel, Yejin Choi, and Noah A. Smith. 2019. The risk of racial bias in hate speech detection. In Proceedings of the 57th Annual Meeting of the Association for Computational Linguistics, pages 1668–1678, Florence, Italy. Association for Computational Linguistics.
- Setzu et al. (2021) Mattia Setzu, Riccardo Guidotti, Anna Monreale, Franco Turini, Dino Pedreschi, and Fosca Giannotti. 2021. Glocalx - from local to global explanations of black box ai models. Artificial Intelligence, 294:103457.
- Sharma et al. (2020) Amit Sharma, Arpita Biswas, and Siddharth Barman. 2020. Inframarginality audit of group-fairness. Symposium on the Foundations of Responsible Computing (FORC).
- Socher et al. (2013) Richard Socher, Alex Perelygin, Jean Wu, Jason Chuang, Christopher D Manning, Andrew Y Ng, and Christopher Potts. 2013. Recursive deep models for semantic compositionality over a sentiment treebank. In Proceedings of the 2013 conference on empirical methods in natural language processing, pages 1631–1642.
- Stanovich and West (2000) K. E. Stanovich and R. F. West. 2000. Individual differences in reasoning: Implications for the rationality debate? Behavioral and Brain Sciences, 23:645–665.
- Talmor et al. (2019) Alon Talmor, Jonathan Herzig, Nicholas Lourie, and Jonathan Berant. 2019. CommonsenseQA: A question answering challenge targeting commonsense knowledge. In Proceedings of the 2019 Conference of the North American Chapter of the Association for Computational Linguistics: Human Language Technologies, Volume 1 (Long and Short Papers), pages 4149–4158, Minneapolis, Minnesota. Association for Computational Linguistics.
- Tan et al. (2018) Sarah Tan, Rich Caruana, Giles Hooker, and Yin Lou. 2018. Distill-and-compare: Auditing black-box models using transparent model distillation. In Proceedings of the 2018 AAAI/ACM Conference on AI, Ethics, and Society, AIES ’18, page 303–310, New York, NY, USA. Association for Computing Machinery.
- Verma and Rubin (2018) Sahil Verma and Julia Rubin. 2018. Fairness definitions explained. In Proceedings of the International Workshop on Software Fairness, FairWare ’18, page 1–7, New York, NY, USA. Association for Computing Machinery.
- Vig et al. (2020) Jesse Vig, Sebastian Gehrmann, Yonatan Belinkov, Sharon Qian, Daniel Nevo, Yaron Singer, and Stuart Shieber. 2020. Investigating gender bias in language models using causal mediation analysis. In Advances in Neural Information Processing Systems, volume 33, pages 12388–12401, Vancouver, CA. Curran Associates, Inc.
- Wang et al. (2022) Lijie Wang, Yaozong Shen, Shu ping Peng, Shuai Zhang, Xinyan Xiao, Hao Liu, Hongxuan Tang, Ying Chen, Hua Wu, and Haifeng Wang. 2022. A fine-grained interpretability evaluation benchmark for neural nlp. ArXiv, abs/2205.11097.
- Williams et al. (2022) Adrienne Williams, Milagros Miceli, and Timnit Gebru. 2022. The exploited labor behind artificial intelligence.
- Williamson and Menon (2019) Robert Williamson and Aditya Menon. 2019. Fairness risk measures. In Proceedings of the 36th International Conference on Machine Learning, volume 97 of Proceedings of Machine Learning Research, pages 6786–6797, Long Beach, California. PMLR.
- Xu and Hu (2022) Guangxuan Xu and Qingyuan Hu. 2022. Can model compression improve nlp fairness.
- Zaidan et al. (2007) Omar Zaidan, Jason Eisner, and Christine Piatko. 2007. Using “annotator rationales” to improve machine learning for text categorization. In Human Language Technologies 2007: The Conference of the North American Chapter of the Association for Computational Linguistics; Proceedings of the Main Conference, pages 260–267, Rochester, New York. Association for Computational Linguistics.
- Zednik and Boelsen (2022) Carlos Zednik and Hannes Boelsen. 2022. Scientific exploration and explainable artificial intelligence. Minds Mach., 32(1):219–239.
- Zhang et al. (2021) Sheng Zhang, Xin Zhang, Weiming Zhang, and Anders Søgaard. 2021. Sociolectal analysis of pretrained language models. In Proceedings of the 2021 Conference on Empirical Methods in Natural Language Processing, pages 4581–4588, Online and Punta Cana, Dominican Republic. Association for Computational Linguistics.
Appendix A Annotation guidelines and task examples
On the next pages, we firstly show the annotation instructions given to annotators within the Qualtrics surveys. Full exports of the surveys are available in our GitHub repository.171717https://github.com/terne/Being_Right_for_Whose_Right_Reasons.
We created instructions specific for each dataset (DynaSent, SST-2, and CoS-E), leaning on prior work of annotating labels and rationales for these and similar datasets Potts et al. (2020); Zaidan et al. (2007); DeYoung et al. (2019), as described in the paper, section 3.1.
Figure 7, 8, and 9 shows the instructions for DynaSent, SST-2 and CoS-E, respectively, and Figure 10 shows an example of how an instance for the sentiment task and the common-sense reasoning task is annotated, i.e. how it looked from the perspective of the crowdworkers.
Annotating rationales for the common-sense reasoning task is somewhat more complex than annotating rationales for sentiment: while we can ask annotators to mark ‘evidence’ for a sentiment label – often resulting in marking words that are positively or negatively loaded – we cannot as simply ask for ‘evidence’ for a common-sense reasoning answer without risking some confusion. Take, for instance, the question “Where do you find the most amount of leafs?” with the answer being ‘Forest’, as shown in Figure 9. Here, the term ’evidence’ might be misunderstood as actual evidence for why there would be more leafs in the forest compared to a field – evidence which cannot be found within the question itself. We therefore re-phrase the rationale annotation instructions for CoS-E, following an example from Chiang and Lee (2022), and ask, “For each word in the question, if you think that removing it will decrease your confidence toward your chosen label, please mark it.” Furthermore, the subset of the CoS-E dataset, that we re-annotate, consists of the more ‘difficult’ split of the CommonsenseQA dataset Talmor et al. (2019); DeYoung et al. (2019). To make the task as clear as possible to the annotators, we explain, in the instructions, that the question and answer-options have been created by other crowdworkers who were instructed to create questions that could be “easily answered by humans without context, by the use of common-sense knowledge”, as is described by Talmor et al. (2019).
| Complete label agreement | |||||
| Dataset | N | Pos | Neg | Neutral | Total |
| DynaSent | 480 | 105 | 102 | 2 | 209 |
| SST | 263 | 79 | 73 | 0 | 152 |
| CoS-E | 500 | - | - | - | 161 |
Instructions
Please read these instructions carefully.
You will be shown 10 sentences from reviews of products and services. For each, your task is to choose from one of our three labels:
Positive: The sentence conveys information about the author’s positive evaluative sentiment.
Negative: The sentence conveys information about the author’s negative evaluative sentiment.
No sentiment: The sentence does not convey anything about the author’s positive or negative sentiment.
Here are some examples of the labels:
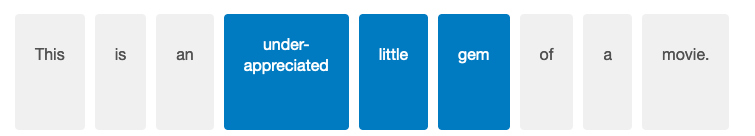
Sentence: This is an under-appreciated little gem of a movie.
(This is Positive because it expresses a positive overall opinion.)
Sentence: I asked for my steak medium-rare, and they delivered it perfectly!
(This is Positive because it puts a positive spin on an aspect of the author’s experience.)
Sentence: The screen on this device is a little too bright.
(This is Negative because it negatively evaluates an aspect of the product.)
Sentence: The book is 972 pages long.
(This is No sentiment because it describes a factual matter with not evaluative component.)
Sentence: The entrees are delicious, but the service is so bad that it’s not worth going.
(This is Negative because the negative statement outweighs the positive one.)
Sentence: The acting is great! The soundtrack is run-of-the mill, but the action more than makes up for it.
(This is Positive because the positive statements outweighs the negative.)
We further ask you to specify what snippets of text, in the sentence, you think acts as supporting evidence for your chosen label. The sentence will be shown to you as illustrated below, and your task is to mark (by clicking on them) all the words you think shows evidence for the sentiment label you chose.
Be aware that some sentences might be too long to fit on your screen. You therefore have to remember to scroll in order to see all the words that can be marked as evidence.
Click the forward button below when you are ready to start the task.
Instructions
Please read these instructions carefully.
You will be shown approximately 10 sentences from reviews of movies. For each, your task is to choose from one of our three labels:
Positive: The sentence conveys information about the author’s positive evaluative sentiment.
Negative: The sentence conveys information about the author’s negative evaluative sentiment.
No sentiment: The sentence does not convey anything about the author’s positive or negative sentiment.
Here are some examples of the labels:
Sentence: This is an under-appreciated little gem of a movie.
(This is Positive because it expresses a positive overall opinion.)
Sentence: he is one of the most exciting martial artists on the big screen, continuing to perform his own stunts and dazzling audiences with his flashy kicks and punches.
(This is Positive because it positively evaluates an aspect of the movie.)
Sentence: The acting is great! The soundtrack is run-of-the-mill, but the action more than makes up for it.
(This is Positive because the positive statements outweigh the negative.)
Sentence: The story is interesting but the movie is so badly put together that even the most casual viewer may notice the miserable pacing and stray plot threads.
(This is Negative because the negative statement outweighs the positive one.)
Sentence: A woman in peril. A confrontation. An explosion. The end. Yawn. Yawn. Yawn.
(This is Negative because it puts a negative spin on the author’s experience.)
Sentence: don’t go see this movie.
(This is Negative because it recommends against seeing the movie, reflecting a negative evaluation.)
Sentence: it is directed by Steven Spielberg.
(This is No sentiment because it describes a factual matter with no evaluative component.)
Sentence: I saw it in the local theater with my best friend.
(This is No sentiment because it does not say anything about the movie.)
We further ask you to specify what snippets of text, in the sentence, you think acts as supporting evidence for your chosen label. The sentence will be shown to you as illustrated below, and your task is to mark (by clicking on them) all the words you think shows evidence for the sentiment label you chose.
Be aware that some sentences might be too long to fit on your screen. In that case you have to scroll in order to see all the words that can be marked as evidence.
Click the forward button below when you are ready to start the task.
Instructions
(Please read these instructions carefully.)
You will be shown 10 multiple-choice questions. All questions and their answer-options have been created by other crowdworkers, who where instructed to create questions that can be fairly easily answered by humans without context, by the use of common-sense knowledge.
Your task is to firstly select the answer you think is most correct and sensible. We call this the label of the question. Secondly, we ask you to mark relevant words in the question that justifies your choice. Specifically, for each word in the question, if you think that removing it will decrease your confidence toward your chosen label, you should mark it.
In the image below, you see an example of how the task will be presented to you. To the question "Where do you find the most amount of leafs?", the option "Forest" is selected as the correct answer and four words have been marked as justification.
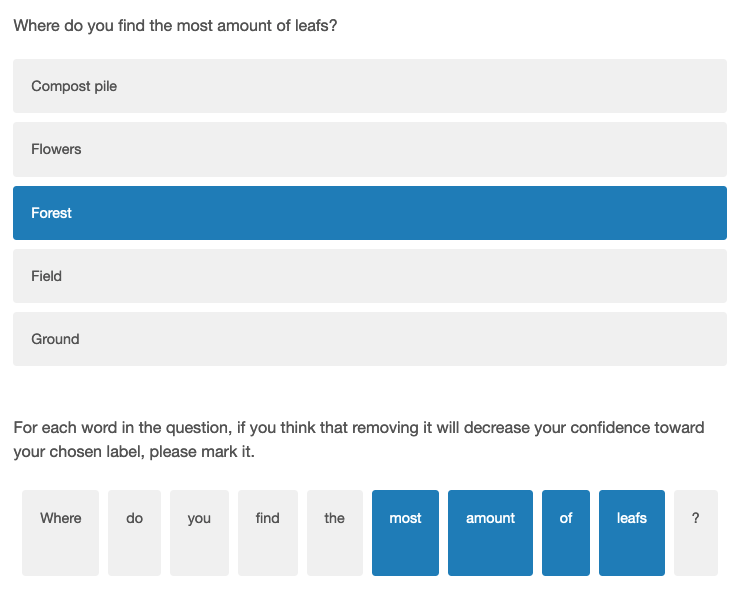
When marking words, be aware that some questions might be longer and not fit perfectly on your screen. In that case you have to scroll in order to see all the words that can be marked. Also, the texts may have misspellings, typos and wrongly put spaces before punctuation – pay no attention to this.
Click the forward button below when you are ready to start the task.
Appendix B Annotations Overview
Table 4 gives further information on the distribution of annotators, across groups and datasets, as well as ratios of rationale lengths to input lengths. Table 3 shows the number of instances in the data subsets, we work with, and the number of instances where all our annotator groups agreed on the label and that are therefore used for rationale-agreement analyses.
| Dataset | BO | BY | LO | LY | WO | WY | Total/Avg. | |
| DynaSent | Annot. | 51 | 56 | 61 | 73 | 54 | 51 | 346 |
| Annot.∗ | 48 (58%F) | 48 (67%F) | 48 (44%F) | 48 (40%F) | 48 (56%F) | 48 (48%F) | 288 | |
| RLR | 33.7 | 32.5 | 31.5 | 29.8 | 34.7 | 29.1 | 31.9 | |
| SST | Annot. | 28 | 27 | 53 | 43 | 27 | 29 | 207 |
| Annot.∗ | 26 (69%F) | 26 (58%F) | 26 (38%F) | 26 (31%F) | 26 (38%F) | 26 (69%F) | 156 | |
| RLR | 32.1 | 25.1 | 30.7 | 27.8 | 29.1 | 32.7 | 29.6 | |
| CoS-E | Annot. | 52 | 56 | 74 | 85 | 54 | 55 | 376 |
| Annot.∗ | 50 (60%F) | 50 (60%F) | 50 (40%F) | 50 (48%F) | 50 (48%F) | 50 (40%F) | 300 | |
| RLR | 31.9 | 32.9 | 34.1 | 32.2 | 33.3 | 33.6 | 33.0 |
Appendix C Supplementary Figures
For completeness, we provide supplementary figures for all the metrics and datasets analyzed in the paper.
C.1 Label Agreement
Heatmaps in Figure 11 show the level of group-group label agreement across datasets. Similar to what is shown in Figure 4, BY consistently exhibit lower level of agreement.
Box-plots in Figure 12 represent group-model label agreement. Each dot represents the F1-score of each model. While for Cos-E the models generally exhibit lower variability across groups, the level of agreement is also lower (as shown in Figure 3).
C.2 Rationale Alignment
Figure 13 is the extended version of Figure 5, showing the group-model rationale agreement for each dataset, each explainability method and with two metrics for measuring agreement, and .
The bar charts in Figure 14 shows, per model and dataset, the distance between the group with the lowest and highest agreement with the model (by ), which we refer to as the “min-max gaps” in section 5.2. We include this plot because it serves to better illustrate the gaps themselves, and how they are uncorrelated with model size, compared to what Figure 6 in the paper can convey.